

Agronomic and Economic Evaluations of N Fertilization in Maize under Recent Market Dynamics

North Central Soil Conservation Research Laboratory, USDA-ARS, 803 Iowa Ave., Morris, MN 56267, USA
*
Author to whom correspondence should be addressed.
Nitrogen 2022, 3(3), 514-527; https://doi.org/10.3390/nitrogen3030033
Submission received: 17 June 2022
/
Revised: 29 July 2022
/
Accepted: 23 August 2022
/
Published: 1 September 2022
(This article belongs to the Special Issue Soil Nitrogen Supply: Linking Plant Available N to Ecosystems Functions and Productivity II)
Abstract
:An online calculator is available to determine economic optimum nitrogen rate (EONR) for maize (Zea mays L.) production in the USA Corn Belt. For Minnesota, this calculator considers nitrogen (N) fertilizer cost, maize grain price and crop history, and produces a statewide N rate based on maximum economic return to N (MRTN). However, a clear precipitation and temperature gradient, and soil heterogeneity across the state, and recent changes in fertilizer cost and maize grain price require the comparison of EONR from this calculator with results from field study. The objectives of this research were to determine the agronomic and economic benefits of basal and split application of N fertilizer on maize grain yield and yield components and compare EONR from field study with N recommendation from the online calculator. The nitrogen fertilizer rate for the field study ranged from 0 to 224 kg N ha−1, either split or all applied at planting. The results showed that there were no interaction effects of N rate by time or N rate by year on maize grain yield. Maize grain yield had a quadratic response to N rate, and agronomic maximum grain yield peaked at 205 kg N ha−1. The EONR from the field study was 168 kg N ha−1 and it remained stable under a wide range of economic analysis scenarios with net benefit reaching up to 2474 USD ha−1. The N rate from the online calculator at MRTN was 151 kg N ha−1 and this rate may cause N deficiency in maize resulting in a yield penalty compared with the field study results. The field study was performed under specific soil and climatic conditions. Therefore, extensive research under various soil types, agronomic management practices and climatic conditions is warranted to evaluate the online calculator performance and its reliability as a precision tool for N fertilizer management in maize production.
1. Introduction
Nitrogen is one of the major nutrients limiting crop production worldwide and synthetic N fertilizer is used to increase food, feed, fiber and recently biofuel production. For instance, the use of N fertilizer accounted a 26% yield increase for six major crops in the USA [1] and the use of N fertilizer increased from 2.2 kg N ha−1 yr−1 in 1940 to 89.7 kg N ha−1 yr−1 in 2015 [2]. Maize grain production increased from 1472.4 MT in 1964 to 5446.7 MT in 2018 [3] and N fertilizer use has significant credit to this increase. The contribution of N fertilizer for food production is substantial, and without N fertilizer use, global food production may only support less than half of the current human population [4,5]. Although the use of N fertilizer is economically attractive, its negative impacts to the environment are receiving more attention [5]. These negative impacts are mainly due to the limited synchronization of N fertilizer application rate and/or timing with growing crop N demand. This discrepancy can cause N application to be either above or below plant needs. For instance, N fertilizer is applied in excess of crop N demand around the upper Mississippi River Basin, causing water pollution in the Gulf of Mexico [6]. In addition, economic losses of applied N fertilizer are significant and worldwide annual applied N fertilizer loss is estimated to be 15.9 billion USD [7]. The need to use N fertilizer to boost yield on the one hand and its negative impact to the environment and substantial economic losses on the other hand requires frequent improvement in N fertilizer recommendations.
The efforts to synchronize N application rate with maize N demand has been an ongoing research topic for decades. In 2020, maize was harvested from more than 3.03 million ha in Minnesota and was worth 6.483 billion USD [8], and thus receives a significant proportion of N fertilizer each year. Because of the vast acreage of maize grown, even small improvements in N fertilizer use can have meaningful economic and environmental impacts. Several methods have been developed to determine EONR for maize production in the Corn Belt. However, a recent review showed that no-tool was universally reliable over diverse growing environments and suggested the development of additional tools to better estimate N inputs and crop utilization [9].
The current N fertilizer guide for most maize growers in Minnesota is mainly based on an online calculator available at http://cnrc.agron.iastate.edu/ (accessed on 12 January 2022) [10,11]. This calculator considers crop rotation, N fertilizer cost and maize grain price, and estimates the same N rate for the entire Minnesota. However, this N rate may not be applicable for the whole state due to differences in agronomic practices, soil types and climatic variabilities across the state. For instance, agronomic practices that remove maize stover decreased EONR compared with stover retained [12]. This is because stover removal can increase soil temperature during early growing period, which can increase microbial activities, thus releasing N from organic matter through mineralization. This may help to reduce the N fertilizer needed for maize production. Additionally, soil management practices can affect N fertilizer application for maize production. For instance, applying all N at planting lowered EONR compared with split application under drained soil, but this was reversed for undrained soil, suggesting that drainage conditions should be incorporated into N management guidelines [13]. Farmers in Minnesota grow maize hybrids that vary in maturity date (early vs. late maturing). These hybrids may require different N rates due to differences in yield potential. Recent study showed that even the same maize hybrid (86 maturity date) grown at different locations in Minnesota produced substantially different grain yields (10 Mg ha−1 at Morris, MN but 17 Mg ha−1 at Rosemount, MN; Yesuf Mohammed, unpublished data), suggesting that location needs to be considered for optimizing N application. Maize hybrids can be grouped into low, intermediate and high in their response to applied N fertilizer [14], which, in part, is due to genotype differences in grain kernel number, which could lead to difference in yield and thus N requirements [15]. Soil parent material in Minnesota varied thus affecting soil texture, and maize grain yield to N fertilizer application depends on soil textural class [16]. A study in Minnesota showed that the EONR required for maize varies spatially due to variation in soil characteristics and temporally due to the interactions of environmental factors [17]. Similar N rate, N fertilizer application time is important.
Nitrogen fertilizer application time for maize production studies have been reported extensively in literature. The general agreement is to split N rate to synchronize N supply with growing plants’ N demand [18]. However, a significant number of growers still apply all N either in autumn or at planting. For instance, about 59% of farmers in Minnesota applied all N before planting, while 33% of them applied all N in autumn, and only 9% side-dressed the majority of their N after maize emergence [19]. Research from Texas showed a 30% maize grain yield decrease when N fertilizer was applied in autumn compared with spring [20]. Apparent N recovery is an important parameter that indicates the proportion of applied N that contributed to produce biomass. Research results showed that this recovery was affected by N fertilizer application time and apparent N recovery was 87% for spring application compared with 45% autumn application [18]. Although there is a general consensus about split application of N fertilizer as the best management practices for maize production in Minnesota [21], the online calculator does not give information regarding when to apply N fertilizer.
Recently, N fertilizer cost and maize grain price showed significant changes locally and globally. For instance, the price of maize increased from 148 USD per Mg in 2020 to 220 USD per Mg in 2022 [22]. The increase in N fertilizer cost was substantial and the cost of urea (46% N) fertilizer increased from 395 USD per Mg in 2020 to 976 USD per Mg in 2022 [23]. These recent market dynamics, together with the myriad of factors previously mentioned, may affect the net benefits of N fertilizer use for maize production based on the online calculator, necessitating its re-evaluation. Validating the online calculator with results from field study can help to increase confidence in using the online calculator as a tool for N rate recommendation. This will help to avoid over- or underapplication to enhance economic benefits and minimize unintended negative environmental consequences from N fertilizer use. Revisiting fertilizer recommendation is a common practice to increase economic return on investment and decrease negative environmental impacts [10,24]. The objectives of this research were to determine the agronomic and economic benefits of basal and split application of N fertilizer rates on maize grain yield and yield components and compare EONR from field study with N recommendation from the online calculator.
2. Materials and Methods
2.1. Site Description
The experiment was carried out in 2019 and 2020 at the Swan Lake Research Farm, located at 45°41′ N, 95°48′ W and 345 m a.s.l. near Morris, MN, USA. The previous crops grown in the field were soybean (Glycine max (L.) Merr.) in 2018 and spring wheat (Triticum aestivum L.) in 2019. Based on the USDA-NRCS Web Soil Survey, the soil is a complex mix of Aazdahl (fine-loamy, mixed, superactive, frigid Aquic Hapludolls)–Formdale (fine-loamy, mixed, superactive, frigid Oxyaquic Hapludolls) and Balaton (fine-loamy, mixed, superactive, frigid Aquic Calciudolls) [25]. Monthly average air temperature and monthly total precipitation in 2019 and 2020, as well as long-term averages and growing degree days are shown in Table 1. Cumulative growing degree days were calculated with base and upper cutoffs of 10 °C and 30 °C, respectively. The weather data for the growing seasons were collected from an automated weather station located on the experimental site. A nearby weather station (about 13 km from the experimental site) located at the West Central Research and Outreach Center of University of Minnesota was used to obtain the long-term averages (LTA) for the recent 30 years.
2.2. Soil Sampling and Testing
Each year, soil samples were taken before fertilizer application and maize seeding using a Giddings hydraulic (Windsor, CO, USA) truck mounted probe (inner diameter of 5.08 cm) to determine initial soil properties. The initial soil samples were composites of four samples per replication and the soil cores were taken from 0–15, 15–30 and 30–60 cm soil depth. Soil bulk density were calculated after drying the soil at 105 °C to constant mass. Soil samples for chemical testing were air dried and ground to pass through a 2 mm sieve. Soil pH was measured using a pH electrode in a 1:2 soil to water ratio. An amount of 2 g of soil was mixed with 20 mL of 1 M KCl, shaken for 1 h and extracted through a Whatman no. 42 filter paper. The KCl extracted solution was analyzed for NH4+-N and NO3−-N using automated Cd reduction and salicylate methods on a continuous flow-injection analyzer (Lachat Quik Chem 8500, Hach Company, Loveland, CO, USA) [26]. Total soil carbon and N were determined using a dry combustion method with LECO CN828 (LECO Corporation, St. Joseph, MI, USA). Soil inorganic carbon in the sample was measured as described by Wagner et al. [27]. Soil organic carbon was calculated as the difference between total soil carbon and soil inorganic carbon. Available soil phosphorus was determined using Olsen P extractant [28]. Soil K, extracted with 1 N ammonium acetate, was determined with flame emission atomic absorption spectrophotometer [29].
2.3. Experimental Design, Treatments and Plot Management
The experimental design was a randomized complete block with four replicates. The plot size was 3.05 m by 7.62 m with 0.76 m row spacing with four rows per plot. Treatments were N fertilizer rates and application time. The N rates were 0, 56, 112, 168 and 224 kg N ha−1. These rates were either all applied at planting by hand broadcasting (basal) or half the rate was broadcasted at planting and the remaining half was top dressed (split-applied). The source of N fertilizer was urea (46% N) and about 45% of the farmers in Minnesota use urea as the source of N for maize production [19]. The soil was disked, and chisel ploughed in autumn with spring field cultivation. Phosphorus and potassium fertilizers were broadcasted at 70–30 kg P-K ha−1 from triple super phosphate and potassium chloride, respectively. The fertilizers applied at seeding were incorporated into the soil (5 cm deep) with a cultivator one day before seeding maize. The maize hybrid NK9227 (92 days maturity date) was seeded at 84,000 pure live seeds ha−1 on 13 May 2019 and on 30 April 2020 using a John Deere MaxEmerge plot planter model 1730 (John Deere, Moline, IL, USA). Glyphosate [N-(phosphonomethyl) glycine] at a 1.1 kg active ingredient ha−1 was sprayed on 2 July 2019 and 15 June 2020 to control weeds. For the split N treatments, N from urea was hand broadcasted (top-dressed) on 5 July 2019 and 19 June 2020.
2.4. Harvesting and Sample Processing
Six maize plants from the middle two rows were hand-harvested on 30 October 2019 and on 13 October 2020 for plant height, harvest index, ear size (length and diameter) and N content determination. These plants were cut close to the ground with handheld shears, and plant length as an estimate of plant height was measured in the field. Then, these samples were brought to the laboratory and dried at 65 °C until constant mass was achieved. The ears of these plants were shelled by hand, ear numbers counted, and ear length (tip to tip) and circumference (middle of the ear) were measured. Ear diameter was estimated by dividing the circumference by 3.14. Harvest index was calculated as a ratio of seed mass to total biomass after drying to a constant mass at 65 °C. On the same dates of six plant sample collection (mentioned above), the remaining plants in the middle two rows were harvested with plot combine model Hege 160 (Hege Company, Waldenburg, Germany), after trimming both sides of each plot to minimize border effects, for grain yield determination. Harvested plot length was measured for each plot and multiplied by two row widths to calculate the net plot area. Maize grain moisture was determined with a GAC 2100 grain moisture tester (Dickey-john Corporation, Auburn, IL, USA) using samples from a combine harvest, then grain yield was adjusted to 155 g kg−1 moisture content before statistical analysis. Maize grain samples were ground and nitrogen concentration in the grain was determined by combustion with LECO CN828 (LECO Corporation, St. Joseph, MI, USA). Maize crude protein content was calculated by multiplying percent N in the grain with 5.68 [30]. Agronomic N use efficiency (ANUE) and partial factor productivity (PFP) were calculated as described by Baligar et al. [31] and Wortmann et al. [32] as shown in Equations (1) and (2).
where ANUE, PFP, GYF, GYC and NF represent agronomic N use efficiency, partial factor productivity, maize grain yield from fertilized plot, maize grain yield from control (no-N fertilizer added) plot and nitrogen fertilizer application rate, respectively.
ANUE = (GYF − GYC)/(NF)
PFP = (GYF/NF)
2.5. Statistical Analysis
Data analysis was performed using SAS Ver. 9.4 (SAS Institute Inc., Carly, NC, USA) [33]. Data distribution for normality and homogeneity of variance were tested using PROC UNIVARIATE and Levene tests [34], respectively. These test results showed further analyses were warranted without the need for data transformation. The Proc GLM in SAS was used for the analysis of variance (ANOVA). The results showed that year by N rate; year by N application time and N rate by N application time; or year by N rate by N application time were not significant on maize grain yield. Then, a trend analysis was performed in SAS for N rate, data combined over years and N application time. When ANOVA showed treatment effects (p ≤ 0.05), the LSD was used at α = 0.05 to separate treatment means. The PROC CORRs in SAS was used to evaluate the association among different response variables, and these results were stated as significant when p < 0.05. Microsoft Excel was used to make graphs (Figure 1 and Figure 2) using average values from SAS results. This practice was used in a previous publication [35].
2.6. Economic Analysis
The interactions of year with N rate or time of application were not statistically significant on maize grain yield. In addition, application time and its interaction with N rate had no significant effect on maize grain yield. Therefore, economic analysis following a partial budget procedure [36] was performed for N rates averaged over years and application times to determine EONR. By its nature, this procedure considers only major difference between management systems and did not take all costs and benefits into account. Therefore, only the cost of N fertilizer and price of maize grain were considered. The cost of 1.0 kg N fertilizer was 2.219 USD (1.005 USD per lb N) [23] and maize grain price was 0.242 USD per kg grain (6.130 USD per bushel maize grain) [8].
The average grain yield was adjusted down by 10% (as recommended by this economic analysis procedure) for each treatment to accommodate agronomic management difference between small and large plots. Input and output prices usually fluctuate, making it difficult for economic analysis. Therefore, sensitivity analysis was performed under three scenarios to accommodate possible market dynamics and to see the effects of input and output price changes on the stability of N fertilizer rate as EONR. These scenarios were: (1) increase cost of N fertilizer by 10% but fixed maize grain price, (2) increase maize grain price by 10% with fixed N fertilizer cost and (3) increase N fertilizer cost by 10% and decrease maize grain price by 10% (worst case scenario from growers’ perspective). Dominance analysis was performed to remove dominated treatments from further analysis. Marginal rate of return (MRR) was calculated for non-dominated treatments. A minimum acceptable rate of return (MARR) of 50% was preset as a criterion for return on investment. The net benefits shown in the economic analysis following partial budget analysis procedure are not the same as profit because the partial budget procedure does not include all production costs and benefits.
To compare results from the partial budget with the online calculator, the EONR based on MRTN [37] from the online calculator was considered. In brief, the online calculator is targeted to local producers, and it uses a price ratio concept, which is the ratio of N fertilizer cost (in USD per pound of N fertilizer) to the price of maize (in USD per bushel of maize) to determine the EONR based on MRTN. Accordingly, this price ratio calculation produces a current price ratio scenario of 0.163 ((1.005 USD lb N−1)/(6.130 USD bu−1 maize grain)) based on N fertilizer cost and maize grain price. Finally, the EONR from the partial budget analysis that was determined from field study was compared with EONR from online calculator based on MRTN.
3. Results and Discussion
3.1. Weather
The difference in average air temperature between the two growing seasons from April to September (maize growing season in the surrounding area) was minimal (16.0 °C in 2019 vs. 16.6 °C in 2020) (Table 1). However, the mean air temperature between May and August in 2020 was greater than 2019 (19.9 °C vs. 18.3 °C). The annul precipitation in 2019 and 2020 were 32% above and 27% below the long-term average (LTA), respectively. Annual precipitation varied significantly between the two growing seasons (884 mm in 2019 vs. 490 mm in 2020). Although the annual precipitation in 2020 was lower than in 2019, the total rainfall received in June and July in 2020 was 17% greater than in 2019. At this study site, maize grows rapidly in June and July thus the greater precipitation received in these months might have contributed for greater biomass accumulation in 2020 than in 2019. Moreover, the cumulative GDD between May and September in 2020 was 9% greater than in 2019. These variations in precipitation, air temperature and GDD between the two growing seasons may partly explain maize grain yield difference between years (2019 vs. 2020).
3.2. Initial Soil Properties
The soil pH is close to neutral but increased with soil depth (Table 2). However, soil organic carbon, total N, mineral nitrogen (NH4+-N + NO3−-N), phosphorus and potassium decreased with soil depth. The soil carbon and total N in the profile were greater in 2019 than in 2020. In both years, the ratio of soil organic carbon to total N was less than 13 in the different soil depths indicating potential N release through mineralization. The NH4+-N was greater than NO3−-N in the respective soil depths in both years. The NO3−-N in the 0–30 cm soil depth was greater in 2019 than in 2020. Similarly, total mineral N (NH4+-N + NO3−-N) in the top 60 cm soil depth in 2019 was greater than in 2020. Although there was greater mineral N in 2019 than in 2020, the mean grain yield in 2020 was greater than in 2019, and there was no year by N rate interaction on maize grain yield probably indicating that some of this initial available N might have been lost via leaching and or denitrification before plant uptake. Available soil phosphorus and potassium were similar in both growing seasons. Soil bulk density was almost the same in both years and averaged 1.24, 1.40 and 1.50 Mg m−3 in the 0–15, 15–30 and 30–60 cm soil depths, respectively.
3.3. Agronomic Evalauion on Maize Yield and Yield Components
3.3.1. Interaction Effects
The interactions of year, N rate and application time on grain yield, yield components and grain qualities were not significant, but year by application time was significant for plant height and ear length (Table 3). In 2019, maize plants were taller when all N rate was applied at planting than split application (242 ± 1.8 cm vs. 234 ± 1.9 cm), but the result was statistically the same in 2020 (248 ± 1.8 cm for basal vs. 251 ± 1.3 cm for split). A similar trend was observed for ear length, but the difference was very small (less than 0.7 cm). In 2019, maize was grown following soybean, but in 2020 it was planted following spring wheat. However, there was no year by N rate or year by N timing interaction effects on maize grain yield (Table 3). Therefore, maize grain data were combined over years for analysis. Because previous crops varied by year, the absence of year by N rate interaction on maize grain yield indicates little if any N credit from the previous soybean crop. Another possible explanation is that N release through mineralization following spring wheat harvest may have been the same as the potential N credit from the soybean.
3.3.2. Year Effect
Maize grain yield, protein concentration, test weight and plant height varied between years (Table 3). The two-year average grain yield was 11.9 Mg ha−1, which is comparable to previous yield result (12.0 Mg ha−1) from the same location but a different study [38]. The average grain yield was 28% greater in 2020 than in 2019. Similarly, average grain protein concentration, test weight and plant height were greater in 2020 than in 2019. The total rainfall in June and July in 2020 was greater than in 2019. Similarly, the cumulative GDD from June to August in 2020 was greater than in 2019. Maize is a warm season crop, and these differences in heat accumulation and rainfall distribution during maize rapid growing period (June and July) may partly elucidate the differences in yield and yield components between years. Year to year variation in maize grain yield is common [39]. According to Dhital and Raun [40], year to year differences in grain yield may lead to differences in optimum N application rate due to unpredictable changes in the environment but this conclusion is not in agreement with our findings probably due to differences in organic matter and climatic variations between these sites. The previous crops were soybean in 2019 but spring wheat in 2020. However, this study showed that the interaction between year and N application rate was not significant for maize yield which, indirectly may indicate the possibility to use the same N rate at this location regardless of the precursor crop type.
3.3.3. Nitrogen Application Rate
Nitrogen application rate significantly increased grain yield, protein concentration, thousand kernel weight (TKW), plant height and ear size (length and diameter) (Table 3). Maize grain yield, ear length and ear diameter had quadratic responses to N application rate. However, grain protein concentration, thousand seed weight and plant height increased linearly with N rate. Test weight and harvest index did not respond to N fertilization. The average grain yield ranged from 7.7 Mg ha−1 for the control (0 N) to 11.9 Mg ha−1 at 168 kg N ha−1 then declined to 11.7 Mg ha−1 at 224 kg N ha−1 when data combined over years and N application time (Figure 1). Using the quadratic equation, grain yield peaked at 205 kg N ha−1, and maize yield increase with quadratic trend due to N fertilization is common in the U.S. Midwest [35]. Grain protein concentration increased linearly and ranged from 72 g kg−1 to 90 g kg−1 with a slope of 0.0824 (Figure 1). The TKW increased with N rates linearly with a slope of 0.2184 and ranged from 298 g to 343 g (Table 4). Previous studies showed that maize TKW increased with increasing N fertilizer application rate [16,41] and our results agreed with these findings. According to previous research [16], TKW is a contributing factor for yield potential. Similar to TKW, maize plant height increased linearly with N rate with a slope of 0.0675. Ear length and diameter had quadratic and linear response to N fertilizer application rate, respectively. From our observation, individual ears were full of seed on the entire ear length when fertilized. Conversely, ears were short and twisted with missing grains at the end of the ear when N was not applied. The absence of kernels in part of the ear in the unfertilized treatment may be due to abortion of pollinated ovaries caused by N deficiency before reaching physiological maturity [42]. Previous research showed that 72% of the variation in kernel number in maize is associated with N availability in the soil [42]. A bigger ear size filled with kernels often translates to more grain yield because increased kernel number per plant increases grain yield [43]. Recent study also showed that traits associated with yield improvement in maize include increased kernel number per ear and increased kernel mass [44]. Therefore, the increase in grain yield with increasing N fertilizer rate is due to the combined effects of increased ear size (length and diameter), kernel number and TKW.
Agronomic N use efficiency (ANUE) decreased linearly with a slope of −0.092 with increasing N application rate and ranged from 33.9 to 17.8 (Figure 2). Similarly, N use efficiency based on partial factor productivity (PFP) decreased with increasing N rate but with a quadratic trend and ranged from 172 to 52. The ANUE values in this study are within the range of previous results [32] but are greater than results reported by Geng et al. [45], which may indicate the possibility of improving ANUE. Increased ANUE in plants is needed to enhance the yield and quality of crops, reduce nutrient input cost, and improve soil, water, and air quality [31] in light of the awareness of environmental consequences associated with N fertilizer overuse. According to Plastina [46] and Zeffa et al. [47], N fertilizers account for 15 to 20% of the production costs of maize, and a little improvement in ANUE may lead to significant reduction in production costs. Gallais and Hirel [15] showed the presence of genetic variation in N use efficiencies among maize genotypes, which may also help reduce fertilizer input costs and minimize potential negative environmental impacts. This may suggest evaluating N application rate for various maize hybrids.
Increased N use efficiency is needed both from economic and environmental perspectives. Identifying and improving nutrient absorbing, transporting, and utilizing traits to enhance nutrient use efficiency [31] coupled with the use of best agronomic practices will contribute to increased nutrient use efficiency. Recently, enhanced efficient N fertilizers have become more available but their advantages varied and depend on the weather (increased response in wet environments) and soil types (more responsive for sandy soils). For instance, the use of controlled released urea increased maize yield to the extent of 11%, increased ANUE and reduced N leaching compared with applying urea alone [45]. Polymer-coated urea provided potential economic advantages in maize production with greater N use efficiency than urea [48]. Collectively, all these studies show the possibility to improve N use efficiency with different and alternative agronomic practices.
3.3.4. Nitrogen Application Time
Nitrogen fertilizer application time had no effect on maize grain yield. It seems that maize growers in Minnesota are aware of this fact because this agrees with the survey results that showed 59% of maize growers in this state apply N at the time of maize seeding and only 9% side-dressed [19]. Previous metanalysis indicated that the timing of N application was not associated with a quantifiable change in maize yield [49]. A recent study in Illinois showed that split application of N is unlikely to be profitable in productive Corn Belt soils [50]. The benefits of split application could depend largely on prevailing weather conditions and soil texture. For instance, split application could be more practical in coarse textured soil to minimize N losses through nitrate leaching. Split application was found to be useful in undrained soil too [13]. Our results showed that split application increased harvest index slightly (65%) compared with basal application (63%) (Table 3), which implies split application tends to contribute more to grain production than basal application. However, this was not supported with a corresponding increase in grain yield because mean grain yields for basal and spilt application were statistically the same. The absence of grain yield difference due to application time support previous findings [50]. However, another practical point to consider split application is to minimize risks associated with N fertilizer cost in case of crop failure at early growth stage. In other words, the remaining N fertilizer left for top dressing can be saved for the next crop season if there is early crop failure due to various reasons, including weather (too dry or too wet).
3.3.5. Correlation
The correlation analysis result showed that grain yield was positively and significantly (p < 0.05) correlated with plant height (r = 0.75), test weight (r = 0.63), TKW (r = 0.63), ear length (r = 0.55) and ear diameter (r = 0.42). Increased plant height means more biomass thus greater photosynthesis compared with shorter plants. This could lead to greater accumulation of carbon, which can produce more yield. Increased grain test weight is an indicator of plump grain. Larger grains are the results of greater starch accumulation in the seed due to increased translocation of sugar from the source to the sink, thus contributing to grain yield increase [51]. This agrees with our result that showed positive correlation of TKW with grain yield. Larger ear size may lead to greater yield due to increased number of seed per ear [43]. These positive correlation results from our study indicate that any attempt to improve one of these parameters may lead to significant increase in grain yield.
3.4. Economic Evaluation
The net benefits of N fertilizer application rate ranged from 1778 USD ha−1 to 2474 USD ha−1 with MRR ranged from 45% to 297% under different scenarios (Table 5). The sensitivity analysis results showed that 168 kg N ha−1 had greater net benefits with MRR greater than MARR (>50%), except under Scenario 3 (the worst-case scenario). This indicates that if maize price and fertilizer N cost remain at the 0.16 price ratio, the use of 168 kg N ha−1 produces more net economic benefits than other N rates. In the worst-case scenario, the MRR was 45%, which is less than the preset MARR (50%). However, this 5% difference (50% vs. 45%) between MRR and MARR, might influence some growers to base their N application on lower MRR (45% in this case). A sensitivity analysis results showed that the use of 168 kg N ha−1 for maize production remained a stable N rate under different market dynamics and can be considered as an EONR for maize production at this site and similar locations. A previous survey showed that Minnesota statewide average N fertilizer rate for maize was 157 kg N ha−1 [19] and this rate is very close to the EONR from our field study.
The online calculator estimated acceptable N rates ranged from 140 kg N ha−1 to 159 kg N ha−1 with MRTN rate achieved at 151 kg N ha−1 under soybean–maize rotation. The net returns to N at MRTN rate were 739 USD ha−1 under soybean–maize cropping sequence. The online calculator estimated less N rate (by 17 kg N ha−1) at MRTN compared with the EONR from field study. The online calculator is based on state (region), crop rotation, N fertilizer cost and grain price only, and did not take specific soil and climatic condition into account. From an agronomic point of view, the difference in EONR from this field study and the online calculator is very small. However, the use of N rate based on the calculator may result in N deficiency and consequently may decrease net benefits. Thus, adjustments to the online calculator are warranted to avoid yield gap and maximize net benefits. Incorporating factors, such as soil (texture, organic matter, drainage), weather (precipitation and temperature gradient), maize hybrid (early vs. late maturing) and their possible interactions into the calculator algorithm may improve N fertilizer rate prescription for maize production. According to Puntel et al. [52], incorporation of dynamic (change rapidly with time, e.g., soil water) and static (change slowly with time, e.g., soil organic matter) variables into a model showed that EONR was 50% greater than the conventionally used technique. The use of optimum N rate in maize production not only increases yield and income for growers but also contributes to provide food, feed and fuel for the world. Recent review indicated that N recommendations need improvement for economic and environmental reasons [10]. Therefore, finding adjustment factors (that can reflect the above-mentioned relevant factors) to refine the online calculator algorithms is warranted to avoid N deficiency in maize growth which may result in yield penalty.
4. Conclusions
Maize grain yields respond to N fertilizer application rate with a quadratic trend and agronomic maximum yield was achieved at 205 kg N ha−1. The EONR was 168 kg N ha−1 from the field study, and this N rate remained stable under various sensitivity analysis scenarios except in the worst-case (when price of grain reduced but N fertilizer cost increased). The net benefits varied by scenario and ranged from 1778 USD ha−1 to 2474 USD ha−1. The EONR based on the online calculator was 151 kg N ha−1. The EONR from the field study result was greater than the N rate recommended using the online calculator. The low N rate from the online calculator may cause N deficiency, thus resulting in yield penalty. Although the online calculator is user friendly, it needs some refining to minimize yield losses due to N deficiency. This research was performed under specific soil and climatic conditions. Therefore, more extensive research is warranted on various soil types, cropping systems and climatic conditions in the state of Minnesota, which will contribute to increasing the reliability of the online calculator as a precision tool for N fertilizer management in maize production. An improved tool that can estimate N rate better could help to minimize yield penalty due to N deficiency, maximize net economic benefits and increase food and raw material for biofuel production.
Author Contributions
Y.A.M.: Conceptualization, data curation, formal analysis, investigation, methodology, visualization, writing—original draft, writing—review and editing. R.W.G.: Investigation, project administration, supervision, visualization, writing—review and editing. J.M.F.J.: Conceptualization, visualization, writing—review and editing. S.W.W.: Data curation, visualization, writing—review and editing. All authors have read and agreed to the published version of the manuscript.
Funding
This research was funded by USDA-ARS projects 5060-21220-007-000d and 5060-11610-004-000d, no additional external funding was received.
Institutional Review Board Statement
This study did not require ethical approval.
Informed Consent Statement
Not applicable (not involving human in the study).
Data Availability Statement
Data are available upon reasonable request from the authors.
Acknowledgments
The authors would like to thank Joe Boots, Jim Eklund, Chuck Hennen, Scott Larson, Mike Jorgenson, and Jay Hanson for their help in field plot management, data collection, sample processing, and testing in the lab. This research was supported by the U.S. Department of Agriculture, Agricultural Research Service. The findings and conclusions in this publication are those of the authors and should not be construed to represent any official USDA or U.S. Government determination or policy. Mention of trade names or commercial products in this publication is solely for the purpose of providing specific information and does not imply recommendation or endorsement by the U.S. Department of Agriculture. USDA is an equal opportunity provider and employer.
Conflicts of Interest
The authors declare no conflict of interest.
Abbreviations
Agronomic nitrogen use efficiency (ANUE); economic optimum nitrogen rate (EONR); minimum acceptable rate of return (MARR); marginal rate of return (MRR); maximum return to nitrogen (MRTN); nitrogen (N); PFP (partial factor productivity).
References
- Stewart, W.; Dibb, D.; Johnston, A.; Smyth, T. The contribution of commercial fertilizer nutrients to food production. Agrono. J. 2005, 97, 1–6. [Google Scholar] [CrossRef]
- Cao, P.; Lu, C.; Yu, Z. Historical nitrogen fertilizer use in agricultural ecosystems of the contiguous United States during 1850–2015: Application rate, timing, and fertilizer types. Earth Syst. Sci. Data 2018, 10, 969–984. [Google Scholar] [CrossRef]
- USDA-NASS. Quick Stats. Available online: https://quickstats.nass.usda.gov (accessed on 25 February 2022).
- Connor, D. Organic agriculture cannot feed the world. Field Crop Res. 2008, 106, 187–190. [Google Scholar] [CrossRef]
- Mitsch, W.J.; Day, J.W.; Gilliam, J.W.; Groffman, P.M.; Hey, D.L.; Randall, G.W.; Wang, N. Reducing nitrogen loading to the Gulf of Mexico from the Mississippi River Basin: Strategies to counter a persistent ecological problem: Ecotechnology—The use of natural ecosystems to solve environmental problems—Should be a part of efforts to shrink the zone of hypoxia in the Gulf of Mexico. BioScience 2001, 51, 373–388. [Google Scholar] [CrossRef]
- Blesh, J.; Drinkwater, L. The impact of nitrogen source and crop rotation on nitrogen mass balances in the Mississippi River Basin. Ecol. Appl. 2013, 23, 1017–1035. [Google Scholar] [CrossRef] [PubMed]
- Raun, W.R.; Johnson, G.V. Improving nitrogen use efficiency for cereal production. Agrono. J. 1999, 91, 357–363. [Google Scholar] [CrossRef]
- USDA-NASS. Minnesota Ag News—Monthly Prices. Available online: http://www.nass.usda.gov (accessed on 20 March 2022).
- Ransom, C.J.; Kitchen, N.R.; Camberato, J.J.; Carter, P.R.; Ferguson, R.B.; Fernández, F.G.; Franzen, D.W.; Laboski, C.A.; Nafziger, E.D.; Sawyer, J.E. Corn nitrogen rate recommendation tools’ performance across eight US Midwest Corn Belt States. Agrono. J. 2020, 112, 470–492. [Google Scholar] [CrossRef]
- Morris, T.F.; Murrell, T.S.; Beegle, D.B.; Camberato, J.J.; Ferguson, R.B.; Grove, J.; Ketterings, Q.; Kyveryga, P.M.; Laboski, C.A.; McGrath, J.M. Strengths and limitations of nitrogen rate recommendations for corn and opportunities for improvement. Agrono. J. 2018, 110, 1–37. [Google Scholar] [CrossRef]
- Kaiser, D.E.; Coulter, J.A.; Barber, B. Fertilizing Corn in Minnesota. Regents of the University of Minnesota. Available online: https://extension.umn.edu/crop-specific-needs/fertilizing-corn-minnesota (accessed on 8 April 2022).
- Sindelar, A.; Coulter, J.A.; Lamb, J.; Vetsch, J. Agronomic responses of continuous corn to stover, tillage, and nitrogen management. Agrono. J. 2013, 105, 1498–1506. [Google Scholar] [CrossRef]
- Dias Paiao, G.; Fernández, F.G.; Naeve, S.L. Drainage conditions influence corn-nitrogen management in the US Upper Midwest. Agronomy 2021, 11, 2491. [Google Scholar] [CrossRef]
- Tsai, C.Y.; Dweikat, I.; Huber, D.; Warren, H. Interrelationship of nitrogen nutrition with maize (Zea mays) grain yield, nitrogen use efficiency and grain quality. J. Sci. Food Agric. 1992, 58, 1–8. [Google Scholar] [CrossRef]
- Gallais, A.; Hirel, B. An approach to the genetics of nitrogen use efficiency in maize. J. Exp. Bot. 2004, 55, 295–306. [Google Scholar] [CrossRef] [PubMed]
- Cambouris, A.N.; Ziadi, N.; Perron, I.; Alotaibi, K.D.; Luce, M.S.; Tremblay, N. Corn yield components response to nitrogen fertilizer as a function of soil texture. Can. J. Soil Sci. 2016, 96, 386–399. [Google Scholar] [CrossRef]
- Mamo, M.; Malzer, G.L.; Mulla, D.; Huggins, D.; Strock, J. Spatial and temporal variation in economically optimum nitrogen rate for corn. Agrono. J. 2003, 95, 958–964. [Google Scholar] [CrossRef]
- Vetsch, J.A.; Randall, G.W. Corn production as affected by nitrogen application timing and tillage. Agrono. J. 2004, 96, 502–509. [Google Scholar] [CrossRef]
- Bierman, P.M.; Rosen, C.J.; Venterea, R.T.; Lamb, J.A. Survey of nitrogen fertilizer use on corn in Minnesota. Agr. Syst. 2012, 109, 43–52. [Google Scholar] [CrossRef]
- Torbert, H.A.; Potter, K.N.; Morrison, J.E. Tillage system, fertilizer nitrogen rate, and timing effect on corn yields in the Texas Blackland Prairie. Agrono. J. 2001, 93, 1119–1124. [Google Scholar] [CrossRef]
- Randall, G.; Rehm, G.; Lamb, J.; Rosen, C.J. Best Management Practices for Nitrogen Use in South-Central Minnesota; University of Minnesota Extension: St Paul, MN, USA, 2008. [Google Scholar]
- FINBIN. Farm Financial and Production Benchmark Information in the World. Available online: http://www.finbin.umn.edu (accessed on 22 May 2022).
- MorrisCoop. MorrisCoop, Agronomy. Available online: http://www.morriscoop.com (accessed on 25 March 2022).
- Kuchenbuch, R.O.; Buczko, U. Re-visiting potassium-and phosphate-fertilizer responses in field experiments and soil-test interpretations by means of data mining. J. Plant Nutr. Soil Sci. 2011, 174, 171–185. [Google Scholar] [CrossRef]
- USDA-NRCS. Official Soil Series Descriptions and Series Classification. Available online: https://websoilsurvey.nrcs.usda.gov (accessed on 2 May 2022).
- APHA. Standard Methods for the Examination of Water and Wastewater, 18th ed.; American Public Health Association: Washington, DC, USA, 1992. [Google Scholar]
- Wagner, S.; Hanson, J.; Olness, A.; Voorhees, W. A volumetric inorganic carbon analysis system. Soil Sci. Soc. Am. J. 1998, 62, 690–693. [Google Scholar] [CrossRef]
- Kuo, S. Phosphorus. In Methods of Soil Analysis, Part 3, Chemical Methods; Sparks, D.L., Ed.; SSSA Book Series No 5; Soil Science Society of America and American Society of Agronomy: Madison, WI, USA, 1996; pp. 869–919. [Google Scholar]
- Helmke, P.A.; Sparks, D.L. Lithium, Sodium, Potassium, Rubidium, and Cesium; Bartels, J.M., Ed.; Soil Science Society of America and American Society of Agronomy: Madison, WI, USA, 1996; Volume 5, pp. 551–574. [Google Scholar]
- Sriperm, N.; Pesti, G.M.; Tillman, P.B. Evaluation of the fixed nitrogen-to-protein (N: P) conversion factor (6.25) versus ingredient specific N: P conversion factors in feedstuffs. J. Sci. Food Agric. 2011, 91, 1182–1186. [Google Scholar] [CrossRef]
- Baligar, V.; Fageria, N.; He, Z. Nutrient use efficiency in plants. Soil Sci. Plant Anal. 2001, 32, 921–950. [Google Scholar] [CrossRef]
- Wortmann, C.S.; Tarkalson, D.D.; Shapiro, C.A.; Dobermann, A.R.; Ferguson, R.B.; Hergert, G.W.; Walters, D. Nitrogen use efficiency of irrigated corn for three cropping systems in Nebraska. Agrono. J. 2011, 103, 76–84. [Google Scholar] [CrossRef]
- SAS Institute. SAS/STAT 9.4 User’s Guide; SAS Institute: Cary, NC, USA, 2014. [Google Scholar]
- Levene, H. Robust Tests for Equality of Variances. Contributions to Probability and Statistics; Olkin, I., Ed.; Stanford University Press: Redwood City, CA, USA, 1960. [Google Scholar]
- Johnson, J.M.; Scott, D.; Weyers, S. Radish and annual ryegrass alter corn yield response to nitrogen rate. Soil Sci. Soc. Am. J. 2021, 85, 2054–2066. [Google Scholar] [CrossRef]
- CIMMYT. From Agronomic Data to Farmer Recommendations: An Economics Training Manual, Completely Revised Edition; D.F. CIMMYT: Veracruz, Mexico, 1988. [Google Scholar]
- ISU. Iowa State University (ISU), Corn N Rate Calculator, Finding the Maximum Return to N and Most Profitable N Rate. A Regional (Corn Belt) Approach to Nitrogen Rate Guide; Agronomy Extension and Outreach; Iowa State University: Ames, IA, USA, 2022. [Google Scholar]
- Mohammed, Y.A.; Matthees, H.L.; Gesch, R.W.; Patel, S.; Forcella, F.; Aasand, K.; Steffl, N.; Johnson, B.L.; Wells, M.S.; Lenssen, A.W. Establishing winter annual cover crops by interseeding into maize and soybean. Agrono. J. 2020, 112, 719–732. [Google Scholar] [CrossRef]
- Alexander, J.R.; Baker, J.M.; Venterea, R.T.; Coulter, J.A. Kura clover living mulch reduces fertilizer N requirements and increases profitability of maize. Agronomy 2019, 9, 432. [Google Scholar] [CrossRef]
- Dhital, S.; Raun, W. Variability in optimum nitrogen rates for maize. Agrono. J. 2016, 108, 2165–2173. [Google Scholar] [CrossRef]
- Moser, S.B.; Feil, B.; Jampatong, S.; Stamp, P. Effects of pre-anthesis drought, nitrogen fertilizer rate, and variety on grain yield, yield components, and harvest index of tropical maize. Agr. Water Manag. 2006, 81, 41–58. [Google Scholar] [CrossRef]
- Andrade, F.H.; Echarte, L.; Rizzalli, R.; Della Maggiora, A.; Casanovas, M. Kernel number prediction in maize under nitrogen or water stress. Crop Sci. 2002, 42, 1173–1179. [Google Scholar] [CrossRef]
- Ciancio, N.; Parco, M.; Incognito, S.J.P.; Maddonni, G.A. Kernel setting at the apical and sub-apical ear of older and newer Argentinean maize hybrids. Field Crop Res. 2016, 191, 101–110. [Google Scholar] [CrossRef]
- DeBruin, J.L.; Schussler, J.R.; Mo, H.; Cooper, M. Grain yield and nitrogen accumulation in maize hybrids released during 1934 to 2013 in the US Midwest. Crop Sci. 2017, 57, 1431–1446. [Google Scholar] [CrossRef]
- Geng, J.; Chen, J.; Sun, Y.; Zheng, W.; Tian, X.; Yang, Y.; Li, C.; Zhang, M. Controlled release urea improved nitrogen use efficiency and yield of wheat and corn. Agrono. J. 2016, 108, 1666–1673. [Google Scholar] [CrossRef]
- Plastina, A. Estimated Costs of Crop Production in Iowa, Iowa State University. Available online: https://www.extension.iastate.edu/agdm/crops/html/a1-20.html (accessed on 16 March 2022).
- Zeffa, D.M.; Perini, L.J.; Silva, M.B.; de Sousa, N.V.; Scapim, C.A.; Oliveira, A.L.M.d.; Amaral Júnior, A.T.d.; Azeredo Goncalves, L.S. Azospirillum brasilense promotes increases in growth and nitrogen use efficiency of maize genotypes. PLoS ONE 2019, 14, e0215332. [Google Scholar] [CrossRef]
- Halvorson, A.D.; Bartolo, M.E. Nitrogen source and rate effects on irrigated corn yields and nitrogen-use efficiency. Agrono. J. 2014, 106, 681–693. [Google Scholar] [CrossRef]
- Fernandez, J.A.; DeBruin, J.; Messina, C.D.; Ciampitti, I.A. Late-season nitrogen fertilization on maize yield: A meta-analysis. Field Crop Res. 2020, 247, 107586. [Google Scholar] [CrossRef]
- Nafziger, E.D.; Rapp, D. Corn yield response to late-split nitrogen fertilizer. Agrono. J. 2021, 113, 527–536. [Google Scholar] [CrossRef]
- Shao, M.; Zhang, Y.; Du, J.; Pan, X.; Ma, L.; Wang, J.; Böhmer, D.; Guo, X. Fast analysis of maize kernel plumpness characteristics through Micro-CT technology. Int. Conf. Comput. Comput. Technol. Agric. 2017, 113, 31–39. [Google Scholar]
- Puntel, L.A.; Pagani, A.; Archontoulis, S.V. Development of a nitrogen recommendation tool for corn considering static and dynamic variables. Eur. J. Agrono. 2019, 105, 189–199. [Google Scholar] [CrossRef] [Green Version]
Figure 1.
The response of maize grain yield and grain protein concentration to nitrogen fertilizer application rate when data combined over years (2019 and 2020) and N fertilizer application time at Swan Lake Research Farm, near Morris, MN. Error bars are standard errors of the means.
Figure 1.
The response of maize grain yield and grain protein concentration to nitrogen fertilizer application rate when data combined over years (2019 and 2020) and N fertilizer application time at Swan Lake Research Farm, near Morris, MN. Error bars are standard errors of the means.
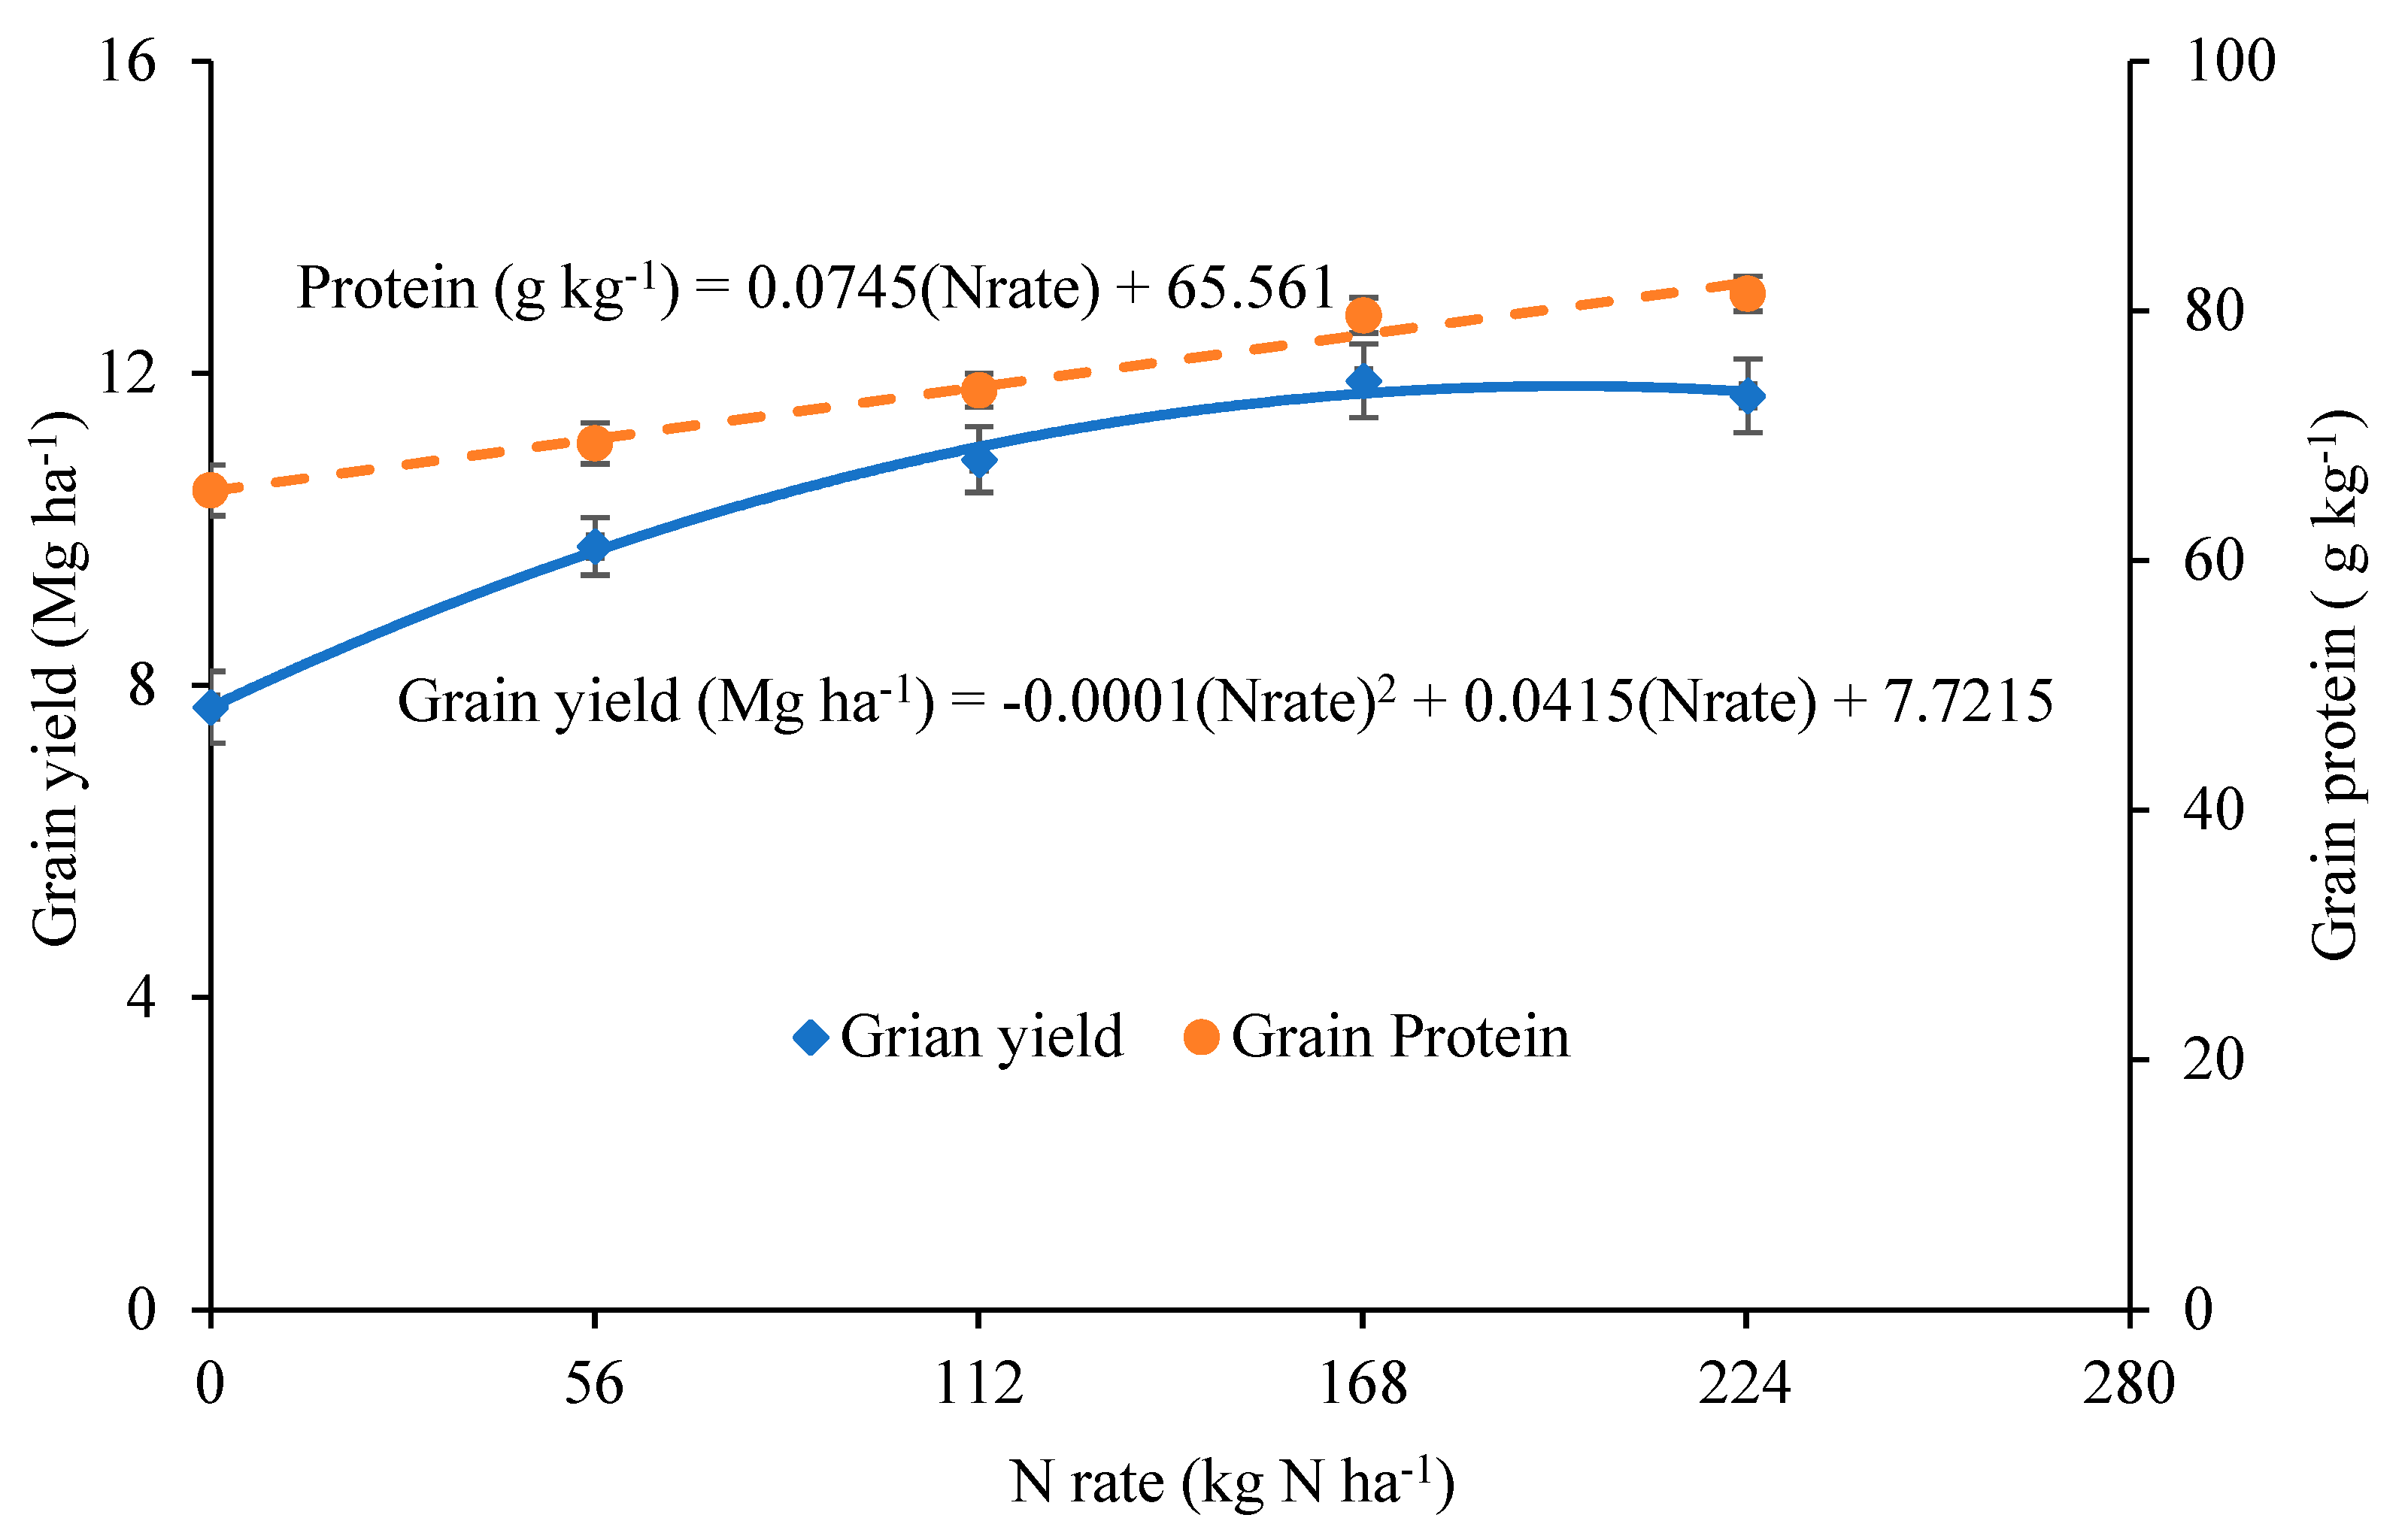
Figure 2.
Agronomic N use efficiency (ANUE) and partial factor productivity (PFP) response to nitrogen (N) fertilizer application rate when data combined over years (2019 and 2020) and N fertilizer application time at Swan Lake Research Farm, near Morris, MN. Error bars are standard error of the means.


Table 1.
Mean monthly air temperature (°C), total monthly precipitation (mm) and total monthly growing degree days (GDD) in 2019 and 2020 and long-term averages (LTA) at Swan Lake Research Farm, near Morris, MN.
Table 1.
Mean monthly air temperature (°C), total monthly precipitation (mm) and total monthly growing degree days (GDD) in 2019 and 2020 and long-term averages (LTA) at Swan Lake Research Farm, near Morris, MN.
| Month | 2019 | 2020 | LTA | 2019 | 2020 | LTA | 2019 | 2020 |
|---|---|---|---|---|---|---|---|---|
| Temperature (°C) | Precipitation (mm) | GDD | ||||||
| January | −14.1 | −9.9 | −12 | 11 | 14 | 19 | 0 | 0 |
| February | −15.3 | −9.3 | −9.8 | 24 | 3 | 18 | 0 | 0 |
| March | −5.3 | 0.2 | −2.6 | 54 | 10 | 35 | 0 | 0 |
| April | 5.8 | 5.3 | 6.4 | 69 | 38 | 61 | 0 | 0 |
| May | 11.7 | 13.3 | 13.9 | 106 | 27 | 77 | 217 | 284 |
| June | 19.9 | 22.1 | 19.2 | 79 | 112 | 108 | 529 | 627 |
| July | 22.2 | 23.0 | 21.4 | 111 | 116 | 96 | 673 | 702 |
| August | 19.4 | 21.3 | 20.0 | 137 | 71 | 83 | 526 | 626 |
| September | 16.8 | 14.8 | 15.2 | 178 | 18 | 71 | 409 | 330 |
| October | 5.6 | 4.6 | 7.6 | 79 | 32 | 60 | 81 | 112 |
| November | −2.1 | 1.6 | −1.4 | 9 | 37 | 24 | 0 | 0 |
| December | −7.9 | −5.1 | −9.1 | 27 | 12 | 18 | 0 | 0 |
| Average/Sum | 4.7 | 6.8 | 5.7 | 884 | 490 | 670 | 2435 | 2681 |
Table 2.
Summary of average initial soil properties of the experimental site at different soil depths in 2019 and 2020 at Swan Lake Research Farm, near Morris, MN.
Table 2.
Summary of average initial soil properties of the experimental site at different soil depths in 2019 and 2020 at Swan Lake Research Farm, near Morris, MN.
| Year | Soil Depth (cm) | pH (in H2O) | Soil N | Soil Organic Carbon | NH4+-N | NO3−-N | P | K |
|---|---|---|---|---|---|---|---|---|
| g kg−1 | mg kg−1 | |||||||
| 2019 | 0–15 | 7.65 | 2.3 | 28.6 | 10 | 8 | 5 | 201 |
| 15–30 | 7.78 | 1.8 | 21.9 | 9 | 7 | 3 | 180 | |
| 30–60 | 8.24 | 0.8 | 9.6 | 6 | 4 | 1 | 153 | |
| 2020 | 0–15 | 7.00 | 2.2 | 24.8 | 13 | 4 | 4 | 199 |
| 15–30 | 7.66 | 1.4 | 14.8 | 7 | 2 | 3 | 185 | |
| 30–60 | 8.17 | 0.7 | 7.2 | 4 | 2 | 1 | 151 | |
Table 3.
ANOVA table showing level of significance for year (YR), N fertilizer application rate (NR), N fertilizer application time (NT) and their interactions, trend analysis and means for year and N application time on maize grain yield and yield components at Swan Lake Research Farm, near Morris, MN in 2019 and 2020.
| Source of Variation | Grain Yield (Mg ha−1) | Grain Protein (g kg−1) | Test Weight (kg hL−1) | Harvest Index (%) | TKW ± (g) | Plant Height (cm) | Ear Length (cm) | Ear Diameter (cm) |
|---|---|---|---|---|---|---|---|---|
| p-Values | ||||||||
| Year (YR) | <0.0001 | <0.0001 | <0.0001 | 0.6579 | 0.0701 | <0.0001 | 0.9394 | 0.1282 |
| N rate (NR) | <0.0001 | <0.0001 | 0.1851 | 0.7750 | <0.0001 | 0.0383 | 0.0008 | <0.0001 |
| N timing (NT) | 0.5666 | 0.5021 | 0.6595 | 0.0151 | 0.8097 | 0.1313 | 0.5518 | 0.3951 |
| YR × NR | 0.0760 | 0.8264 | 0.1162 | 0.8563 | 0.4596 | 0.8980 | 0.9635 | 0.7544 |
| YR × NT | 0.7892 | 0.5375 | 0.2228 | 0.8570 | 0.2190 | 0.0030 | 0.0199 | 0.9311 |
| NR × NT | 0.7823 | 0.5232 | 0.9149 | 0.9523 | 0.2799 | 0.6738 | 0.1849 | 0.2191 |
| YR × NR × NT | 0.0944 | 0.4863 | 0.6524 | 0.4844 | 0.2330 | 0.7460 | 0.6718 | 0.9955 |
| Trend analysis for N rate | ||||||||
| Linear | <0.0001 | <0.0001 | 0.8499 | 0.1157 | <0.0001 | <0.0001 | <0.0001 | <0.0001 |
| Quadratic | 0.0153 | 0.7482 | 0.7206 | 0.1061 | 0.3714 | 0.1862 | 0.0133 | 0.0952 |
| Cubic | 0.6522 | 0.2741 | 0.9869 | 0.5914 | 0.2170 | 0.1856 | 0.4620 | 0.6753 |
| Quartic | 0.7410 | 0.6300 | 0.9818 | 0.6966 | 0.9362 | 0.7830 | 0.9891 | 0.1987 |
| Means | ||||||||
| Year | ||||||||
| 2019 | 9.38 B | 72.0 B | 66.81 B | 64.46 A | 323 A | 237 B | 14.3 A | 4.8 A |
| 2020 | 12.01 A | 77.6 A | 74.29 A | 63.44 A | 330 A | 248 A | 14.2 A | 4.6 A |
| N timing | ||||||||
| All | 11.14 a | 75.56 a | 70.63 a | 63.37 b | 331 a | 245 a | 14.4 a | 4.8 a |
| Split | 11.01 a | 76.43 a | 70.51 a | 64.98 a | 330 a | 242 a | 14.5 a | 4.8 a |
± TKW = thousand kernel weight; Means followed by the same letter in a column are statistically the same at α = 0.05 using LSD; and upper-case letter compares means for year, and lower-case letter compares means for N application time.
Table 4.
The effect of N application rate on maize test weight, harvest index, thousand kernel weight (TKW), plant height, ear length and ear diameter when data analyzed over years (2019 and 2020) and N fertilizer application time at Swan Lake Research Farm, near Morris, MN.
Table 4.
The effect of N application rate on maize test weight, harvest index, thousand kernel weight (TKW), plant height, ear length and ear diameter when data analyzed over years (2019 and 2020) and N fertilizer application time at Swan Lake Research Farm, near Morris, MN.
| N Rate (kg N ha−1) | Test Weight (kg hL−1) | Harvest Index (%) | TKW ± (g) | Plant Height | Ear Length | Ear Diameter |
|---|---|---|---|---|---|---|
| cm | ||||||
| 0 | 70.42 a | 62.1 a | 298 c | 230 c | 12.1 d | 4.5 d |
| 56 | 70.89 a | 63.8 a | 308 c | 240 b | 13.7 c | 4.7 c |
| 112 | 70.74 a | 64.7 a | 327 b | 243 ab | 14.4 b | 4.8 b |
| 168 | 70.51 a | 64.2 a | 342 ab | 243 ab | 14.8 ab | 4.9 a |
| 224 | 70.14 a | 64.1 a | 343 a | 248 a | 15.1 a | 4.9 a |
Means followed by a common letter in a column are statistically the same at α = 0.05 using LSD and ± TKW = thousand kernel weight.
Table 5.
Economic analysis of N fertilizer application rates showing maize grain yield, net benefit, and marginal rate of return (MRR) under different scenarios when data combined over years (2019 and 2020) and N fertilizer application time at the Swan Lake Research Farm, near Morris, MN. All currency in USD.
| N Rate (kg N ha−1) | Adjusted Grain Yield (Mg ha−1) ± | Current Scenario | Scenario 1 | Scenario 2 | Scenario 3 | ||||
|---|---|---|---|---|---|---|---|---|---|
| Net Benefit (USD ha−1) | MRR (%) | Net Benefit (USD ha−1) | MRR (%) | Net Benefit (USD ha−1) | MRR (%) | Net Benefit (USD ha−1) | MRR (%) | ||
| 0 | 6.95 | 1679 | 1679 | 1847 | 1511 | ||||
| 56 | 8.80 | 2003 | 261 | 1990 | 228 | 2215 | 297 | 1778 | 195 |
| 112 | 9.80 | 2120 | 94 | 2095 | 77 | 2357 | 114 | 1858 | 59 |
| 168 | 10.71 | 2215 | 77 | 2178 | 61 | 2474 | 94 | 1919 | 45 |
| 224 | 10.54 | 2050 | D¥ | 2000 | D | 2304 | D | 1745 | D |
± Adjusted (10% down) grain yield to minimize small plot management effects. Current scenario has 0.163 price ratio (241.64 USD per Mg maize (6.13 USD per bushel maize) and 2.219 USD per kg N (1.005 USD per lb N)). Scenario 1 = 10% increase of N fertilizer cost but fixed grain price; Scenario 2 = 10% increase of grain price but fixed N fertilizer cost; Scenario 3 (worst scenario case) = 10% increase of N fertilizer cost and 10% decrease of grain price; D¥ = dominated (N rate with greater cost but less net-benefit compared with N rate with less cost but greater net benefit).
Publisher’s Note: MDPI stays neutral with regard to jurisdictional claims in published maps and institutional affiliations. |
© 2022 by the authors. Licensee MDPI, Basel, Switzerland. This article is an open access article distributed under the terms and conditions of the Creative Commons Attribution (CC BY) license (https://creativecommons.org/licenses/by/4.0/).
Share and Cite
MDPI and ACS Style
Mohammed, Y.A.; Gesch, R.W.; Johnson, J.M.F.; Wagner, S.W. Agronomic and Economic Evaluations of N Fertilization in Maize under Recent Market Dynamics. Nitrogen 2022, 3, 514-527. https://doi.org/10.3390/nitrogen3030033
AMA Style
Mohammed YA, Gesch RW, Johnson JMF, Wagner SW. Agronomic and Economic Evaluations of N Fertilization in Maize under Recent Market Dynamics. Nitrogen. 2022; 3(3):514-527. https://doi.org/10.3390/nitrogen3030033
Chicago/Turabian StyleMohammed, Yesuf Assen, Russ W. Gesch, Jane M. F. Johnson, and Steve W. Wagner. 2022. "Agronomic and Economic Evaluations of N Fertilization in Maize under Recent Market Dynamics" Nitrogen 3, no. 3: 514-527. https://doi.org/10.3390/nitrogen3030033