Quantitative Analysis of Wine Mixtures Using an Electronic Olfactory System †
by
 ,
,
Manuel Aleixandre
1 ,
,
Enrique Montero
1,
Teresa Arroyo
2,
Juan Mariano Cabellos
2 and
María Carmen Horrillo
1,* 
1
SENSAVAN, Instituto de Tecnologías Físicas y de la Información, ITEFI-CSIC, Madrid, Spain
2
Dpto. Investigación Agroalimentaria, Instituto Madrileño de Investigación y Desarrollo Rural, Agrario y Alimentario (IMIDRA), Madrid, Spain
*
Author to whom correspondence should be addressed.
†
Presented at the Eurosensors 2017 Conference, Paris, France, 3–6 September 2017.
Proceedings 2017, 1(4), 450; https://doi.org/10.3390/proceedings1040450
Published: 8 August 2017
(This article belongs to the Proceedings of Proceedings of Eurosensors 2017, Paris, France, 3–6 September 2017)
Abstract
:An electronic nose has been used for the quantification of wines formed by binary mixtures of two white wine varieties and of two red wine varieties. The wines were elaborated at the Instituto Madrileño de Investigación y Desarrollo Rural (IMIDRA) by the traditional method using commercial and autochthonous Saccharomyces cerevisiae yeasts. It is important to note that this technology is faster, simpler and objective than the sensing analysis (human panel). In addition the measurements can be realized in situ and on line. The measurements of the wine mixtures have been analyzed by Partial Least Squares and Artificial Neuronal Networks.
1. Introduction
Although there is much literature on the use of electronic noses for very different wine applications [1,2], at current, there are no references for the specific application developed in this work and a few ones where other technologies are used [3]. Therefore, it is very important to develop this application because the blending of wine varieties modifies the sensory and chemical properties of final wine, by increasing the complexity of the wine or by enhancing its aroma, flavor, and texture. Thus, it is desirable to provide an objective system that supplies information on varieties incorporated into a bottle, defending criteria of authenticity and protection of quality of wines, at least for a given region, avoiding possible commercial frauds.
2. Materials and Methods
The wines used in the experiments were elaborated in the Experimental Cellar of the IMIDRA with different red and white varieties. Two significant types of mixtures, from 0 to 100% in 10% steps, have been selected for this work, Malvasia271/Chenin Blanc (white wine) and Tempranillo/Tempranillo889 (red wine). Malvasía and Chenin Blanc are grape varieties that can complement the characteristics of the traditional varieties, in particular by increasing the freshness, acidity, and aromatic intensity of the unblended wines. Tempranillo is a traditional grape variety widely used in Spain for the red wine production. CLI 271 [4] and CLI 889 [5] are autochthonous Saccharomyces cerevisiae yeast strains from the Origin Appellation “Vinos de Madrid” with biotechnology properties for improving and ensuring wine quality. The wine Tempranillo889 was fermented by the CLI 889 strain and the Malvasia271 by the CLI 271 strain, the other wines were fermented by a commercial yeast strains (RVA for Tempranillo and Vario for Chenin Blanc, both yeasts from Agrovin provider).
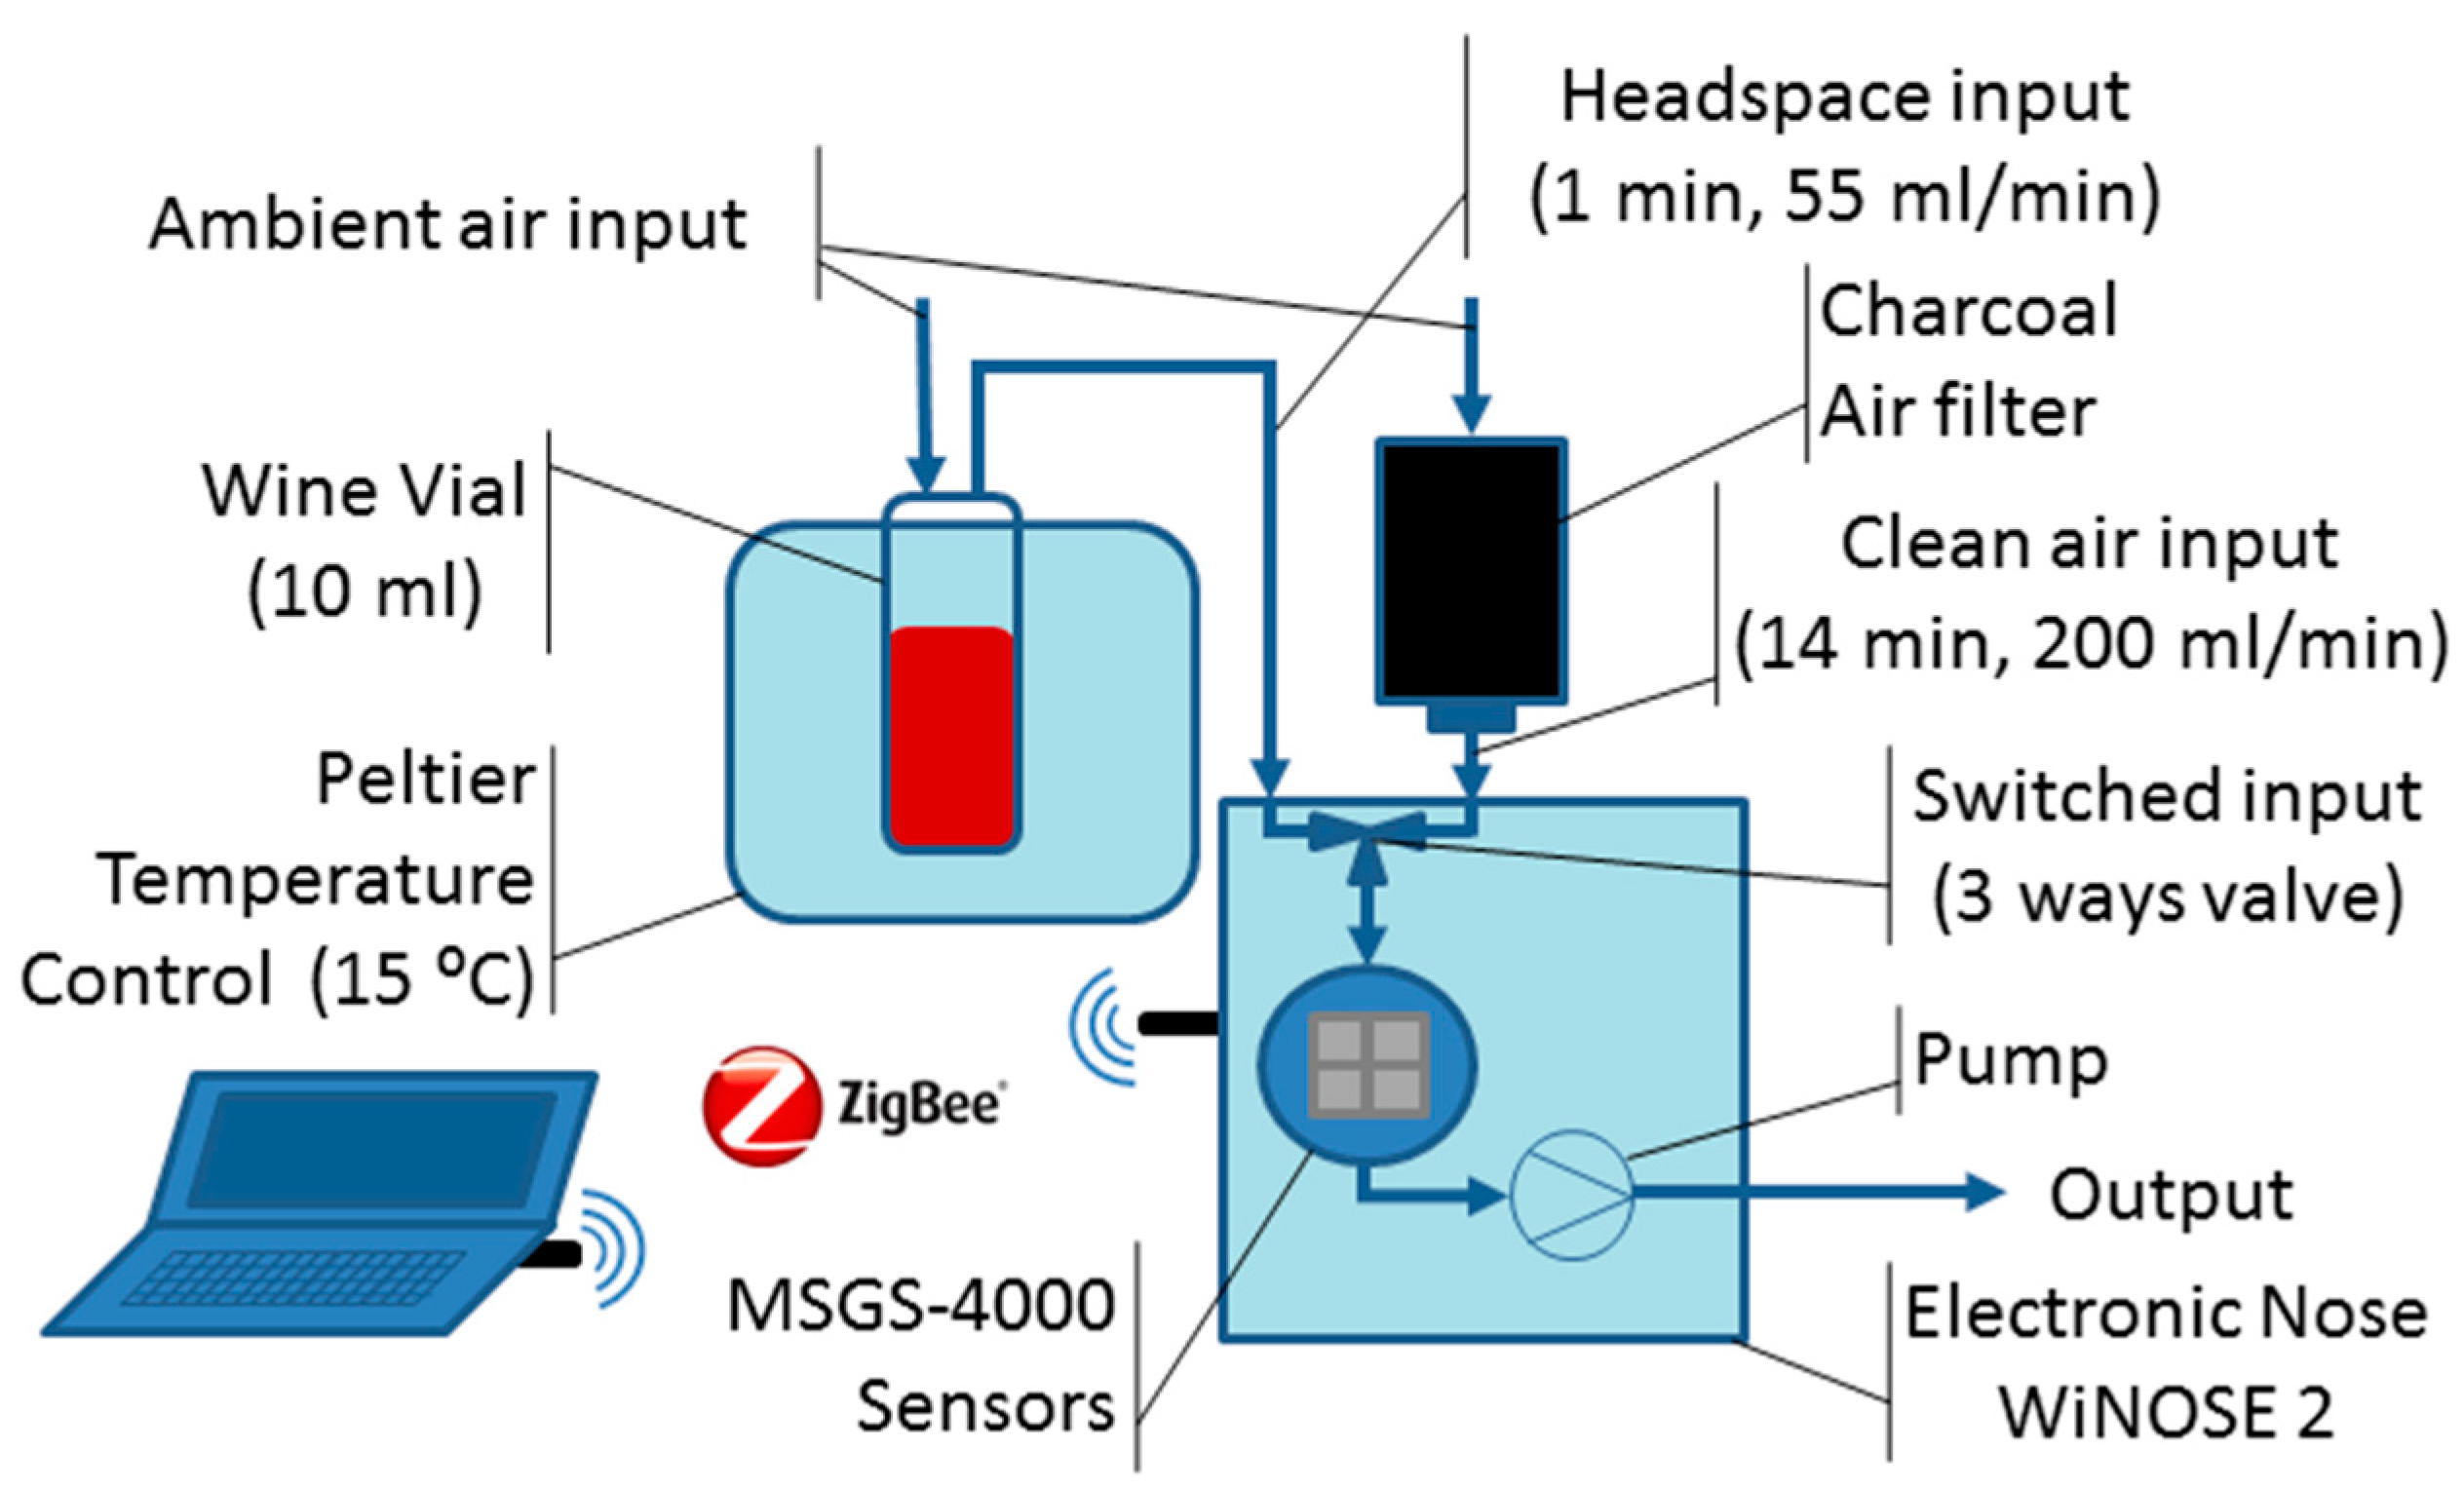
The configuration of the experimental system was adjusted so the stability and sensitivity were optimized. The setup is described in Figure 1. A vial with 10 mL of wine mixture was placed in a Peltier temperature controller at 15 °C. The electronic nose generated a sensor baseline with a 200 mL/min flow rate of charcoal filtered ambient air during 14 min. Then the electronic nose automatically switched the air input to the headspace generated in the vial. A flow rate of 55 mL/min of the sample vial was guided into the electronic nose toward the sensors. The pneumatic system consisted of an air pump, at the exit, that pulled the gases and an electrovalve that switched the input between the filtered air and the wine headspace. The electronic nose had four commercial metal oxide resistive sensors (MSGS-4000, Microsens) heated at 300 °C. The electronic nose was controlled wirelessly (ZigBee) by a software programmed in Testpoint in a personal computer that also recorded the sensor resistances and calculated their responses.
The responses were analyzed by custom scripts programmed in Matlab. Two methods were used to predict the mixture ratio; the first was a Partial Least Squares regression (PLS) and the second was an Artificial Neural Network (ANN) in a multilayer perceptron configuration with a hidden layer of five neurons. Both methods were cross-validated with validation sets consisting of all the measurements of the mixture ratio being predicted and the training data was the rest of the measurements as explained in Figure 2 in which the 3 first folds are shown. All data and plots shown are the final validation results.
3. Results
The Figure 3 and Figure 4 show the regression data of the PLS and ANN predictions respectively. Each point represents one measurement. For the white wines, the X-axis is the real concentration of the Malvasía 271 wine in the mixture. For the red wines the X-axis is the real concentration of the Tempranillo wine in the mixture. The Y-axis is the predicted concentration. To evaluate the performance of the validated predictions a linear regression was calculated and it is shown as a solid line in the graphics. The Root mean square error (RMSE) and regression coefficients (R) have been compiled in Table 1.
4. Discussion
The PLS is unable to give a correct quantification of the white wine mixtures but it quantifies well the red wines mixtures with a better performance as seen in Figure 3. The ANN regression improves the quantitative classification of both wine mixture types, but in the case of red wines the improvement gives us a quantitative analysis of the mixtures much more accurate, as seen in Figure 4. RMSE and regression coefficients of the prediction of the ANN and PLS, for red and white wines tested, seen in Table 1, confirm this analysis.
The Malvasía grape variety wine has a strong varietal aromatic profile with floral and fruity notes and the CLI 271 yeast strain gives fermentation notes consisting of mainly fruity and microbiologic scents. In the other hand, the Chenin Blanc has very few varietal aroma having mainly fruity and spicy scents. In summary, the main differences between the two white wines mixed are the floral notes of the Malvasía. These floral notes have been difficult to analyze by an electronic nose based on tin oxide resistive sensors as shown in [6]. This could explain the worse results of the electronic nose quantifying these mixtures.
In the other hand, the Tempranillo wine fermented with the commercial yeast has higher concentration of diacetyl than the Tempranillo fermented with the strain CLI 889 and in addition, the latter has a greater concentration of long chain alcohols which could explain the better performance of the electronic nose with the Tempranillo wines.
Acknowledgments
This work has been supported by the Instituto Nacional de Investigación y Tecnología Agraria y Alimentaria (INIA) of the Economía y Competitividad Ministry, under the project RTA2011-00095-C02-02.
Conflicts of Interest
The authors declare no conflict of interest. The founding sponsors had no role in the design of the study; in the collection, analyses, or interpretation of data; in the writing of the manuscript, and in the decision to publish the results.
References
- Aleixandre, M.; Santos, J.P.; Sayago, I.; Cabellos, J.M.; Arroyo, T.; Horrillo, M.C. A wireless and portable electronic nose to differentiate musts of different ripeness degree and grape varieties. Sensors 2015, 15, 8429–8443. [Google Scholar] [CrossRef] [PubMed]
- Rodríguez-Méndez, M.L.; De Saja, J.A.; González-Antón, R.; García-Hernández, C.; Medina-Plaza, C.; García-Cabezón, C.; Martín-Pedrosa, F. Electronic Noses and Tongues in Wine Industry. Front. Bioeng. Biotechnol. 2016, 4, 81. [Google Scholar] [CrossRef] [PubMed]
- Hopfer, H.; Ebeler, S.E.; Heymann, H. Blending affects the sensory and chemical properties of red wine. Am. J. Enol. Vitic. 2012, 63, 313–324. [Google Scholar] [CrossRef]
- Balboa-Lagunero, T.; Arroyo, T.; Cabellos, J.M.; Aznar, M. Yeast selection as a tool for reducing key oxidation notes in organic wines. Food Res. Int. 2013, 53, 252–259. [Google Scholar] [CrossRef]
- Cordero-Bueso, G.; Esteve-Zarzoso, B.; Gil-Diaz, M.; García, M.; Cabellos, J.M.; Arroyo, T. Improvement of Malvar wine quality by use of locally-selected Saccharomyces cerevisiae strains. Fermentation 2016, 2, 7. [Google Scholar] [CrossRef]
- Lozano, J.; Santos, J.P.; Arroyo, T.; Aznar, M.; Cabellos, J.M.; Gil-Diaz, M.; Horrillo, M.C. Correlating e-nose responses to wine sensorial descriptors and gas chromatography–mass spectrometry profiles using partial least squares regression analysis. Sens. Actuators B Chem. 2007, 127, 267–276. [Google Scholar] [CrossRef]
Figure 1.
Scheme of the experimental setup.

Figure 2.
Validation scheme. In each fold of the cross validation all the measurements corresponding to one ration mixture are used for the validation and the rest is used in the training, the wines without mixtures are used only for training.
Figure 2.
Validation scheme. In each fold of the cross validation all the measurements corresponding to one ration mixture are used for the validation and the rest is used in the training, the wines without mixtures are used only for training.

Figure 3.
PLS predictions of the different wine concentrations, left figure for the white wine samples and right figure for the red wine samples.
Figure 3.
PLS predictions of the different wine concentrations, left figure for the white wine samples and right figure for the red wine samples.

Figure 4.
ANN predictions of the different wine concentrations, left figure for the white wine samples and right figure for the red wine samples.
Figure 4.
ANN predictions of the different wine concentrations, left figure for the white wine samples and right figure for the red wine samples.


Table 1.
Root mean square error (RMSE) and regression coefficients of the prediction of the ANN and PLS, for the cited wine samples.
Table 1.
Root mean square error (RMSE) and regression coefficients of the prediction of the ANN and PLS, for the cited wine samples.
| PLS | ANN | |||
|---|---|---|---|---|
| RMSE | R | RMSE | R | |
| MAL271/CHB | 37.694 | 0.052 | 32.928 | 0.615 |
| TEM/TEM 889 | 24.250 | 0.653 | 15.017 | 0.844 |
Publisher’s Note: MDPI stays neutral with regard to jurisdictional claims in published maps and institutional affiliations. |
© 2017 by the authors. Licensee MDPI, Basel, Switzerland. This article is an open access article distributed under the terms and conditions of the Creative Commons Attribution (CC BY) license (https://creativecommons.org/licenses/by/4.0/).
Share and Cite
MDPI and ACS Style
Aleixandre, M.; Montero, E.; Arroyo, T.; Cabellos, J.M.; Horrillo, M.C. Quantitative Analysis of Wine Mixtures Using an Electronic Olfactory System. Proceedings 2017, 1, 450. https://doi.org/10.3390/proceedings1040450
AMA Style
Aleixandre M, Montero E, Arroyo T, Cabellos JM, Horrillo MC. Quantitative Analysis of Wine Mixtures Using an Electronic Olfactory System. Proceedings. 2017; 1(4):450. https://doi.org/10.3390/proceedings1040450
Chicago/Turabian StyleAleixandre, Manuel, Enrique Montero, Teresa Arroyo, Juan Mariano Cabellos, and María Carmen Horrillo. 2017. "Quantitative Analysis of Wine Mixtures Using an Electronic Olfactory System" Proceedings 1, no. 4: 450. https://doi.org/10.3390/proceedings1040450