Proceeding Paper

Optimization of Robotized Welding in Aluminum Alloys with Pulsed Transfer Mode Using the Taguchi Method †

1
FEUP, Faculty of Engineering of University of Porto, Porto 4200-465, Portugal
2
ESTIG, Institute Polytechnic of Bragança, Bragança 5300-253, Portugal
3
Roboplan, Aveiro 3800-042, Portugal
*
Author to whom correspondence should be addressed.
Presented at the 18th International Conference on Experimental Mechanics (ICEM18), Brussels, Belgium, 1–5 July 2018.
Proceedings 2018, 2(8), 426; https://doi.org/10.3390/ICEM18-05294
Published: 8 June 2018
(This article belongs to the Proceedings of The 18th International Conference on Experimental Mechanics)

Abstract

:
In order to obtain an optimal combination of welding parameters to weld an aluminum alloy (6082-T6) with MIG (Metal Inert Gas) it was used an L27 Taguchi orthogonal array. The array originated 27 different combinations that gives rise to 27 welding programs for the metal pulsed spray mode. The welds were made in aluminum bars using an industrial robot. All welds were repeated three times to ensure string repeatability. Metallographic tests were performed on the weld beads for measuring the width bead, penetration and reinforcement. Measurement data was analyzed for signal/noise and analysis of variance (ANOVA). Applying the Taguchi’s method, an optimal combination of welding parameters was reached.

1. Introduction

The increase in the use of aluminum in recent years means that processes related to this material are increasingly being researched with the aim of better control and to obtain better quality products. Since welding is a very complex process and with little room for errors, it requires a thorough and rigorous research.
In spite of the evident advantages of aluminum alloys, they have some disadvantages when compared with the iron-carbon alloys, evidencing the need of a greater quality control in the manufacturing processes [1], due to a greater difficulty in welding these materials [2,3]. One of the most limiting phenomena of fusion welding in aluminum alloys with traditional processes is the arising of residual stresses generated during the welding process, which in turn can cause cracking [4] or warping of the structure [4,5]. A high residual stress level has another profoundly negative consequence in the industry, and is related to the significant decrease in fatigue life in welded structures [6,7].
Considered as a powerful tool for the planning of experiments in manufacturing processes, the Taguchi method is often used in association with other statistical or optimization techniques [8], allowing a more profound, efficient and thorough analysis results obtained from the tests.

2. Materials and Methods

Welding Aluminium Alloy

The fusion welding normally applied for joining aluminum alloys is gas arc welding (Gas Metal Arc Welding—GMAW). One of the gas shielding processes used for welding aluminum alloys is the MIG process using argon as an inert gas, which was applied in this work. In this process the parts to be connected are heated, forming an electric arc between the parts and the consumable electrode, this arc being protected by a gas atmosphere of argon.
The MIG process is a versatile process, easily adapted for automatic welding. This process allows the welding in several positions with high productivity, due to the high speed of welding. The deposition rate is very high because the current density is high. Another advantage of this method is that deposition of the addition metal is done with low hydrogen content.
Welding parameters consist of factors that are regulated by controlling as characteristics of the weld bead. Knowing the effect of each variable in relation to the various characteristics or properties of the weld, is a process that presents more satisfactory results.

3. Experimental Working

3.1. Selection of Welding Parameters

The welding parameters for the pulsed spray mode deposition were initially defined, which parameters will remain constant throughout the welding of all beads, Table 1. The parameters to be optimized refer to the beginning and ending of the welding bead, which are 12 parameters, each with three levels, Table 2, being the combined levels according to the orthogonal array of Taguchi L27, originating 27 different programs. These 27 programs are carried out 3 times, thus ensuring repeatability of the parameters.

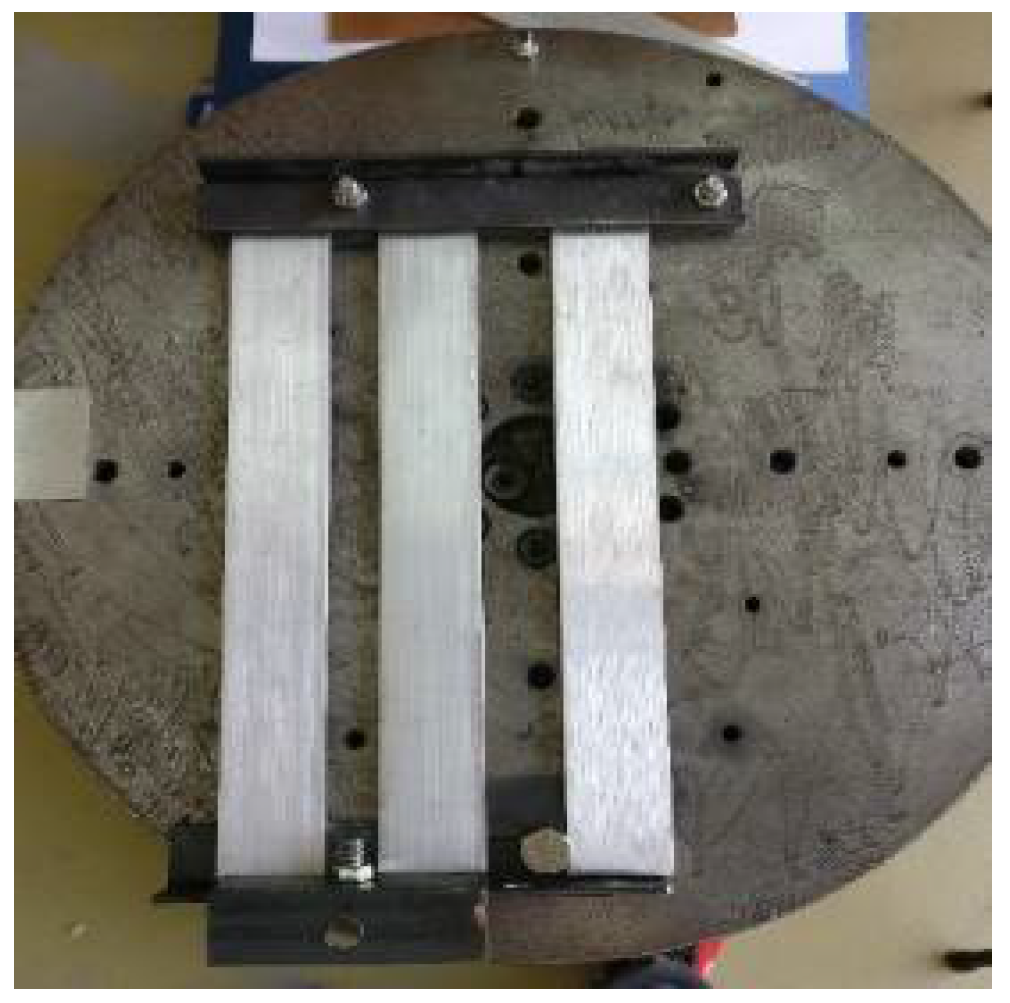
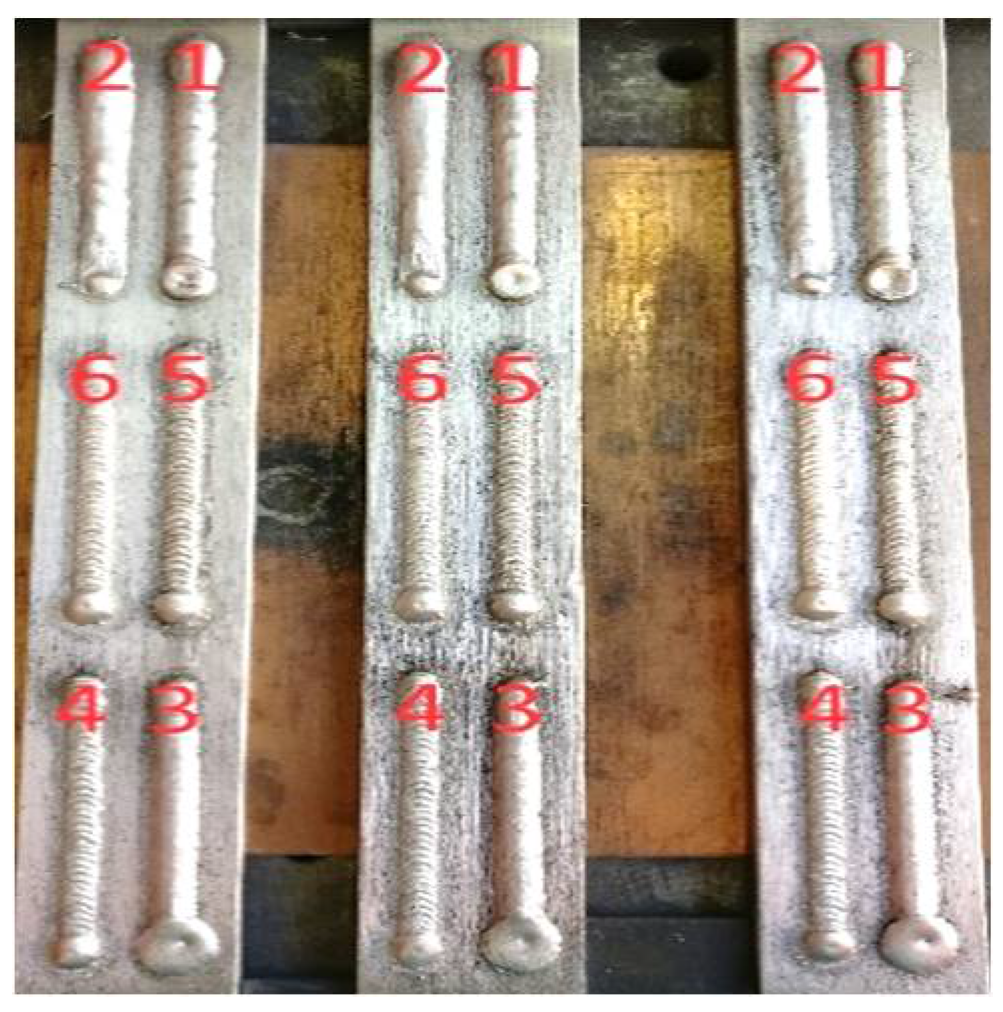
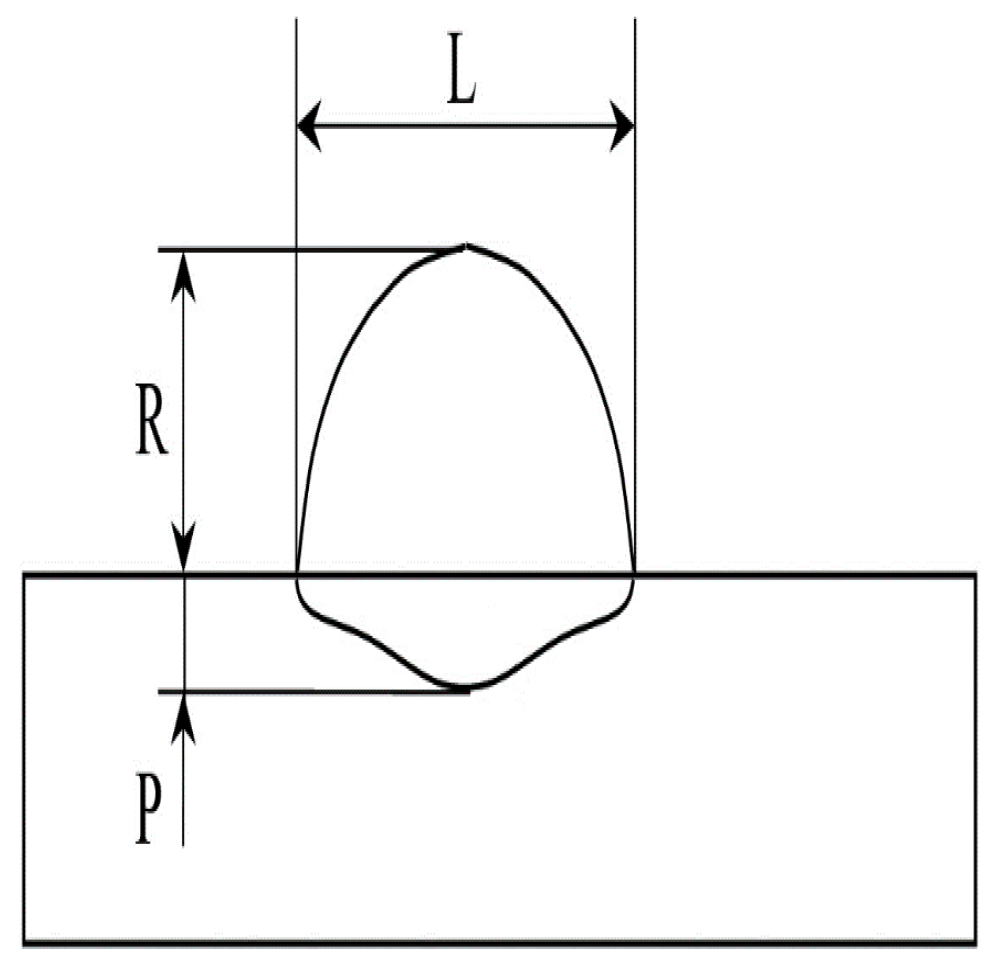
3.2. Making the Weld Beads

To implement the weld beads, it were used three aluminum bars, as shown in Figure 1. On each bar it was done six surfacing welds, see Figure 2. The programs were repeated tree times to guarantee the repeatability. In Figure 2 it is possible to observe the number of each program, this is, for each bar it were carried out six weld beads with different parameters and combination levels. In order to minimize the influence of welding temperature in the weld bead geometry, it was applied a time delay of 10 min between them. For the total work were welded 81 weld beads.
After all the welding beads have been made, metallographic samples were prepared to measure the width (L), the penetration (P) and the reinforcement (R), using a macroscope (Figure 3).
The metallographic samples undergo various processes until they could be analyzed. After the cut is carried out the hot mounting of the samples, this assembly facilitates handling of the samples during the processes of chemical etching and macroscopic visualization.

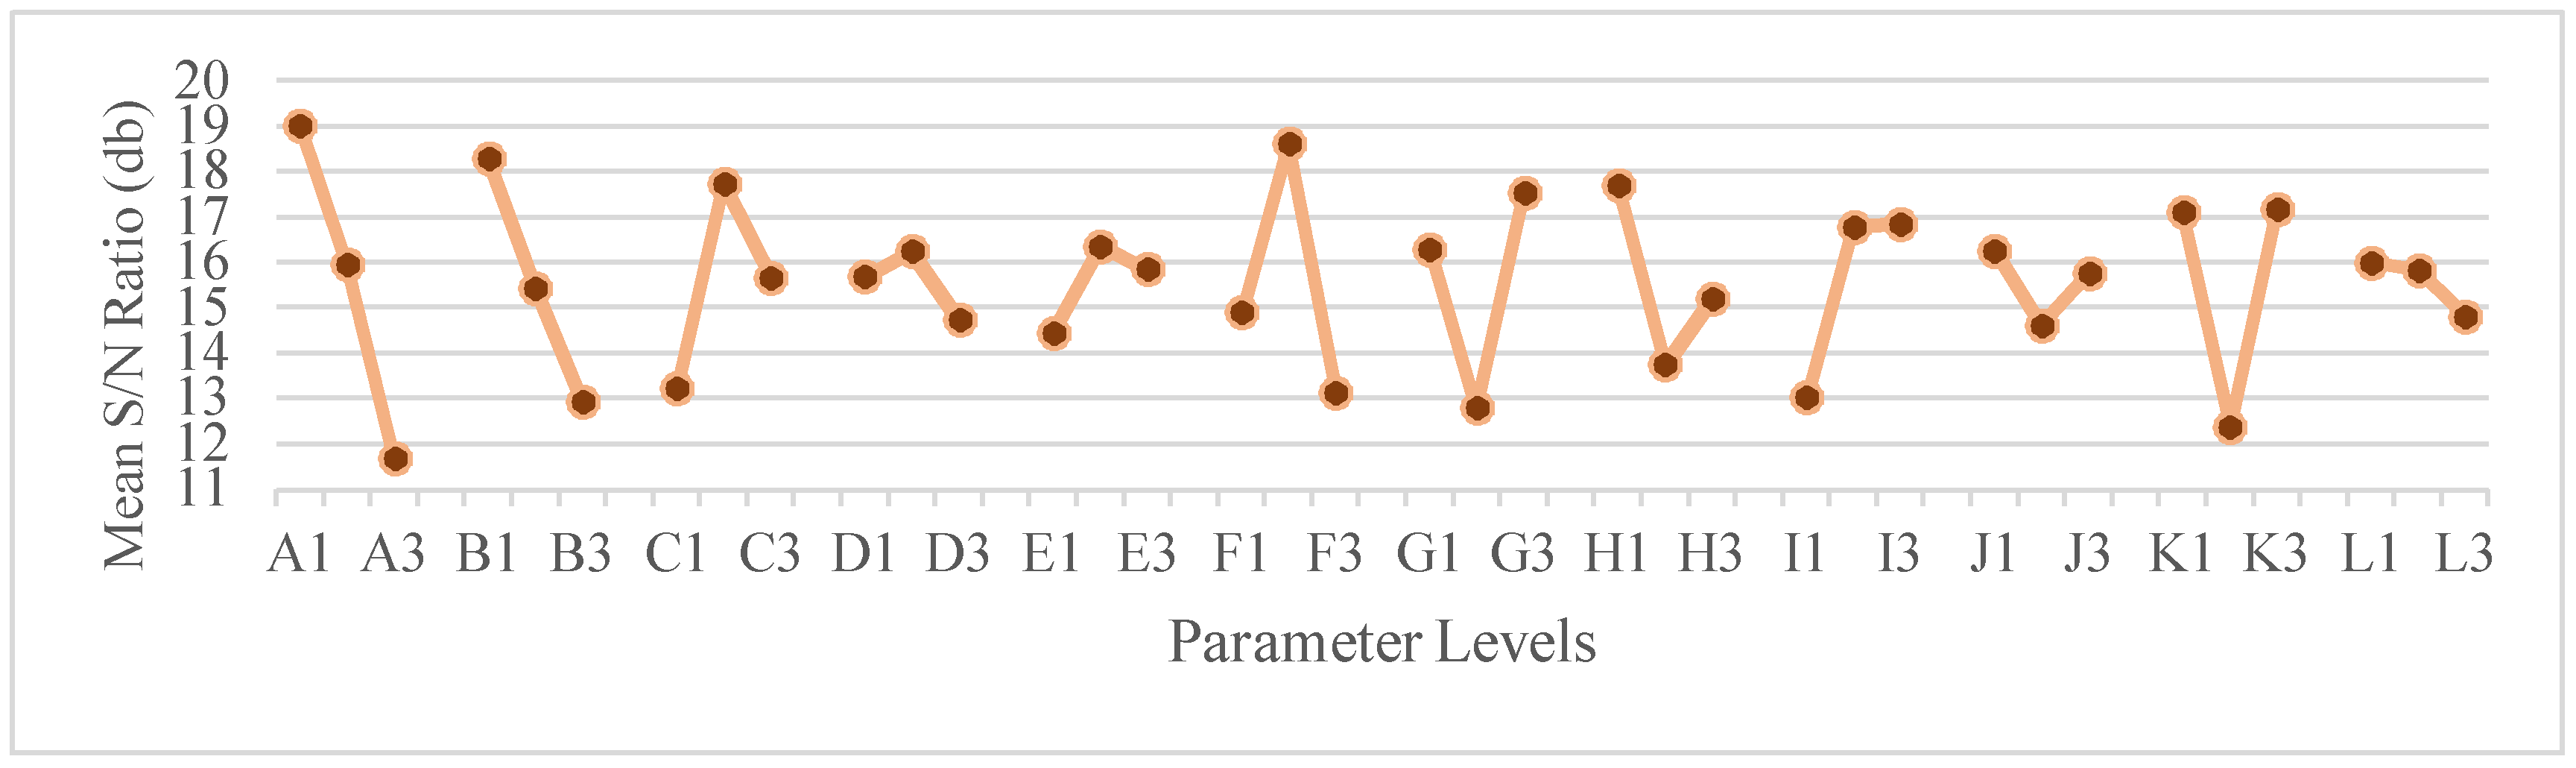
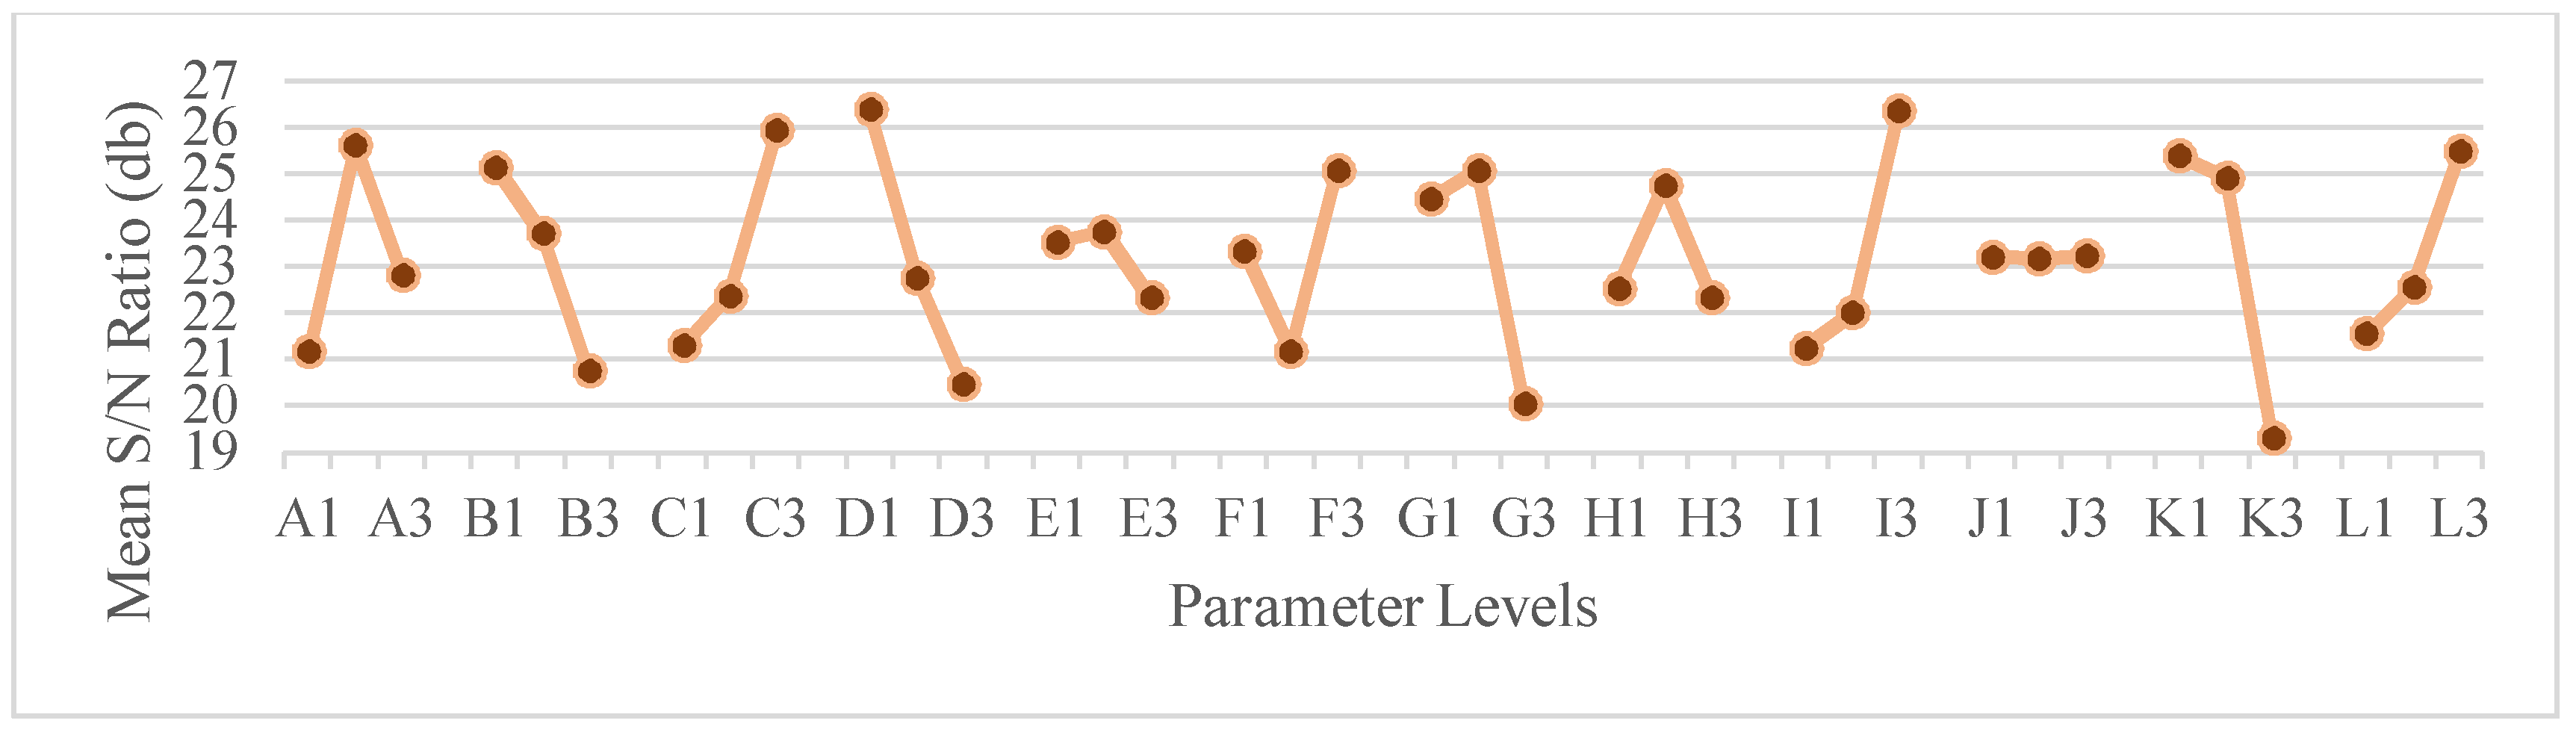
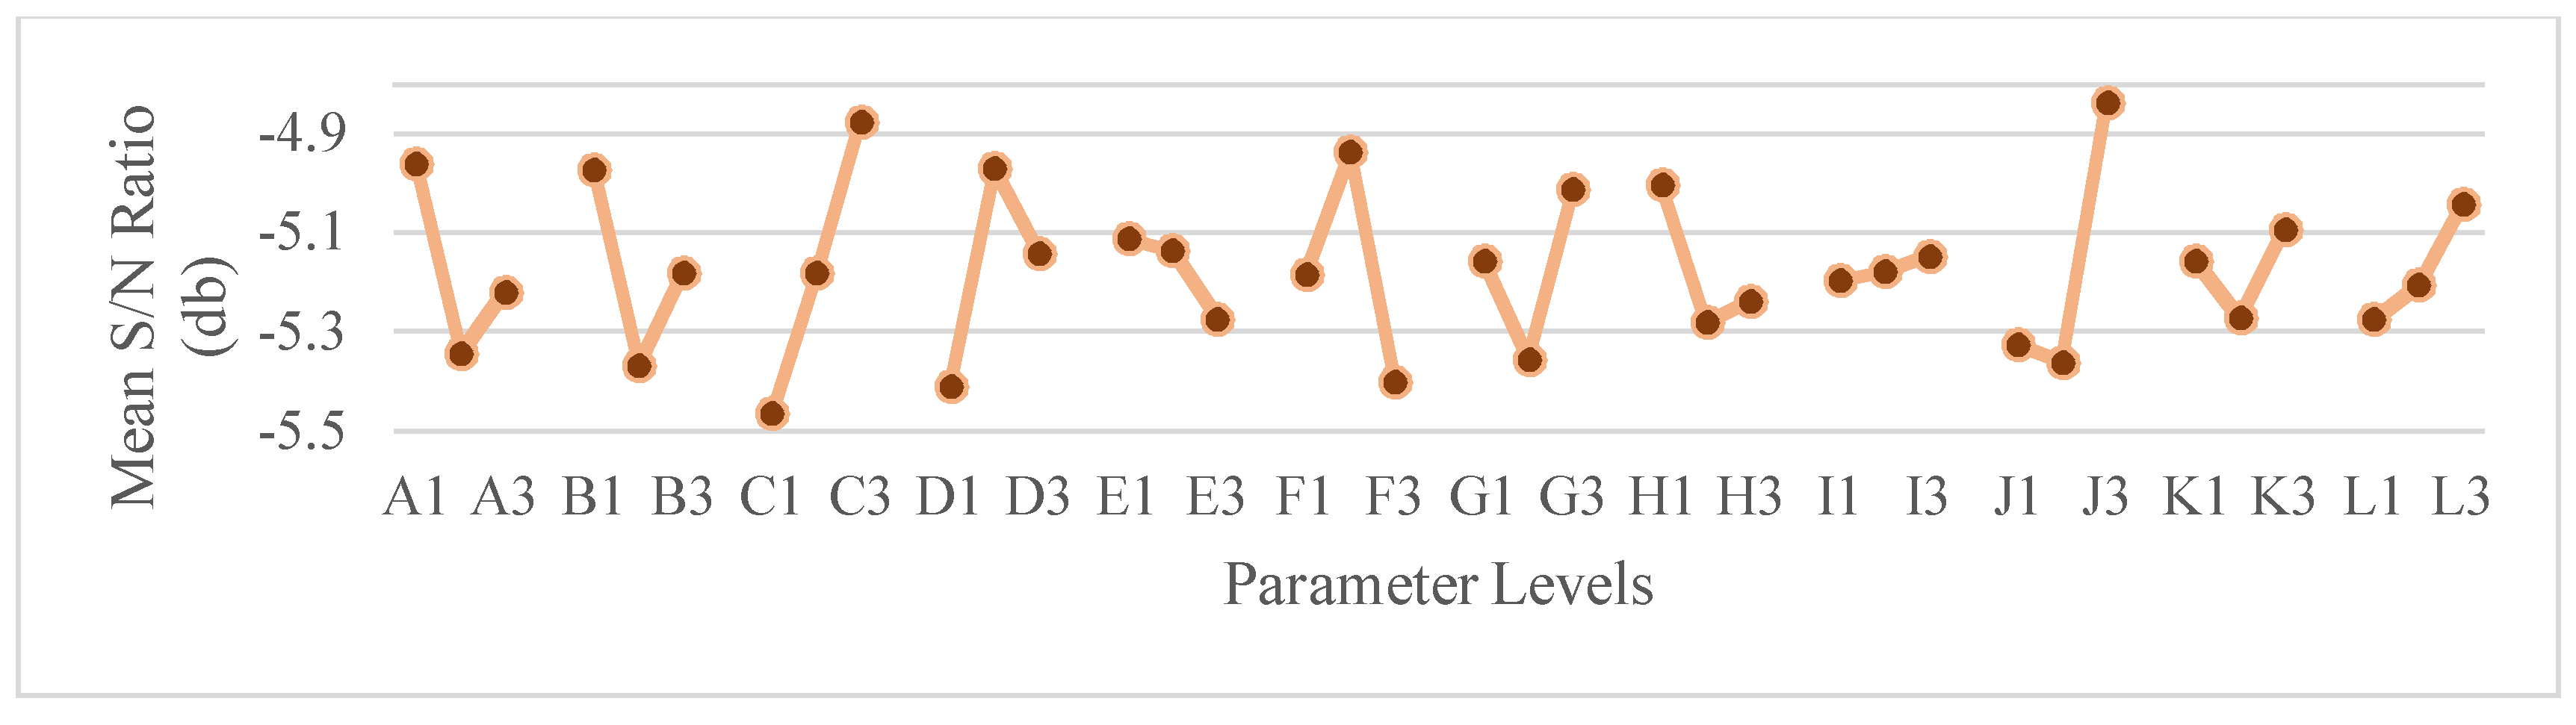
3.3. Signal-to-Noise Ratio

The Taguchi method frequently uses a two-step optimization process. The first step uses the signal-to-noise ratio to determine those control factors that reduce variability. The second step identifies the control factors that move the mean to target and have a small on the signal-to-noise ratio. The signal-to-noise ratio measures how the response varies relative to a target value under different noise conditions. For the present work were used two different targets, “nominal is best” (Equation (1)) for penetration and bead width and “smaller is better” (Equation (2)) for the reinforcement.
S / N t = 10   l o g ( s y 2 )
S / N S = 10 log ( 1 n i = 1 n y i 2 )    
where s y 2 is the standard deviation, n is the number of observations and yi is the measured characteristic. Higher values of the signal-to-noise ratio identify control factor settings that minimize the effects of the noise factors.
The mean signal-to-noise ratio curves for Pulsed mode are shown through Figure 4 for width, Figure 5 for penetration and Figure 6 for reinforcement.
Observing the previous Figures it is possible to determine the optimal combination for each geometric characteristic analyzed. So, for the width bead the optimal combination is A1B1C2D2E2F2G3H1I3J1K2L1. Already for penetration, the optimal combination is A2B1C3D1E2F3G2H2I3J3K1L3. Finally, for the reinforcement the optimal combination is A1B1C3D2E1F2G3H1I3J3K3L3.

3.4. ANOVA Analysis

The use of the ANOVA analysis allows to highlight the parameters with greater influence for the measured characteristic. The ANOVA analysis has as main objective to determine the most influent welding parameters in the geometric characteristics to be controlled, in this case, the bead width, penetration and reinforcement.
For an analysis of the bead width in the pulsed mode, the parameter A, corresponding to the pre-gas flow, is shown as the most influential, with a contribution of 21.45%. The parameter F, gas factor, stands out as the second most influential, with 12.43% contribution, Table 3.
For the penetration analysis, the parameter D, corresponding to the anti-adhesion correction, has the greatest influence, with a contribution of 14.25%. It is also worth noting the parameter G, corresponding to the initial current, as the second largest influence with 11.98% contribution, Table 4.
For an analysis of the reinforcement, the evidence was the parameter C, corresponding to the wire feed speed, as the largest influence with 19.19% contribution. It is also worth noting the parameter J, corresponding to the initial time, as in the second largest influence with 18.97% contribution, Table 5.

4. Conclusions

With the Taguchi method, it was possible to carry out the study with a reduced number of experimental tests.
The graphs of the mean signal-to-noise ratio allowed the authors to select the optimal parameter sequence for each dimension. For Pulsed mode, the optimal combination for the bead width consists of the values of 0.1 s of Pre-gas flow, 0.5 s of Post-gas flow, 8 m/min of Wire feed speed, 0 of Anti-adhesion correction, 5 L/min Nominal gas value, 5 Gas factor, 140% Initial current, 0.3 s Slope 1, 100% Final current, 0.7 s Initial time, 1 s Final time and 0.1 s of Slope 2, corresponding to the sequence A1B1C2D2E2F2G3H1I3J1K3L1. For the bead penetration consists of the values of 0.5 s of Pre-gas flow, 0.5 s of Post-gas flow, 12 m/min of Wire feed speed, −0.2 of Anti-adhesion correction, 5 L/min of Nominal gas value, 10 Gas factor, 90% Initial current, 0.1 s of Slope 1, 100% of Final current, 1.5 s of Initial time, 0.2 s of Final time and 1 s of Slope 2, corresponding to the sequence A2B1C3D1E2F3G2H2I3J3K1L3. For the bead reinforcement consists of the values of 0.1 s of Pre-gas flow, 0.5 s of Post-gas flow, 12 m/min of Wire feed speed, 0 of Anti-adhesion correction, 15 L/min of Nominal gas value, 5 Gas factor, 140% Initial current, 0.3 s of Slope 1, 100% of Final current, 1.5 s of Initial time, 1 s of Final time and 1 s of Slope 2, corresponding to the sequence A1B1C3D2E1F2G3H1I3J3K3L3.
The ANOVA analysis allows to demonstrate the most influential parameters and their contribution to each dimension under study. For the bead width, the parameter Pre-gas flow as the greater influence, with 21.45% of contribution and was verified that Gas factor was the second most influent, with 12.43% of contribution. For the bead penetration, the Anti-adhesion correction parameter was the most influential, with a 14.25% of contribution and the Initial current as the second largest influence, with a contribution of 11.98%. Finally, for the bead reinforcement, the parameter Wire feed speed was the one that had the greatest influence, with 19.18% contribution and the initial time was the second most influential, with a contribution of 18.96%.

Acknowledgments

The authors gratefully acknowledge the funding by PORTUGAL2020: SI I&DT Individual—Call 16/SI/2015 (Proj. nº 9703): “Automatização de Processos de Soldadura de Estruturas Hiperestáticas em Ligas de Alumínio (APSEHAL)”.

References

  1. Toros, S.; Ozturk, F.; Kacar, I. Review of warm forming of aluminum–magnesium alloys. J. Mater. Process. Technol. 2008, 207, 1–12. [Google Scholar] [CrossRef]
  2. Lakshminarayanan, A.K.; Balasubramanian, V.; Elangovan, K. Effect of welding processes on tensile properties of AA6061 aluminium alloy joints. Int. J. Adv. Manuf. Technol. 2009, 40, 286–296. [Google Scholar] [CrossRef]
  3. Malarvizhi, S.; Balasubramanian, V. Effect of welding processes on AA2219 aluminium alloy joint properties. Trans. Nonferrous Metals Soc. China 2011, 21, 962–973. [Google Scholar] [CrossRef]
  4. Barnes, T.A.; Pashby, I.R. Joining techniques for aluminium spaceframes used in automobiles: Part I—Solid and liquid phase welding. J. Mater. Process. Technol. 2000, 99, 62–71. [Google Scholar] [CrossRef]
  5. Carle, D.; Blount, G. The suitability of aluminium as an alternative material for car bodies. Mater. Des. 1999, 20, 267–272. [Google Scholar] [CrossRef]
  6. Maddox, S.J. Review of fatigue assessment procedures for welded aluminium structures. Int. J. Fatigue 2003, 25, 1359–1378. [Google Scholar] [CrossRef]
  7. James, M.N.; Hughes, D.J.; Chen, Z.; Lombard, H.; Hattingh, D.G.; Asquith, D.; Yates, J.R.; Webster, P.J. Residual stresses and fatigue performance. Eng. Fail. Anal. 2007, 14, 384–395. [Google Scholar] [CrossRef]
  8. Tarng, Y.S.; Juang, S.C.; Chang, C.H. The use of grey-based Taguchi methods to determine submerged arc welding process parameters in hardfacing. J. Mater. Process. Technol. 2002, 128, 1–6. [Google Scholar] [CrossRef]
Figure 1. Bar fixing bracket on the robot table.
Proceedings 02 00426 g001
Figure 2. Sequence of the first six welding programs carried out.
Proceedings 02 00426 g002
Figure 3. Geometrical parameters measured in the weld bead.
Proceedings 02 00426 g003
Figure 4. Mean signal-to-noise ratio curves for bead width.
Proceedings 02 00426 g004
Figure 5. Mean signal-to-noise ratio curves for bead penetration.
Proceedings 02 00426 g005
Figure 6. Mean signal-to-noise ratio curves for bead reinforcement.
Proceedings 02 00426 g006
Table 1. Constant parameters for pulsed spray mode.
Deposition ModeWelding Current [A]Welding Voltage [V]Wire Feed Speed [m/min]Arc Travel Speed [m/min]
Pulsed spray13019.81115
Table 2. Parameters and levels which were used to optimize.
SymbolParameterRateUnitsLevels
123
1APre-gas flow[0–9.9]s0.10.50.9
2BPos-gas flow[0–9.9]s0.51.53.0
3CWire feed speed[1–22]m/min10.08.012.0
4DAnti-adhesion correction[−0.2–0–0.2]s−0.200.2
5ENominal gas value[off–5–30]l/min15.05.025.0
6FGas factor[Auto–1–10] Auto5.010.0
7GInitial current (ls)[0–200]%120.090.0140.0
8HSlope 1 (Sl1)[0.1–9.9]s0.30.11.0
9IFinak current (le)[0–200]%70.050.0100.0
10JInitial time (ts)[Desl–0–9.9]s0.70.51.5
11KFinal time (te)[0.1–9.9]s0.20.51.0
12LSlope 2 (Sl2)[0.1–9.9]s0.10.51.0
Table 3. ANOVA analysis for bead width.
SourceGDLSqQmF-ValueP-ValueContribution (%)
A2244,010122,0032.7800.10921.45
C291,70045,8501.0500.3878.06
D210,46052290.1200.8890.92
E217,56087810.2000.8221.54
F2141,42070,7111.6100.24712.43
G2109,20054,6021.2500.3299.60
H272,54036,2680.8300.4656.38
J212,6306,3140.1400.8681.11
Error10438,17043,817 38.51
Total261137,680 100.00
Table 4. ANOVA analysis for bead penetration.
SourceGDLSqQmF-ValueP-ValueContribution (%)
A291,03045,5170.8700.4478.10
C2105,45052,7271.0100.3989.39
D2160,14080,0721.5400.26114.25
E210,73053630.1000.9030.96
F268,23034,1140.6600.5406.07
G2134,58067,2891.2900.31711.98
H232,84016,4190.3200.7362.92
J20.0200.0120.0001.0000.00
Error10520,43052,043 46.32
Total261123,460 100.00
Table 5. ANOVA analysis for bead reinforcement.
SourceGDLSqQmF-ValueP-ValueContribution (%)
A20.6850.3422.3600.1458.36
C21.5720.7865.4100.02619.19
D20.8900.4453.0600.09210.85
E20.1340.0670.4600.6431.64
F20.9780.4893.3700.07611.93
G20.5310.2651.8300.2116.48
H20.3990.1991.3700.2974.87
J21.5540.7775.3500.02618.97
Error1014520.145 17.72
Total268194 100.00
Publisher’s Note: MDPI stays neutral with regard to jurisdictional claims in published maps and institutional affiliations.

