Comparison of Non-Destructive Techniques for Impact Damage Area Assessment in Aramid/Epoxy Composites †
by
 , and
, and
Andrea Manes
1,* ,
,
Stephanie Nunes
2,
Álvaro González-Jiménez
1,
Sandro Amico
2 and
Marco Giglio
1 1
Politecnico di Milano, Department of Mechanical Engineering, 20156 Milano, Italy
2
PPGE3M, Federal University of Rio Grande do Sul, Porto Alegre 91501-970, Brazil
*
Author to whom correspondence should be addressed.
†
Presented at the 18th International Conference on Experimental Mechanics (ICEM18), Brussels, Belgium, 1–5 July 2018.
Proceedings 2018, 2(8), 437; https://doi.org/10.3390/ICEM18-05320
Published: 11 June 2018
(This article belongs to the Proceedings of The 18th International Conference on Experimental Mechanics)
Abstract
:This research focused on the assessment of the damaged area on aramid/epoxy composites subjected to high velocity impact. Digital X-ray radiography and active pulsed thermography techniques were used for performing post-mortem analysis of the impacted specimens (8 to 28 aramid layers). Two types of projectiles were used: 9 mm Luger FMJ and 0.357 Magnum FMJ. Two types of dedicated algorithms were developed to post-process the thermograms obtained and the results are compared with the damaged diameter measured directly on the X-ray radiographs. The output of the three methods are therefore compared and discussed.
1. Introduction
Composites structures can be subjected to different types of impact events (i.e., low and high velocity) which might generate complex damage involving matrix cracking, fiber breakage and shear-out, delamination, interfacial debonding and lamina splitting [1,2]. The detection and monitoring of this damage might be critical for an optimum and efficient material design. Consequently, a technique able to perform this task in a non-invasive way becomes necessary. Among the Non-Destructive Testing and Evaluation (NDT&E) techniques, digital X-ray radiography and especially infrared thermography (IRT) can provide a powerful and quick way for assessing damage in impacted composites. Digital X-ray radiography takes advantage of the dissimilar absorption of X-ray passing through damaged areas of the specimens so as to obtain a projected image with variable contrast. On the other hand, in IRT, an infrared camera is used to record the thermal radiation emitted by the surface of a specimen. It relies on local variation of thermal conductivity due to the presence of defects [3]. Recently, Gholizaded [4], Yang et al. [5] and Zhang et al. [6], have studied IRT, in comparison with others NDT techniques and concluded that it presents advantages such as high-speed, low-cost and non-contact analysis, large inspection area and the need to access only one side of the part for inspection. Its drawbacks include, lack of clarity of deep defects, direct measurement of the surface only (2D images) and non-uniform heating. In the present work, the damage of Kevlar/epoxy composites, with 8, 13, 18, 23 and 28 reinforcement layers, subjected to a ballistic event (with two types of projectiles, 9 mm Luger and 0.357 Magnum) is analyzed using digital X-ray radiography and active pulsed thermography to enable comparison between the responses.
2. Materials and Methods
The laminates used in the present research were manufactured by vacuum infusion processing using AR 260/AH 260 epoxy resin and woven Kevlar® 29 fabrics, with tightly spaced quilting. The numbers of layers selected were: 8, 13, 18, 23 and 28. Dimensions of the specimens were 270 × 270 mm2 and four holes were drilled on the corners to allow attachment of the specimen to a frame (for impact testing), reducing the effective impact area to 210 × 210 mm2. A ballistic test was performed according to the European standard EN 1522. For the 9 mm Luger projectile (mass: 7.41 g), a speed of 400 ± 10 m/s was used while for the 0.357 Magnum (mass: 10.24 g), the velocity was 430 ± 10 m/s. A summary of all tested specimens along with the impact and residual velocities is shown in Table 1. The absorbed energy was calculated as the kinetic energy difference related to the entrance (impact) and exit (residual) velocities of the projectile.
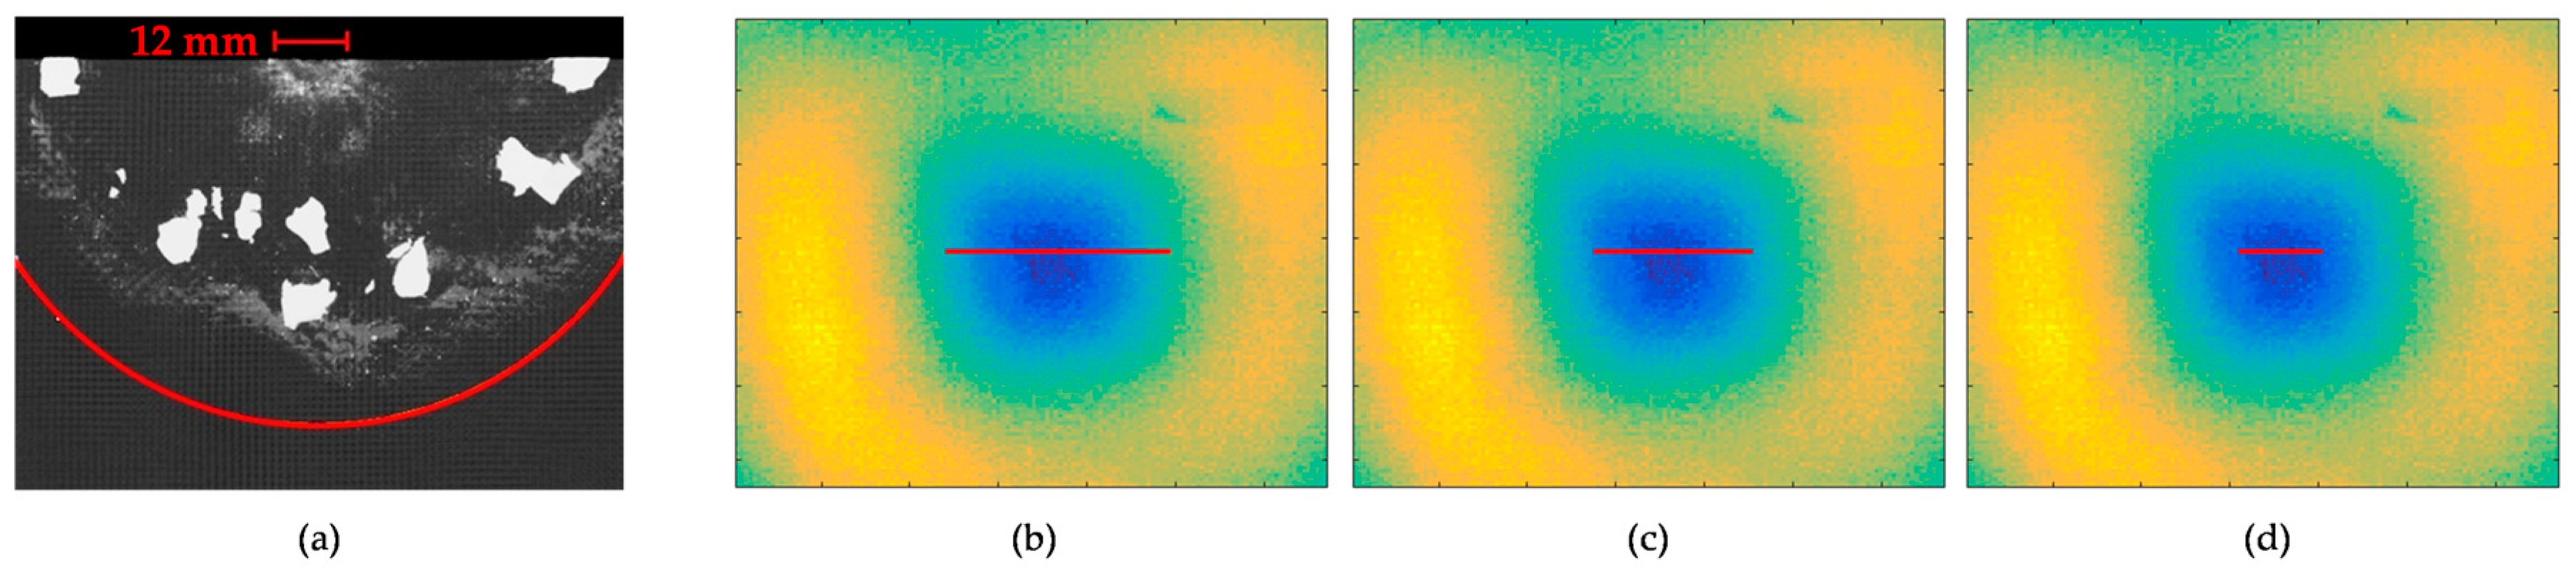
Regarding the post-mortem analysis, digital X-ray radiographs of the impacted plates were obtained using ×25 model equipment from North Star Imagind Inc, Rogers, Minnesota, USA. The specimens were cut (in half) in order to fit into the X-ray machine. Three cuts were performed, one horizontally where the projectile impacted and two vertically on the sides. The final dimensions of the samples were 190 × 135 mm2. Fiji software was used for post-processing the radiographs. When the projectile hit the specimen, whether it passes through or not, it leaves some residues (i.e., gun powder or metal fragments) between layers. These residues present a different contrast compared to the material itself allowing their identification on the radiographs. In the present work, the profile which the residues formed and the boundaries of the delaminated area were considered the actual profile of the damaged area. Therefore, the area which contains all the residues was manually selected with Fiji. A circular area was considered and all the pixels within this zone were considered as damage, yielding an equivalent damaged diameter for each specimen. Knowing the resolution of the used X-ray machine, the damaged diameter can be obtained. Figure 1a shows an example of the process followed. For the X-ray, only one value of damaged diameter was obtained. Post-mortem analysis was also carried out using active pulsed-heating thermography method. The thermograms were taken with a Fluke Ti400 infrared camera from Fluke Corporation, Everett, Washington, USA. The thermograms were taken at a constant heating rate but at a non-constant sampling rate in order to reduce the number of thermograms to process. The heating source and the infrared camera were placed on the opposite surfaces of the specimen and the transmission technique was used [7]. Smart View software version 4.3 was employed to obtain the temperature values from the thermograms and Matlab was selected for post-processing.
Two experimental methods were developed to evaluate damaged area from the thermogram. The first method is based on the fact that the damaged area shows lower heating rate than the unaffected one [8]. In the second method, for each thermogram in each time (i.e., frame) the temperature differences between damaged and undamaged areas is exploided so as to delimit the damaged area.
In the Heating Rate Method, in order to make the procedure independent from the room temperature, normalization, shown in Equation (1), was applied.
being a matrix which contains the values of temperature increment for each pixel on time i-th, the actual termperature matrix i-th time, the temperature matrix for time 1 (i.e., the first value of time), and n the number of frames taken for a particular specimen. Once the normalization process was performed, the temperature-time curve of a non-damaged specimen was studied. For each laminate thickness (i.e., a particular number of layers), a representative number of pixels was selected and linear regression fitting of the temperature-time curve was carried out for each of them. The slope of this linear regression line was considered as the heating rate: each pixel has a time independent value of heating rate. The values of heating rates were considered to be described with a Gaussian distribution. Thus, for a particular thickness, the mean () and the standard deviation (σ) parameters were considered a good representation of the normal heating rate for the undamaged material. Once the heating behaviour of the undamaged material had been experimentally characterized, a center line of pixels was taken from the impacted (damaged) materials’ thermographies. After that, the heating rate for each pixel () of the selected horizontal line was computed with the aforementioned method. Finally, if Equation (2) was met, the i-th pixel was considered to be damaged
being the number of pixels of the selected line. This procedure is illustrated in Figure 1b–d. Three values of damaged diameter were obtained for looking for heating-rate lower with respect the 0.16, 0.023 and 0.0013 percentiles of heating rate, corresponding to m = 1, m = 2 and m = 3, respectively. The graphical representation of the damaged diameter for each m value is depicted in Figure 1b–d.
A second method was developed on Matlab and applied to the thermographies, called here the Temperature Difference Method. The method here presented is valid only for active pulsed transmission thermography. The first step was again implementing the normalization method, which was applied to both the undamaged and damaged specimens’ areas. In order to subtract the undamaged normal heating effect (i.e., the heating process of the undamaged material), the temperature matrix of the undamaged thermograms was subtracted from the temperature matrix of the damaged thermograms for the same value of time, as expressed in Equation (3).
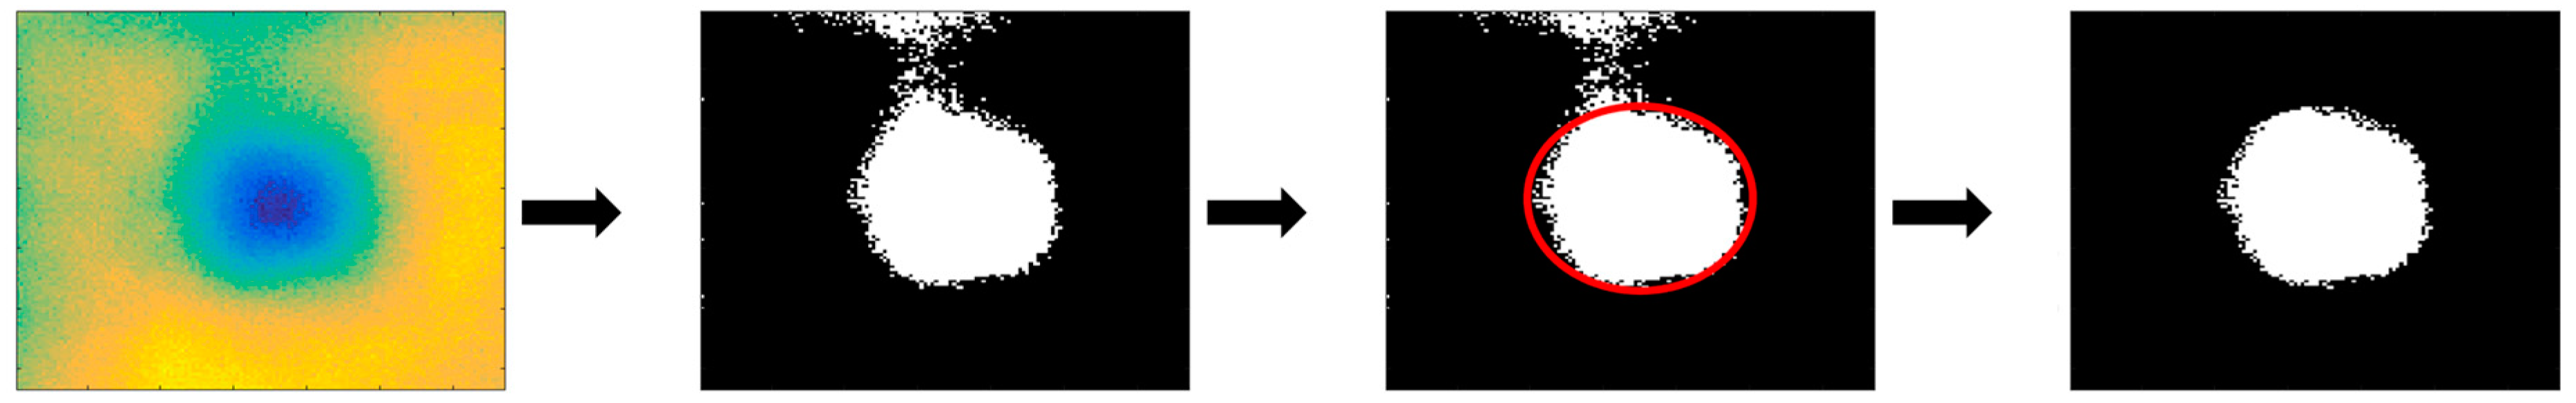
being and the normalized temperature increment matrices for the damaged and undamaged specimen’s thermography, respectively, taken at the i-th time, and the temperature increment matrix with the normal heating effect subtracted. If a certain pixel from the damaged thermogram is heated in the same way that the counterpart pixel on the undamaged thermogram, for this particular pixel is zero. Consequently, all pixels with lower than zero were considered to refer to damaged areas. A new image was then built from each thermogram: if the pixel is depicted as white, or else the pixel was depicted as black. A circular-like damaged area was expected, however, due to the inherent variability of the thermography process, some pixels were mistakenly marked as damaged (top part of second and third images in Figure 2). In order to solve this issue, a circular area was selected (red circle on the third image of Figure 2) and all the white pixels out of the red circle were eliminated. The final step was counting the white pixels on the treated image (last image of Figure 2). Assuming a circular damaged area, the equivalent diameter was obtained for comparison with the other methods.
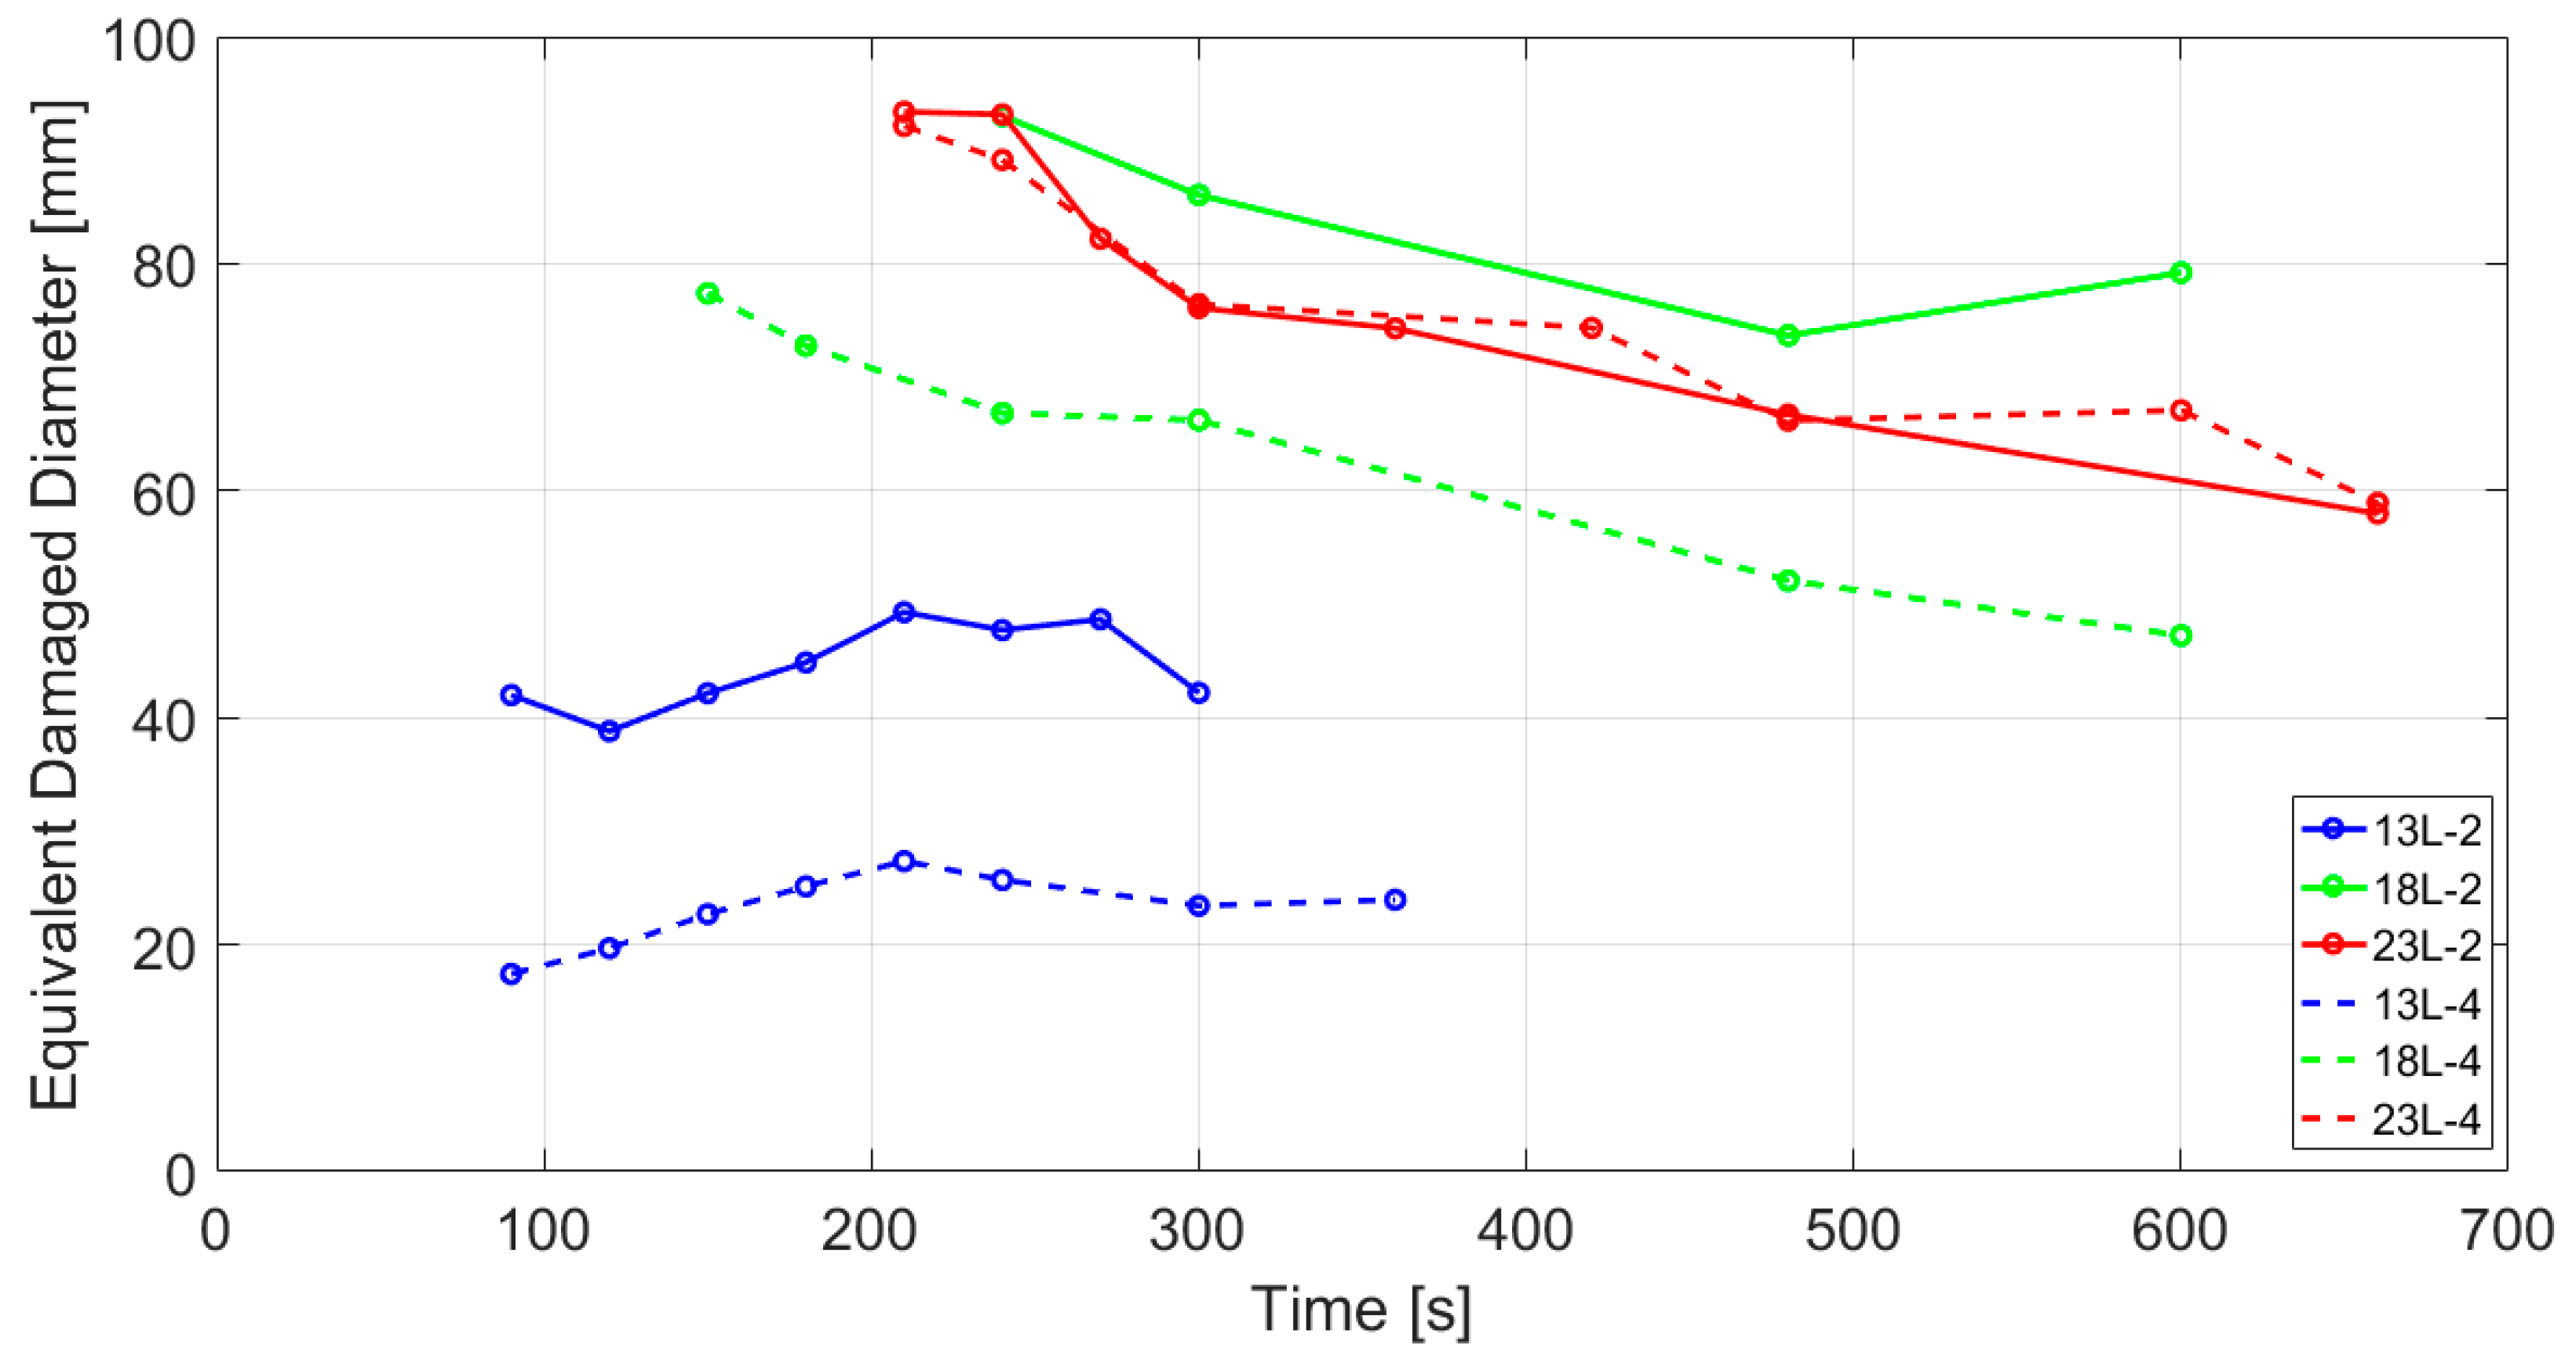
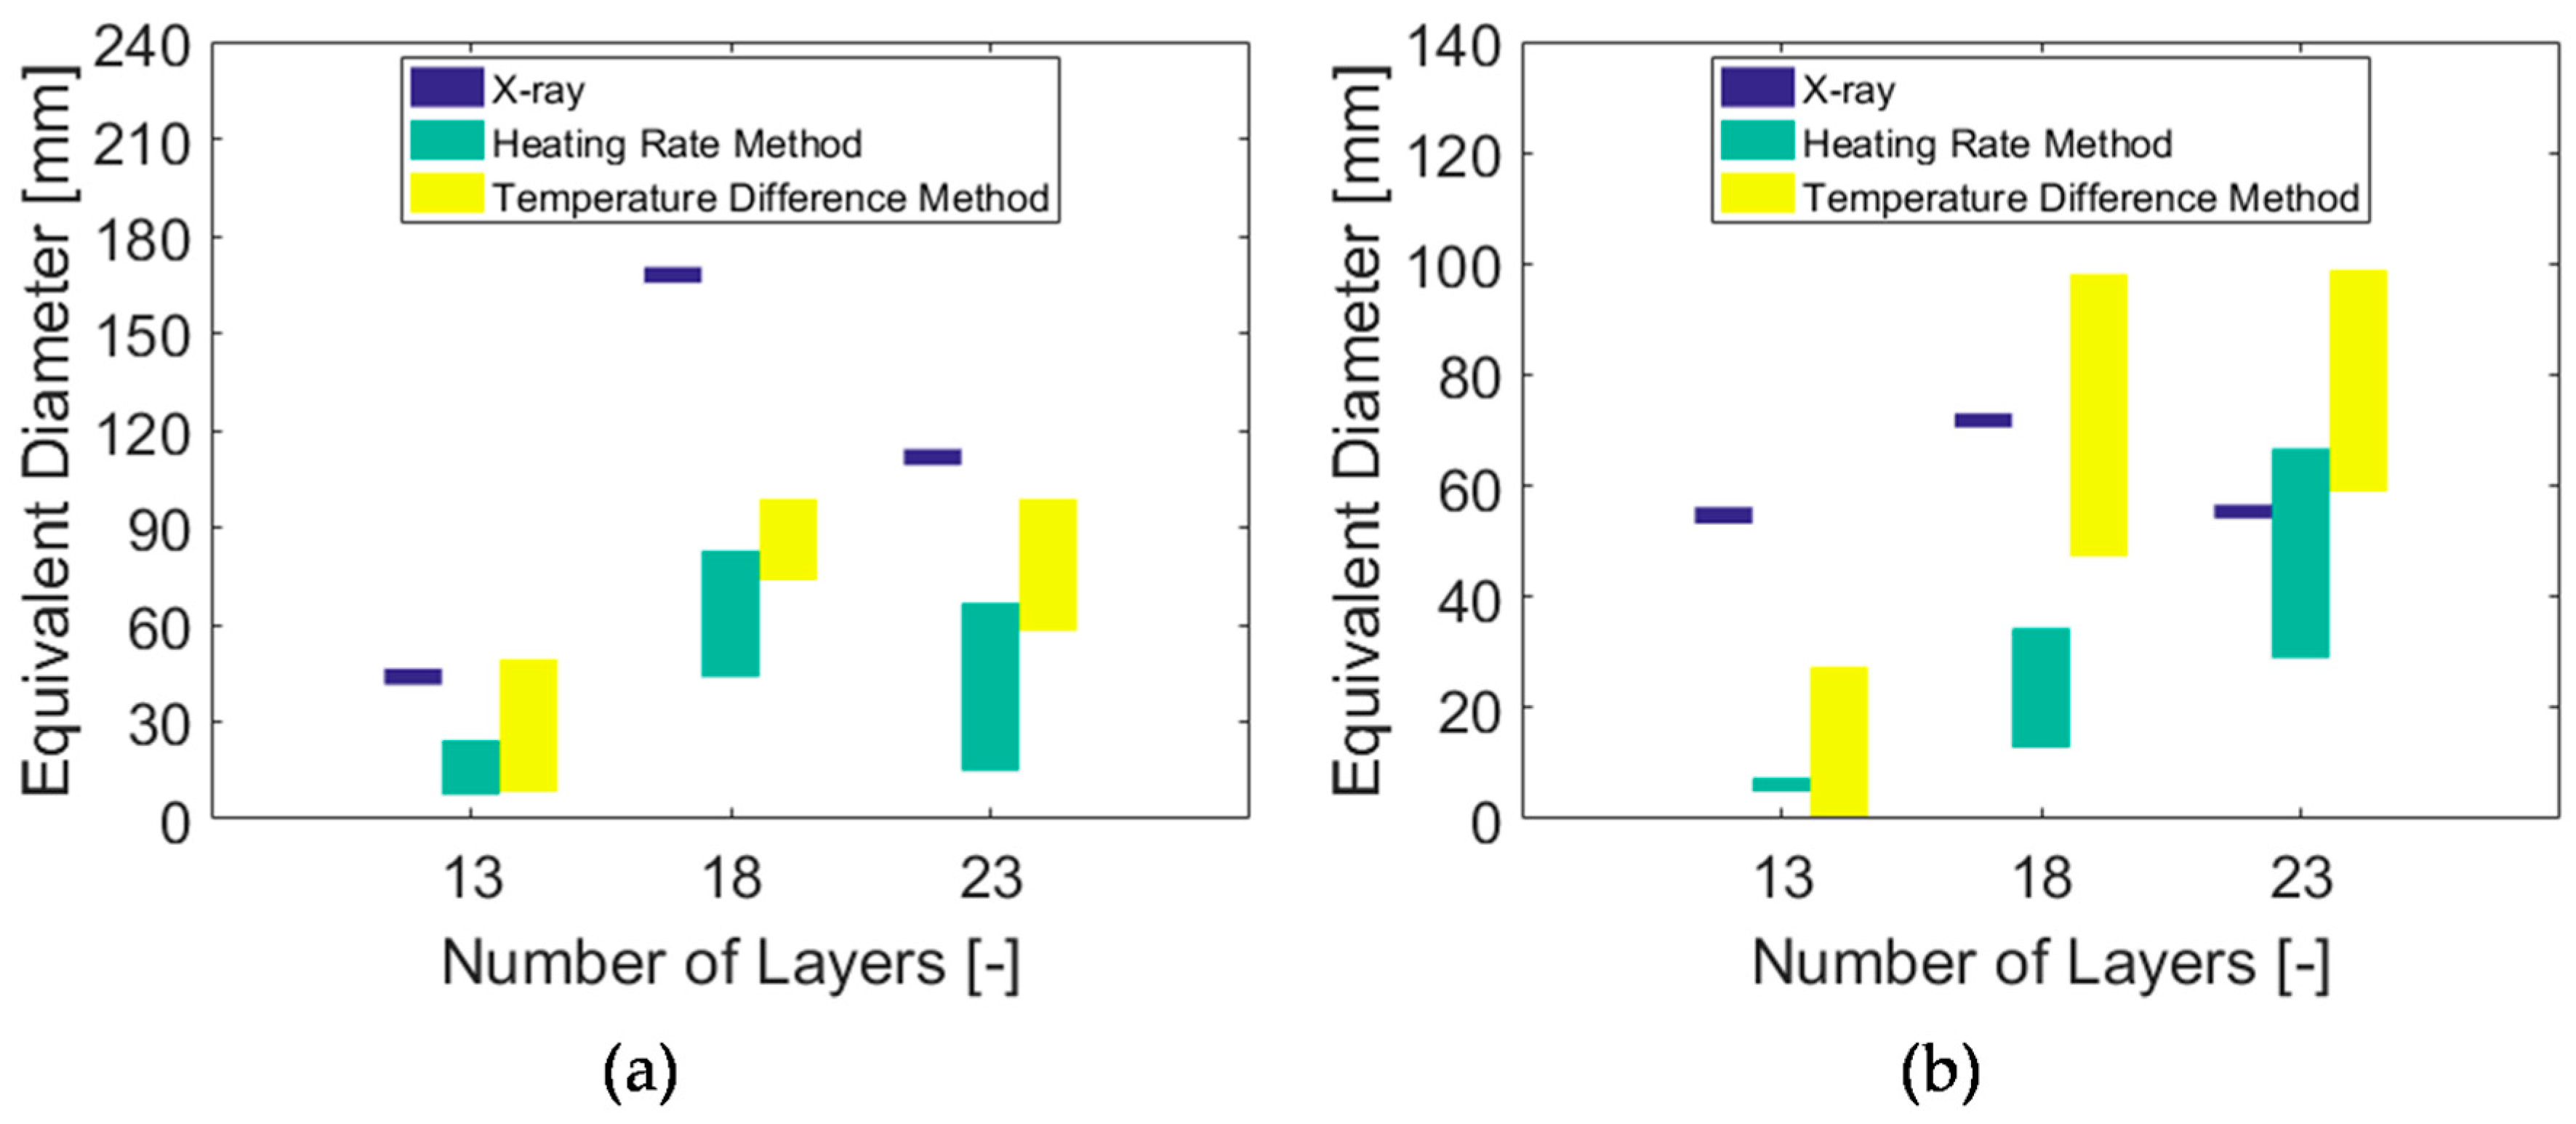
This method was carried out for all thicknesses, both types of projectiles and all time values. The results of equivalent damaged diameter evolution with time are shown in Figure 3. In Figure 4, they were plotted as a yellow range the maximum and minimum damaged diameter values obtained through this technique (i.e., maximum and minimum values of the curves shown in Figure 3).
3. Results and Discussion
Figure 4 shows the main findings of this work. Regarding the X-ray results, a large increase in damaged area was noticed for the specimens which stopped the bullet (18 and 23 layers) in the case of 9 mm bullet (Figure 4a). This is explained by the greater amount of absorbed energy, which caused a larger delamination area, since this is the main mechanism of energy absorption in aramid fiber composites, rather than other failure mechanisms (i.e., fibre breakage). For both types of projectiles, it was detected that the largest damage area was reached with 18 layers.
Regarding the Heating Rate Method, the values of equivalent damaged diameters, for m = 1 (maximum) to m = 3 (minumum) are represented as a green range in Figure 4. With respect to the 9 mm projectile, it can be seen that the Heating Rate method is able to mimic the trend shown in the X-ray results (i.e., largest damaged area corresponding to 18 layers), even though the values were higher. The largest difference observed for the 18-layer specimen might be justified considering that the damaged area reached the edges of the composite, and the boundary conditions specially affected this sample. Also, in some cases, the residues left by the projectile were minimum and therefore it was difficult to accurately delineate the damaged diameter. This occurred mainly for the 13 layers and the 23 layers impacted with the 0.357 Magnum. This method was unable to detect any damaged diameter for the 13 layers impacted with the 0.357 projectile for m = 2 and m = 3. Consequently, only one value and not a range is reported in this case. Speaking about the Temperature Difference Method, in Figure 3, continuous lines correspond to the 9 mm Luger (labeled “_2” in Figure 3) whereas the dashed lines correspond to the specimens impacted with the 0.357 Magnum projectile (labeled “_4” in Figure 3). For the 18 and 23 layers specimens, the entire image was depicted as damage up to a particular value of time. Conversely, for the 13 layers, no damage was initially found. These misleading points were eliminated from the analysis and disregarded in Figure 4. This technique worked as expected for the 13 layers specimens (blue curves in Figure 3) since the plateau-like area could be a good approximation of the diameter of the damaged area. Regarding the curves for the other numbers of layers, it can be said that the trend shown in Figure 3 for the X-ray method is well represented, since the largest damage (i.e., highest curve) is produced for the 18 layers impacted with the 9 mm projectile. However, the Temperature Difference technique tells that the damage for the 23 layers specimens (red curves in Figure 3) is approximately the same. This is in good agreement with the Heating Rate Method but not with the X-ray results since, for the latter, the 23 layers impacted with 9 mm projectile showed the largest damage. This may be justified by the problem in delimitating the damaged area as explained above. The same issue, but at a lower scale, was found for the 13 layers specimen impacted with the 0.357 projectile since, for both thermography techniques, greater damage was caused by the 9 mm projectile and not by the 0.357 as found in the X-ray analysis. For all the techniques used, the 13 layers specimens were the ones with lower damage and, in fact, this is well represented in Figure 3. Overall, the round nose projectile (9 mm) was observed to yield more damage than the conical tip one (0.357). This is in accordance with Miles [9] where it was stated that due to the larger contact surface area of round nose projectiles, the projectile is subjected to more resistance upon impact, being the main composite’s energy dissipation method delamination rather than shearing of the fibres.
4. Conclusions
Qualitatively speaking, the results obtained with the thermography techniques are in good agreement with the digital radiography method since the same damage trends are identified with the exception of the 23 layers specimen impacted with the 0.357 Magnum projectile. Also, the Heating Rate and the Temperature Difference methods were in good agreement. With respect to quantitative results, they were generally good for the completely perforated specimens (i.e., 13 layers for both projectiles, 18 and 23 for the 0.357 Magnum) but not that good for the 18 and 23 layers specimens impacted with the 9 mm projectile, and the largest difference was found for the 18 layers impacted with the 9 mm.
Author Contributions
A.M. and M.G. conceived the impact experiments; S.N. and S.A. produced the specimens and performed thermography, A.M., S.A. and Á.G.-J. performed the X-Ray and analyzed the data.
Conflicts of Interest
The authors declare no conflict of interest.
References
- Meola, C.; Carlomagno, G.M. Impact damage in GFRP: New insights with infrared thermography. Compos. Part A 2010, 41, 1839–1847. [Google Scholar] [CrossRef]
- Safri, S.N.A.; Sultan, M.T.H.; Yidris, N.; Mustapha, F. Low velocity and high velocity impact test on composite materials—A review. Int. J. Eng. Sci. 2014, 3, 50–60. [Google Scholar]
- Jolly, M.R.; Prabhakar, A.; Sturzu, B.; Hollstein, K.; Singh, R.; Thomas, S.; Foote, P.; Shaw, A. Review of Non-destructive Testing (NDT) Techniques and their applicability to thick walled composites. Procedia CIRP 2015, 38, 129–136. [Google Scholar] [CrossRef]
- Gholizadeh, S. A review of non-destructive testing methods of composite materials. Procedia Struct. Integr. 2016, 1, 50–57. [Google Scholar] [CrossRef]
- Yang, B.; Huang, Y.; Cheng, L. Defect detection and evaluation of ultrasonic infrared thermography for aerospace CFRP composites. Infrared Phys. Technol. 2013, 60, 66–173. [Google Scholar] [CrossRef]
- Zheng, K.; Chang, Y.; Wang, K.; Yao, Y. Improved non-destructive testing of carbon fiber reinforced polymer (CFRP) composites using pulsed thermograph. Polym. Test. 2015, 46, 26–32. [Google Scholar] [CrossRef]
- Triska, V.; Flasar, O. Non-destructive inspection of composite specimen with integrated lightning protection using pulsed thermography. In Proceedings of the ICMT 2017—6th International Conference on Military Technologies, Brno, Czech Republic, 31 May–2 June 2017; pp. 542–547. [Google Scholar] [CrossRef]
- Chrysafi, A.P.; Athanasopoulos, N.; Siakavellas, N.J. Damage detection on composite materials with active thermography and digital image processing. Int. J. Therm. Sci. 2017, 116, 242–253. [Google Scholar] [CrossRef]
- Mines, R.A.W.; Roach, A.M.; Jones, N. High velocity perforation behaviour of polymer composite laminates. Int. J. Impact Eng. 1999, 22, 561–588. [Google Scholar] [CrossRef]
Figure 1.
Equivalent damaged diameter for (a) X-ray technique (b) heating rate below 0.16 percentile (m = 1), (c) heating rate below 0.023 percentile (m = 2) and (d) 0.0013 percentile (m = 3). Image (a) corresponds with the specimen 23L_1 while images (b–d) correspond with specimen 18L_4.
Figure 1.
Equivalent damaged diameter for (a) X-ray technique (b) heating rate below 0.16 percentile (m = 1), (c) heating rate below 0.023 percentile (m = 2) and (d) 0.0013 percentile (m = 3). Image (a) corresponds with the specimen 23L_1 while images (b–d) correspond with specimen 18L_4.

Figure 2.
Damaged area identification procedure with the Temperature Difference Method.

Figure 3.
Equivalent damaged diameter area time evolution for the Temperature Difference Method.

Figure 4.
Comparison of the quantitative values of equivalent damaged diameter for the three techniques presented. (a) specimens impacted with the 9 mm projectile and (b) with the 0.357 projectile.
Figure 4.
Comparison of the quantitative values of equivalent damaged diameter for the three techniques presented. (a) specimens impacted with the 9 mm projectile and (b) with the 0.357 projectile.


Table 1.
Specimens subjected to ballistic impact.
| ID | # Layers | Projectile | Impact Velocity [m/s] | Residual Velocity * [m/s] | Absorbed Energy [J] |
|---|---|---|---|---|---|
| 8L_1 | 8 | 9 mm Luger | 404.32 | 372.54 | 91.50 |
| 8L_2 | 397.35 | 368.41 | 82.13 | ||
| 13L_1 | 13 | 397.25 | 282.91 | 288.21 | |
| 13L_2 | 402.91 | 277.42 | 316.40 | ||
| 18L_1 | 18 | 399.78 | 77.24 | 570.20 | |
| 18L_2 | 397.55 | 0 | 585.72 | ||
| 18L_5 | 400.71 | 0 | 595.07 | ||
| 23L_1 | 23 | 403.39 | 0 | 603.05 | |
| 23L_2 | 401.78 | 0 | 598.25 | ||
| 8L_3 | 8 | 0.357 Magnum | 440.51 | 417.76 | 99.97 |
| 8L_4 | 435.80 | 411.79 | 104.20 | ||
| 13L_3 | 13 | 432.44 | 367.69 | 265.26 | |
| 13L_4 | 439.13 | 379.86 | 248.53 | ||
| 18L_3 | 18 | 433.9 | 296.41 | 514.10 | |
| 18L_4 | 435.36 | 300.33 | 508.62 | ||
| 23L_3 | 23 | 435.79 | 218.99 | 726.82 | |
| 23L_4 | 436.78 | 40.99 | 968.17 | ||
| 28L_1 | 28 | 432.83 | 0 | 959.19 |
* Zero residual velocity means that the projectile was arrested.
Publisher’s Note: MDPI stays neutral with regard to jurisdictional claims in published maps and institutional affiliations. |
© 2018 by the authors. Licensee MDPI, Basel, Switzerland. This article is an open access article distributed under the terms and conditions of the Creative Commons Attribution (CC BY) license (https://creativecommons.org/licenses/by/4.0/).
Share and Cite
MDPI and ACS Style
Manes, A.; Nunes, S.; González-Jiménez, Á.; Amico, S.; Giglio, M. Comparison of Non-Destructive Techniques for Impact Damage Area Assessment in Aramid/Epoxy Composites. Proceedings 2018, 2, 437. https://doi.org/10.3390/ICEM18-05320
AMA Style
Manes A, Nunes S, González-Jiménez Á, Amico S, Giglio M. Comparison of Non-Destructive Techniques for Impact Damage Area Assessment in Aramid/Epoxy Composites. Proceedings. 2018; 2(8):437. https://doi.org/10.3390/ICEM18-05320
Chicago/Turabian StyleManes, Andrea, Stephanie Nunes, Álvaro González-Jiménez, Sandro Amico, and Marco Giglio. 2018. "Comparison of Non-Destructive Techniques for Impact Damage Area Assessment in Aramid/Epoxy Composites" Proceedings 2, no. 8: 437. https://doi.org/10.3390/ICEM18-05320