Phenological Monitoring of Paddy Crop Using Time Series MODIS Data †


1
Department of Civil Engineering, SRM Institute of Science and Technology, Chennai, Tamil Nadu 603203, India
2
Department of Geography, School of Earth Science, Bharathidasan University, Tiruchirappalli, Tamil Nadu 620024, India
3
Photogrammetry and Remote Sensing Department, Indian Institute of Remote Sensing, ISRO, Dehradun, Uttarakhand 248001, India
4
Department of Geography, School of Earth Sciences, Central University of Tamil Nadu, Thiruvarur, Tamil Nadu 620024, India
*
Author to whom correspondence should be addressed.
†
Presented at the 2nd International Electronic Conference on Geosciences, 8–15 June 2019; Available online: https://iecg2019.sciforum.net/.
Proceedings 2019, 24(1), 19; https://doi.org/10.3390/IECG2019-06205
Published: 5 June 2019
(This article belongs to the Proceedings of The 2nd International Electronic Conference on Geosciences)
Abstract
:Rice is an important staple food crop worldwide, especially in India. Accurate and timely prediction of rice phenology plays a significant role in the management of water resources, administrative planning, and food security. In addition to conventional methods, remotely sensed time series data can provide the necessary estimation of rice phenological stages over a large region. Thus, the present study utilizes the 16-day composite Enhanced Vegetation Index (EVI) product with a spatial resolution of 250 m from the Moderate Resolution Imaging Spectroradiometer (MODIS) to monitor the rice phenological stages over Karur district of Tamil Nadu, India, using the Google Earth Engine (GEE) platform. The rice fields in the study area were classified using the machine learning algorithm in GEE. The ground truth was obtained from the paddy fields during crop production which was used for classifying the paddy grown area. After the classification of paddy fields, local maxima, and local minima present in each pixel of time series, the EVI product was used to determine the paddy growing stages in the study area. The results show that in the initial stage the pixel value of EVI in the paddy field shows local minima (0.23), whereas local maxima (0.41) were obtained during the peak vegetative stage. The results derived from the present study using MODIS data were cross-validated using the field data.
1. Introduction
A major stable food crop for the world’s population is Oryza sativa, which provides nearly 75% of daily calorie intake for people living mainly in Asian countries. The Asian continent produces nearly 90% of total worldwide rice production [1]. Rice is of utmost importance in countries like India, China, Indonesia, and Thailand, where the crop has a profound influence on the livelihood of many farmers [2]. Reliable and timely monitoring and mapping of rice is of global importance [3]. Mapping of paddy crops helps in the estimation of water supply required for irrigation, net production, and yield estimation [4]. In spite of being a stable food crop around the world, paddy croplands account for the release of about 10% of greenhouse gases [5]. Monitoring of paddy crops in a country also aids in assessing national food security for planning and sustainable management of available resources [6]. A real time monitoring of paddy production in a region or a whole country can be carried out through remote sensing techniques [7]. Various optical and Synthetic Aperture Radar datasets include those of the Moderate Resolution Imaging Spectroradiometer (MODIS) on board the Terra and Aqua satellites, Sentinel-1, ALOS PALSAR, RADARSAT, Landsat, and EnviSat. The paddy croplands can be extracted easily as the cropland is filled with stagnant water during sowing and transplantation. Use of spectral indices such as the Normalized Difference Vegetation Index (NDVI) and Enhanced Vegetation Index (EVI) which are very sensitive to changes in water and vegetation can help in differentiating normal crops and paddy crops. This aids in the extraction of paddy fields. Numerous studies have been carried out in past decades for monitoring of paddy crop using MODIS data [8,9,10]. Recently, after the arrival of various cloud platforms such as Google Earth Engine (GEE), the analysis time and data acquiring space have been greatly reduced. Various crop monitoring studies at various levels can be carried out with the massive computational power of GEE. A large number of Earth Observations (EOs) including those of Landsat, MODIS, Sentinel and many more data products are available for open access, and can be used with code written using JavaScript. The present study aims at utilizing the massive computational power of Google Earth Engine (GEE) cloud platform for monitoring the paddy crop using the MODIS time series data over the Karur district of Tamil Nadu.
2. Study Area
Karur district is selected as a study area, located in the Indian state of Tamil Nadu between 10.95° N latitude and 78.08° E longitude. Black and red soils are the two major soil types found in the study area (Figure 1), which is suitable for agriculture practices. Temperature ranges between 39 °C and 17 °C. The climatic condition is warmer in April to June and colder in December to January. The average rainfall of this region is 590–660 mm. During the Northeast Monsoon, heavy rainfall occurs in the month of October to December. The major agricultural crops grown are rice, cotton, sugarcane, and oil seed, while horticultural crops are banana, coconut, betel, and mango. System of Rice Intensification (SRI) techniques are commonly practiced in this study region for obtaining the maximum yield. The rice growing seasons in the study area are Samba (August), Kuruvai (June to July), Late Samba (September to October), and Thaladi (October to November). Depending upon the duration, the variety of rice varies. They are of short duration (100–120 days), medium duration (121–160 days), and long duration (141–160 days).
3. Dataset
The MODIS Terra/Aqua 16-day Vegetation Indices L3 250 m (MOD13Q1 and MYD13Q1) acquired from National Aeronautics and Space Administration (NASA) are used for mapping rice crop in the month of September to December in the Karur district of Tamil Nadu. This data set consists of two bands: the Normalized Difference Vegetation Indices (NDVI) and Enhanced Vegetation Indices (EVI) with a spatial resolution of 250 m.
4. Methodology
This study utilized the GEE cloud platform, where all the processing was carried out. GEE is a cloud-based platform that is used for processing and computing huge geospatial data. Both MODIS Terra/Aqua EVI band data (time series) for the period of September to October were acquired and the collected datasets for the study area were mosaicked (Figure 2).
The EVI is utilized in this study to explore the temporal response from paddy fields. The non-rice growing area like water, building and forest were masked from the EVI time series data. After masking out the non-rice growing area, the phenology-based approach was utilized for classifying the rice fields in the study area. Heading stage of rice was identified as the maximum value in EVI time series data. In this study, in some cases the minimum MODIS EVI value does not match in the transplanting date as the weeds present in the rice fields were not properly removed before planting. Thus the effect of weed and grass outside the rice field provide a decrease of value in MODIS 250-m pixels. Therefore, in this study the heading stage with maximum EVI value was used to identify rice phenology throughout the MODIS time series data (Figure 3).
5. Results and Discussion
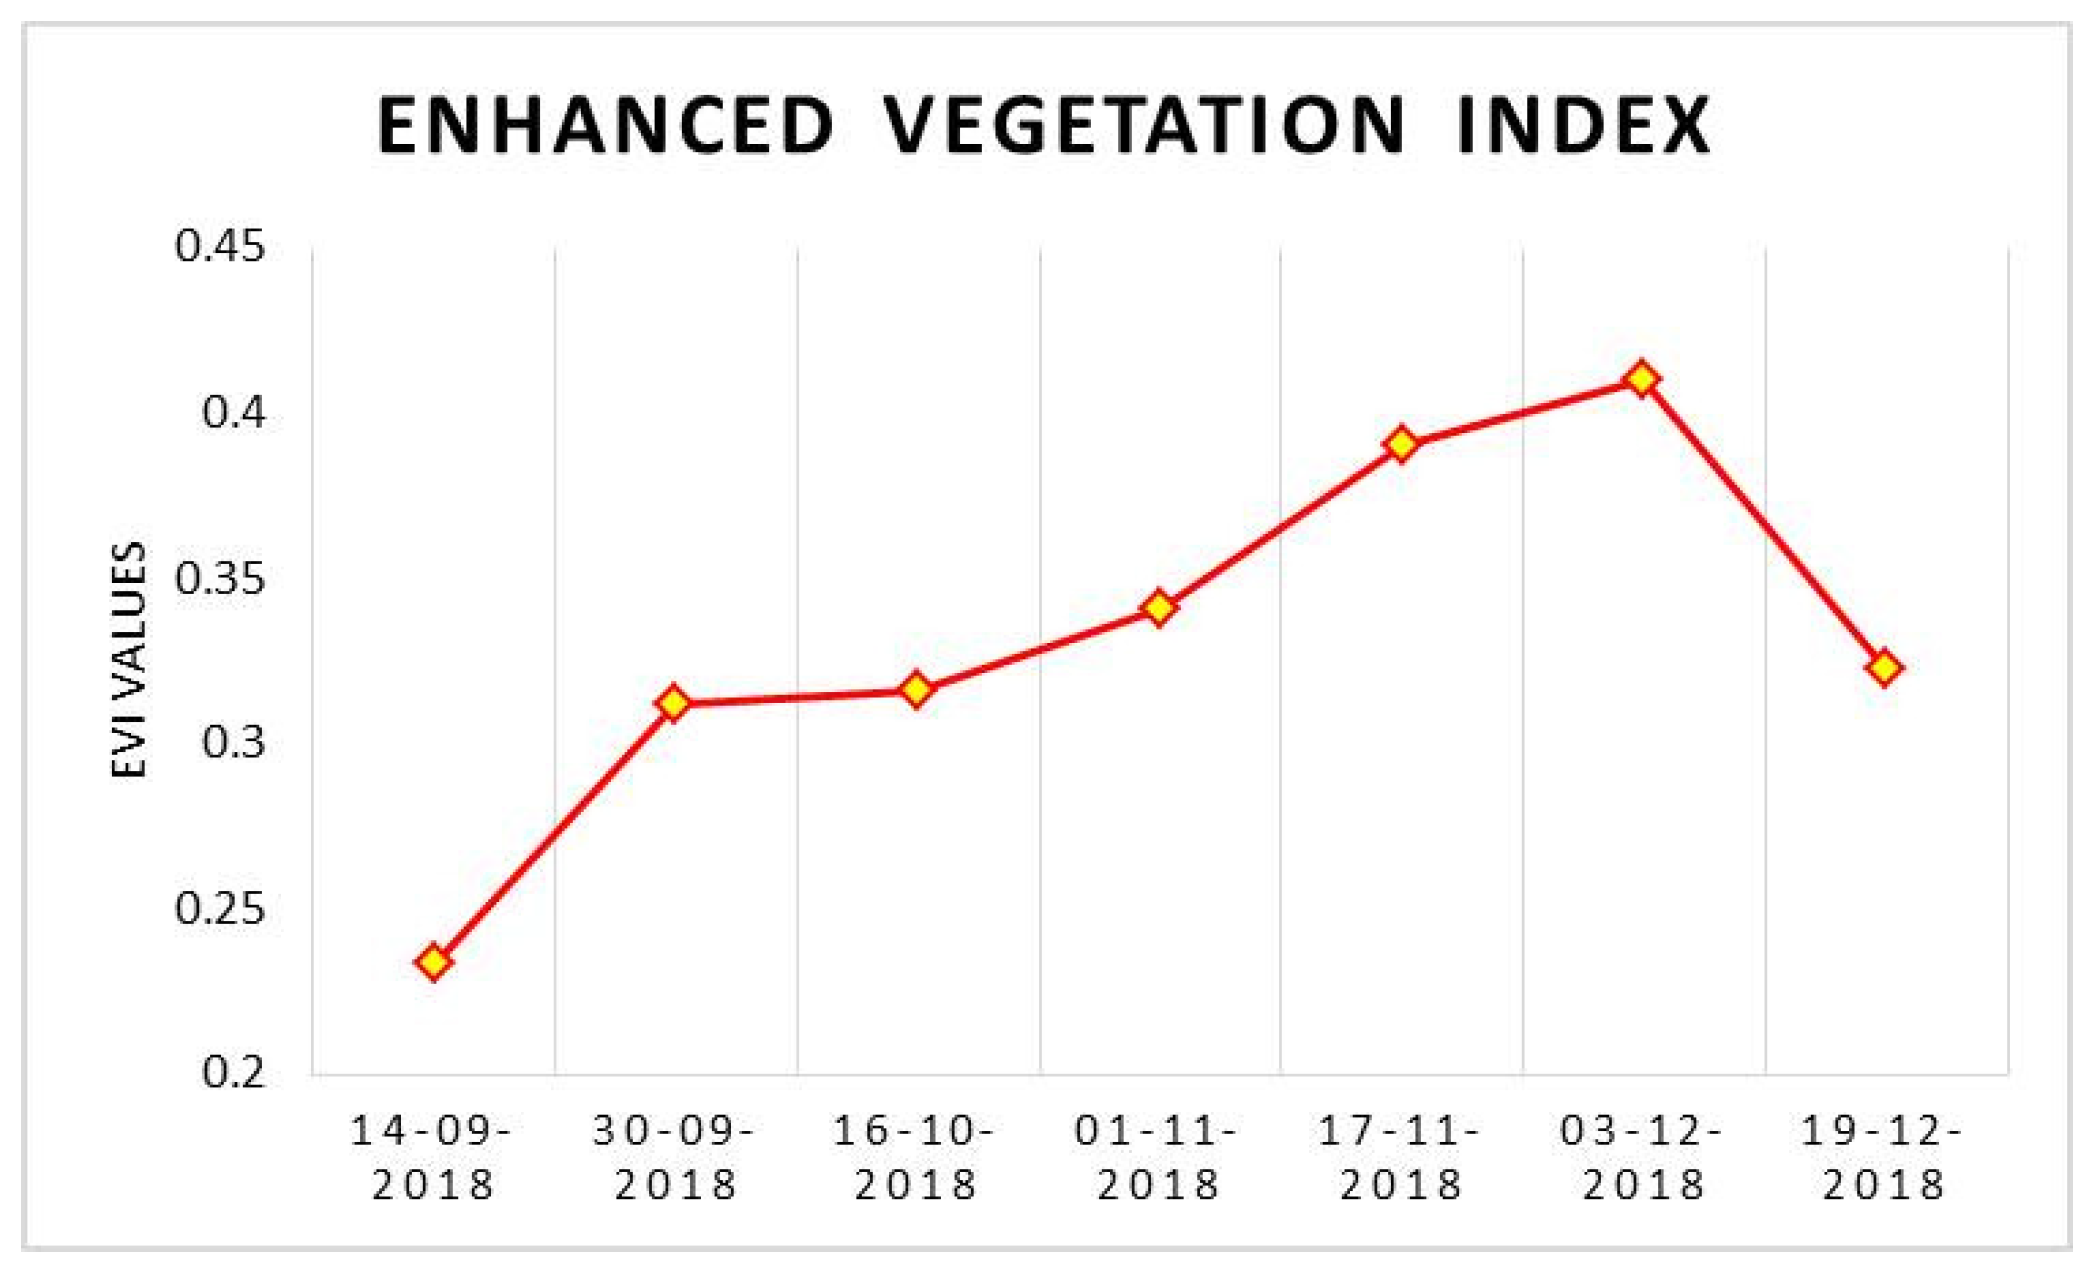
In this study, three phenological stages of rice were defined by change observed in EVI time series. The three phenological stages are Start of Season (SOS), Peak of Season (POS), and End of Season (EOS). SOS (September) denotes the time when the rice crop started to grow; it relates the date of flooding before transplanting. POS describes the heading stage, when the crop attains its maximum vegetation stage. At EOS (December), the crop is mature, which indicates the harvest stage. Phenological stages of rice and their corresponding EVI values are shown in the Figure 4.
The lowest EVI value noted in the MODIS time series during pre-planting or flooding stage (September 1–15) the values were 0.3, moving towards negative. After transplantation, the EVI value was increased, indicating the start of the vegetative phase (Figure 5). This increase in EVI value during October marks the characteristic of stem elongation which generates rice canopies. Maximum EVI (0.4) value were attained during panicle initiation and the heading of reproductive stage. After crop attains its ripening stage, leaves of paddy crop undergo chlorosis with little deterioration in crop canopy. After this stage, EVI Value decreases towards 0.3 and 0.2. This EVI values demonstrate that the maximum EVI value is obtained during the reproductive stage followed by a decline in values at the matured stage, resulting with the withering of crop leaves.
Time series analysis (Figure 6) was carried out by using all the MODIS Terra/Aqua 16-day Vegetation Indices L3 250 m (MOD13Q1 and MYD13Q1) data between September and December 2018. To delineate rice crop from other land classes, three statistic threshold for MODIS data were derived from the time series. Ground Survey Points were used for threshold selection. By using these threshold values masking of non-rice crop area like water bodies, buildings and forest areas were done. After masking these areas, classification was carried out in the study area for mapping rice crops (Figure 5).
6. Conclusions
Open source Earth observation data and cloud-based computing resources are a remarkable advancement in the field of landuse/landcover mapping and in crop monitoring. In this study, a phenology-based classification approach was used to delineate the Paddy crop in Karur district from MODIS EVI time series data using different phenological stages (transplanting, tillering, heading, and harvesting) of rice. However, an examination has been performed to estimate the transplanting date directly from the minimum EVI value of the time series data. The estimated planted date is in good agreement with field survey points. These values have some gaps in comparison with a small level. This satellite-based method for determining phenological stage in the paddy field can be utilized for both validation and simulation of the agro-hydrological model using GEE platform.
Author Contributions
Conceptualization, C.D., S.N. and A.B.; Methodology, C.D., S.N., A.B., and K.N.P.; Software, C.D. and S.N.; Formal Analysis, C.D. and S.N.; Writing—Original Draft Preparation, C.D., S.N., and K.N.P.; Writing—Review and Editing, S.N., C.D., A.B., and K.N.P.; Supervision, A.B.
Funding
This research received no external funding.
Conflicts of Interest
The authors declare no conflict of interest.
References
- Kuenzer, C.; Knauer, K. Remote sensing of rice crop areas. Int J Remote Sens. 2013, 34, 2101–2139. [Google Scholar] [CrossRef]
- Shi, J.I.; Huang, J.F.; Zhang, F. Multi-year monitoring of paddy rice planting area in Northeast China using MODIS time series data. J. Zhejiang Univ. Sci. B 2013, 14, 934–946. [Google Scholar] [CrossRef] [PubMed]
- Shao, Y.; Fan, X.T.; Liu, H.; Xiao, J.H.; Ross, S.; Brisco, B.; Brown, R.; Staples, G. Rice monitoring and production estimation using multi-temporal RADARSAT. Remote Sens. Environ. 2001, 76, 310–325. [Google Scholar] [CrossRef]
- Rosenzweig, C.; Strzepek, K.M.; Major, D.C.; Iglesias, A.; Yates, D.N.; McCluskey, A.; Hillel, D. Water resources for agriculture in a changing climate: international case studies. Glob. Environ. Chang. 2004, 14, 345–360. [Google Scholar] [CrossRef]
- Neue, H.U. Methane emission from rice fields. Bioscience 1993, 43, 466–474. [Google Scholar] [CrossRef]
- Gumma, M.K.; Nelson, A.; Thenkabail, P.S.; Singh, A.N. Mapping rice areas of south Asia using MODIS multitemporal data. J. Appl. Remote Sens. 2011, 5, 535–547. [Google Scholar] [CrossRef]
- Peng, D.L.; Huete, A.R.; Huang, J.F.; Wang, F.M.; Sun, H.S. Detection and estimation of mixed paddy rice cropping patterns with MODIS data. Int. J. Appl. Earth Obs. Geoinf. 2011, 13, 13–23. [Google Scholar] [CrossRef]
- Xiao, X.M.; Boles, S.; Frolking, S.; Li, C.S.; Babu, J.Y.; Salas, W.; Moore, B. Mapping paddy rice agriculture in south and southeast Asia using multi-temporal MODIS images. Remote Sens. Environ. 2006, 100, 95–113. [Google Scholar] [CrossRef]
- Zhang, X.Y.; Friedl, M.A.; Schaaf, C.B.; Strahler, A.H.; Hodges, J.C.F.; Gao, F.; Reed, B.C.; Huete, A. Monitoring vegetation phenology using MODIS. Remote Sens. Environ. 2003, 84, 471–475. [Google Scholar] [CrossRef]
- Li, S.; Xiao, J.T.; Ni, P.; Zhang, J.; Wang, H.S.; Wang, J.X. Monitoring paddy rice phenology using time series MODIS data over Jiangxi Province, China. Int. J. Agric. Biol. Eng. 2014, 7, 28–36. [Google Scholar]
Figure 1.
Geographical location of the study area.
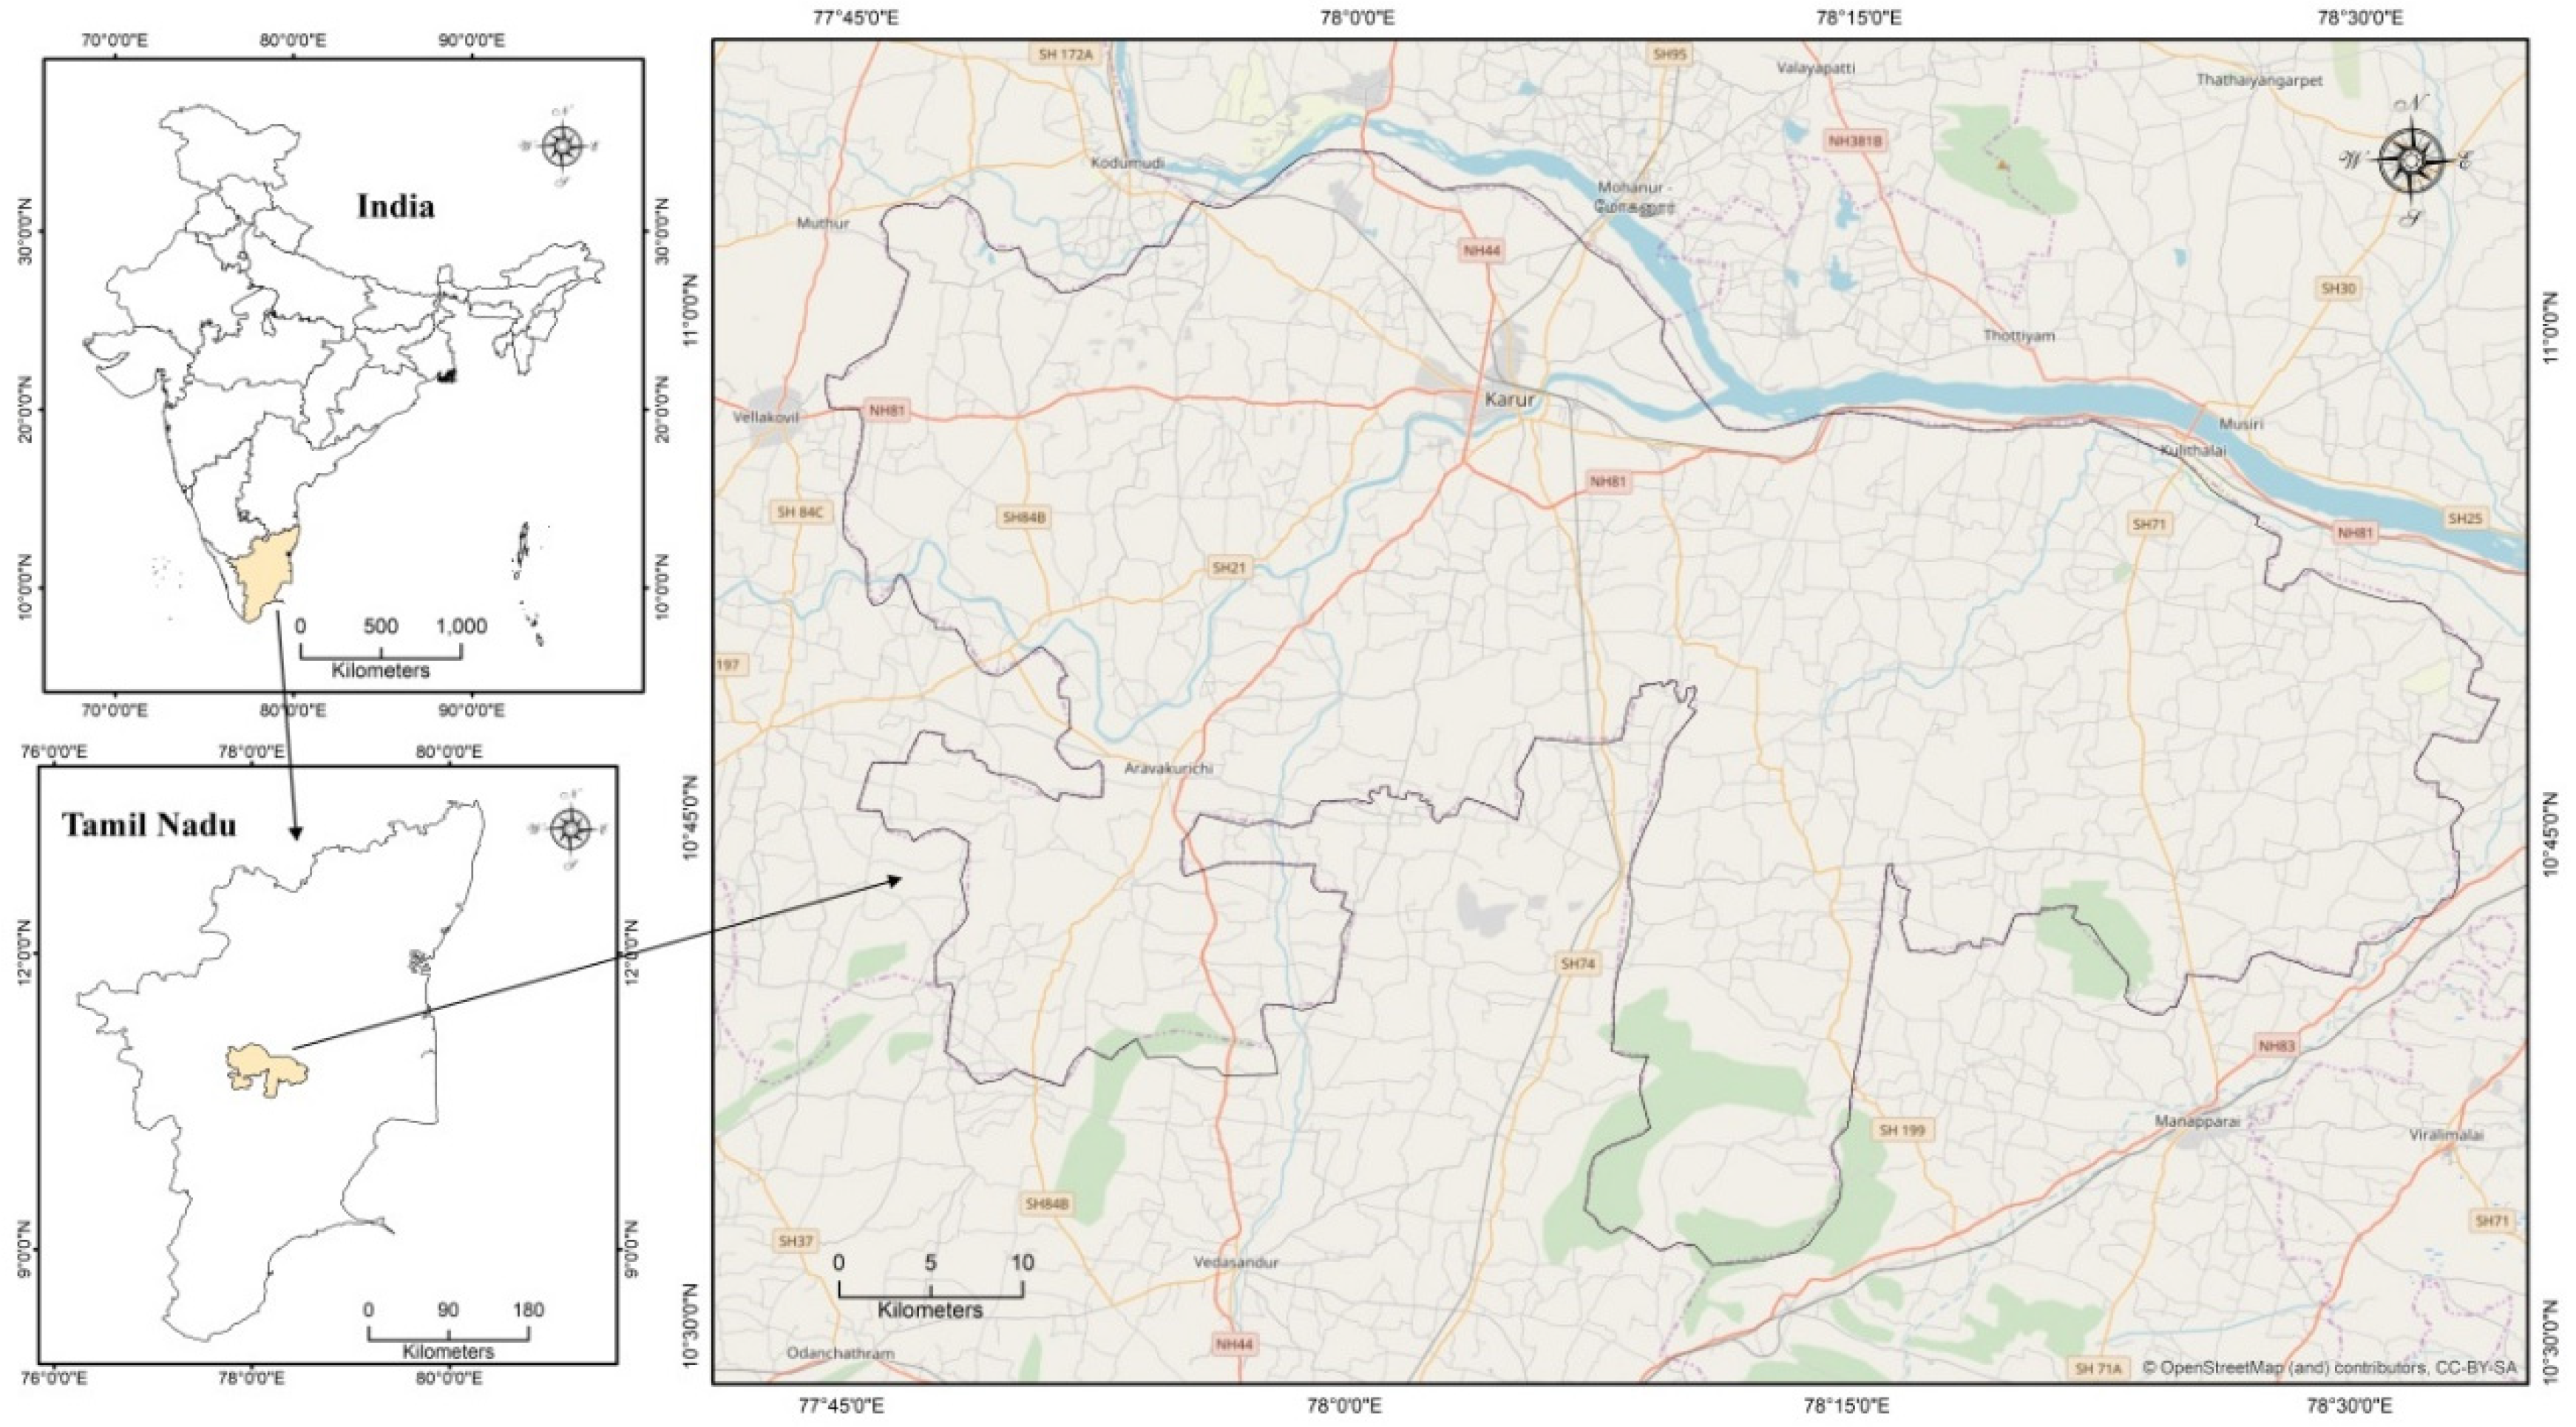
Figure 2.
Methodology of the study. EVI: Enhanced Vegetation Index.
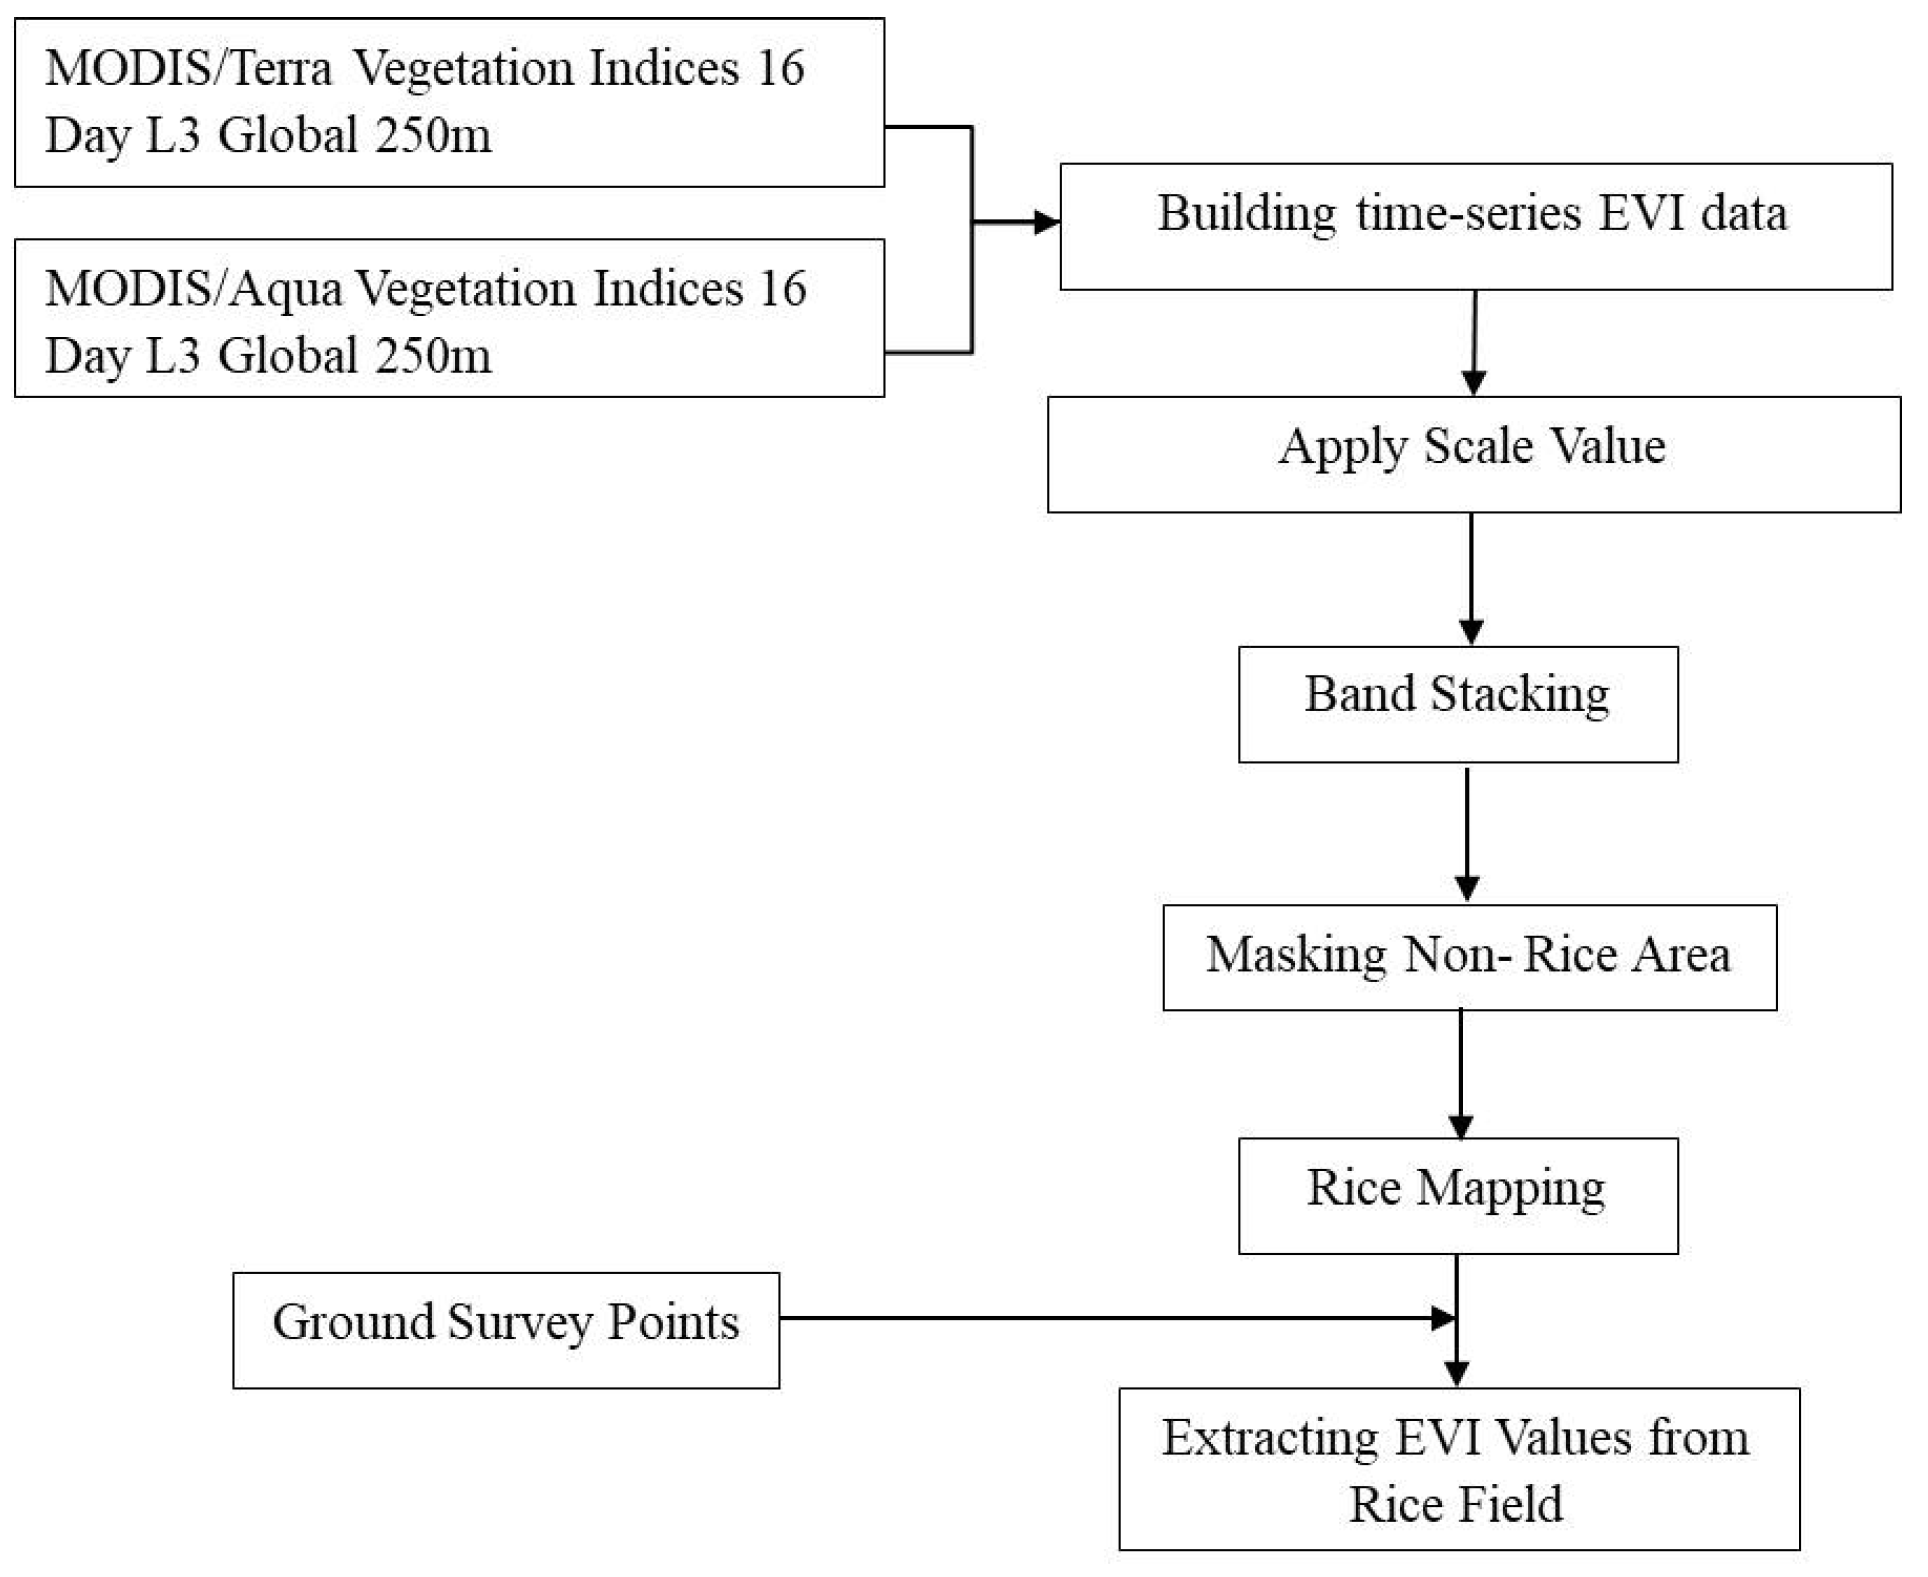
Figure 3.
Processing in Google Earth Engine (GEE).
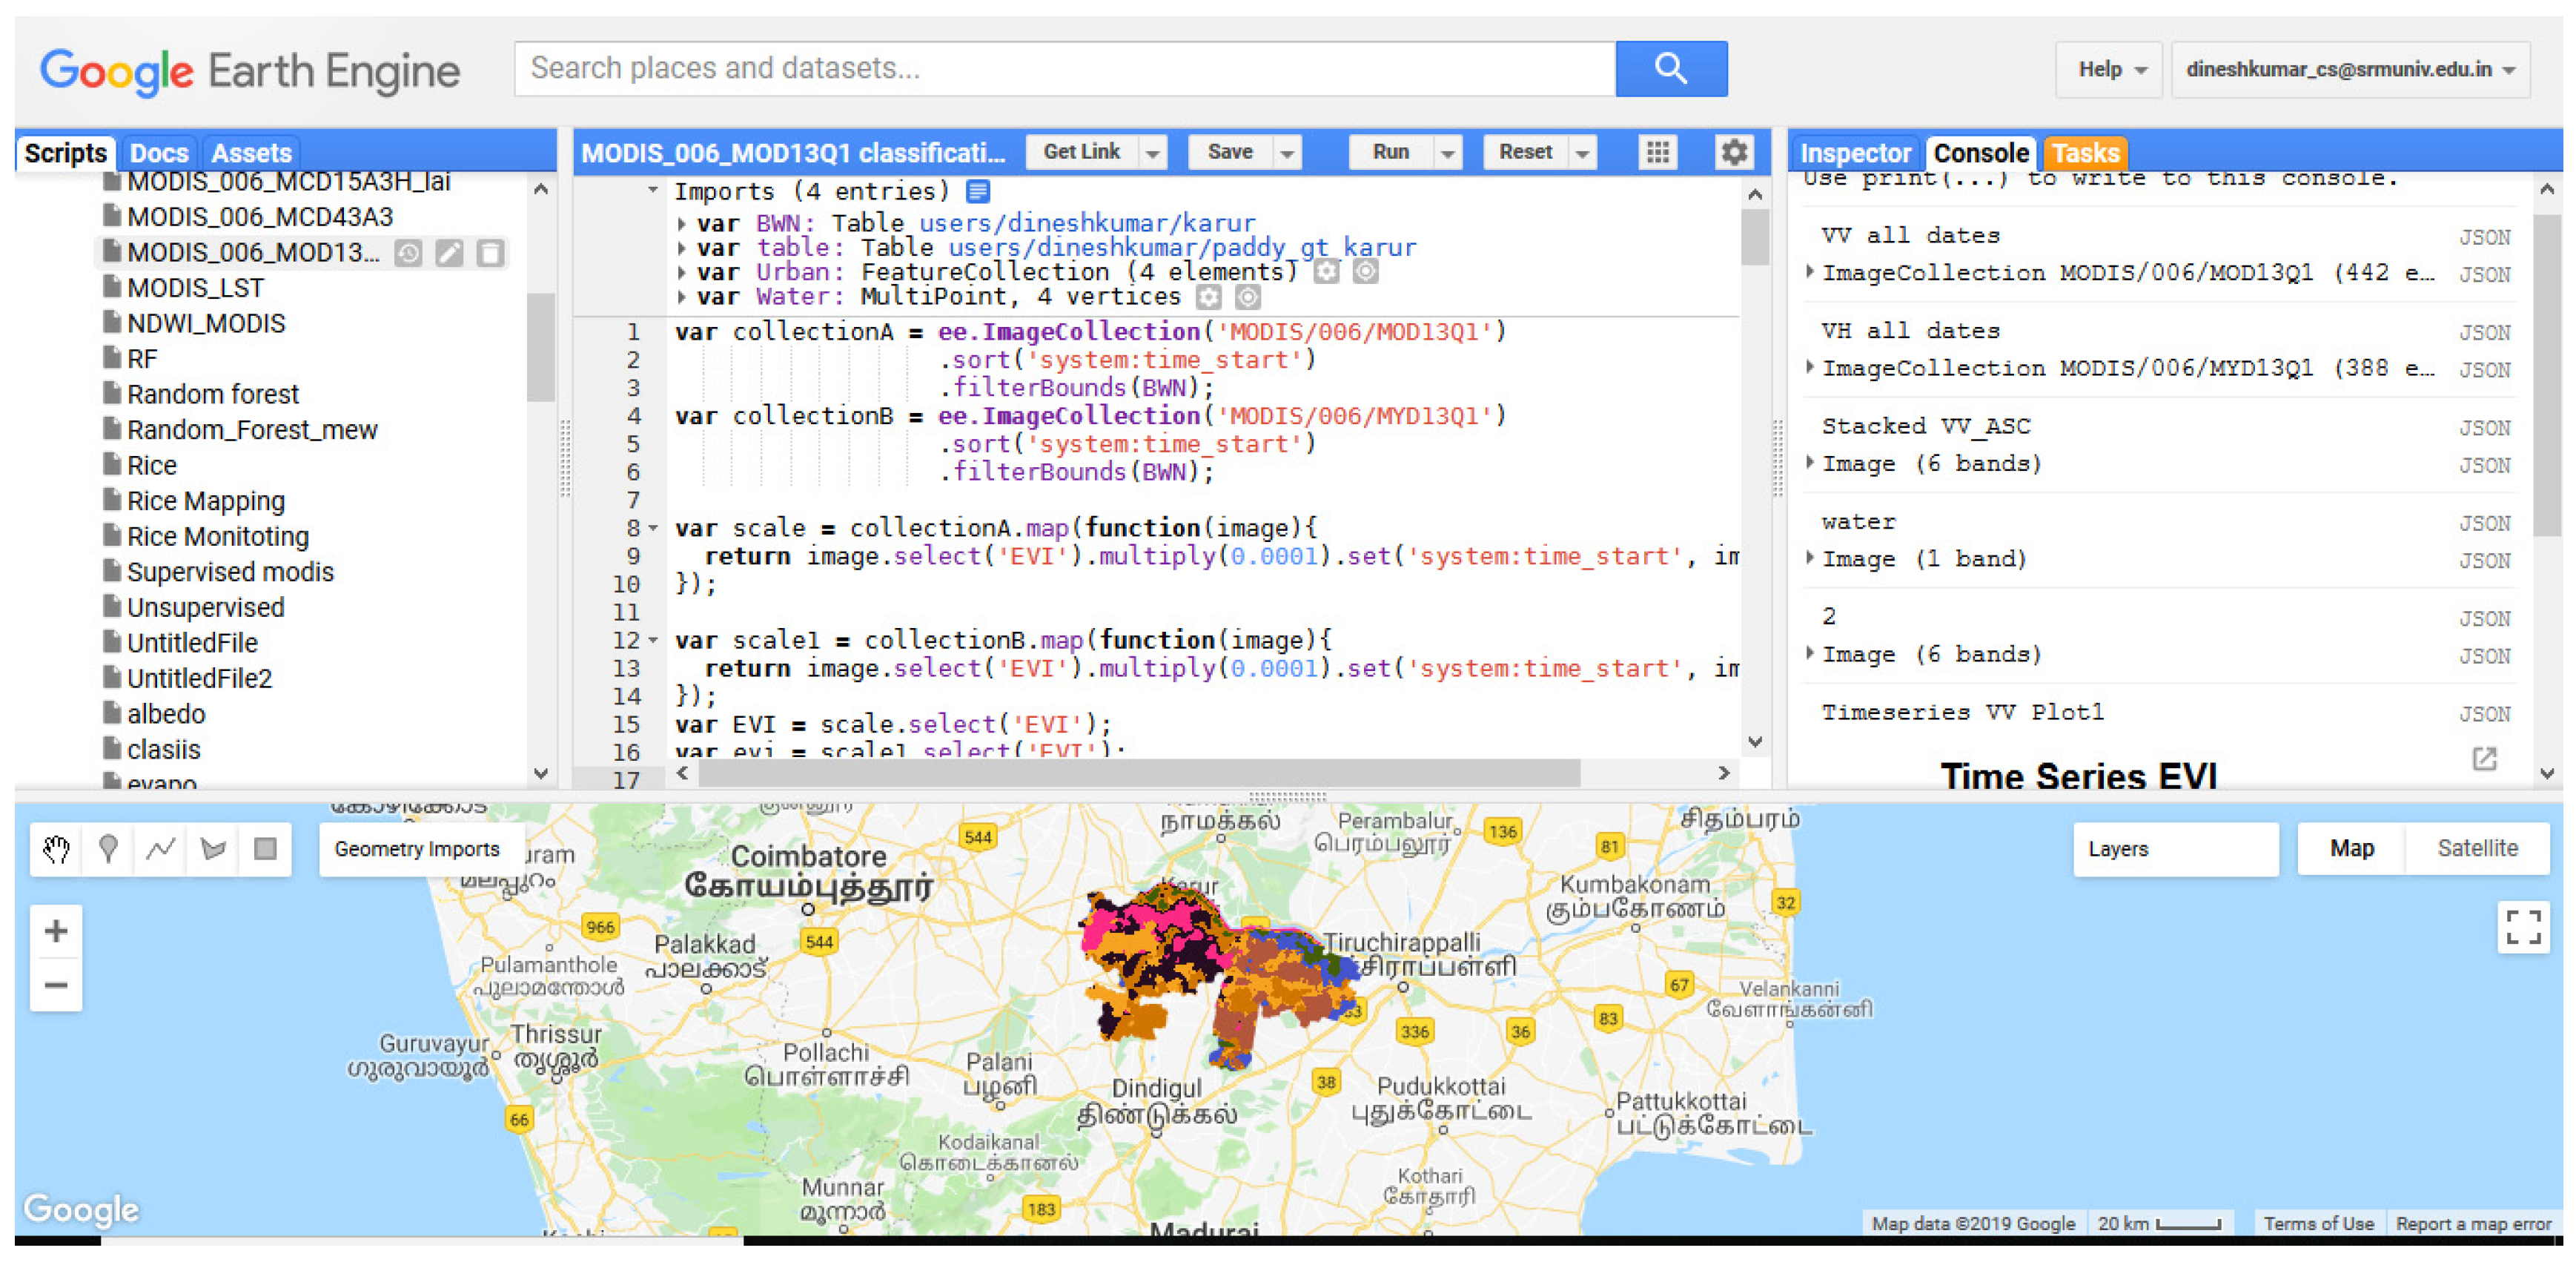
Figure 4.
Phenological Stages of Rice for EVI.
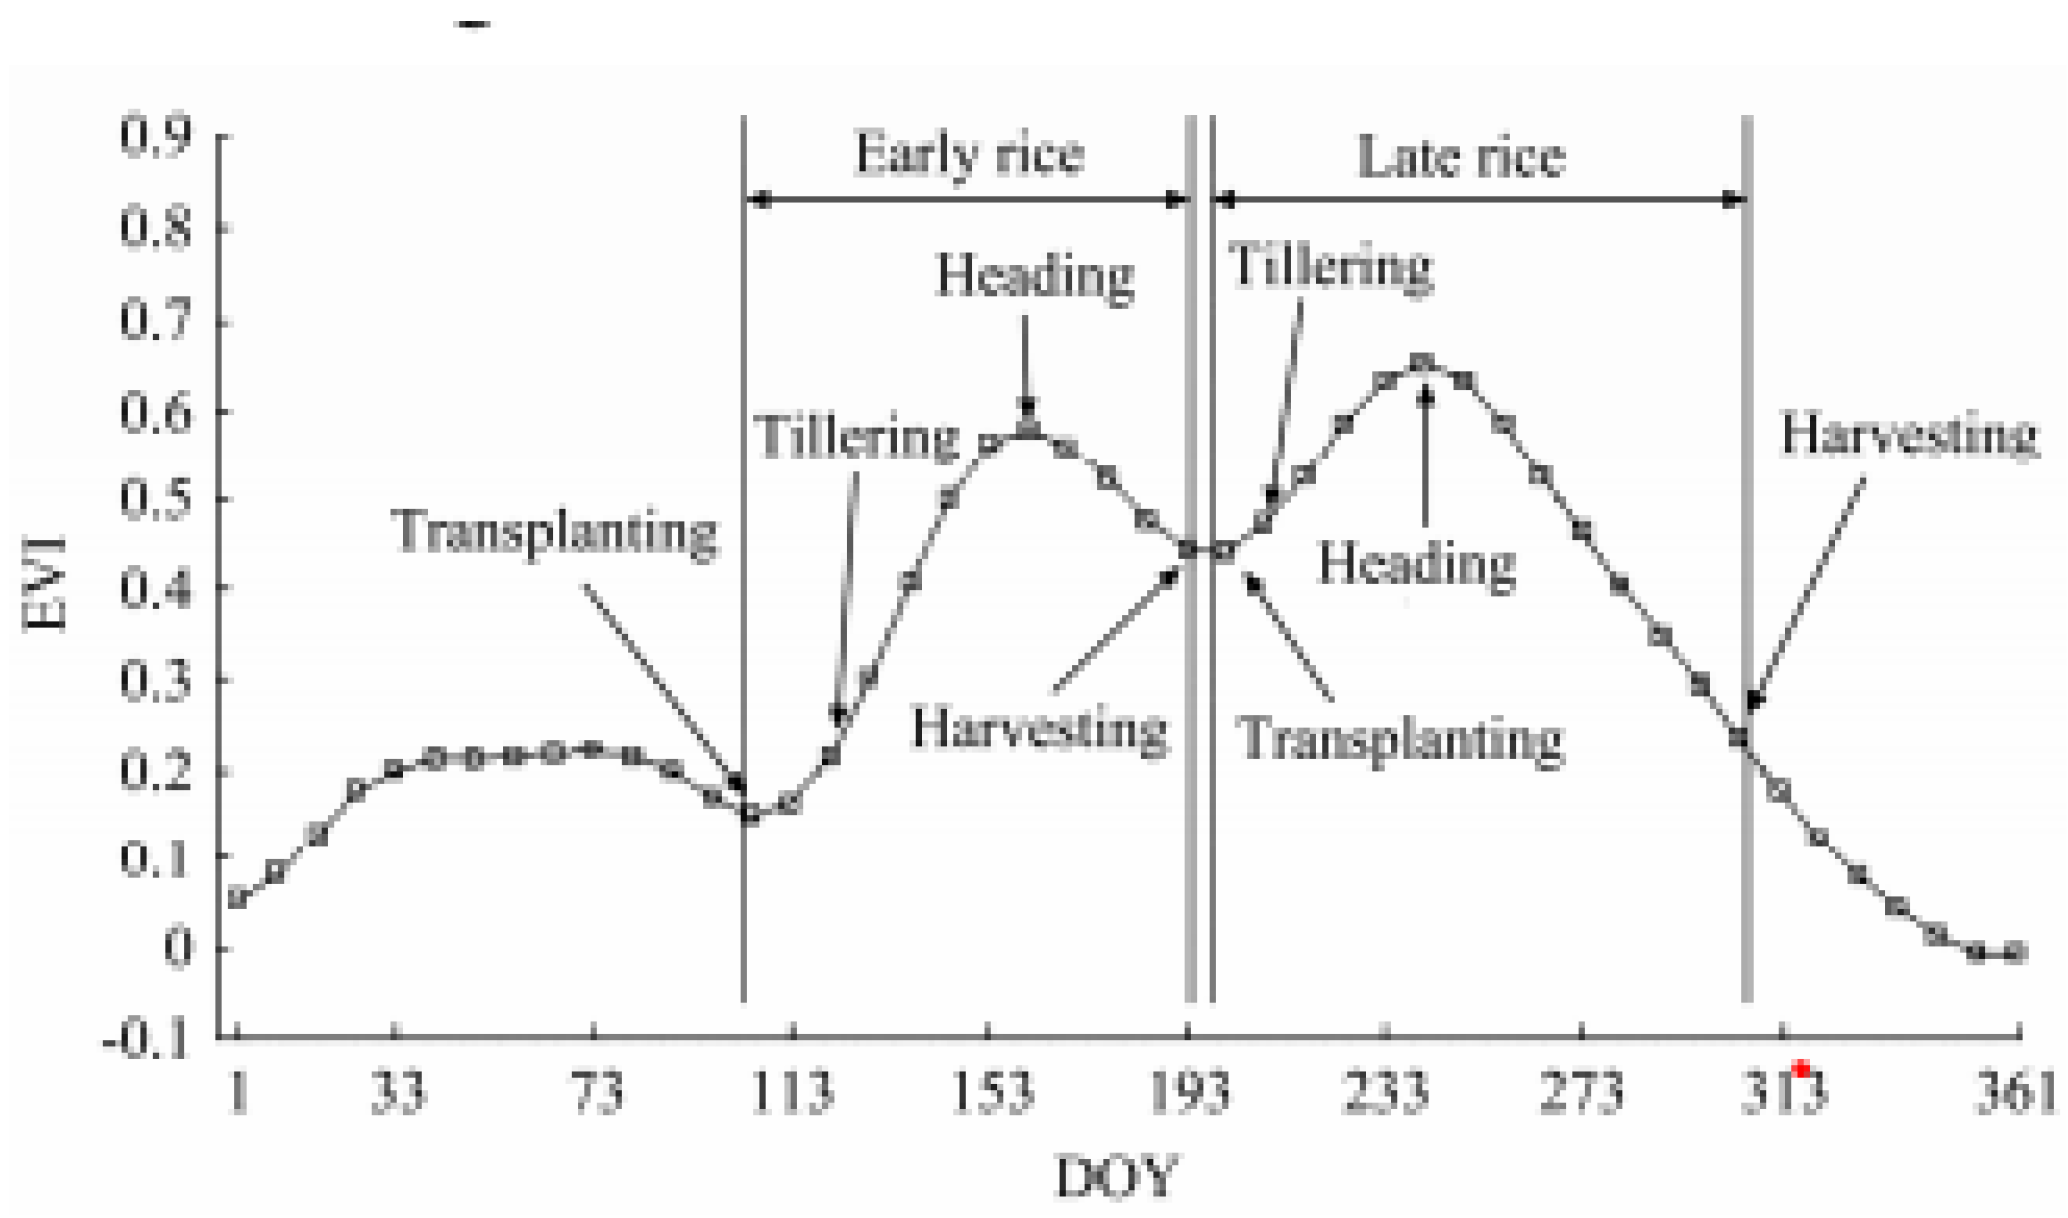
Figure 5.
Rice area mapping.

Figure 6.
Time Series analysis of EVI.
© 2019 by the authors. Licensee MDPI, Basel, Switzerland. This article is an open access article distributed under the terms and conditions of the Creative Commons Attribution (CC BY) license (http://creativecommons.org/licenses/by/4.0/).
Share and Cite
MDPI and ACS Style
Dineshkumar, C.; Nitheshnirmal, S.; Bhardwaj, A.; Priyadarshini, K.N. Phenological Monitoring of Paddy Crop Using Time Series MODIS Data. Proceedings 2019, 24, 19. https://doi.org/10.3390/IECG2019-06205
AMA Style
Dineshkumar C, Nitheshnirmal S, Bhardwaj A, Priyadarshini KN. Phenological Monitoring of Paddy Crop Using Time Series MODIS Data. Proceedings. 2019; 24(1):19. https://doi.org/10.3390/IECG2019-06205
Chicago/Turabian StyleDineshkumar, C., S. Nitheshnirmal, Ashutosh Bhardwaj, and K. Nivedita Priyadarshini. 2019. "Phenological Monitoring of Paddy Crop Using Time Series MODIS Data" Proceedings 24, no. 1: 19. https://doi.org/10.3390/IECG2019-06205