Automatic Detection of Erratic Sensor Observations in Ami Platforms: A Statistical Approach †


1
ETSI Telecomunicación, Technical University of Madrid, Av. Complutense 30, 28040 Madrid, Spain
2
ETSI Sistemas Informáticos, Technical University of Madrid, Calle de Alan Turing s/n, 28031 Madrid, Spain
3
ETSI Topography, Geodetics and Cartography Technical, University of Madrid, Camino de la Arboleda s/n, 28031 Madrid, Spain
*
Author to whom correspondence should be addressed.
†
Presented at the 13th International Conference on Ubiquitous Computing and Ambient Intelligence UCAmI 2019, Toledo, Spain, 2–5 December 2019.
‡
These authors contributed equally to this work.
Proceedings 2019, 31(1), 55; https://doi.org/10.3390/proceedings2019031055
Published: 20 November 2019
(This article belongs to the Proceedings of 13th International Conference on Ubiquitous Computing and Ambient Intelligence UCAmI 2019)
Abstract
:This paper addresses the problem of data aggregation platforms operating in heterogeneous Ambient Intelligence Environments. In these platforms, device interoperability is a challenge and erratic sensor observations are difficult to be detected. We propose ADES (Automatic Detection of Erratic Sensors), a statistical approach to detect erratic behavior in sensors and annotate those errors in a semantic platform. To do that, we propose three binary classification systems based on statistical tests for erratic observation detection, and we validate our approach by verifying whether ADES is able to classify sensors by its observations correctly. Results show that the first two classifiers (constant and random observations) had good accuracy rates, and they were able to classify most of the samples. In addition, all of the classifiers obtained a very low false positive rate.
1. Introducction
Ambient intelligence (AmI) platforms enable the seamless interconnectivity among a huge number of devices, allowing data consumers to get information efficiently and bringing up new possibilities in the creation of new applications which take advantage of the information offered by the platforms. However, one of the main problems of these platforms is the heterogeneity of the underlying devices or deployments due to a lack of common rules, guidelines or standards when the platforms were designed. In other words, sometimes the devices in the same platform cannot interoperate among them. A feasible solution for this problem is ontologies [1], which allow the interoperability among heterogeneous deployments and devices.
After working with Ambient Intelligence (AmI) platforms in our previous research work [2], we observed that, in large-scale platforms, with many devices, it is very common to see devices injecting corrupt information into the system, in most cases due to a malfunction of it. On one hand, this causes the platform to contain information that is not entirely real, losing user confidence, and forcing them to filter and clean the data; on the other hand, manual monitoring of so many devices is very complex and requires a lot of manpower from highly specialized data managers.
If a system is able to automatically detect erratic errors, several benefits will be achieved:
- Data managers will know which device provides incorrect observations, and they can study the point of failure in the platform where the corrupted data are inserted into the system.
- The erroneous data can be annotated semantically, giving extra information about it to the end-users.
- Final applications made by end-users will be improved.
- Data reliability will be definitely improved.
In this research work, we will present three error types commonly found in the observations provided by sensors; these three error types are constant observations, random observations, and outlier observations.
In order to guide this research work, we stated a research question:
- Is it possible to detect sensors producing erroneous observations at a high level of abstraction?
To answer that question, we developed a system composed of three binary classifiers (one for each error type) based on statistical tests. The input of the binary classifiers will be a set of observations produced by a sensor, and the output will be a classification indicating whether the input is considered erroneous or not. This output will be annotated and published as semantic information so that end-users can take advantage of it.
We carried out a validation of the system where 90 observations were classified by our system, 30 of them were used to fit the statistical models used by the classifiers, and the 60 remaining were used to test the system.
The results obtained were satisfactory confirming that the approach proposed in this research work is feasible and can be used for automatic detection of erratic sensors on AmI platforms.
The paper is structured as follows: Section 2 provides the state of the art on classification techniques and ontology-based AmI platforms, and Section 3 proposes the three binary classification systems. This contribution is validated in Section 4, and, finally, Section 5 and Section 6 provide some results and conclusions, respectively.
2. Related Work
In this research work, we propose a system for detecting erratic sensors producing and injecting incorrect data in an AmI platform. We will detect those errors through the sensor observations provided by an AmI platform; in most cases, this information is usually semantic. For doing that, we will develop several binary classifiers based on statistics in order to check whether a sensor has erratic behavior or not. We will present a brief review of the state of the art taking into account three main research areas.
In relation to classification techniques applied to sensors’ observations, there are many research works that use classification techniques to solve specific problems with sensors. In the bibliography, we can find that decision trees are used to determine localized building occupancy in real time [3]; or an activity recognition and monitoring system [4]. An ensemble learning method as random forest was used to diagnose lung cancer using a colorimetric sensor array [5], and Bayesian networks were used by Tapia for activity recognition using ubiquitous sensors [6]. Regarding support vector machines, we found an exhaustive review of the state of the art in the work of Mountrakis [7]; applying this classification technique and using vision sensors, it was possible to classify images to detect fires [8] and improve the classification for hyperspectral remote sensing [9]. One of the most used techniques are neural networks, used to classify human activity using smartphone sensors [10,11]. ARIMA (Autoregressive integrated moving average) models was used to decrease the number of transmitted data values between sensor nodes [12], and anomaly detection for wireless sensors [13].
Regarding AmI platforms using ontologies, AmI environments are starting to integrate vertical sectors such as healthcare, cybersecurity, environmental data, etc. Those vertical sectors use its own domain-specific technology that prevents components in distributed systems to interoperate. Thus, one of the main characteristics of a typical AmI environment is the heterogeneity of its devices [14]. This has as a consequence difficulty for the exploitation and use of the data. There is a growing need to integrate heterogeneous data silos and develop solutions for breaking and bridging these barriers. Semantic technologies, and, in particular, ontologies, are one of the most used techniques to take advantage of the data among different deployments [15]. These technologies allow the definition of semantic models of the data and its relationships, data mining, efficient searches on the data, enable the automation of reasoning, etc. [16]
In conclusion, the heterogeneity of the devices deployed in the AmI platforms makes them difficult to manage and to obtain valid data. The use of semantic technologies has proven to aid interoperability and data extraction in these AmI platforms. In our previous research work [2], we detected in those platforms with many devices that it is common to find observations from sensors with errors, hindering study and work with the AmI platform and its data. In the state of the art, we have found many solutions that classify sensors and its data, but there is no solution that classifies erratic sensors in semantic AmI platforms, as the author’s proposal.
3. Proposal
In this section, we propose three binary classification systems based on statistical tests in order to detect sensors that are generating erratic values or outliers. We called it ”Automatic Detection of Erratic Sensors” (ADES)
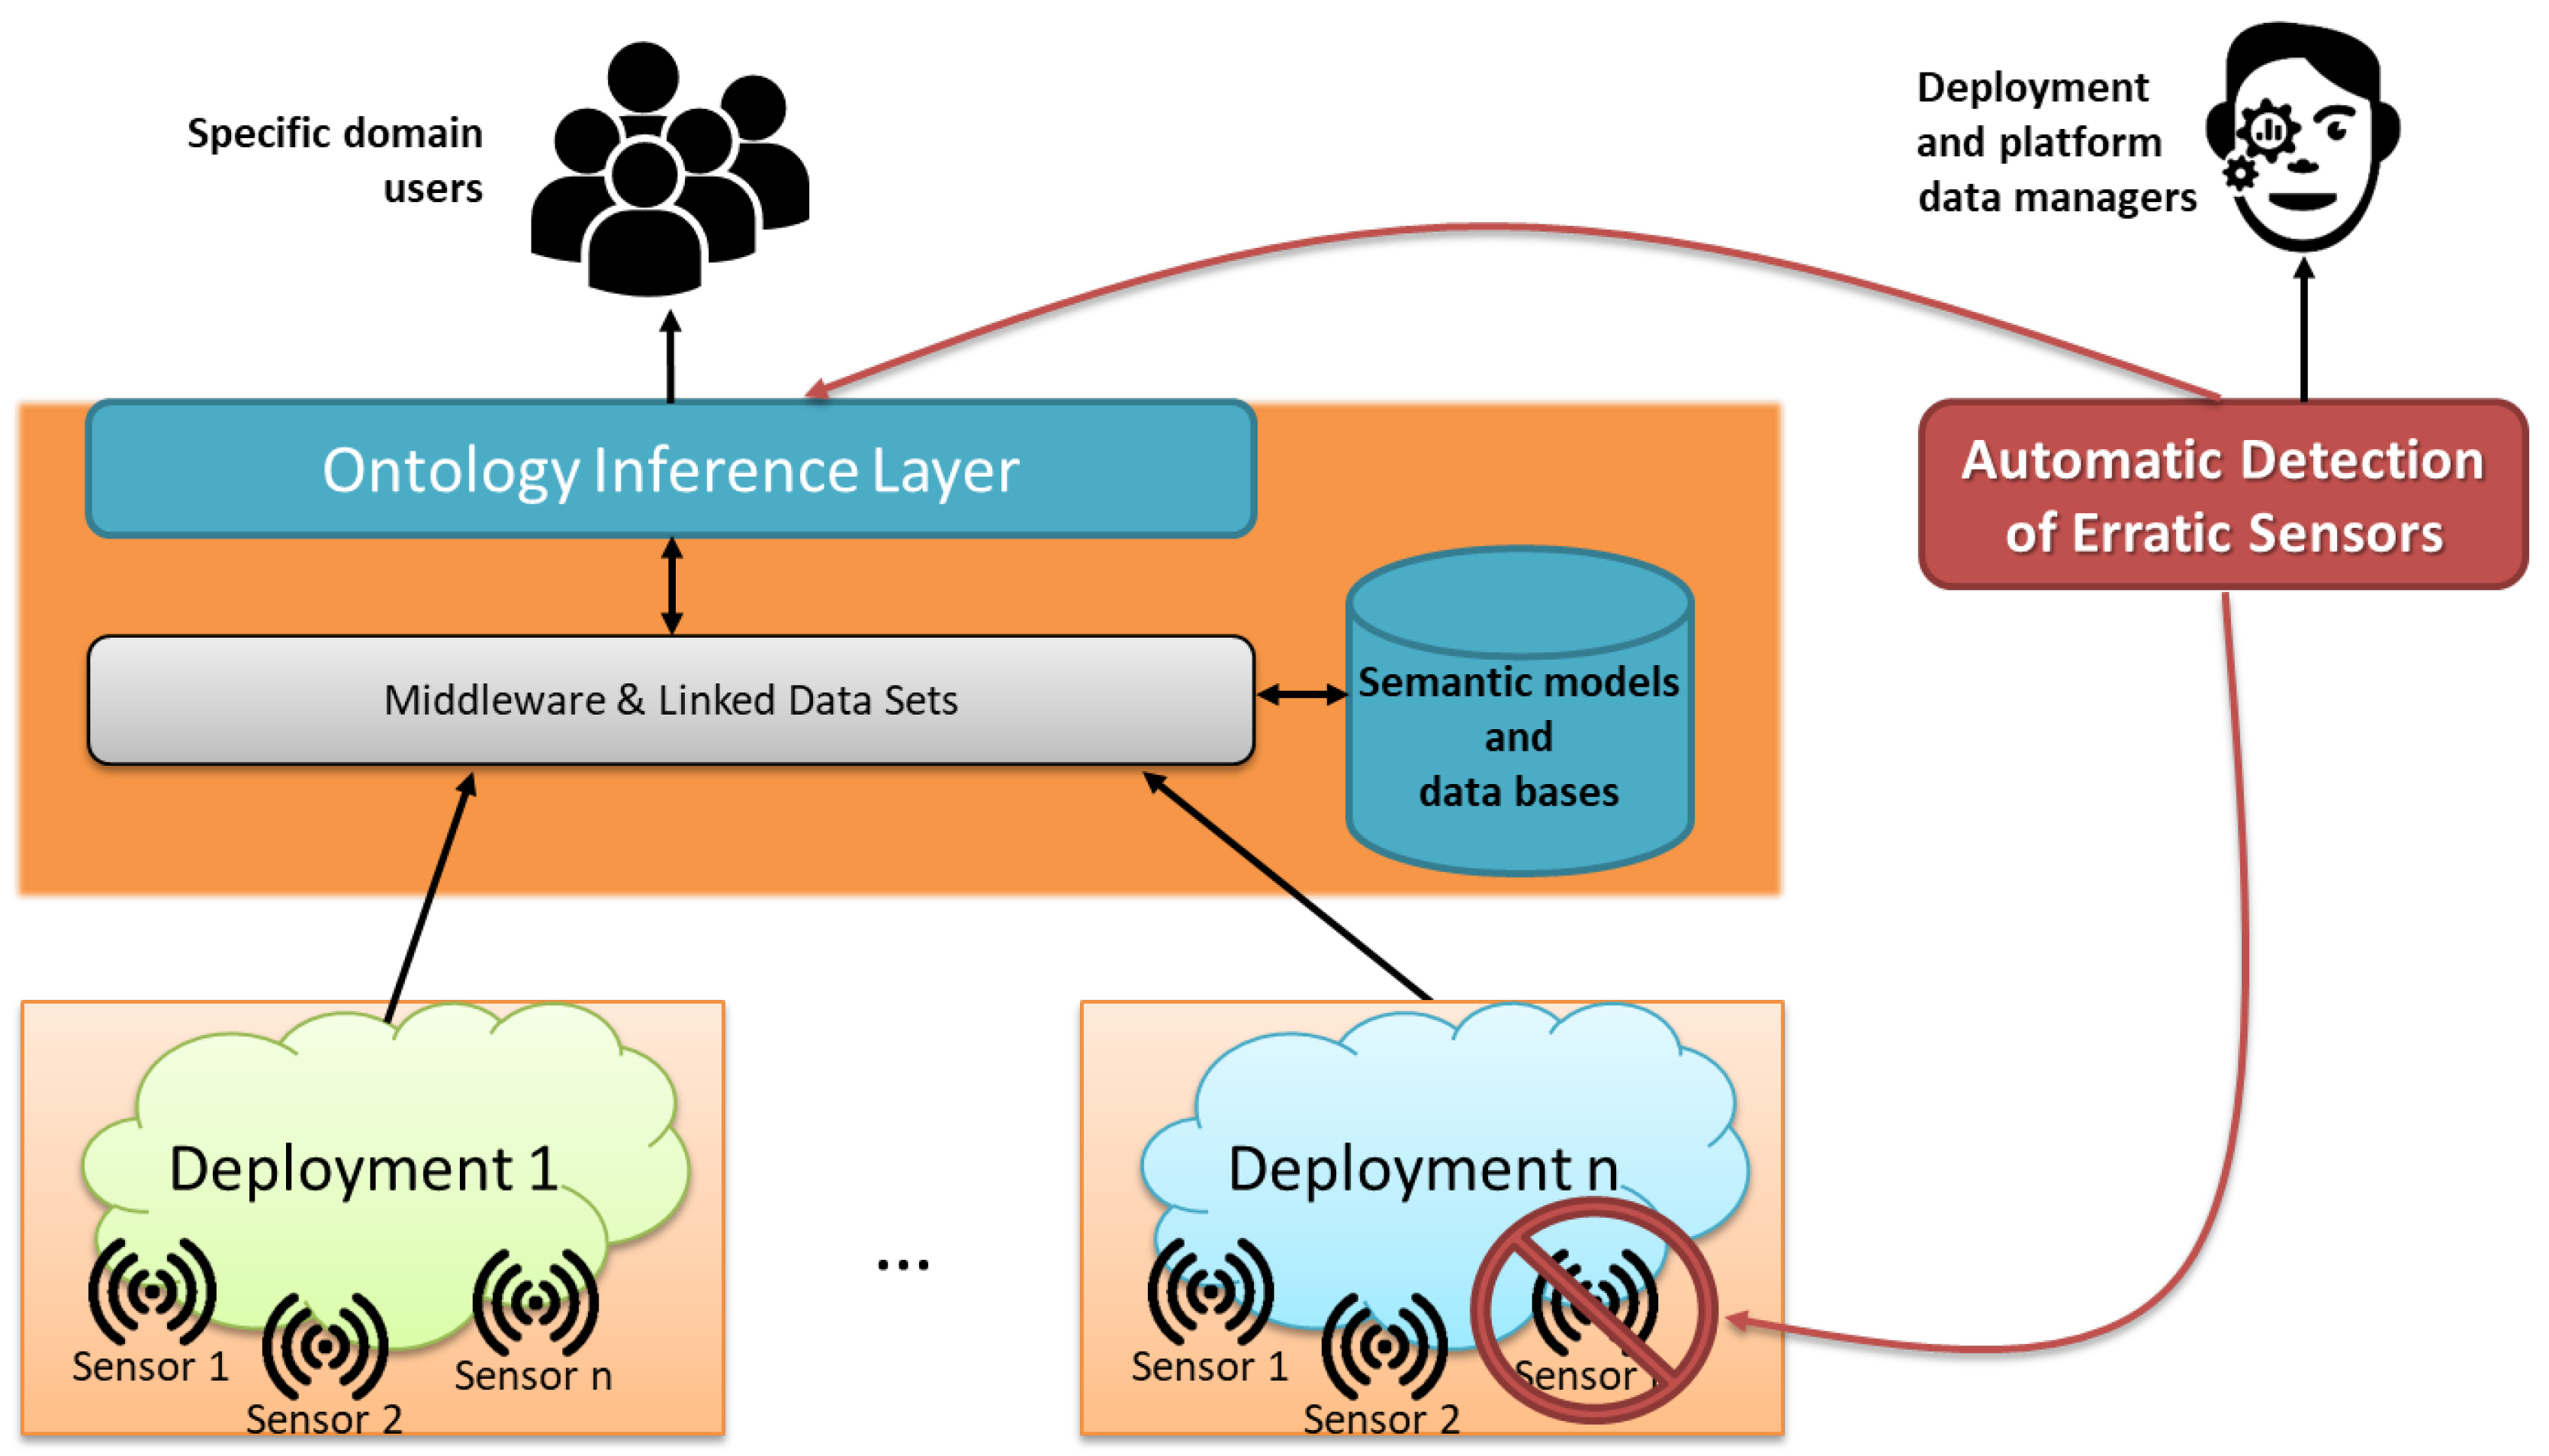
In Figure 1, we show our system consuming the semantic data offered by a semantic-based AmI platform for detecting erratic sensors. We test our proposal using the Fiesta-IoT platform [17]; the Fiesta-IoT project works towards the integration of IoT platforms and has more than 20,000 sensors deployed.
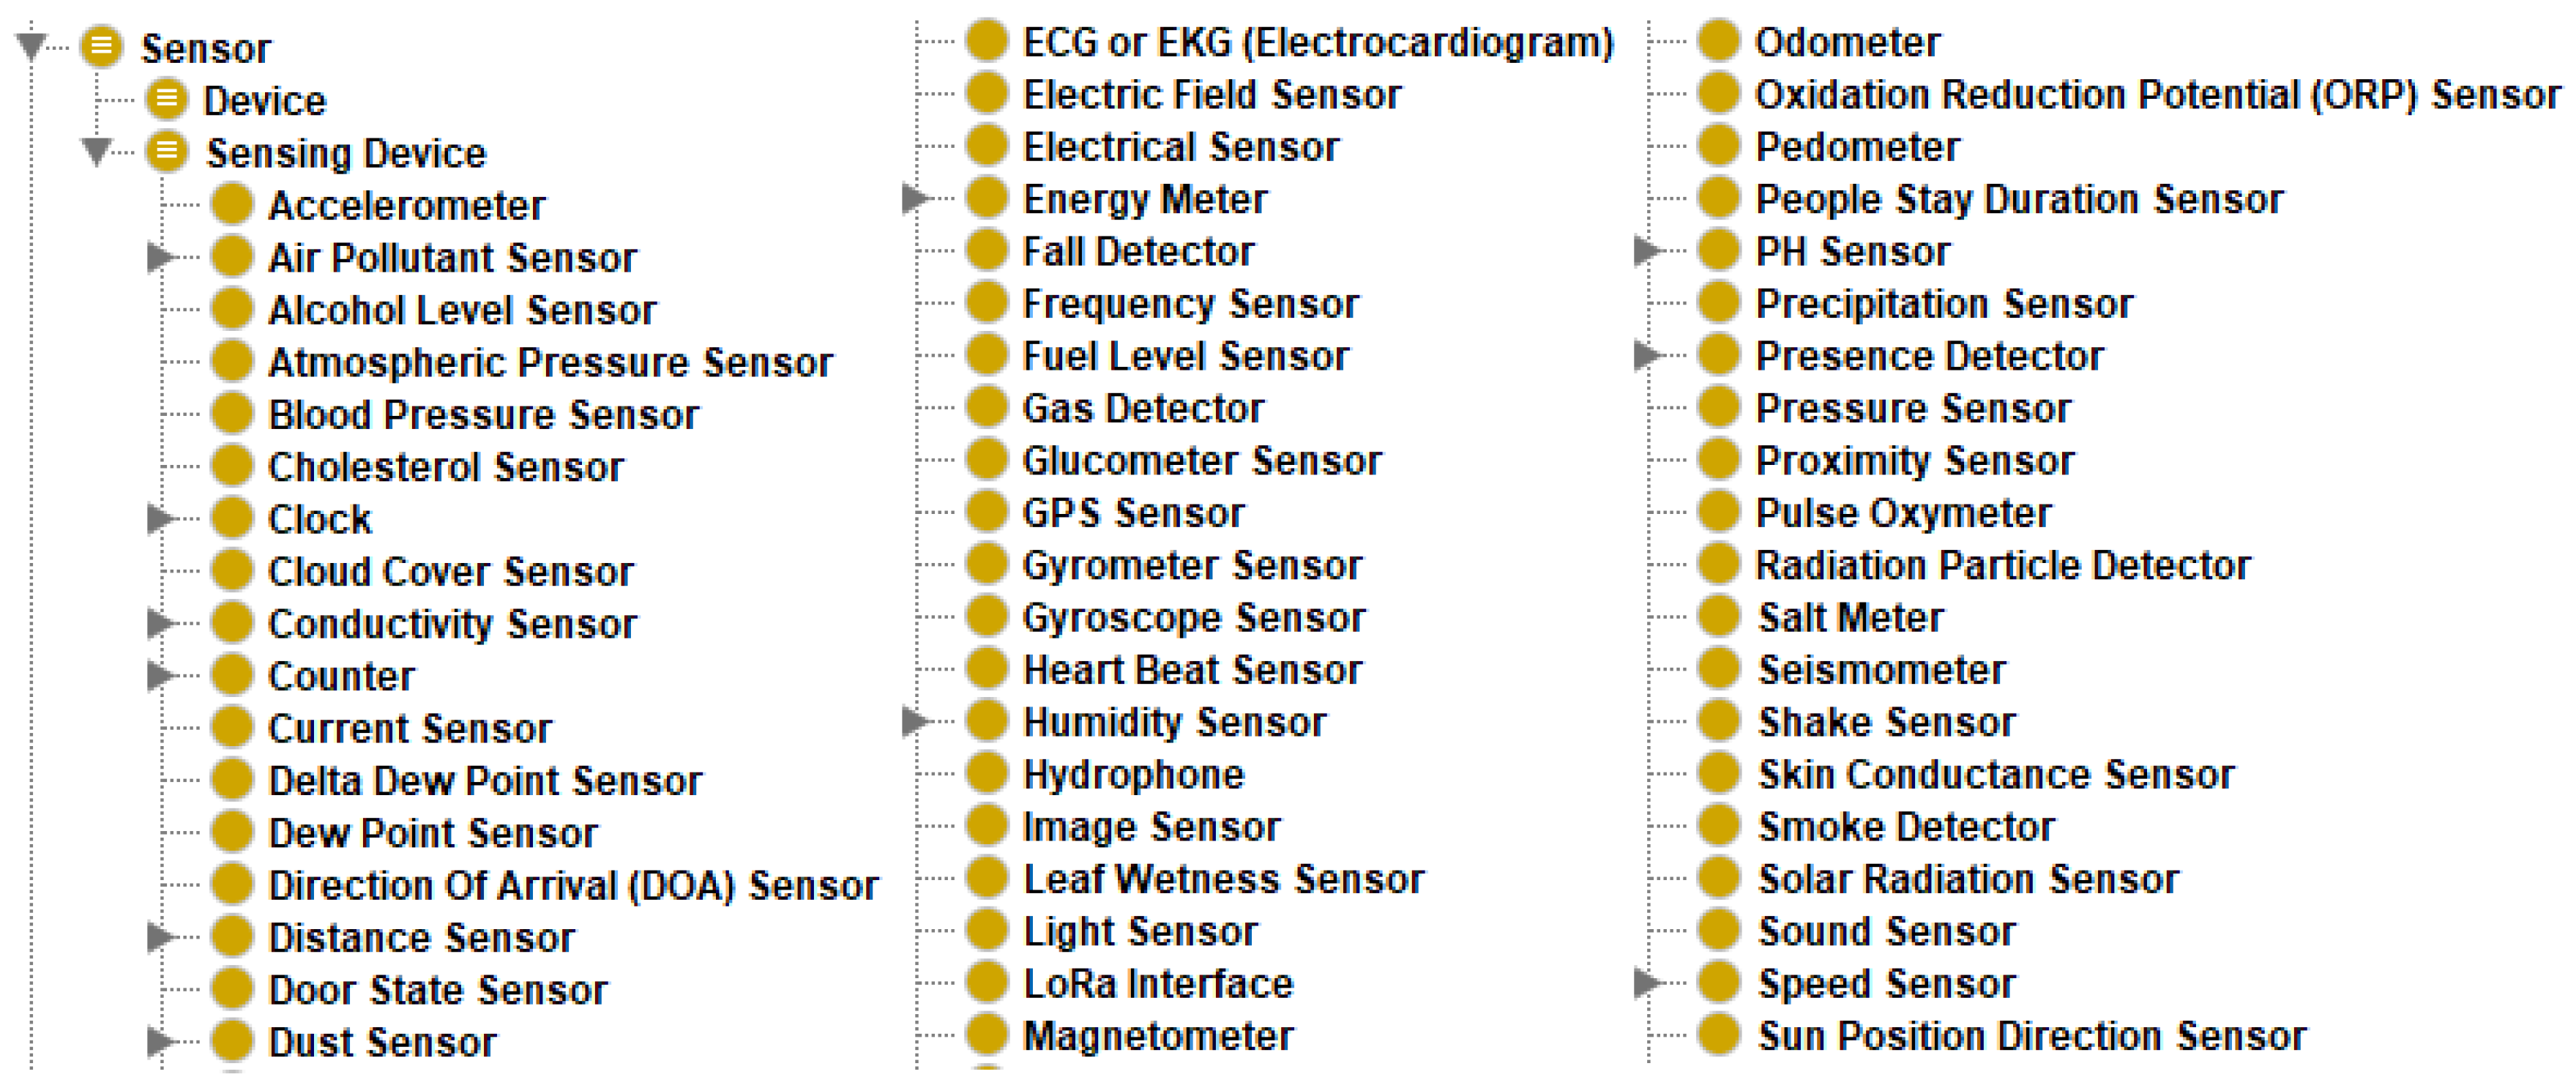
AmI platforms offer very heterogeneous and diverse information about their devices; the most advanced offer semantic information using ontologies, for example, the Semantic Sensor Network Ontology [18] (see Figure 2). Therefore, access to the information is done through ontological queries; we used SPARQL to obtain sensor observations.
In most cases, sensors operating on these platforms measure the value of a physical quantity with respect to time, such as a temperature or humidity. In this research work, we will focus on these types of sensors since the statistical tests that we will use are oriented to samples of numerical data taken with a fixed frequency, that is, time series. Time series are used in signal processing, weather forecasting, econometrics, mathematical finance, communications engineering, etc.
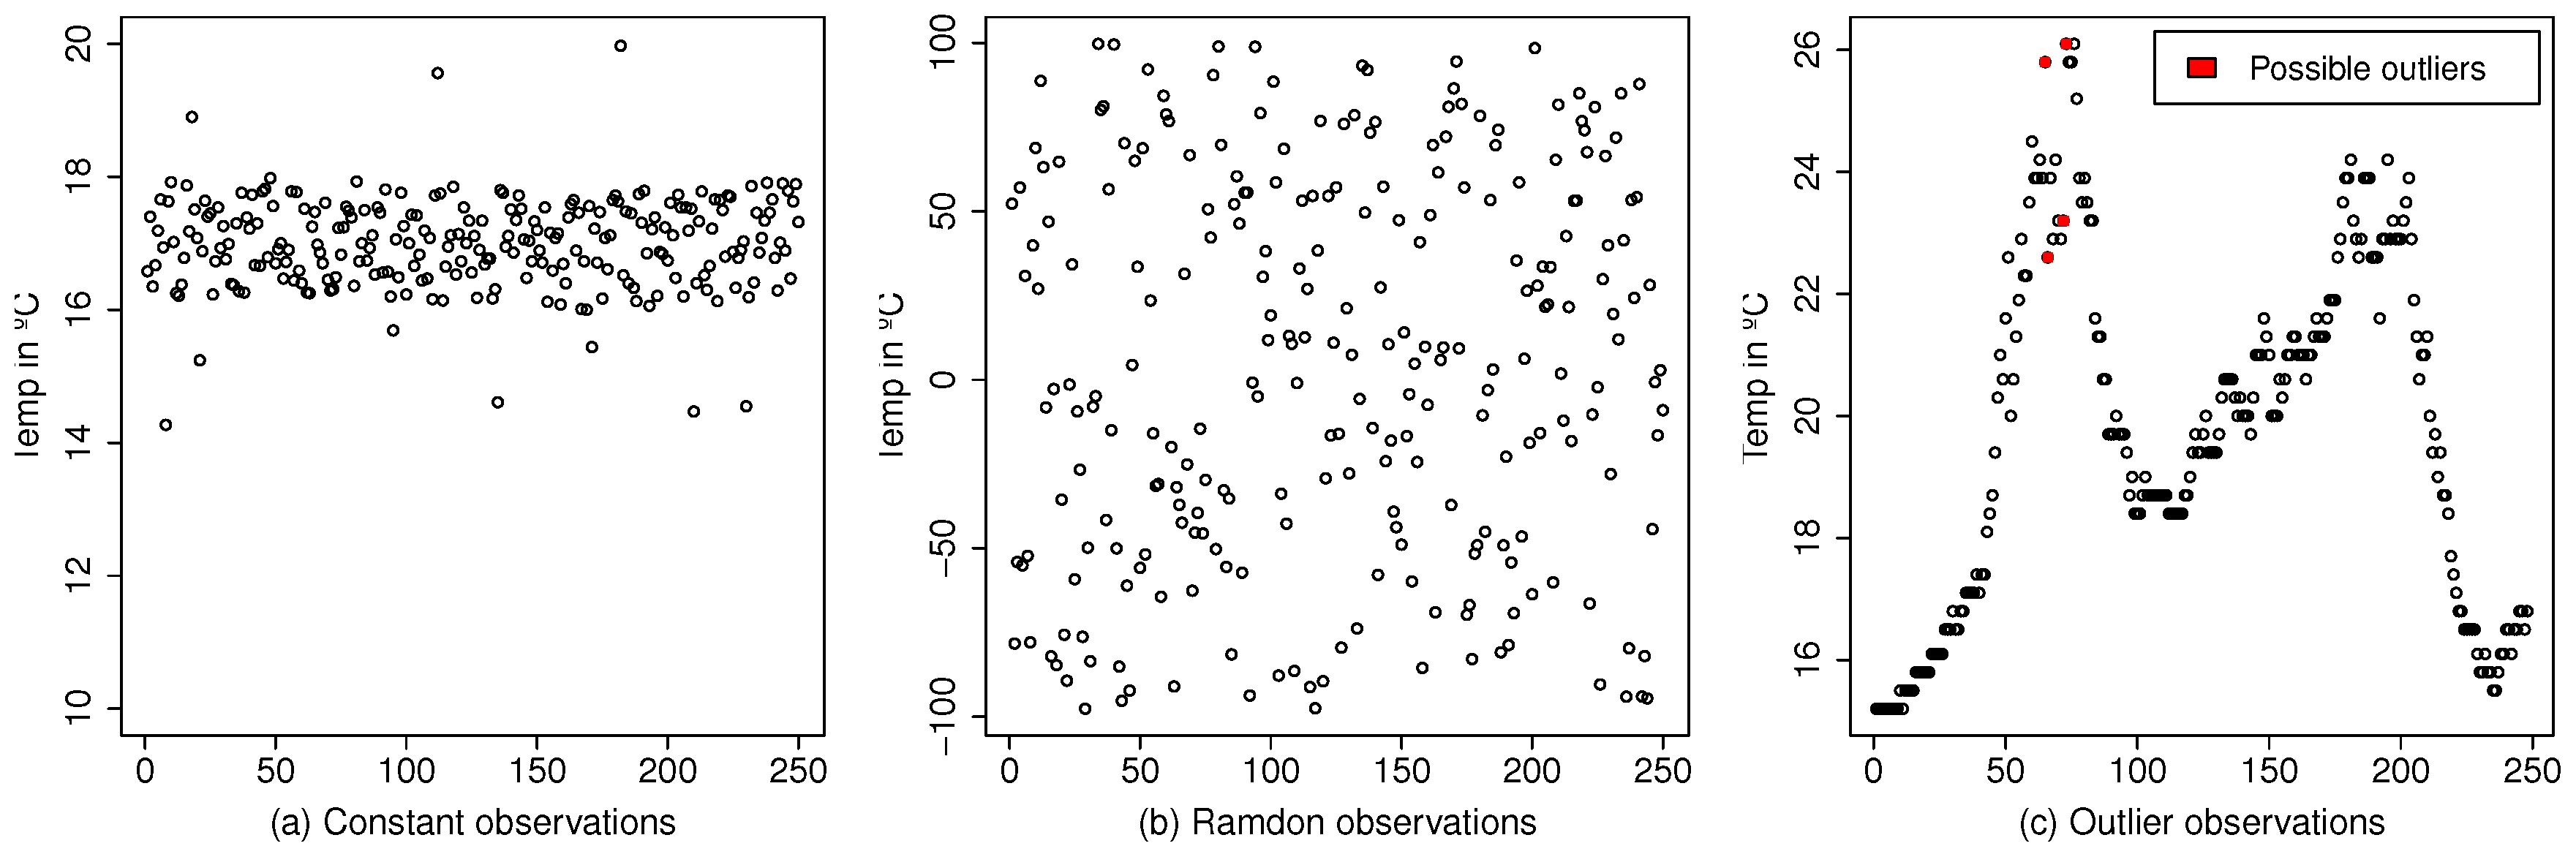
Taking into account the above-mentioned characteristics, we have categorized three types of errors (see Figure 3).
- Constant observations: The observations offered by a sensor are constant or almost constant around a value.
- Random observations: The observations measured by a sensor are random.
- Outliers: Some of the observations read by a sensor are not consistent with the previous measurements.
ADES implements three binary classifiers based on statistical tests to check if a sensor commits one of the three types of errors described above. ADES receives as an input the sensor to be analyzed, the time window in which the data will be analyzed and several parameters to fit the specific statistical model as explained later. As a result, ADES will classify and semantically annotate the sensor as erratic if any of the statistical tests are positive.
All tests performed by ADES are time-dependent. In this sense, ADES will be able to work in two different ways:
- Asynchronously: The sensor’s observations will be classified due to an asynchronous request of a client.
- Synchronously: ADES will monitor the sensor observations while the sensor is producing them (or the platform publishes them). In this case, ADES will classify the observations annotating it and publishing it in a semantic platform.
The developed system consists of a client and a server. As a client, it makes requests to the ontological platform, receiving the data to be tested. It performs the statistical calculations in order to classify sensor observations, and, as a server, it publishes the results of the tests as semantic information. ADES was mostly developed in Node.js; the statistical tests were implemented using R and we used a FUSEKI server to publish the semantic information.
We choose several statistical tests frequently used with time series problems in order to check if the observations can really be considered constant, random, or an outlier. We consider a sample as a set of observations:
- To check if a sample (a set of observations) is constant, we will discard the outliers, and then we will use the standard deviation.
- In order to check if a sample is random, we will use the Bartels rank test of randomness.
- To check if a sample has outliers, we will use an autoregressive integrated moving average (ARIMA) model.
In the following subsections, we will describe the binary classifiers developed for each type of error, the statistical models used, and the parameters needed to fit them.
For all the tests, it is necessary to parameterize what the time window is that we want to analyze to classify the sensors and, in terms of computational efficiency, we must also parameterize how often we want to perform the tests.
3.1. Constant Observations Classifier
In this section, we propose a binary classifier for detecting sensors that are producing constant observations.
In Figure 3a, we can see an example of observations that seem to be constant around the value 17, although we also see that there are outliers outside the value 17.
We will use standard deviations to test whether a sensor offers constant values. The standard deviation measures the amount of variation or dispersion of a set of data values; in this sense, the outliers will negatively influence the value of the standard deviation, so we will discard them when calculating the standard deviation. If the standard deviation is lower than a given parameter, we can conclude that the values analyzed are constant.
Parameters of the model; depending on the sensor or the magnitude that the sensor is measuring, it will be necessary to adjust the standard deviation in order to consider the sample as constant. For environmental sensors, we recommend using the unit for the standard deviation and 24 h for the time window.
3.2. Random Observations Classifier
This section describes a binary classifier which proves the randomness of a sample. Figure 3 presents a sample of a sensor that apparently returns random observations range between −100 and 100. We will perform the Bartels test for randomness [19]; we choose this test because it is a nonparametric test which means it is more conservative although it has less statistical power and it is one of the most used tests to verify the randomness in time series. This test returns a p-value confirming whether the sample is random or not.
Model parametrization; we must parameterize it with the p-value that we consider maximum to accept the sample tested as random. We propose to set this parameter to 0.05 since it is the standard value of a p-value for a test to be statistically significant.
3.3. Outliers Observations Classifier
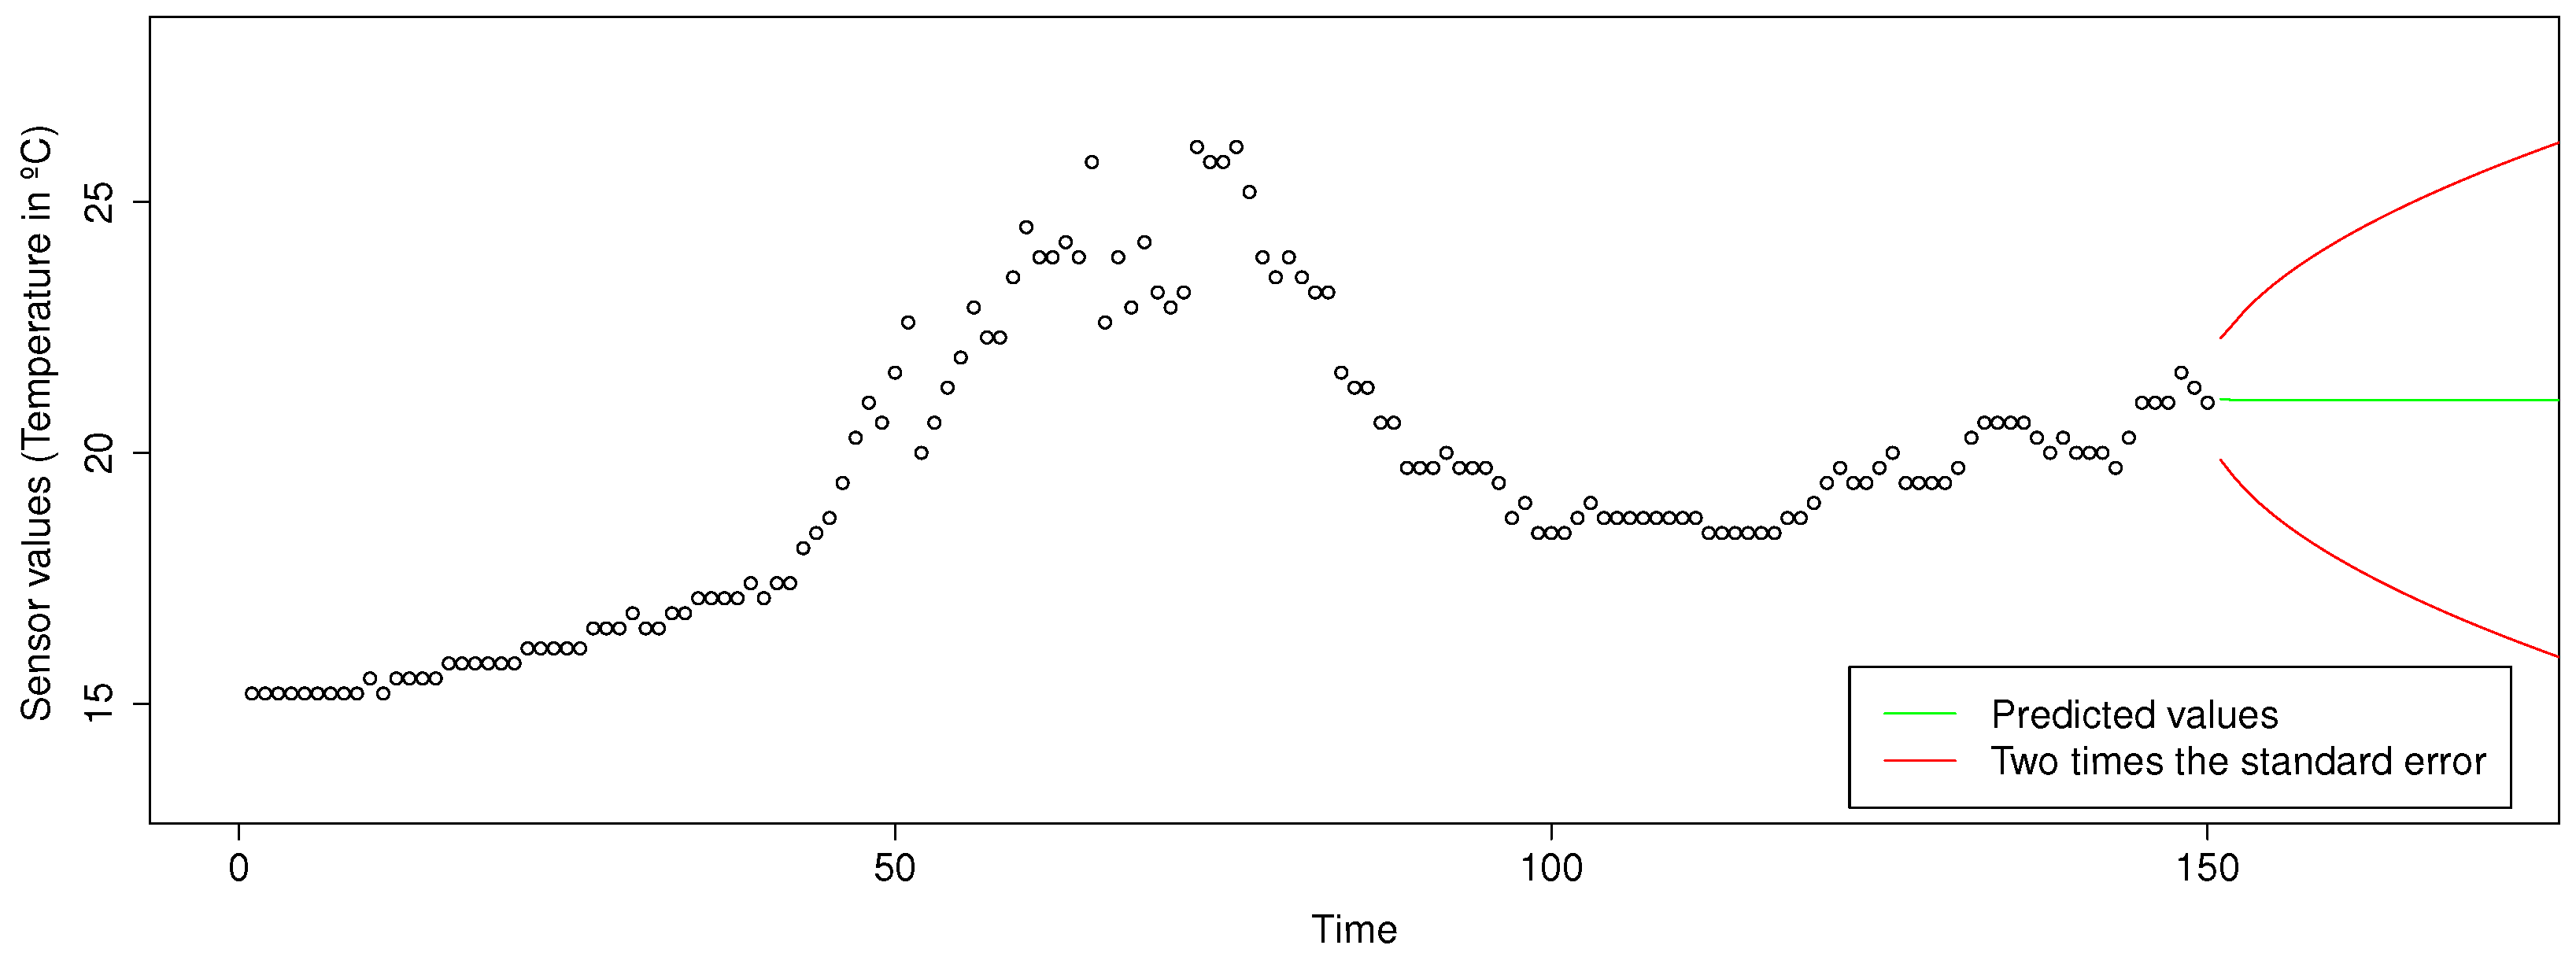
We present the last binary classifier to detect whether a sensor is producing outliers. We will use an ARIMA model to predict or forecast future points in the time series. We choose the ARIMA model because it is the most general class of models for forecasting a time series, and we considered that it would be a good technique to classify these errors. We will use the predictions made by an ARIMA model in order to compare the prediction with the next observation. If the next observation is close to the predicted value, we will not mark it as an outlier. We considered being close if the observation is two times above or below the prediction’s standard error.
Figure 4 shows with a green line the future predictions made by the ARIMA model up to the observation number 150; the two lines in red mark twice the standard error above or below the prediction. Therefore, if the next observation is in the area between the two red lines, we will consider it as normal; otherwise, the observation will be considered as an outlier.
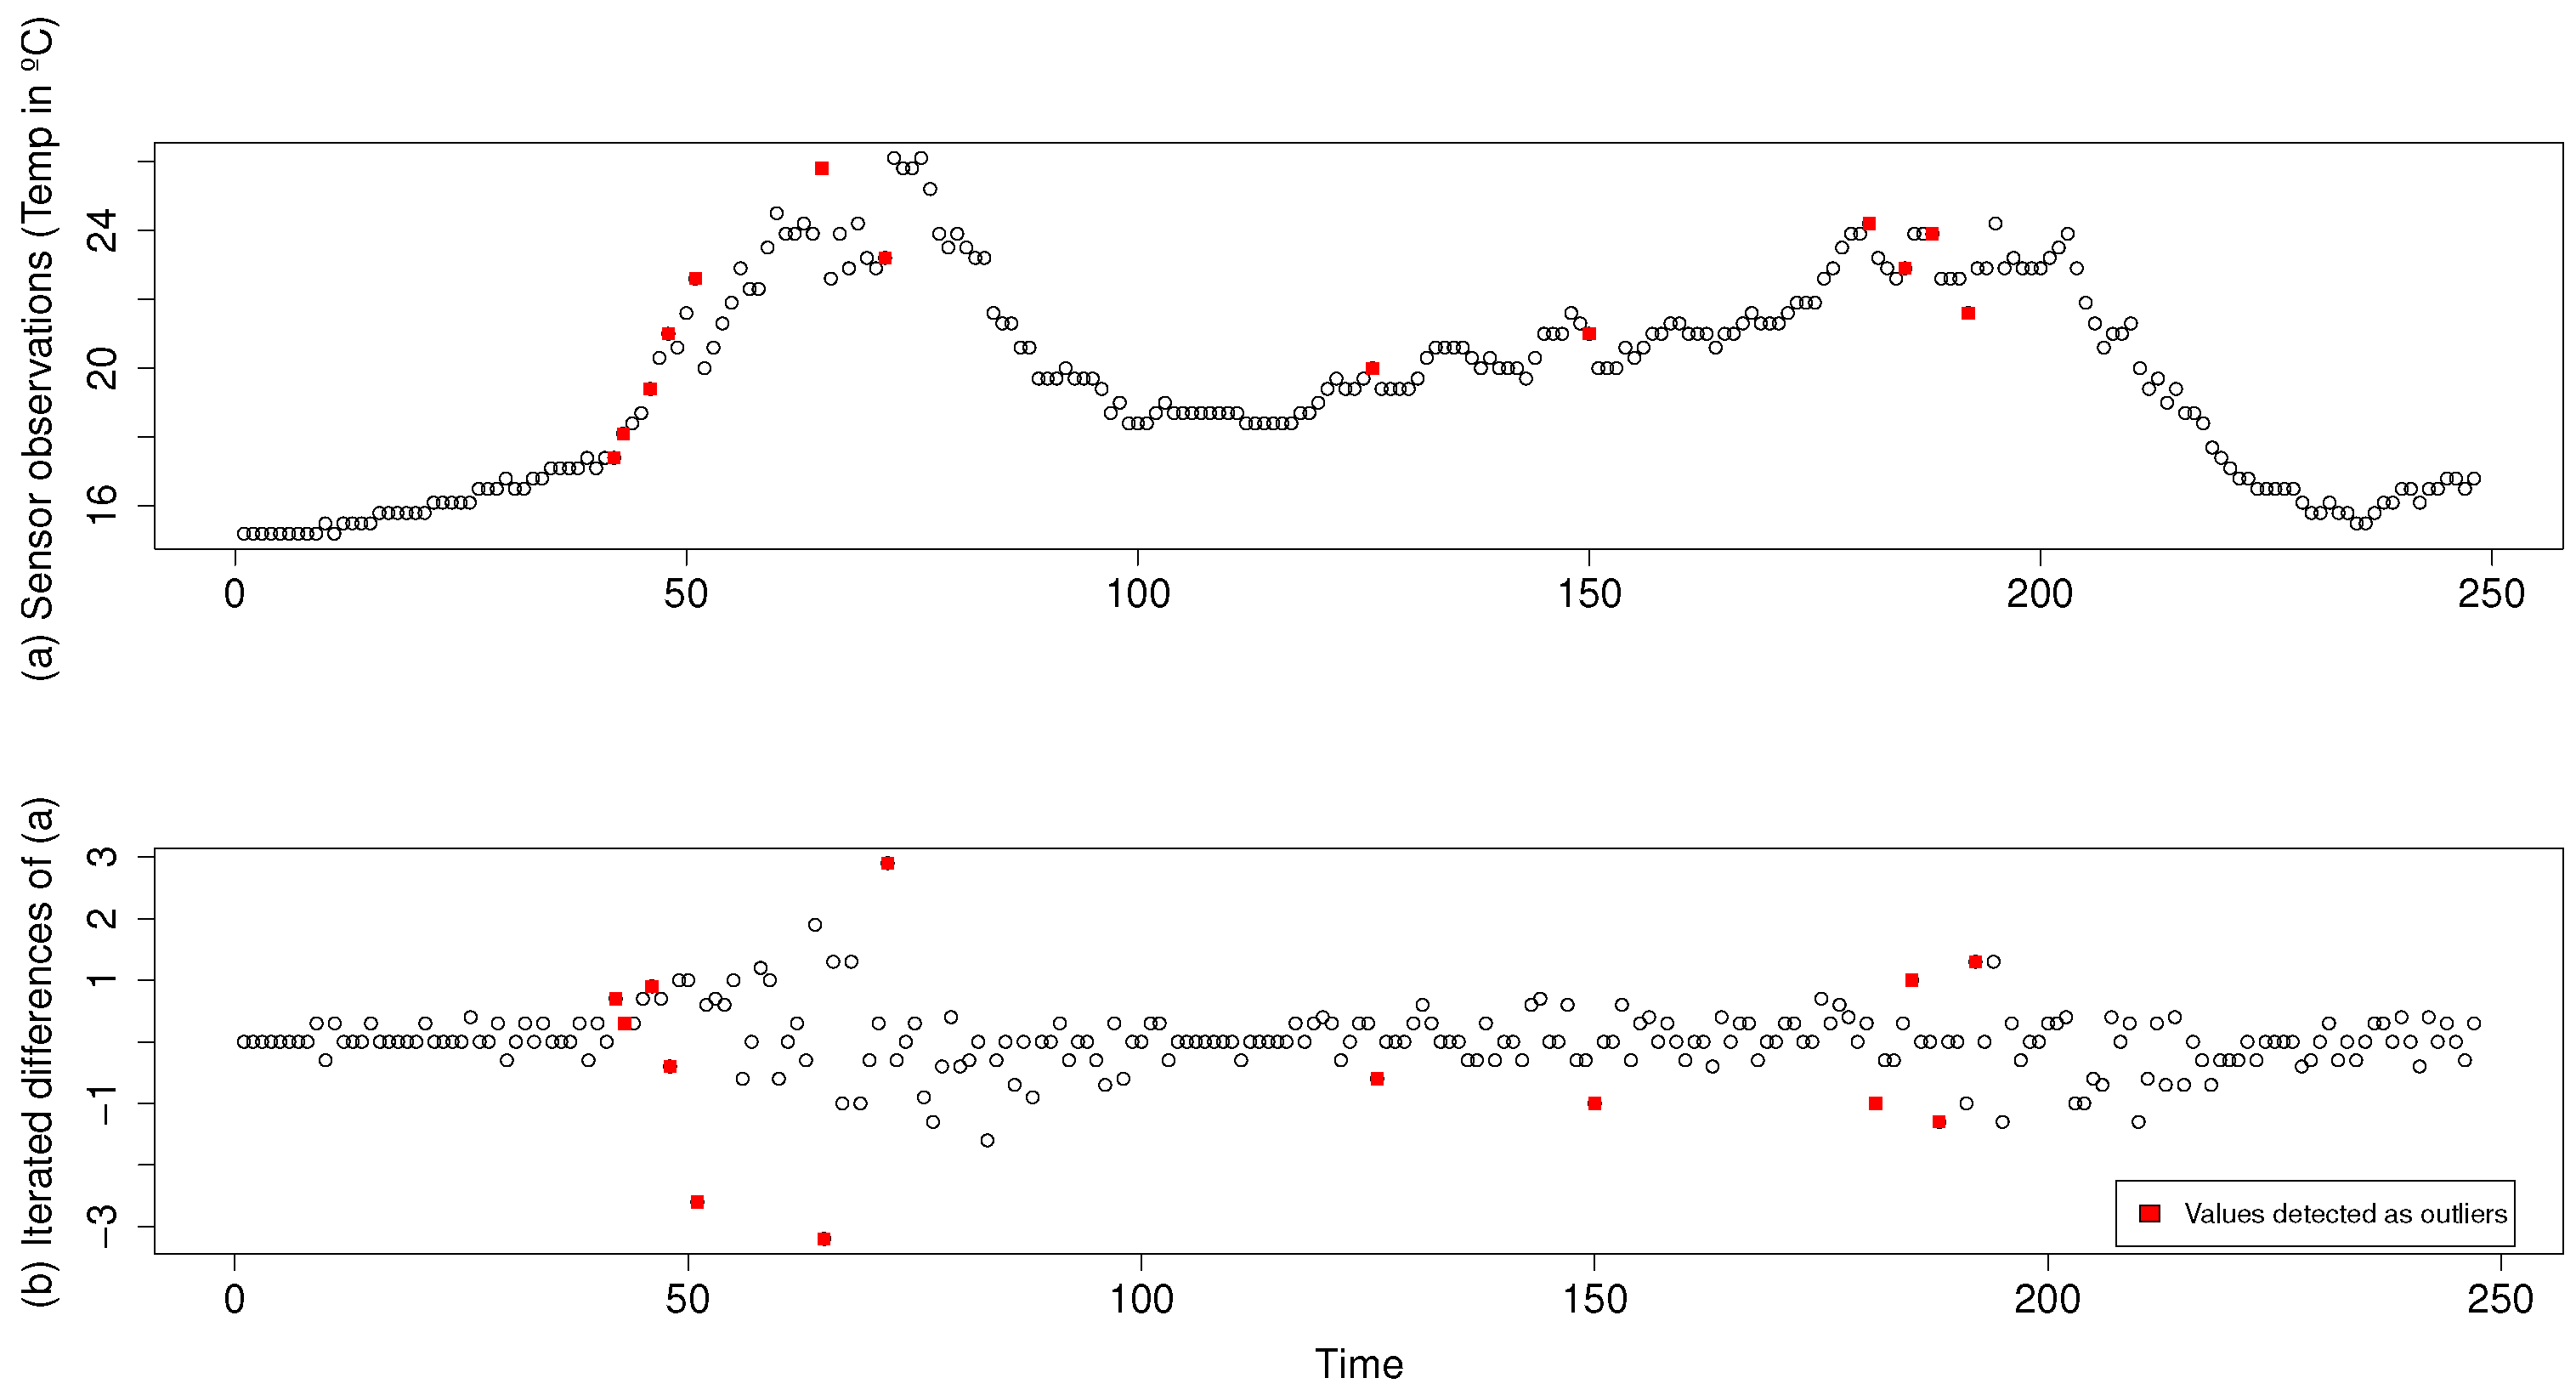
Parameters of the model; first of all, the ARIMA model needs to be fitted in order to make the best predictions. ARIMA models are denoted ARIMA(P,D,Q), where P refers to the autoregressive, D is the differencing, and Q refers the moving average. We set these values using an algorithm which auto selects the best ARIMA model values according to their Akaike information criterion (AIC). Figure 5a shows a chart of 250 samples while Figure 5b shows the iterated differences of these previous 250 samples. Normally, in the time series, the iterated differences function is used to improve ARIMA predictions; in our case, we concluded that the results were better using it instead of the raw sample data. Figure 5 shows with red squares the values that are far from the prediction performed by the ARIMA model, that is, those considered outliers.
4. Validation
In Section 1, we presented the research question that guides this research work: Is it possible to detect sensors producing erroneous observations at a high level of abstraction? In this section, we will describe the experimental validation we conducted in order to address this research question. The experimental validation consisted of verifying whether ADES is able to classify sensors by its observations correctly. According to the three types of errors described in Section 3, ADES will try to classify the sensors annotating them as erratic or normal.
We must highlight that in no case will we make electronic measurements on the sensors; all information is obtained from IoT or AmI platforms.
4.1. Context
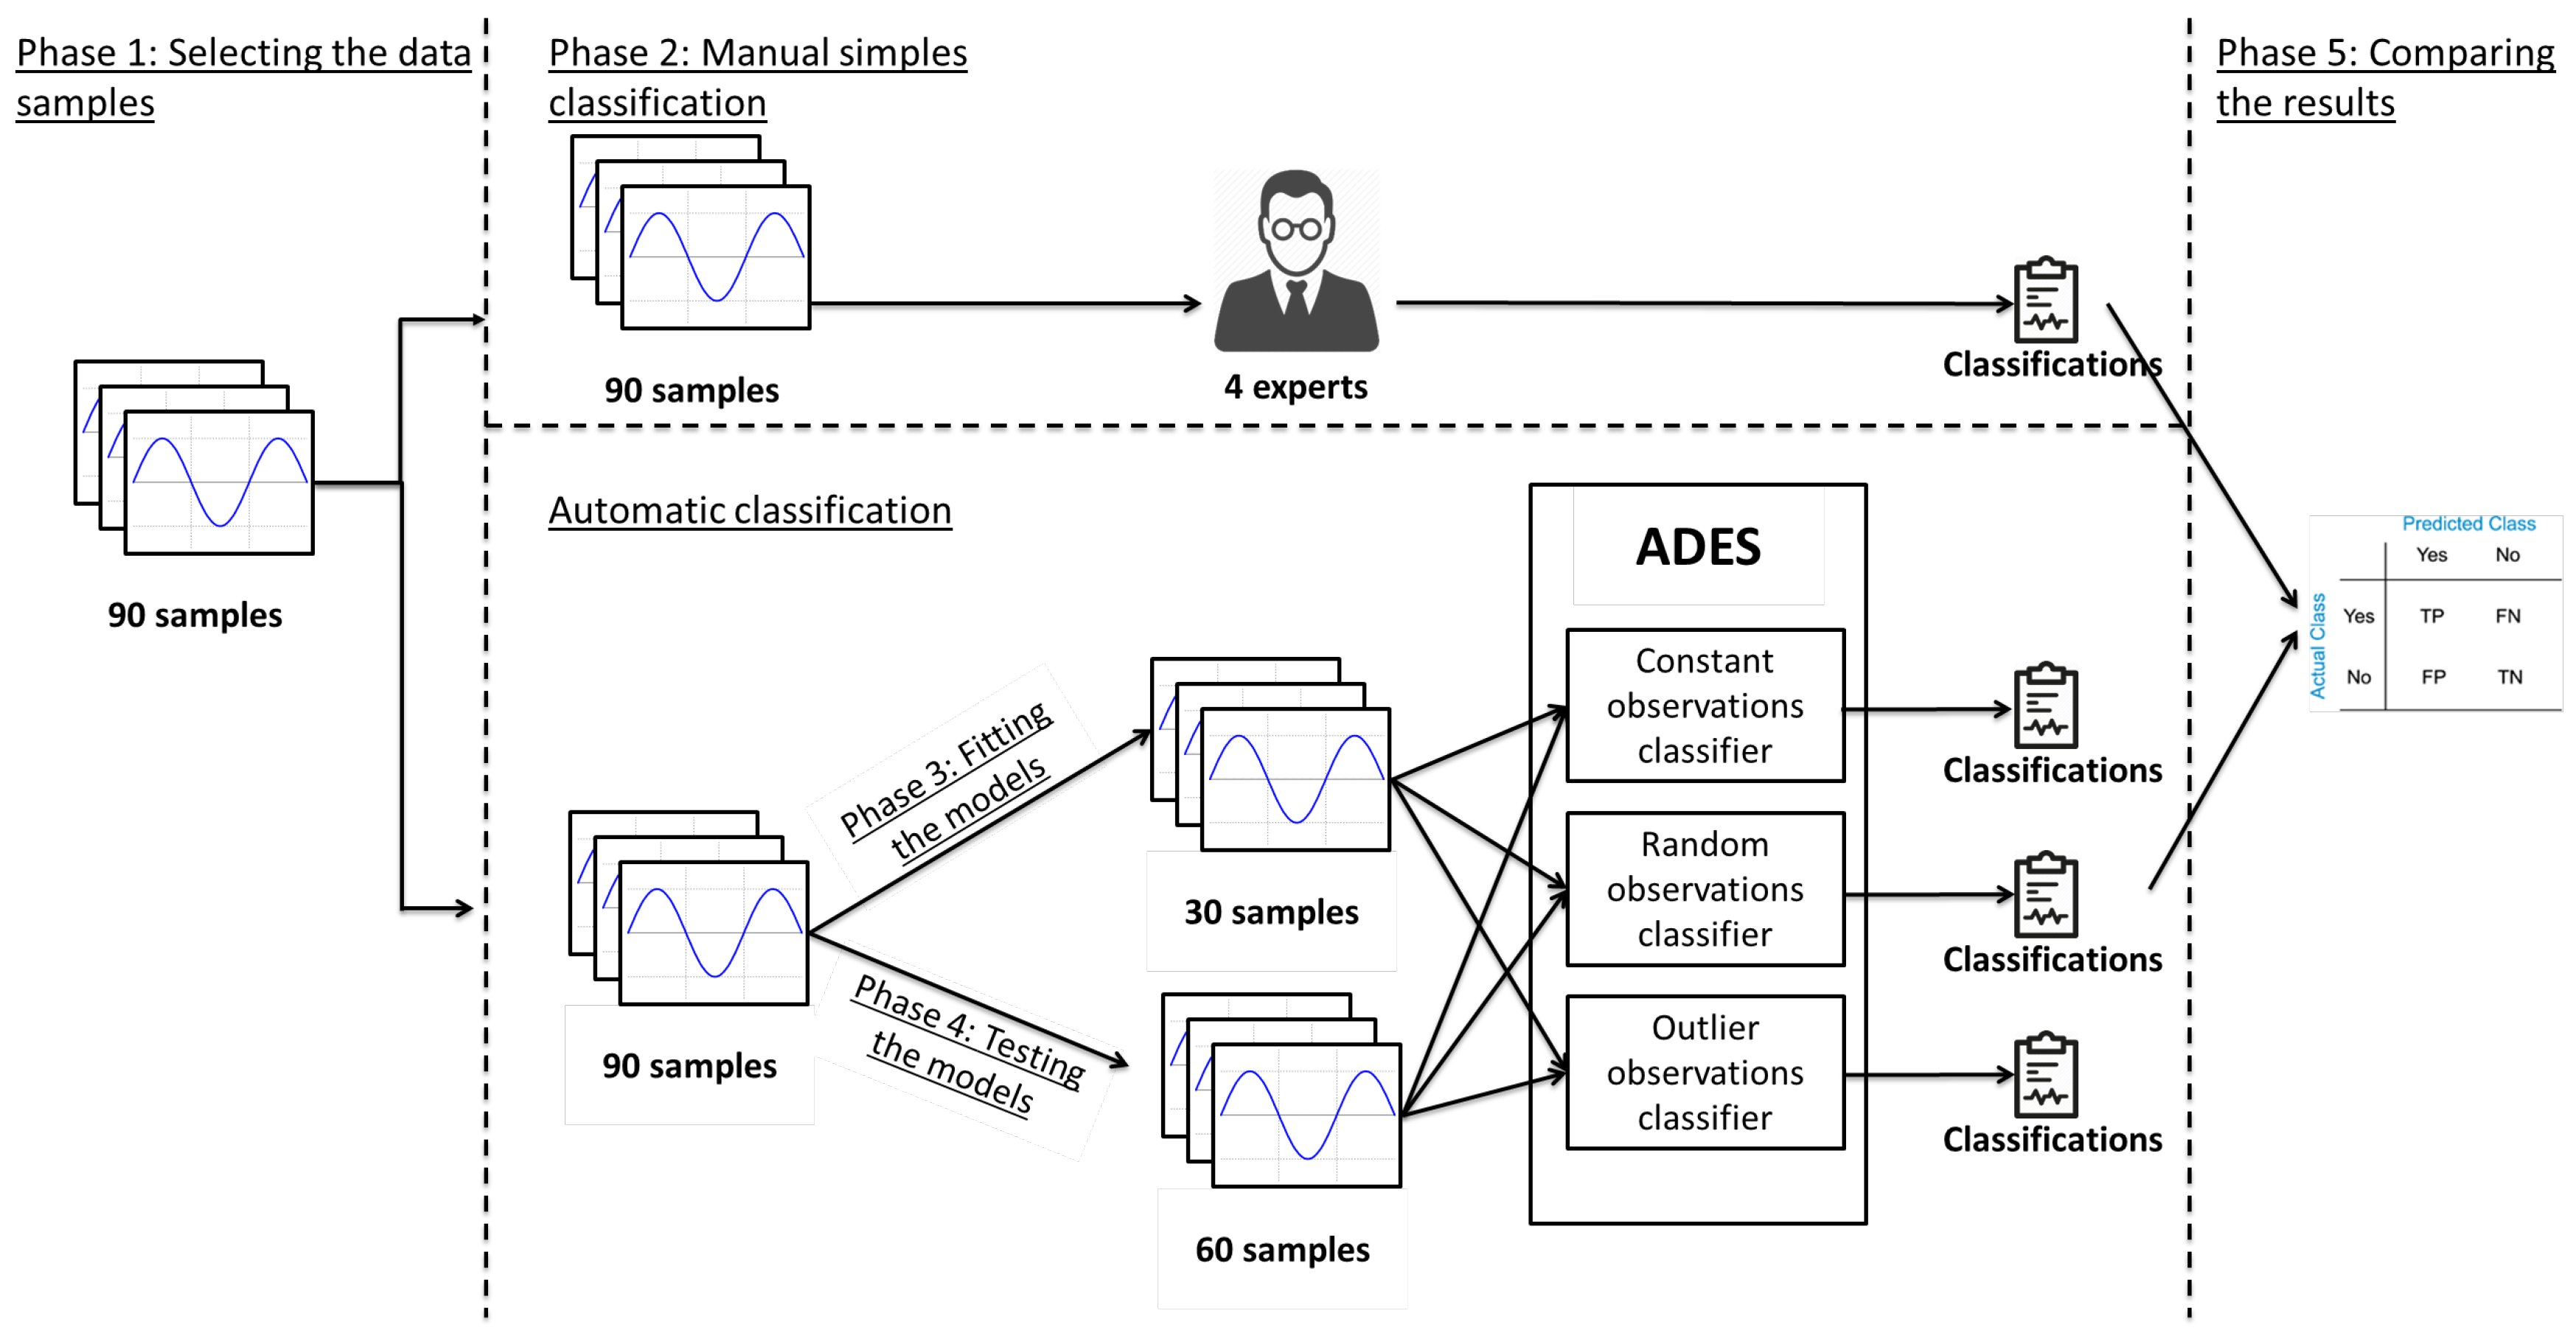
We obtained the data for the experimentation from the Fiesta-IoT platform. We selected 90 samples of time series from temperature sensors. Each sample contains a set of 250 regular time-ordered observations of temperature, taken every 5 min, in order to be considered as a time series. We choose only temperature sensors to run the experimentation to avoid having to fit several models and making experimentation simpler. As we said in Section 3, depending on the sensor, it will be necessary to fit several parameters of the model. We selected from the platform a set of 90 samples in particular for their variety of normal observations and errors. We choose a set of 30 samples to fit the models (a set of 10 samples for each classifier) and a set of 60 samples to test the models (a set of 20 samples for each classifier). (See Figure 6). In order to compare the results offered by ADES, previously, the samples were annotated and labeled manually by four experts. These annotations will be very important in order to check whether ADES correctly classifies the samples.
4.2. Plan
The experiment was divided into five phases:
- Selecting the data samples: In this phase, the authors of this research work (hereafter, experts) made an exhaustive search among the observations of the sensors in order to choose the 90 most representative samples, where half of them were normal, and the other half presented some of the errors shown in Section 3.
- Manual sample classification: The experts manually classified the 90 samples to be able to compare them with the ADES results in the following phases.
- Fitting the models: The experts fitted the models using a set of 30 samples.
- Testing the models: The experts tested the ADES models with a set of 60 samples; as a result, ADES returned the samples classified and annotated.
- Comparing the results: The experts compared the set of samples annotated by ADES and the annotated data made by themselves in phase 2.
4.3. Data Collection
Experts manually annotated the samples obtained from the Fiesta-IoT platform; this classification was considered the actual classification. ADES returned its own classification, which was considered the predicted classification. We will compose the confusion matrices with the classifications made by the experts and ADES, and we will also compose a table with the performance rates of each classifier (shown in the next Section 5).
5. Results
In this section, we will show the results obtained after the experimentation; we present them using three confusion matrices (see Table 1). These matrices offer information about the actual classifications done by the experts and predicted classifications done by ADES.
As we see in Table 1, the best classifier was “Constant observations classifier”. It correctly predicted 9 of 10 samples, failing with only one (false negative); that is, a sample considered as constant was not correctly classified. It was also able to classify all samples that were not constant, meaning there was no false positive.
The next best classifier was “Random observations classifier”, it correctly classified 8 of 10 random samples, but it did not consider two random samples as such (false negative). Regarding the samples that weren’t random, it classified three as random when there weren’t, producing three false positives.
The worst classifier was “Outliers observations classifier”; it predicted six samples as outliers correctly but left four samples incorrectly classified (false negatives). In addition, it classified three samples as outliers when in fact they were not (false positives).
Table 2 shows the prediction rates obtained by the classifiers. In terms of accuracy (how often a classifier is correct), the rates were quite high for the first two classifiers (constant and random), although none of them had 100% accuracy. The third classifier (outliers observations) obtained a regular rate (0.65) for its accuracy. All the classifiers obtained a very low false positive rate, which means that they made very few mistakes classifying samples as positive when they were not; even the first classifier did not commit any mistake regarding false positives.
6. Conclusions and Future Works
In this research work, we presented ADES, a statistical approach for classifying sensors by the errors in their observations. We presented three types of errors that we commonly saw in sensor observations: constant, random and outlier observations. This tool is able to detect erratic sensors and annotate them on a semantic platform. Using ADES will improve the quality of the data in platforms that add a vast amount of sensors, helping mainly the end-users to obtain data with more quality and the managers of these platforms to detect sensors producing errors.
In order to tackle the research question proposed in this research paper, we performed an experimental validation where firstly we designed and developed three binary classifiers based on statistical models for the detection of erratic sensors analyzing their observations; secondly, we fitted those models, and, thirdly, we tested them. The models were fitted and tested using data obtained from Fiesta-IoT, but we must highlight that this research work is independent of the Fiesta-IoT platform, that is, ADES can be adapted to work on any other platform that aggregates heterogeneous sensors.
The classifications produced by ADES were compared with a classification made by experts in order to build up the confusion matrices for the three models. With those confusion matrices, we can study the performance of the models.
Results were quite interesting: the first two classifiers (constant and random observations) had good accuracy rates, and they were able to classify most of the samples. However, the outlier observations classifier did not have a precision rate as high as the other two classifiers. It may seem that the classifier did not work as well as expected, but, after analyzing the samples classified as false positives (samples classified as positive when the actual value is not), we could observe that it was possible those false positives could be true positives and actually contained outliers. In addition, there probably was a problem of bad classification done by the experts. The problem is that there is no corpus considered as a “gold standard” to perform experiments with classification systems in the domain of the heterogeneous sensor aggregation platforms, which we consider very interesting and necessary as a possible future work.
During the experimentation, we fitted the models to be applied to observations of temperature sensors. New and more experimentation could be made by fitting the models for many other kinds of sensors as shown in Figure 2—for example, humidity sensors, GPS, solar radiation, etc.
As possible future work, it would be interesting to conduct experimentation with a greater test corpus than used in the experimentation presented in this work, although this will mean having to classify manually the whole corpus. Another possible future work could be the characterization of new errors in the sensor’s observations and the development and testing of new classifiers for these new types of errors.
In this research work, we used statistical tools such as standard deviation, outlier discarding, the Bartels test for randomness and ARIMA models for time series, but other statistical tools like linear regression, generalized additive model (GAM), or locally estimated scatterplot smoothing (LOESS) can be tried. Artificial intelligence techniques could also be applied such as, for example, artificial neural networks, convolutional neural networks, reinforcement learning, etc.—in short, any technique that allows for developing a binary classifier, even an ad hoc development for the classification of sensor observations.
Author Contributions
Conceptualization, D.M., R.A. and B.B.; Data curation, D.M.; Formal analysis, D.M. and B.B.; Funding acquisition, D.M.; Investigation, D.M., R.A. and B.B.; Methodology, D.M. and R.A.; Project administration, D.M.; Resources, R.A. and B.B.; Software, D.M. and R.A.; Supervision, D.M.; Validation, D.M.; Visualization, D.M.; Writing—original draft, D.M.; Writing—review and editing, D.M. and R.A.
Acknowledgments
The research leading to these results has received funding from FIESTA-IoT 1st Open Call and the Ministry of Economy and Competitiveness through SEMOLA project (TEC2015-68284- R)
Conflicts of Interest
The authors declare no conflict of interest.
References
- Agarwal, R.; Fernandez, D.G.; Elsaleh, T.; Gyrard, A.; Lanza, J.; Sanchez, L.; Georgantas, N.; Issarny, V. Unified IoT ontology to enable interoperability and federation of testbeds. In Proceedings of the 2016 IEEE 3rd World Forum on Internet of Things (WF-IoT), Reston, VA, USA, 12–14 December 2016; pp. 70–75. [Google Scholar]
- Martín, D.; Bordel, B.; Alcarria, R.; Sánchez-Picot, Á.; de Rivera, D.S.; Robles, T. Prosumerization Approach to Semantic Ambient Intelligence Platforms. In Proceedings of the International Conference on Ubiquitous Computing and Ambient Intelligence, Philadelphia, PA, USA, 7–10 November 2017; pp. 109–120. [Google Scholar]
- Hailemariam, E.; Goldstein, R.; Attar, R.; Khan, A. Real-time occupancy detection using decision trees with multiple sensor types. In Proceedings of the 2011 Symposium on Simulation for Architecture and Urban Design, Boston, MA, USA, 3–7 April 2011; Society for Computer Simulation International: San Diego, CA, USA, 2011; pp. 141–148. [Google Scholar]
- Maurer, U.; Smailagic, A.; Siewiorek, D.P.; Deisher, M. Activity Recognition and Monitoring Using Multiple Sensors on Different Body Positions; Technical Report; Carnegie-Mellon Univ Pittsburgh Pa School of Computer Science: Pittsburgh, PA, USA, 2006. [Google Scholar]
- Mazzone, P.J.; Hammel, J.; Dweik, R.; Na, J.; Czich, C.; Laskowski, D.; Mekhail, T. Diagnosis of lung cancer by the analysis of exhaled breath with a colorimetric sensor array. Thorax 2007, 62, 565–568. [Google Scholar] [CrossRef] [PubMed]
- Tapia, E.M.; Intille, S.S.; Larson, K. Activity recognition in the home using simple and ubiquitous sensors. In Proceedings of the International Conference on Pervasive Computing, Linz/Vienna, Austria, 21–23 April 2004; pp. 158–175. [Google Scholar]
- Mountrakis, G.; Im, J.; Ogole, C. Support vector machines in remote sensing: A review. ISPRS J. Photogramm. Remote Sens. 2011, 66, 247–259. [Google Scholar] [CrossRef]
- Ko, B.C.; Cheong, K.H.; Nam, J.Y. Fire detection based on vision sensor and support vector machines. Fire Saf. J. 2009, 44, 322–329. [Google Scholar] [CrossRef]
- Gualtieri, J.A.; Cromp, R.F. Support vector machines for hyperspectral remote sensing classification. In Proceedings of the 27th AIPR Workshop: Advances in Computer-Assisted Recognition, Washington, DC, USA, 14–16 OCTOBER 1998; International Society for Optics and Photonics: Washington, DC, USA, 1999; Volume 3584, pp. 221–232. [Google Scholar]
- Zeng, M.; Nguyen, L.T.; Yu, B.; Mengshoel, O.J.; Zhu, J.; Wu, P.; Zhang, J. Convolutional neural networks for human activity recognition using mobile sensors. In Proceedings of the IEEE 6th International Conference on Mobile Computing, Applications and Services, Austin, TX, USA, 6–7 November 2014; pp. 197–205. [Google Scholar]
- Ronao, C.A.; Cho, S.B. Human activity recognition with smartphone sensors using deep learning neural networks. Expert Syst. Appl. 2016, 59, 235–244. [Google Scholar] [CrossRef]
- Li, G.; Wang, Y. Automatic ARIMA modeling-based data aggregation scheme in wireless sensor networks. EURASIP J. Wirel. Commun. Netw. 2013, 2013, 85. [Google Scholar] [CrossRef]
- Yu, Q.; Jibin, L.; Jiang, L. An improved ARIMA-based traffic anomaly detection algorithm for wireless sensor networks. Int. J. Distrib. Sens. Netw. 2016, 12, 9653230. [Google Scholar] [CrossRef]
- Gubbi, J.; Buyya, R.; Marusic, S.; Palaniswami, M. Internet of Things (IoT): A vision, architectural elements, and future directions. Future Gener. Comput. Syst. 2013, 29, 1645–1660. [Google Scholar] [CrossRef]
- Barnaghi, P.; Wang, W.; Henson, C.; Taylor, K. Semantics for the Internet of Things: Early progress and back to the future. Int. J. Semant. Web Inf. Syst. (IJSWIS) 2012, 8, 1–21. [Google Scholar] [CrossRef]
- Gyrard, A.; Serrano, M.; Atemezing, G.A. Semantic web methodologies, best practices and ontology engineering applied to Internet of Things. In Proceedings of the 2015 IEEE 2nd World Forum on Internet of Things (WF-IoT), Milano, Italy, 14–16 December 2015; pp. 412–417. [Google Scholar]
- Gyrard, A.; Serrano, M. Fiesta-iot: Federated interoperable semantic internet of things (iot) testbeds and applications. ICT. 2015. [Google Scholar]
- Compton, M.; Barnaghi, P.; Bermudez, L.; GarcíA-Castro, R.; Corcho, O.; Cox, S.; Graybeal, J.; Hauswirth, M.; Henson, C.; Herzog, A.; et al. The SSN ontology of the W3C semantic sensor network incubator group. J. Web Semant. 2012, 17, 25–32. [Google Scholar] [CrossRef]
- Bartels, R. The rank version of von Neumann’s ratio test for randomness. J. Am. Stat. Assoc. 1982, 77, 40–46. [Google Scholar] [CrossRef]
Figure 1.
Automatic Detection of Erratic Sensors in an ambient intelligence platform based on semantic data.
Figure 1.
Automatic Detection of Erratic Sensors in an ambient intelligence platform based on semantic data.

Figure 2.
Excerpt from sensor types described in Semantic Sensor Network Ontology.

Figure 3.
Example of three types of errors. Please note that the y-axis is not on the same scale.

Figure 4.
Temperature measurements up to sample 150. The green line represents the predictions made by an ARIMA model, and the lines in red are twice the standard error.
Figure 4.
Temperature measurements up to sample 150. The green line represents the predictions made by an ARIMA model, and the lines in red are twice the standard error.

Figure 5.
(a) shows a series of 250 samples from a temperature sensor and (b) represents the iterated differences of the samples of the chart (a). In red, we can see the outliers considered by the ARIMA model (observations were taken every 5 min.)
Figure 5.
(a) shows a series of 250 samples from a temperature sensor and (b) represents the iterated differences of the samples of the chart (a). In red, we can see the outliers considered by the ARIMA model (observations were taken every 5 min.)

Figure 6.
Experiment plan.


Table 1.
Confusion matrices.
| (a) Constant observations classifier | ||||
| Predicted | ||||
| Yes | No | Total | ||
| Actual | Yes | 9 | 1 | 10 |
| No | 0 | 10 | 10 | |
| Total | 9 | 11 | 20 | |
| (b) Random observations classifier | ||||
| Predicted | ||||
| Yes | No | Total | ||
| Actual | Yes | 8 | 2 | 10 |
| No | 3 | 7 | 10 | |
| Total | 11 | 9 | 20 | |
| (c) Outliers observations classifier | ||||
| Predicted | ||||
| Yes | No | Total | ||
| Actual | Yes | 6 | 4 | 10 |
| No | 3 | 7 | 10 | |
| Total | 9 | 11 | 20 | |
Table 2.
Prediction rates of the classifiers.
| Constant Observations Classifier | Random Observations Classifier | Outlier Observations Classifier | |
|---|---|---|---|
| Accuracy | 0.95 | 0.75 | 0.65 |
| Misclassification rate | 0.05 | 0.25 | 0.35 |
| True Positive Rate | 0.9 | 0.8 | 0.6 |
| False Positive Rate | 0 | 0.3 | 0.3 |
| True Negative Rate | 1 | 0.7 | 0.7 |
| Precision | 1 | 0.73 | 0.67 |
| Prevelence | 0.5 | 0.5 | 0.5 |
© 2019 by the authors. Licensee MDPI, Basel, Switzerland. This article is an open access article distributed under the terms and conditions of the Creative Commons Attribution (CC BY) license (http://creativecommons.org/licenses/by/4.0/).
Share and Cite
MDPI and ACS Style
Martín, D.; Bordel, B.; Alcarria, R. Automatic Detection of Erratic Sensor Observations in Ami Platforms: A Statistical Approach †. Proceedings 2019, 31, 55. https://doi.org/10.3390/proceedings2019031055
AMA Style
Martín D, Bordel B, Alcarria R. Automatic Detection of Erratic Sensor Observations in Ami Platforms: A Statistical Approach †. Proceedings. 2019; 31(1):55. https://doi.org/10.3390/proceedings2019031055
Chicago/Turabian StyleMartín, Diego, Borja Bordel, and Ramón Alcarria. 2019. "Automatic Detection of Erratic Sensor Observations in Ami Platforms: A Statistical Approach †" Proceedings 31, no. 1: 55. https://doi.org/10.3390/proceedings2019031055