
Hazard Assessment of Typhoon on the Southeast Coast of China Using Grid Fixed-Point Method †


1
The Academy of Digital China (Fujian), Fuzhou University, Fuzhou 350108, China
2
Key Laboratory of Spatial Data Mining and Information Sharing of Ministry of Education, Fuzhou University, Fuzhou 350108, China
*
Author to whom correspondence should be addressed.
†
Presented at the 4th International Electronic Conference on Geosciences, 1–15 December 2022; Available online: https://sciforum.net/event/IECG2022 .
Proceedings 2023, 87(1), 23; https://doi.org/10.3390/IECG2022-14263
Published: 20 March 2023
(This article belongs to the Proceedings of The 4th International Electronic Conference on Geosciences)
Abstract
:Typhoon hazard assessment is the basis of loss estimation and disaster prevention and mitigation. This study investigates the use of the grid fixed-point method to assess typhoon hazards. We conducted experiments on the southeast coast of China based on site data. In this paper, we first divided this study area into 0.25° × 0.25° grids by using the grid fixed-point method, and performed wind field simulation using each grid center point as the study point that was based on typhoon track data from 1960–2019. Next, we performed 50 and 100-year wind speed estimation of the return period by constructing the 60-year wind speed extreme value sequence of the grid center point and using the extreme value distribution function. At last, we implemented the discussion regarding spatial distribution characteristics of typhoon disasters. Our results show that the wind speed changes greatly and that there is a certain gradient change in the near coastal areas. Moreover, we can see that wind speeds began to weaken rapidly near inland, reaching a plateau in inland. Furthermore, the island has a higher wind speed compared with other areas. We can conclude that the proposed methods have a high potential for assessing typhoon hazards from station data.
1. Introduction
The southeastern coast of China is one of the areas most severely affected by typhoons [1]. As one of the main hazards of typhoons, typhoon gales not only cause huge economic losses, but also determine the magnitude of the risk of other secondary hazards, such as storm surges and waves. Therefore, analyzing typhoon hazards and predicting the extreme wind speed of typhoons is essential for the design of wind-resistant structures and typhoon disaster prevention and mitigation in coastal areas.
Typhoon hazard is usually quantified by the statistical distribution of typhoon intensity and frequency, and is presented in the form of return period wind speed maps. The frequency of winds at a single station is generally analyzed using extreme value theory. However, it needs to model historical or stochastic simulated typhoon wind fields based on Monte Carlo methods for local areas, where ground-based observations are limited. Ref. [2] uses an empirical typhoon model to estimate typhoon wind speeds and calculate typhoon wind speed extremes in the Gulf of Mexico. For larger areas, wind field simulations based on full typhoon track models can compensate for the lack of historical typhoon samples, but the process is more cumbersome [3]. Ref. [4] uses this method to model the entire track of typhoons to study the continuously changing typhoon climate on the United States coast. Ref. [5] applies a simplified, full-track model to analyze typhoon hazards in China. For long-series historical observation data, the reliable wind speed return period calculation results can be obtained based on station data by making full use of historical sample information. However, the station data are limited and unevenly distributed. Therefore, this paper first divides the southeast coastal area into a 0.25° × 0.25° grid-by-grid fixed method and then uses the center point of each grid as the study point for wind field simulation based on the typhoon path data from 1960 to 2019.
2. Study Area and Data
We obtained typhoon data from the CMA Best Track Dataset of the Shanghai Typhoon Research Institute of the China Meteorological Administration [6]. This data includes location and intensity information of typhoons at 6 h intervals. More specifically, it contains the typhoon name, number, typhoon center location, center pressure, and a mean of 2 min maximum wind speed, close to the typhoon center. Considering the completeness of the data, all typhoons occurring in the northwest Pacific Ocean from 1960 to 2019 were selected for analysis.
We choose station observation data from 123 meteorological stations on the southeast coast (Figure 1) from 1960 to 2019, and these were obtained from the National Climatic Data Center (NCDC), which includes hourly average wind speeds.
3. Methods
3.1. Typhoon Wind Field Simulation
Parametric typhoon wind field models are an important tool for typhoon hazard assessment and are particularly suitable for the study of huge sample statistical probability patterns of the regional typhoon. In general, a parametric wind field model consists of a gradient wind model and a boundary layer model. Gradient winds can be modeled by using observed typhoon parameters, e.g., location, intensity, size, direction, and speed of movement, which are usually available or can be obtained from typhoon track datasets. The boundary layer model contributes to improving the modeling of the spatial heterogeneity of wind speeds by taking into account the effects of local surface roughness and converting gradient winds into surface winds at a height of 10 m.
3.1.1. Gradient Layer Model
The gradient model is used as the first component of a wind field model to simulate the distribution of typhoon wind speeds in the gradient layer without considering the near-surface topography. In this paper, we use a gradient wind field model (referring to [7]):
where , , are gradient layer wind speed, radial wind profile shape factor, the radius of maximum wind speed, the difference between the outer pressure and the minimum pressure at the center of the typhoon, Coriolis parameter, the radius of the typhoon wind field, and the air density, respectively. Among them, the outer pressure is not affected by the typhoon, and the default for the northwest Pacific is 1010 hPa.
According to Equation (1), it can be seen that the maximum wind speed radius and the radial wind profile shape factor have an important influence on the wind speed simulation. Due to the typhoon track data released by various weather station agencies rarely containing records of , there is a lack of upper-level mirror wind profile data for typhoons in China, which leads to failing to obtain Holland coefficient samples. Therefore, these parameters are derived to establish the statistical relationships between them and other indicators. In this paper, we use an equation, referring to [8], to fit the radius of the maximum wind speed and the Holland coefficient:
where is the radius of maximum wind speed, while coefficient is obtained according to:
where is the latitude of the typhoon center point.
3.1.2. Gradient Layer Model
Typhoon gales that cause disasters are usually referred to as boundary layer wind speeds, namely near-surface wind speeds. Typhoons are influenced by topographic features at boundary layer heights. Therefore, after obtaining the gradient layer wind speed, it needs to be converted to the boundary layer wind speed. In this paper, we use the Ishihara boundary layer model [9] to convert the mean wind speed at the gradient layer into the mean wind speed at a height of 10 m from the surface. Moreover, we introduce an “equivalent roughness length” that can take into account complex factors, such as topography. It can reflect the interrelationship between the typhoon wind field and the various forces and can derive a complete analytical solution for the gradient winds by the following equation:
where is the wind speed at height . , , , and are the surface roughness, the wind speed at the gradient layer, the height of the gradient layer, and the power law index of the wind speed profile, respectively. and both rely on ; therefore, surface wind speed is greatly influenced by .
3.2. Typhoon Extreme Wind Speed Forecast
Generalized Extreme Value (GEV) theory is often used to quantify the relationship between the intensity and frequency of extreme natural events [10]. The Gumbel distribution is usually chosen [11] to estimate wind speed, and its cumulative distribution function (CDF) can be described as:
where is the position parameter and is the scale parameter. is the Euler coefficient with a value of 0.577216. In this paper, and is the mean and standard deviation of the annual maximum typhoon wind speeds, which can be obtained from the time series of the modeled historical footprint. The year recurrence period of the wind speed can be obtained using the following equation:
In addition to the expected wind speeds for a given return period, the uncertainty in the estimates is important for understanding and applying typhoon hazards. In this study, the uncertainty is quantified using confidence tests. The magnitude of the error at the 95% confidence interval of return period wind speed in year can be expressed as:
where is the standard normal distribution of the upper quantile with an estimated value of 1.96. The estimates for , and are , , and , respectively. The uncertainty in the typhoon hazard estimate can be expressed as:
4. Results
4.1. Typhoon Wind Field Simulation and Hazard Analysis
To further investigate the risk of typhoons in the southeast coastal areas and the differences in the risk of different types of tracks, we simulate the typhoon wind field based on the classification of the track. By doing so, we can obtain annual extreme value series of typhoon wind speeds, and thus estimate the 50- and 100-year return period wind speeds of typhoons.
4.1.1. Validation of Wind Field Simulation Results
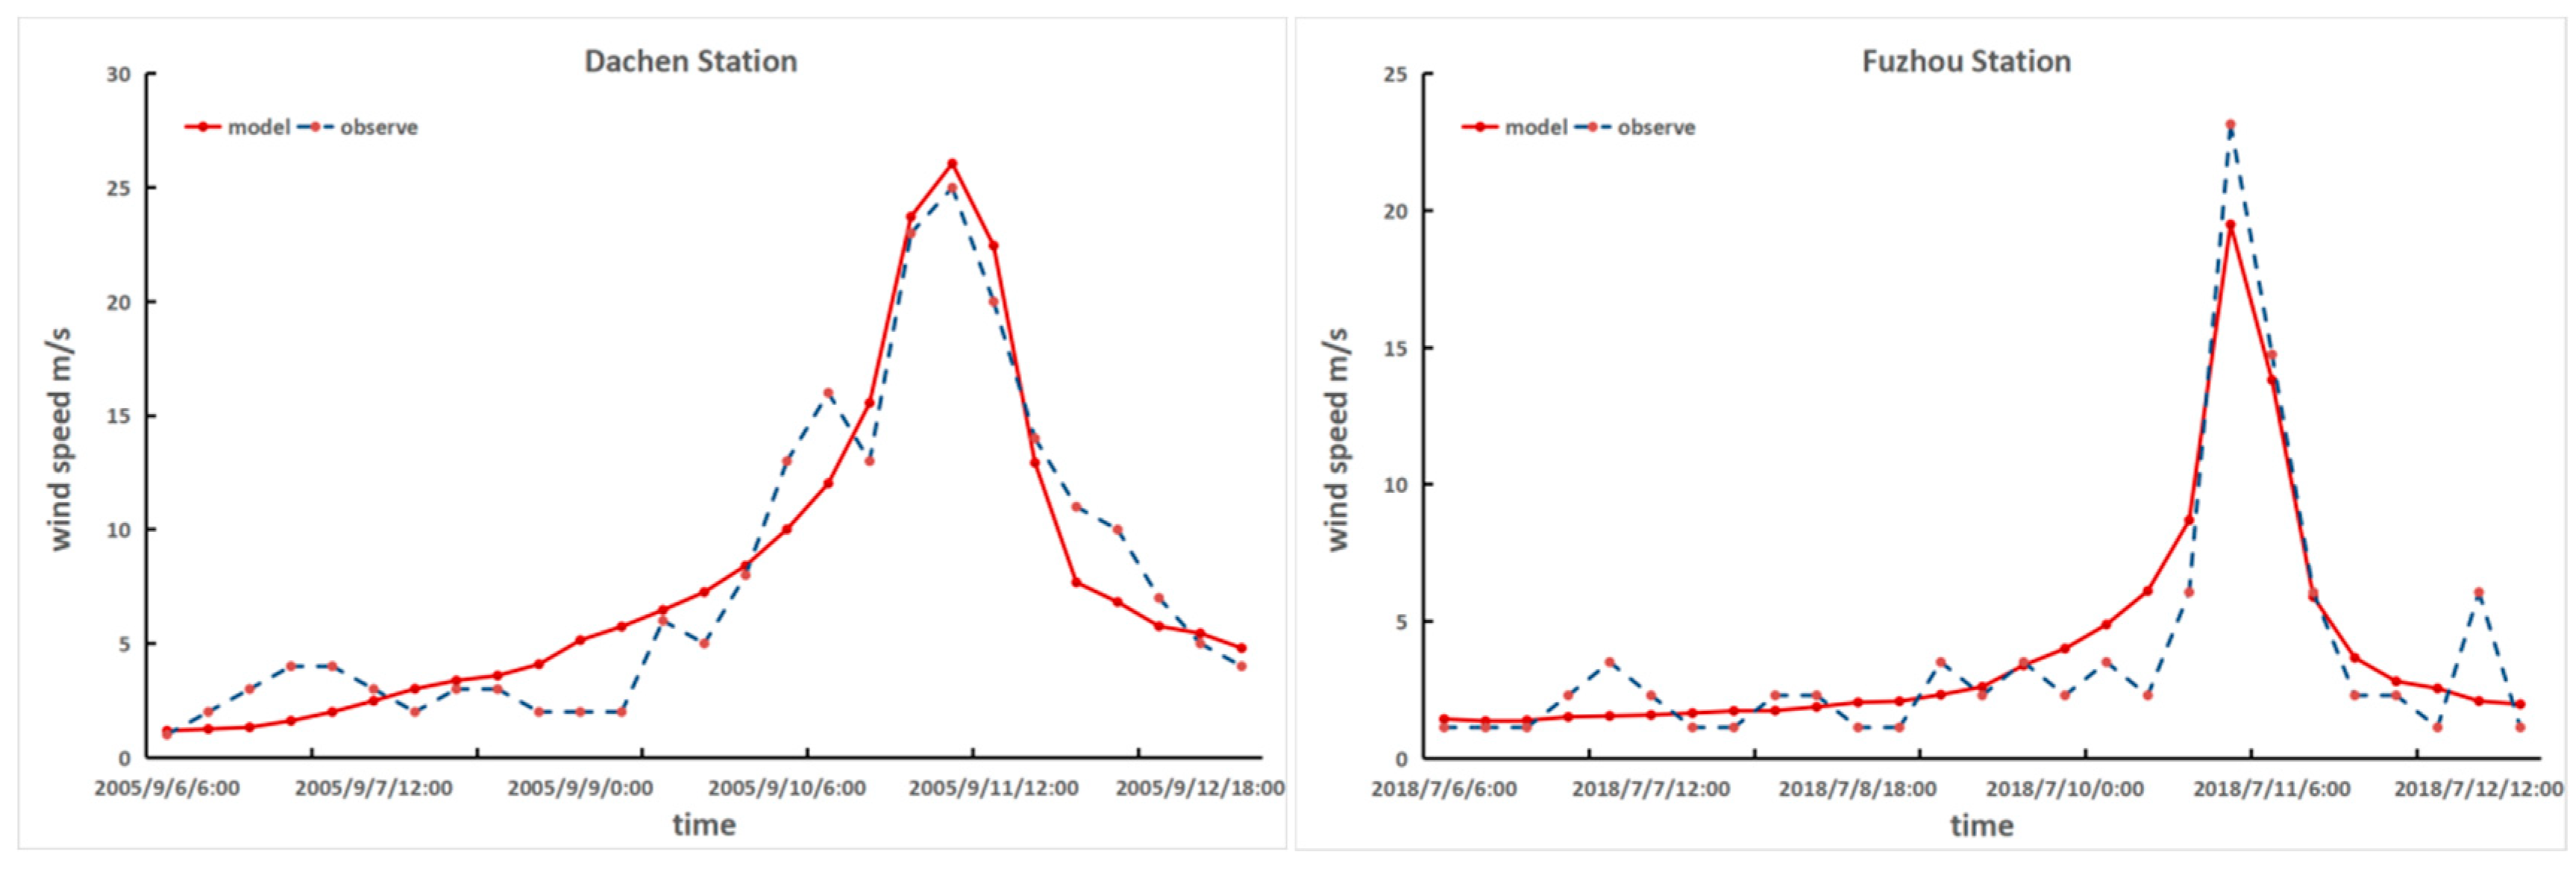
Based on the wind field model, it is possible to simulate the instantaneous wind field at any given time and obtain the maximum wind speed during each typhoon track. We use = 0.03 m for standard B landforms (field, countryside, jungle, flat open land) and = 0.01 m for A landforms (sea, coast, open water), referring to [12]. This paper simulates the distribution of wind fields passing through the southeast coast over 60 years from 1960 to 2019. To verify the reliability of the model simulation results, we compared them with the actual wind speed measured at the stations. Typhoon Kanu in 2005 (Typhoon 0515) and Typhoon Maria in 2018 (Typhoon 1808) are selected for analysis and validation at the Dachen and Fuzhou stations, respectively.
Figure 2 and Figure 3 show the comparison results of measured and simulated wind speed. The results imply that the overall trend of the simulated wind speed is consistent with the measured wind speed. In addition, the difference between the simulated wind speed and the measured wind speed is relatively small in terms of wind speed values, which indicates that the used wind field parameter model can better reproduce the characteristics of typhoons in the southeast coastal areas.
4.1.2. Return Period Estimation of the Southeast Coastal Areas
We extracted the maximum wind speed of typhoons at the observation station based on the results of the typhoon wind field simulations, and thus, constituting to the extreme wind speed series. Based on the historical time series of the simulated wind field and the adopted GEV method, the wind speeds and corresponding uncertainties can be estimated for any return period. Finally, we estimated extreme wind speeds of typhoons on the southeast coast based on both station and grid data, respectively.
In this paper, the historical typhoon event datasets from 1960–2019 are used as model input data to simulate the typhoon wind field within the southeast coastal areas by using a parametric wind field model to estimate the typhoon hazard in the areas. To verify the accuracy of the extreme wind speeds predicted by the proposed method, we predicted the 50- and 100-year return period wind speeds (see Table 1) of selected cities (see Table 2) in the southeast coastal areas. Additionally, we further compared derived results with the Load Code for the design of building structures GB 50009-2012 [12] (i.e., building code).
In comparison with the building code, the overall simulation results for the 50 and 100 years return period wind speeds are slightly lower. This difference is related to the wind speed determination method of the building code. The wind speeds of the building code were estimated using probability density functions of decades of observations from meteorological stations. These observation data contain not only typhoon wind speed data but also regular typhoon gale data, which leads to the differences in the wind speed samples, and thus produce large differences between the design wind speeds of building code and extreme wind speeds of typhoons.
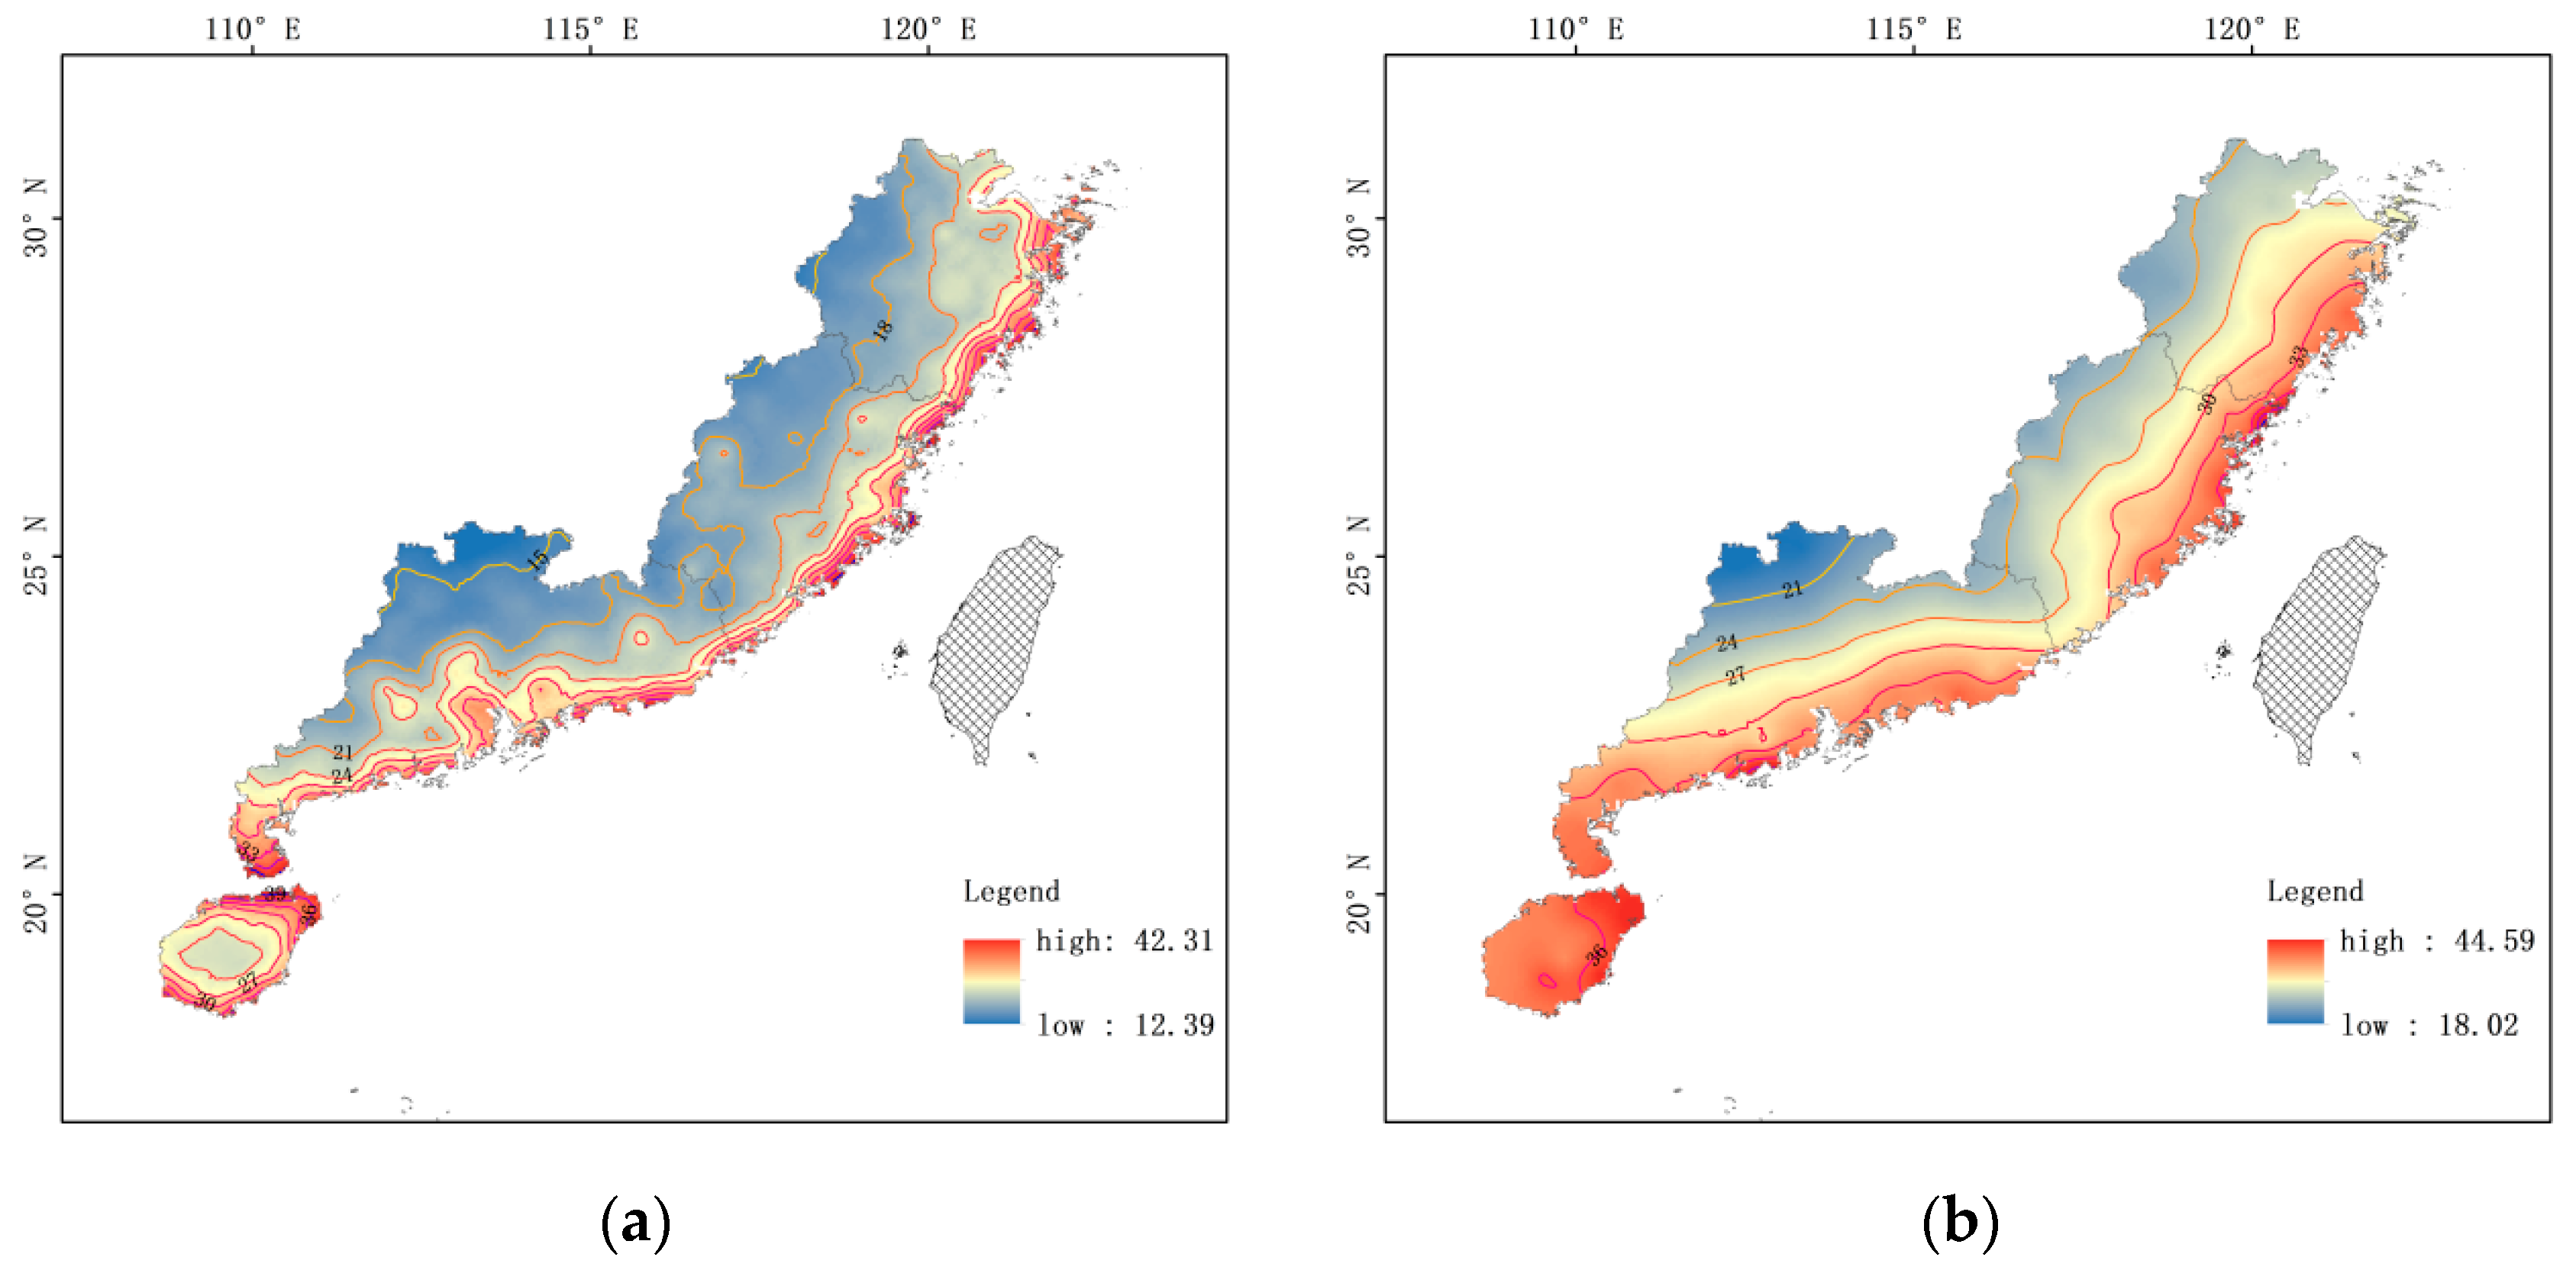
Figure 4 and Figure 5 show contour maps of the extreme wind speed at 50 and 100 years on the southeast coastal areas of China. We can see that the wind speeds in the coastal areas vary considerably with a certain gradient shape and a clear stratification phenomenon. The contour maps of extreme wind speed in both the station-based and grid-based data, the former having a higher overall extreme wind speed than the latter. Nonetheless, grid-based results have a more pronounced overall trend for the weakening effect of land on typhoon wind fields after landfall than station-based. This is because the grid data is more evenly distributed and dense, and better able to reflect the immediate changes in the wind field compared with station data.
Meanwhile, the overall distribution of typhoons show that the coastal areas near the coastline are more severely affected by typhoon wind fields. However, the extreme wind speeds in the southern coastal areas of Fujian Province have significantly reduced compared with northern and southern coastal areas, which attribute to the influence of the central mountain range of Taiwan Island.
5. Conclusions
In this paper, we simulate the historical typhoon wind field by using the wind field parameter model based on the landfall typhoon track data from 1960 to 2019 on the southeast coast of China. Moreover, we construct a 60-year extreme wind speed series based on the wind field simulation results, and then use the extreme value distribution function to estimate the 50-year and 100-year return period wind speed of the southeast coast. Lastly, we analyze the typhoon hazard of each city on the southeast coast.
By comparing the results of extreme wind speed estimates on the southeast coast based on grid data and station data, we can find that the simulated extreme wind speeds based on the grid data can clearly reflect the weakening effect of land on the typhoon wind field. We also further clarify the produced reason for the differences. Clearly, for the contour map of the extreme wind speed, we can see that the extreme wind speed of the southeast coastal areas shows a certain gradient change. Moreover, there is a large change in wind speed near the coast, and the wind speed starts to weaken rapidly near the inland area and gradually reaches a plateau. More clearly, our results show that the near-coast areas of Hainan Province, Guangdong Province, Zhejiang Province, and Fujian Province are most severely affected by strong typhoons.
Author Contributions
Y.Y.: writing—original draft preparation, formal analysis; G.X.: writing—review and editing, supervision, project administration, funding acquisition. All authors have read and agreed to the published version of the manuscript.
Funding
This research was funded by Strategic Priority Science and Technology Project of Chinese Academy of Sciences (Class A), No. XDA23100504, and the Central Guided Local Development of Science and Technology Project, No. 2020L3005.
Institutional Review Board Statement
Not applicable.
Informed Consent Statement
Not applicable.
Data Availability Statement
The CMA Best Track Dataset and the station observation data are publicly available from https://tcdata.typhoon.org.cn/ and https://www.ncei.noaa.gov/ (accessed on 30 January 2022), respectively.
Conflicts of Interest
The authors declare no conflict of interest.
References
- Jie, L.; Xu, H.A. Typhoon hazard analysis based on the probability density evolution theory. J. Wind. Eng. Ind. Aerodyn. 2021, 219, 104796. [Google Scholar] [CrossRef]
- Russell, L.B. Probability Distributions for Texas Gulf Coast Hurricane Effects of Engineering Interest; Stanford University: Stanford, CA, USA, 1969. [Google Scholar]
- Hong, X.; Li, J. A beta-advection typhoon track model and its application for typhoon hazard assessment. J. Wind. Eng. Ind. Aerodyn. 2021, 208, 104439. [Google Scholar] [CrossRef]
- Vickery, P.J.; Skerlj, P.F.; Twisdale, L.A. Simulation of Hurricane Risk in the U.S. Using Empirical Track Model. J. Struct. Eng. 2000, 126, 1222–1237. [Google Scholar] [CrossRef]
- Li, S.H.; Hong, H.P. Typhoon wind hazard estimation for China using an empirical track model. Nat. Hazards 2016, 82, 1009–1029. [Google Scholar] [CrossRef]
- Lu, X.Q.; Yu, H.; Ying, M.; Zhao, B.K.; Zhang, S.; Lin, L.M.; Bai, L.N.; Wan, R.J. Western North Pacific tropical cyclone database created by the China Meteorological Administration. Adv. Atmos. Sci. 2021, 38, 690–699. [Google Scholar] [CrossRef]
- Georgiou, P.N.; Davenport, A.G.; Vickery, B.J. Design wind speeds in regions dominated by tropical cyclones. J. Wind. Eng. Ind. Aerodyn. 1983, 13, 139–152. [Google Scholar] [CrossRef]
- Vickery, P.J.; Wadhera, D. Statistical Models of Holland Pressure Profile Parameter and Radius to Maximum Winds of Hurricanes from Flight-Level Pressure and H*Wind Data. J. Appl. Meteorol. Climatol. 2008, 47, 2497–2517. [Google Scholar] [CrossRef]
- Meng, Y.; Matsui, M.; Hibi, K. A numerical study of the wind field in a typhoon boundary layer. J. Wind. Eng. Ind. Aerodyn. 1997, 67, 437–448. [Google Scholar] [CrossRef]
- Tan, C.; Fang, W. Mapping the wind hazard of global tropical cyclones with parametric wind field models by considering the effects of local factors. Int. J. Disaster Risk Sci. 2018, 9, 86–99. [Google Scholar] [CrossRef]
- Wang, K.; Yang, Y.S.; Reniers, G.; Huang, Q.Y. Understanding spatiotemporal patterns of typhoon storm surge disasters based on their tropical cyclone track clusters in China. Geomat. Nat. Hazards Risk 2021, 12, 2736–2754. [Google Scholar] [CrossRef]
- GB 50009-2012; Code for Structural Loading of Buildings. China Construction Industry Press: Beijing, China, 2012.
Figure 1.
Overview of the grid data (left) and station data (right).

Figure 2.
Comparison of measured and simulated wind speeds at Dachen (typhoon Kanu) and Fuzhou (typhoon Maria) stations.
Figure 2.
Comparison of measured and simulated wind speeds at Dachen (typhoon Kanu) and Fuzhou (typhoon Maria) stations.

Figure 3.
Cumulative probability density distribution at Dachen and Fuzhou stations.

Figure 4.
10 min average wind speed over a 50-year return period. (a) Grid-based. (b) Station-based.
Figure 4.
10 min average wind speed over a 50-year return period. (a) Grid-based. (b) Station-based.

Figure 5.
10 min average wind speed over a 100-year return period. (a) Grid-based. (b) Station-based.
Figure 5.
10 min average wind speed over a 100-year return period. (a) Grid-based. (b) Station-based.


Table 1.
50-year and 100-year return period typhoon wind speeds of selected cities by using station-based and grid-based methods on the southeast coastal areas of China.
Table 1.
50-year and 100-year return period typhoon wind speeds of selected cities by using station-based and grid-based methods on the southeast coastal areas of China.
| City | 50-Year Return Wind Speed (m/s) | 100-Year Return Wind Speed (m/s) | ||||
|---|---|---|---|---|---|---|
| GB50009-2012 | Station-Based | Grid-Based | GB50009-2012 | Station-Based | Grid-Based | |
| Jinhua | 23.74 | 25.00 | 24.79 | 25.38 | 27.61 | 29.24 |
| Ningbo | 28.29 | 26.63 | 26.97 | 30.99 | 29.44 | 29.92 |
| Wenzhou | 30.99 | 29.27 | 29.12 | 33.48 | 32.40 | 34.33 |
| Xiangshan | 44.1 | 27.94 | 33.80 | 48.48 | 31.07 | 37.36 |
| Yuhuan | 44.03 | 31.25 | 35.30 | 48.40 | 34.68 | 38.84 |
| Fuzhou | 33.61 | 30.25 | 33.32 | 37.03 | 33.27 | 36.36 |
| Haikou | 34.67 | 34.21 | 34.36 | 37.97 | 36.94 | 37.43 |
| Sanya | 36.89 | 31.72 | 32.46 | 41.00 | 34.95 | 35.63 |
Table 2.
The latitude and longitude of the selected cities.
| City | Latitude | Longitude |
|---|---|---|
| Jinhua | 28°32′–29°41′ N | 119°14′–120°46′ E |
| Ningbo | 28°51′–30°33′ N | 120°55′–122°16′ E |
| Wenzhou | 27°03′–28°36′ N | 119°37′–121°18′ E |
| Xiangshan | 28°51′–29°39′ N | 121°34′–122°17′ E |
| Yuhuan | 28°01′–28°19′ N | 121°05′–121°32′ E |
| Fuzhou | 25°15′–26°39′ N | 118°08′–120°31′ E |
| Haikou | 19°31′–20°04′ N | 110°07′–110°42′ E |
| Sanya | 18°09′–18°37′ N | 108°56′–109°48′ E |
Disclaimer/Publisher’s Note: The statements, opinions and data contained in all publications are solely those of the individual author(s) and contributor(s) and not of MDPI and/or the editor(s). MDPI and/or the editor(s) disclaim responsibility for any injury to people or property resulting from any ideas, methods, instructions or products referred to in the content. |
© 2023 by the authors. Licensee MDPI, Basel, Switzerland. This article is an open access article distributed under the terms and conditions of the Creative Commons Attribution (CC BY) license (https://creativecommons.org/licenses/by/4.0/).
Share and Cite
MDPI and ACS Style
Yin, Y.; Xiao, G. Hazard Assessment of Typhoon on the Southeast Coast of China Using Grid Fixed-Point Method. Proceedings 2023, 87, 23. https://doi.org/10.3390/IECG2022-14263
AMA Style
Yin Y, Xiao G. Hazard Assessment of Typhoon on the Southeast Coast of China Using Grid Fixed-Point Method. Proceedings. 2023; 87(1):23. https://doi.org/10.3390/IECG2022-14263
Chicago/Turabian StyleYin, Yuhuan, and Guirong Xiao. 2023. "Hazard Assessment of Typhoon on the Southeast Coast of China Using Grid Fixed-Point Method" Proceedings 87, no. 1: 23. https://doi.org/10.3390/IECG2022-14263