1. Introduction
The estimation of glacier velocity is very important since it is a parameter of glacier dynamics. It can help understand the health of a glacier because the momentum is directly related to the mass and the velocity is inversely related. As per the basic momentum law, a higher velocity could imply a decrease in mass; however, the slope parameters should be carefully considered before drawing any conclusions. The decrease in mass is a significant indicator of climate change. It is a general fact that climate change impacts cause natural hazards such as the formation of glacial lakes, which can cause glacial lake outburst floods (GLOFs). There are two approaches to the estimation of glacier velocity. One is the field-based method, and the other is the remote sensing-based method. Field-based estimation is not possible for all the glaciers in the world, since most of them are inaccessible due to various reasons. For example, in the Himalayan region, due to transboundary sensitivity and the rugged terrain structure, there are accessibility concerns. This problem is solved using satellite imagery.
In remote sensing-based methods, offset tracking is one of the most widely used tools. The offset tracking method works well in the Himalayan region. There has been a successful attempt at velocity estimation in the Chota Shigri and Bara Shigri glaciers [
1]. The authors used SAR data from the Sentinel-1 satellite to estimate the glacier velocity using the offset tracking method. It has also been observed recently that there is a direct relationship between the mass balance and the glacier velocity [
2]. Hence, it is very important to estimate the glacier velocity. It is a well-known fact that in the Himalayan glaciers, accessibility is a concern. In the eastern Himalayas, there are few studies related to glacier velocity estimation. In this study, we attempt to solve this problem through the use of high-resolution X-band SAR data from the TerraSAR-X. We use sub-pixel intensity-based offset tracking to estimate the glacier velocity of 15 transboundary glaciers in the eastern Himalayas. The peak of these glaciers forms the boundary of three nations, namely Nepal, India, and China.
2. Materials and Methods
The study area is mainly situated in Sikkim, India (
Figure 1). It is the landlocked transboundary border state of Nepal, China, and Bhutan. In the western part of Sikkim lie Nepal and China. The bounding coordinates of the study area are 28°06′41.25″ N and 26°58′06.66″ N in the north and south, followed by 88°53′41.57″ E and 88°03′18.17″ E in the east and west, respectively. The above-sea-line altitude of the state ranges from 300 m to 8586 m at the Kanchenjunga peak. This peak is the 3rd highest mountain peak in the world.
The fifteen glaciers of the study area are Changshang, Rathong, South Lhonak, South Simvo, Talung, Tongshiong, Yalung, Zemu, Glacier 2, Glacier 3, Kaer, Ktr Gr 193, Middle Lhonak, North Lhonak, and Ktr gr 171 (Lhonak Nepal). These glaciers cover a total area of 440.92 km2 Ktr Gr 193 is the largest glacier in this location, while Glacier 3 is the smallest. East Rathong glacier is the benchmark glacier for the field studies, while Zemu glacier is the origin of the Teesta River that flows till Bangladesh via Sikkim and West Bengal. The GLIMS outline is used to delineate the glacier boundary. In the whole region, due to the swath limitation, Zemu and Talung cover 98% of the glacier area. The terminus portion is ignored for this reason.
2.1. Data
TerraSAR-X Stripmap products are acquired by the European Space Agency (
Table 1). It is a sun-synchronous repeat-orbit satellite. The range and azimuth resolution are 1.36 m × 2.23 m, and it operates on a 31 mm wavelength and 9.6 GHz frequency. The chirp bandwidth is 150 MHz/300 MHz with the nominal acquisition direction on the right side. TerraSAR-X data are preferred because of their high resolution and better quality.
2.2. Pre-Processing and Offset Tracking
The data was acquired by the European Space Agency in slant-range format. For the line-of-sight velocity, the slant range information is not required (Prati, 1993). The conversion of the slant range product to the ground range product is the pre-processing required for the offset tracking. It is performed after applying radiometric calibration and speckle noise removal.
A radiometric calibration is applied for the conversion because ground-range products need backscatter conversion for understanding the characteristics of backscatter coefficients. The Sentinels Application Platform (SNAP) uses the following equation for the conversion:
It is a well-known fact that SAR images contain speckle noise [
3]. For the reduction of speckled noise, images are joined incoherently. This process is called multilooking. A major advantage of multilooked images is their interpretability and better visual appearance. SNAP software is used to create a warp polynomial of order 3 to map the ground range pixels to slant range pixels. Further, every pixel in the ground range computes the corresponding pixel position in the slant range image using the warp polynomial. In the final step, the pixel value is estimated using the nearest neighbour interpolation.
Offset tracking is used to track the offset in the slave image. A master image is the one that is being compared. A co-registration is performed on the master and slave images [
4]. Offset tracking through the SAR data is most commonly used for the estimation of glacier velocity. As per various authors, this method is ideal for the estimation of glacier velocity across the glaciers of the world [
5,
6,
7]. A 128-pixel window is chosen to track the offset in a master and slave image. The maximum velocity is set to be 0.25 m/day [
8]. The last step is to geocode the offset tracking results. The topographical variations in the scenes, as well as the tilt of the sensor along with the distances, are sensitive to the distortion in SAR images. A terrain correction is applied to rectify the distortions in the SAR images [
9].
3. Results and Discussion
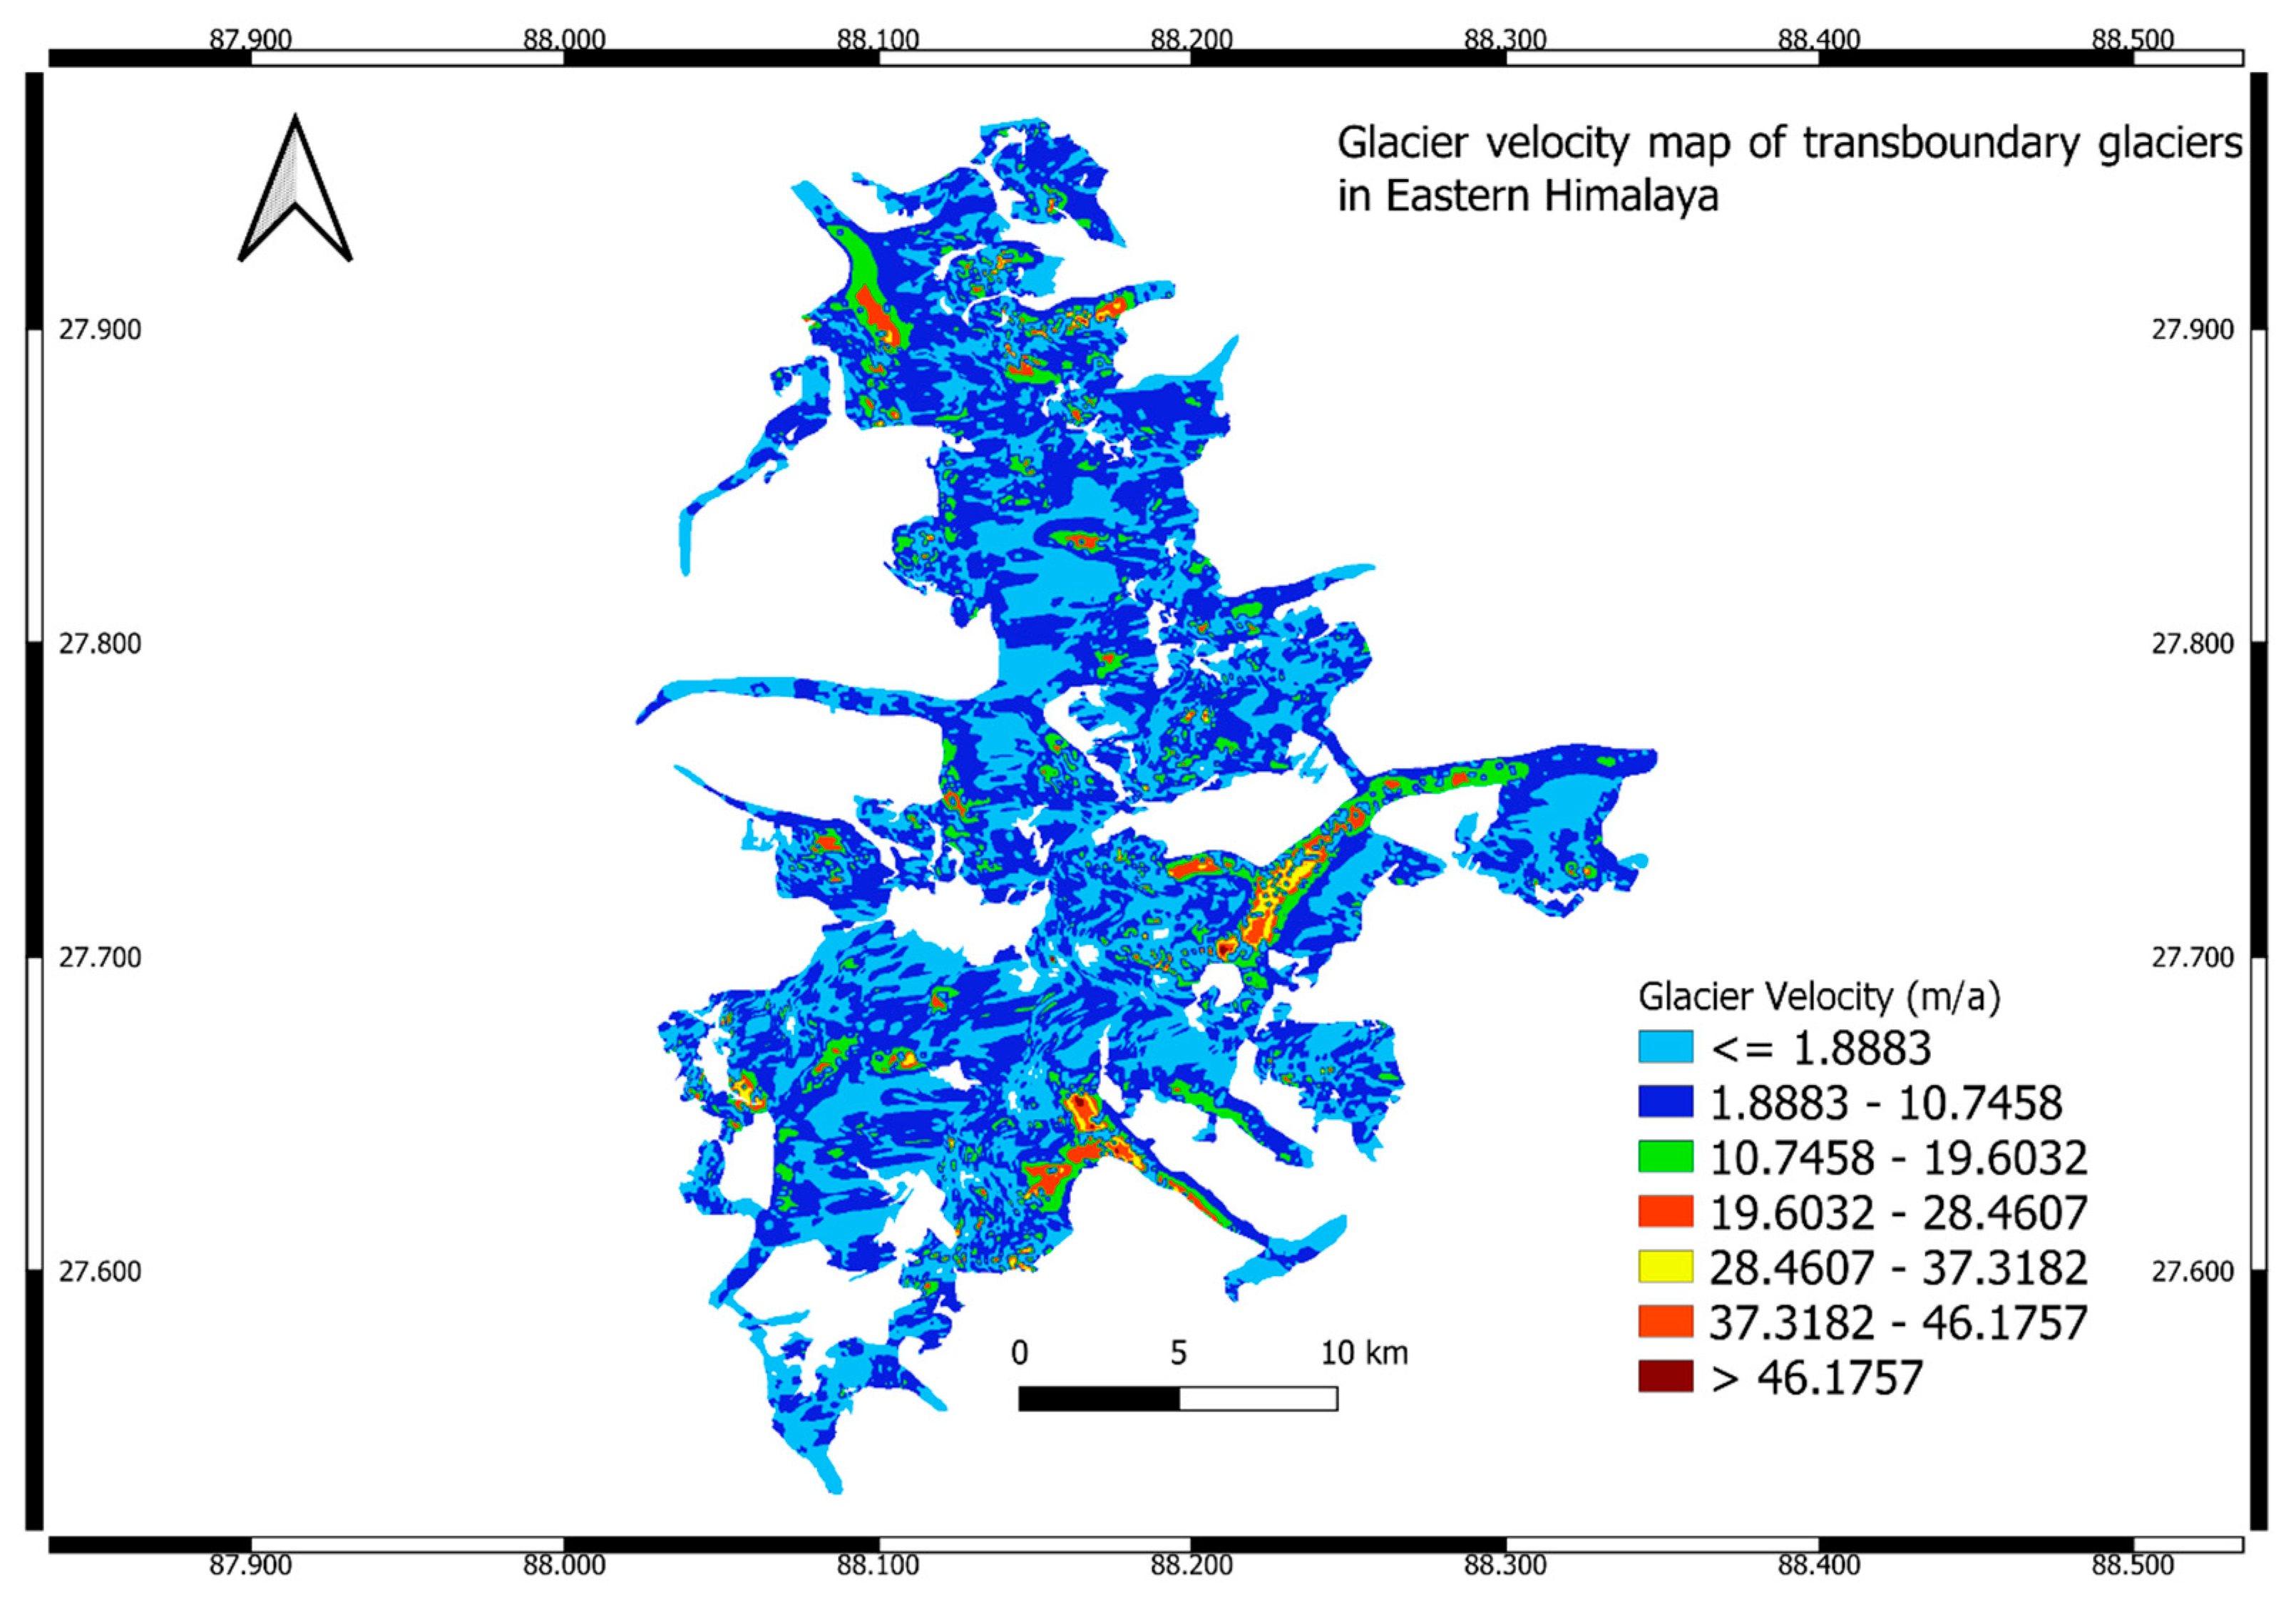
The glacier velocity of the 15 transboundary glaciers is estimated through the offset tracking method (
Figure 2). The maximum average velocity is observed in the South Lhonak lake (
Table 2). The minimum average velocity is observed in Glacier 3. Near the snout of the south Lhonak lake, there is a glacier lake that is expanding at a rapid rate [
10,
11]. As per a study by [
12], it is observed that high flow results in higher melting. The higher average velocity of the South Lhonak glacier could be one of the reasons for the increase in the size of the lake. The average annual velocity of the large glaciers, such as Ktr gr 193, Zemu, and Yalung, which have a surface area of more than 60 km
2, is relatively lower than that of the South Lhonak glacier. The maximum velocity of the South Lhonak glacier is also relatively higher than that of glaciers having similar surface areas, such as Rathong, Middle Lhonak, South Lhonak, and Lhonak (Nepal). A study has observed that the maximum velocity of the glaciers in the western Himalayas ranges from 50 to 90 m/a [
13]. We observe the maximum velocity of glaciers with a similar surface area to be ~52–84 m/a. A study observed a higher velocity trend [
14] in slopy regions of the Himalayas. The velocity values in the slopy regions, as per this study, were greater. This study only used a time gap of 6 months. High velocity in regions with a higher slope is justifiable because of the gravity factor. In the line-of-sight approach, the analysis is completely based on the movement of the satellite sensor. The slope factor is not considered for this reason. There could be variations in the results based on different approaches.
In the study area, field data on glacier velocity are available only for the benchmark outline of the East Rathong glacier. The last field-based survey was performed in the ablation season of 2018. The average velocity value of eight different points for a year in the benchmark outline was estimated to be 5.92 m/a (for the ablation season). It is compared with the average velocity value of the same points in the TerraSAR-X offset tracking estimates. The value is observed to be 6.61 m/a. A variation of approximately 10% was observed in the field value of the year 2018 (ablation season converted into a yearly scale) and direct yearly estimates of 2020–2021. This is not a direct validation of the results, but an estimate of variation from the latest available field data.
4. Conclusions
A variation in glacier velocity could indicate significant changes in glacier health. As per the basic momentum and angular momentum laws, an increase in velocity is capable of decreasing the mass of a glacier. It is one of the most important parameters used to estimate the present flow conditions and mass of a glacier. There are many empirical relations that can be used to estimate overall glacier mass using shallow ice approximation methods [
15,
16]. Hence, it is important to create baseline data for future studies. This study creates a baseline average velocity and maximum velocity using high-resolution TerraSAR-X data. The chosen study area is the transboundary region of the Eastern Himalayas. This transboundary region is the border of four nations: India, Nepal, Bhutan, and China. The maximum velocity in all the glaciers ranged from 14.31 to 84.26 m/a. The average velocity ranged from 1.78 to 7.09 m/a. The glacier with the highest average glacier velocity is observed to be the South Lhonak glacier. This glacier has been melting rapidly in the last few decades. At the snout of this glacier lies a glacier lake made up of moraine dams. It is direct evidence of climate change for regional policy formation. For the quality assessment of the results, the latest field-based results of 2018 and the observed results of 2021 were compared. A variation of approximately 10% was observed.
Author Contributions
Conceptualization, A.S. and M.G.; methodology, A.S.; software, A.S.; validation, N.S. and A.S.; formal analysis, A.S.; investigation, A.S.; resources, A.S. and N.S.; writing—review and editing, A.S.; supervision, S.G. and M.G. All authors have read and agreed to the published version of the manuscript.
Funding
This data for this research was funded by the European Space Agency.
Institutional Review Board Statement
Not applicable.
Informed Consent Statement
Not applicable.
Data Availability Statement
Not applicable.
Acknowledgments
We thank the European Space Agency for acquiring Terra-SAR-X data for our study area. We thank the team from the Science and Technology Department for continuously monitoring the benchmark glacier in the Sikkim Himalaya.
Conflicts of Interest
The authors declare no conflict of interest.
References
- Yellala, A.; Kumar, V.; Høgda, K.A. Bara Shigri and Chhota Shigri glacier velocity estimation in western Himalaya using Sentinel-1 SAR data Bara Shigri and Chhota Shigri glacier velocity estimation in. Int. J. Remote Sens. 2019, 40, 1–14. [Google Scholar] [CrossRef]
- Samsonov, S.; Tiampo, K.; Cassotto, R. SAR-derived flow velocity and its link to glacier surface elevation change and mass balance. Remote Sens. Environ. 2021, 258, 112343. [Google Scholar] [CrossRef]
- Simard, M.; DeGrandi, G.; Member, S.; B Thomson, K.P.; Bénié, G.B. Analysis of Speckle Noise Contribution on Wavelet Decomposition of SAR Images. IEEE Trans. Geosci. Remote Sens. 1998, 36, 1953–1962. [Google Scholar] [CrossRef]
- Imperatore, P.; Sansosti, E. Multithreading based parallel processing for image geometric coregistration in sar interferometry. Remote Sens. 2021, 13, 1963. [Google Scholar] [CrossRef]
- Wang, Q.; Zhou, W.; Fan, J.; Yuan, W.; Li, H.; Sousa, J.J.; Guo, Z. Estimation of Shie Glacier Surface Movement Using Offset Tracking Technique with COSMO-SKYMED Images. ISPRS Ann. Photogramm. Remote Sens. Spat. Inf. Sci. 2017, 4, 493–497. [Google Scholar] [CrossRef]
- Amitrano, D.; Guida, R.; di Martino, G.; Iodice, A. Glacier monitoring using frequency domain offset tracking applied to sentinel-1 images: A product performance comparison. Remote Sens. 2019, 11, 1322. [Google Scholar] [CrossRef]
- Das, S.; Sharma, M. Glacier surface velocities in the Jankar Chhu Watershed, western Himalaya, India: Study using Landsat time series data (1992–2020). Remote Sens. Appl. 2021, 24, 100615. [Google Scholar] [CrossRef]
- Pronk, J.B.; Bolch, T.; King, O.; Wouters, B.; Benn, D.I. Contrasting surface velocities between lake-and land-terminating glaciers in the Himalayan region. Cryosphere 2021, 15, 5577–5599. [Google Scholar] [CrossRef]
- Loew, A.; Mauser, W. Generation of geometrically and radiometrically terrain corrected SAR image products. Remote Sens. Environ. 2007, 106, 337–349. [Google Scholar] [CrossRef]
- Sattar, A.; Goswami, A.; Kulkarni, A.v. Hydrodynamic moraine-breach modeling and outburst flood routing—A hazard assessment of the South Lhonak lake, Sikkim. Sci. Total Environ. 2019, 668, 362–378. [Google Scholar] [CrossRef] [PubMed]
- Sharma, R.K.; Pradhan, P.; Sharma, N.P.; Shrestha, D.G. Remote sensing and in situ-based assessment of rapidly growing South Lhonak glacial lake in eastern Himalaya, India. Nat. Hazards 2018, 93, 393–409. [Google Scholar] [CrossRef]
- King, M.D.; Howat, I.M.; Candela, S.G.; Noh, M.J.; Jeong, S.; Noël, B.P.Y.; van den Broeke, M.R.; Wouters, B.; Negrete, A. Dynamic ice loss from the Greenland Ice Sheet driven by sustained glacier retreat. Commun. Earth Environ. 2020, 1, 1. [Google Scholar] [CrossRef]
- Bhushan, S.; Syed, T.H.; Arendt, A.A.; Kulkarni, A.V.; Sinha, D. Assessing controls on mass budget and surface velocity variations of glaciers in Western Himalaya. Sci. Rep. 2018, 8, 8885. [Google Scholar] [CrossRef] [PubMed]
- Fan, J.; Wang, Q.; Liu, G.; Zhang, L.; Guo, Z.; Tong, L.; Peng, J.; Yuan, W.; Zhou, W.; Yan, J.; et al. Monitoring and analyzing mountain glacier surface movement using sar data and a terrestrial laser scanner: A case study of the himalayas north slope glacier area. Remote Sens. 2019, 11, 625. [Google Scholar] [CrossRef]
- Gantayat, P.; Kulkarni, A.V.; Srinivasan, J. Estimation of ice thickness using surface velocities and slope: Case study at Gangotri Glacier, India. J. Glaciol. 2014, 60, 277–282. [Google Scholar] [CrossRef]
- Sattar, A.; Goswami, A.; Kulkarni, A.V.; Das, P. Glacier-surface velocity derived ice volume and retreat assessment in the dhauliganga basin, central himalaya—A remote sensing and modeling based approach. Front. Earth Sci. 2019, 7, 105. [Google Scholar] [CrossRef]
| Disclaimer/Publisher’s Note: The statements, opinions and data contained in all publications are solely those of the individual author(s) and contributor(s) and not of MDPI and/or the editor(s). MDPI and/or the editor(s) disclaim responsibility for any injury to people or property resulting from any ideas, methods, instructions or products referred to in the content. |
© 2023 by the authors. Licensee MDPI, Basel, Switzerland. This article is an open access article distributed under the terms and conditions of the Creative Commons Attribution (CC BY) license (https://creativecommons.org/licenses/by/4.0/).


