Proceeding Paper

Petrographic Analysis of the Sandstones and Mudstones in Alice, Eastern Cape Province, South Africa: Implications for Groundwater Potential †

Department of Geology, University of Fort Hare, Alice 5700, South Africa
*
Author to whom correspondence should be addressed.
Presented at the 4th International Electronic Conference on Geosciences, 1–15 December 2022; Available online: https://sciforum.net/event/IECG2022.
Proceedings 2023, 87(1), 39; https://doi.org/10.3390/IECG2022-14818
Published: 21 July 2023
(This article belongs to the Proceedings of The 4th International Electronic Conference on Geosciences)

Abstract

:
Aquifers’ storability potential in Alice, comprising rocks of the Beaufort Group in the Karoo Supergroup, is examined based on the mineralogical and diagenetic implications of sandstones and mudstones. This investigation is focused on SEM + EDX analysis, petrographic study, porosity, and density determination. The SEM + EDX and petrographic studies show that the rocks are fractured and porous and contain minerals like quartz, feldspar, lithics, mica, kaolinite, calcite, and illite. The primary diagenetic processes that affect the groundwater storage of the rocks are cementation via authigenic minerals, mineral replacement, the dissolution of minerals, and recrystallization. The existence of fractured and dissolution pores improves the groundwater storage capacity. Ten rock samples were selected for density and porosity measurements. The porosity result shows that mudstone has the highest porosity value of 2.56%, while sandstone has the lowest porosity value of 0.85%. This is due to mudstone having numerous pore spaces compared to sandstone. The density of mudstone ranges from 2.5763 to 2.6978 g/cm3, while the density of sandstone ranges from 2.5908 to 2.6820 g/cm3. The secondary porosity is the main porosity for the reservoir rocks. The pores and fractures observed in the rocks act as channels for groundwater, which influence the aquifers’ storability in the study area. The techniques used in this research help us to efficiently understand the factors that control aquifers’ storability to assist with groundwater exploration.

1. Introduction

Water is the primary source of life because humans, animals, and plants all require water to survive. To maintain food security, feed animals, start industrial production, preserve biodiversity, and protect the environment, water is required [1]. Nature supplies a copious amount of water, but gaining access to it in excellent quality and quantity is challenging [2]. Groundwater is found within the fracture and pores of rocks in the subsurface [3].
Water insecurity can be worsened by droughts. According to [4], droughts affect more people than any other disaster. Four hundred and eleven million people were affected by disasters in 2016, while 94 percent experienced droughts [4]. While this is a growing concern worldwide, South Africa is regarded as a country with a water crisis [5]. The water quality and availability in South Africa are influenced by the problems of an expanding economy, increased urbanization, and a lack of infrastructure [6]. According to calculations, 64% of homes in South Africa lack access to potable water, while 35% of municipal water is lost due to leakages [7]. However, the use of surface water resources has already reached its lower limit [8].
The Eastern Cape is among the provinces in South Africa facing many challenges such as a lack of water supply, extreme poverty, and food uncertainty [9]. These distressing situations have overwhelmed the people who are struggling to provide basic requirements for their families in difficult conditions [10]. Alice, a town in the Eastern Cape Province of South Africa, is no exception to the above-mentioned concerns. The municipality provides piped water to the town of Alice daily. The municipality’s total dependence on water supply will prolong the water scarcity challenge that is experienced in Alice. Hence, there is a need to consider the potential of groundwater to supply the basic needs of many people in the study area.
However, it is necessary to examine and know the aquifer system to access groundwater. Most of the Eastern Cape areas are underlain by rocks of the Karoo Supergroup. The Eastern Cape aquifers are categorized as secondary types in which their water-bearing properties are enhanced during secondary processes, which includes fracturing, faulting, and dolerite intrusions [11]. There is very little knowledge of the rock’s porosity and permeability, which are greatly influenced by the above-mentioned secondary processes in the study area. Therefore, understanding aquifer storability through petrographic, density, and porosity studies will help to predict the potential of groundwater accumulation in the study area.
Petrographic studies are crucial for determining the porosity and permeability of mudstones and sandstones [12,13,14]. Many researchers have shown that diagenetic alterations in siliciclastic rocks influence the reservoir quality by changing the primary porosity and permeability of the rocks [13,14,15,16,17,18,19]. The relationship between fracture, fault, pores, and groundwater potential has been investigated and reported by some researchers [20,21,22,23].
The physical rock properties, such as the density and porosity, are critical in rock science as they help to determine the characteristics of the lithology in which the rocks are found [24]. The density depends largely on the age and depth of burial, the composition, the cementation, the porosity of the rocks, the types of pore fluid, and various tectonic settings [25]. There are three most important types of density: dry density, wet density, and grain or particle density [25]. Porosity is described as the voids within a rock. The sizes and distributions of the voids can affect the smooth flow of fluids within the rock based on the channels’ isolation in the rock owing to the cementation of the grains [26]. The density and porosity measurements of the rocks will help to determine whether the rocks will allow for the storage or passage of groundwater in areas with groundwater potential.
The aim of this research is to investigate the factors that influence the groundwater storage capacity of sandstones and mudstones. This study will further contribute additional knowledge on the diagenetic processes and how they influence the rocks’ qualities as potential aquifers. These will provide valuable information needed for the proper exploration of groundwater in Alice.

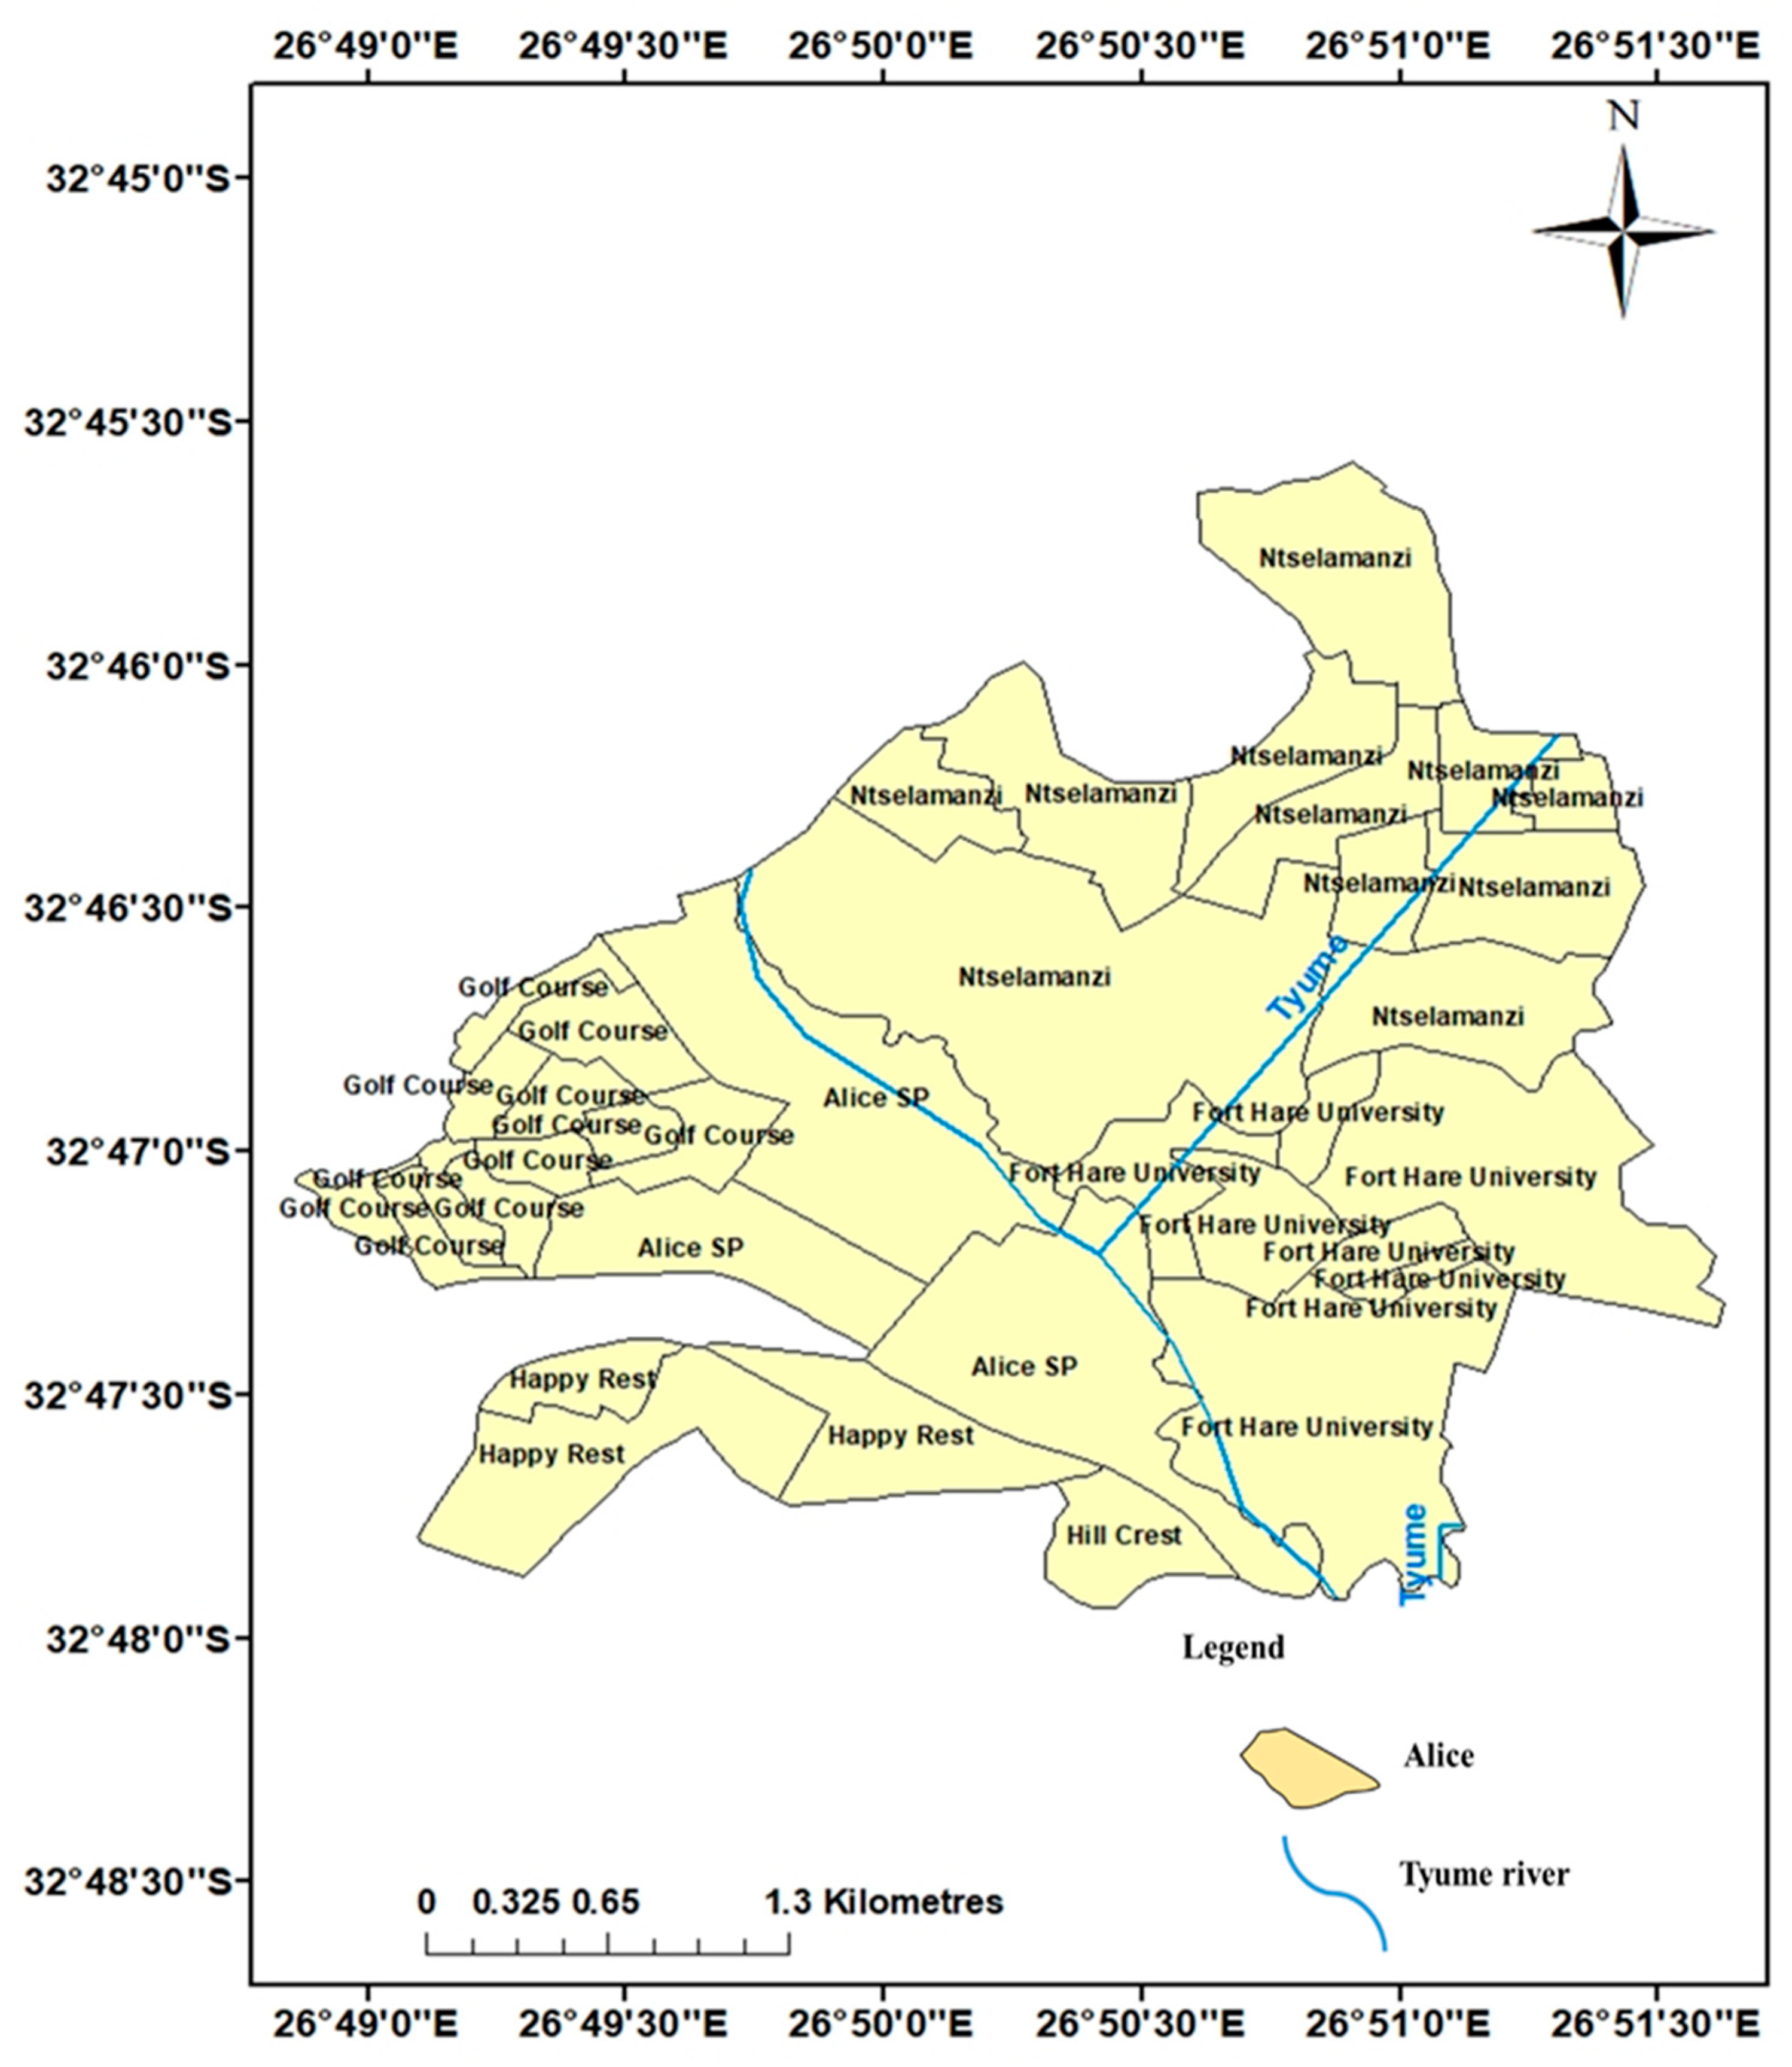
Description of the Study Area

The study area is situated in the Eastern Cape Province, South Africa, about 120 km due west of East London, with a latitude of 32°47′20″ S to 32°46′50″ S and a longitude of 26°50′25″ E to 26°51′40″ E (Figure 1). The Eastern Cape Province has a surface area of roughly 170,000 km2, covering about 14% of South Africa’s land area [27]. Mrubata [28] reported that the area is considered to have semi-arid conditions, with an average rainfall of 500 mm/year. The average monthly temperature varies from 1.5 to 2.5 °C, with the average winter temperature reaching 21 °C and the average summer temperature reaching 28 °C [29]. Alice is the capital of the Nkonkobe Municipality, where the production of livestock and vegetables characterizes their small-scale agriculture. Forestry, tourism, and the production of wool and sheep are their additional economic activities. The Tyume River (Figure 1), which flows from the top of the Amathole Mountain in Hogsback, passes through the lower coastal slope down to Alice through several communities [30]. The river is used for various domestic activities.

2. Geology

Geologically, Alice is within the Beaufort Group of the Karoo Supergroup, which is a large stratigraphic sequence in the Eastern Cape, South Africa. The Karoo Supergroup originated from the Gondwana Supercontinent [31]. The majority of the continental deposits of the Karoo Supergroup are categorized under the Beaufort Group, and they are formed from a significant part of the sediments deposited by the rapidly rising Cape Fold Belt [32]. The glacial sediments of the Dwyka Group marked the earliest and lowest sedimentary deposits of the Karoo Supergroup (Table 1). The group comprises mudstone, shale, and diamictite [33]. The total thickness of this group is about 600–700 m [34]. The Dwyka Group is overlain by the post-glacial Ecca Group, consisting mainly of shale and turbidites, followed by the Beaufort and Stormberg groups [34]. Lastly, the Karoo sedimentary series is covered by the Drakensberg Group. This group consists of very thick basalts [34]. Since Alice is located in the Beaufort Group, the geology section will emphasize the Beaufort Group more.
The Beaufort Group comprises greenish-grey mudstones; a bluish-grey, lenticular, tabular, fine- to medium-grained sandstone; and reddish-maroon sandstones [35]. The group includes the upper Tarkastad Subgroup and the lower Adelaide Subgroup [31]. The Adelaide Subgroup is made up of three formations: Koonap, Middleton, and Balfour formations. The Koonap Formation consists of sandstones and greenish silty mudstones, and the Middleton Formation comprises dark red and greenish-grey mudstones interbedded with sandstones. Lastly, the Balfour Formation, which is roughly 1600 m, 1300 m, and 2000 m thick, is a fining-upward sequence of fine-grained sandstones and mudstones [36]. The Balfour Formation comprises five units, namely the Oudeberg Member, which is sequentially overlain by the Palingkloof, Elandsberg, Barberskrans, and Daggaboersnek members [36].
Alice is stratigraphically within the Daggaboersnek Member of the Balfour Formation, which is part of the Beaufort Group in the Karoo Supergroup (Figure 2). The local geology of the study area is made up of sedimentary rocks, such as shale, alternating siltstone, mudstone, and sandstone, and is further intruded by Karoo dolerite in the forms of dykes and sills [37]. This area of study is denoted by fractured aquifers that are typical within the Karoo Supergroup [38]. These fractures serve as a passage for groundwater and play a crucial role in the aquifer’s general geometry. The shallow Karoo aquifer systems are less than 300 m and supply local communities via boreholes that are usually less than 150 m in depth for farming and domestic use [39].

3. Methodologies

A total of 30 representative sandstone and mudstone samples were taken from outcrop exposure in the research area and subjected to petrographic microscopy and scanning electron microscopy (SEM) analyses. Ten (10) rock samples comprising sandstone and mudstone were selected for density and porosity measurements.

3.1. Petrographic Studies

Thin section petrographic examination was used to categorize the mineralogical composition, and rock texture of the sandstones and mudstones was examined using an optical Olympus BX51 microscope equipped with an Olympus DP72 camera. Photographs of the different minerals and rock textures discovered on the thin sections were taken and further analyzed to determine the rock types, diagenetic characteristics, grain size variation, cement texture, grain roundness, and sorting. For the SEM, the sandstone and mudstone fragments were cleaned, gold-coated, and examined with a scanning electron microscopy (SEM) machine (model: JEOL JSM-6390LV, JEOL, Tokyo, Japan) in a working condition of 15 KV equipped with an energy dispersive X-ray microanalyzer (EDX, JEOL JSM-6390SEM, JEOL, Tokyo, Japan). The combination of SEM + EDX was used for the analysis of the pores and fracture, recrystallization effect, diagenetic textures, as well as the cement type, mineral composition, and chemical composition with their percentages. The petrographic study results were used to investigate the porosity and permeability of sedimentary rocks, which have a significant influence on the groundwater storage in Alice.

3.2. Procedures for Measuring the Density of Rock Samples

Several techniques, like the buoyancy determined volume, direct volume measurement, and gas pycnometer, can evaluate the density of rock samples in the laboratory [25]. In this research, an Adam electronic weighing balance was used to determine the rock densities. This equipment has a measurement range of seventeen units, including pound gram, grain, carat, newton, kilogram, and ounce. The equipment was well balanced on a vibration-free laboratory bench. The hook point at the base of the equipment was positioned so that the laboratory bench hole was directly under it. The loop was fixed to the hook point at the bottom of the equipment through the laboratory bench hole to conveniently hold the rock sample when immersed in the water in the bucket. The equipment was leveled with the spirit level and adjustable feet to allow for the bubble in the spirit level to be positioned at the center. A bucket full of water was put under the table so the rock sample on the loop could be submerged in the water without touching the bucket’s edges and bottom during measurement (Figure 3). The equipment was connected to a power source. The equipment was given around thirty (30) minutes. Before the measurement began, the weighing device, battery level, and stability were examined and approved. The water density was determined by using a 25 mL density bottle. A water density of 0.9964 g/cm3 was recorded and used while computing the rock’s porosity and density. A thermometer was constantly used to monitor the temperature of the water throughout the experiment period since the water density value depends on its temperature and pressure. The density of water was determined in order to meet the requirement of the formulae to calculate the dry, wet, and particle densities.

3.3. Determination of Dry Density

The rocks were kept in the sun for 72 h to evaluate the samples’ dry densities. The mass in the air (Ma) was noted after weighing the sun-dried sample on the Adam electronic weighing balance. The rocks were placed one after the other on the loop submerged in the water, and the displayed values were immediately noted to determine the submerged mass (Mb). For all the other dry samples, this procedure was repeated. The dry density was calculated as follows:
Dry density ( ρ dry ) = M d M d M s × ρ w
where M d is the dry rock’s mass in the air; M s is the mass of rock submerged in water; and ρ w is the water density.

3.4. Determination of Particle Density

To evaluate the particle density, the rocks were kept in a container filled with water for more than 48 h to allow for the pores to be occupied by water. The saturated mass (Mc) was determined by putting the soaked sample on the loop that was submerged in the bucket filled with water, and the measurement was conducted. For all the other soaked samples, this procedure was repeated. The particle or grain density of the rock was calculated as follows:
Particle or grain density ( ρ particle ) = M d M d M w × ρ w
where ρ particle = particle density; M d = mass of dry rock in the air; M w = mass of wet rock in water; and ρ w is the water density.

3.5. Determination of Porosity

Porosity (Φ) is defined as the ratio of the volume of the pore spaces ( V f ) to the total volume (V) of the rock (Equation (3)).
Porosity ( Φ ) = V f V
Meanwhile,
ρ dry = ρ particle 1 Φ
Porosity ( Φ ) = ( 1 ρ dry ρ particle )
Otherwise, it is generally calculated as follows:
Porosity ( Φ ) = ( 1 ρ dry ρ particle ) × 100 %

3.6. Determination of Wet Density

It is defined as the addition of dry density ( ρ dry ) with the product of porosity ( Φ ) and water density ( ρ w ). The rock was soaked in water for a lengthy time, allowing for all the openings to be filled with water. The wet density of the rock was calculated as follows:
Wet density ( ρ wet ) = ρ dry + Φ × Density water
where ρ wet = wet density; ρ dry = dry density; Φ = porosity; and V f = volume of voids.

4. Results and Discussion

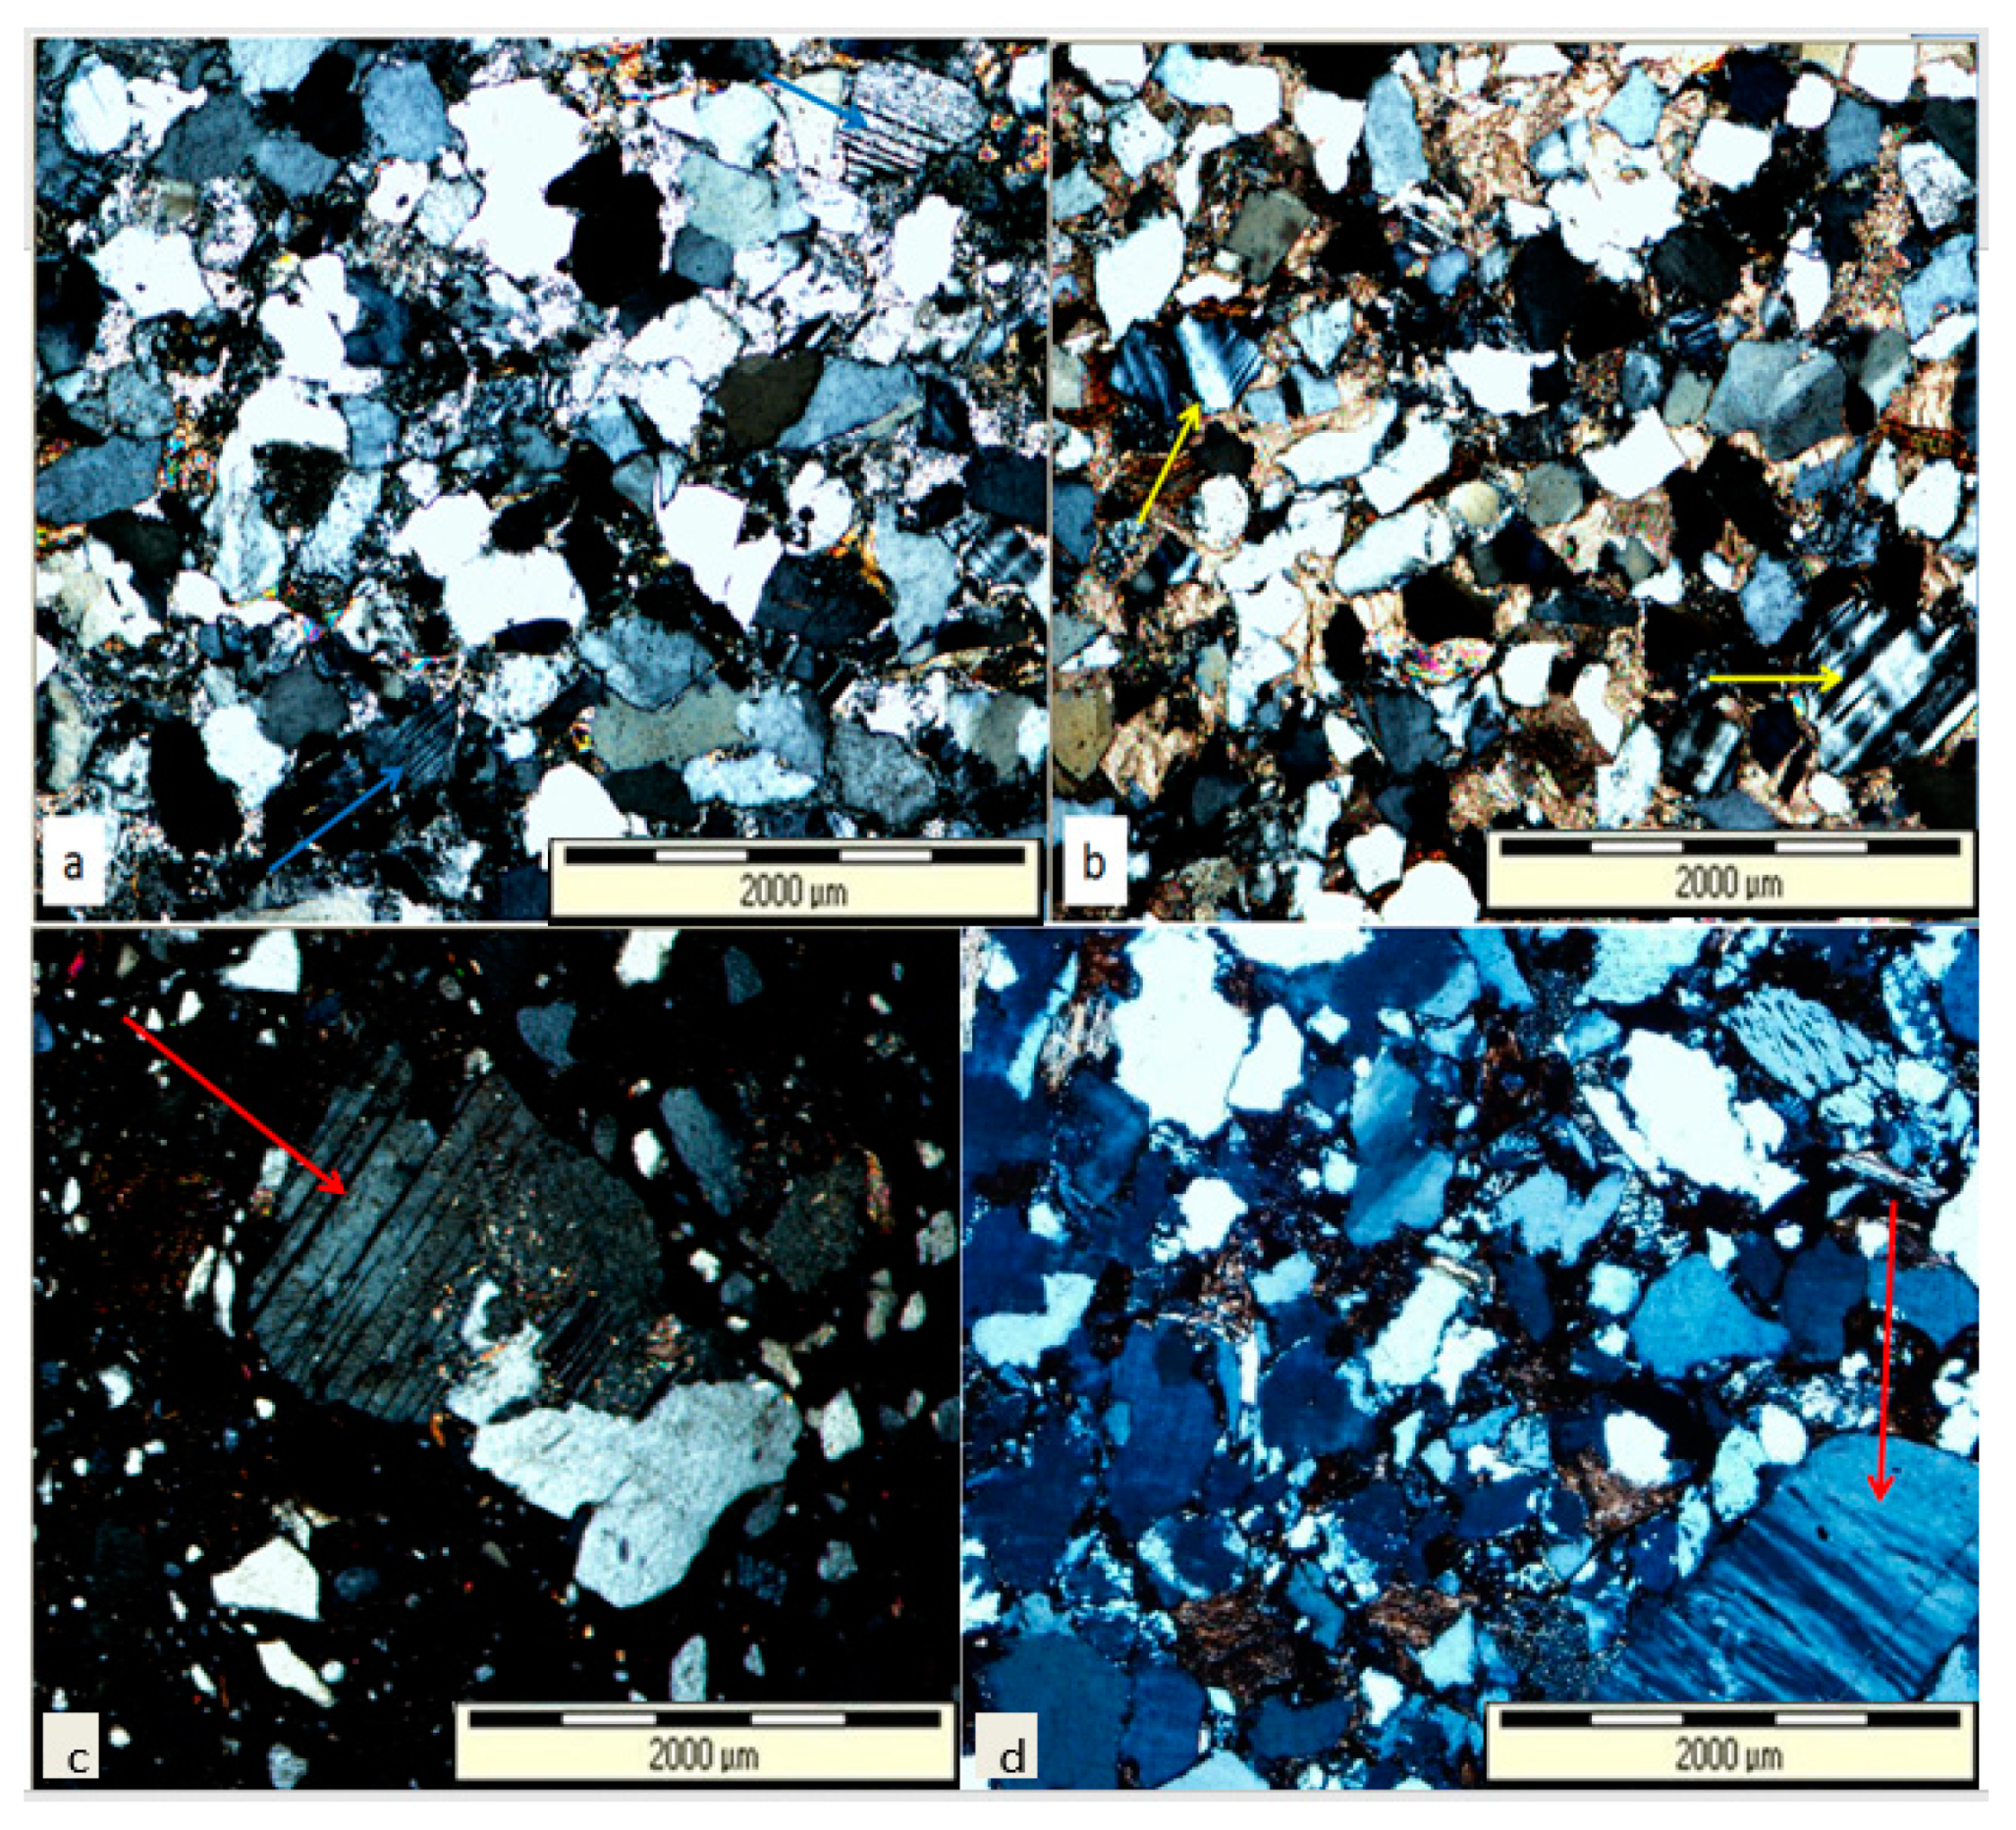
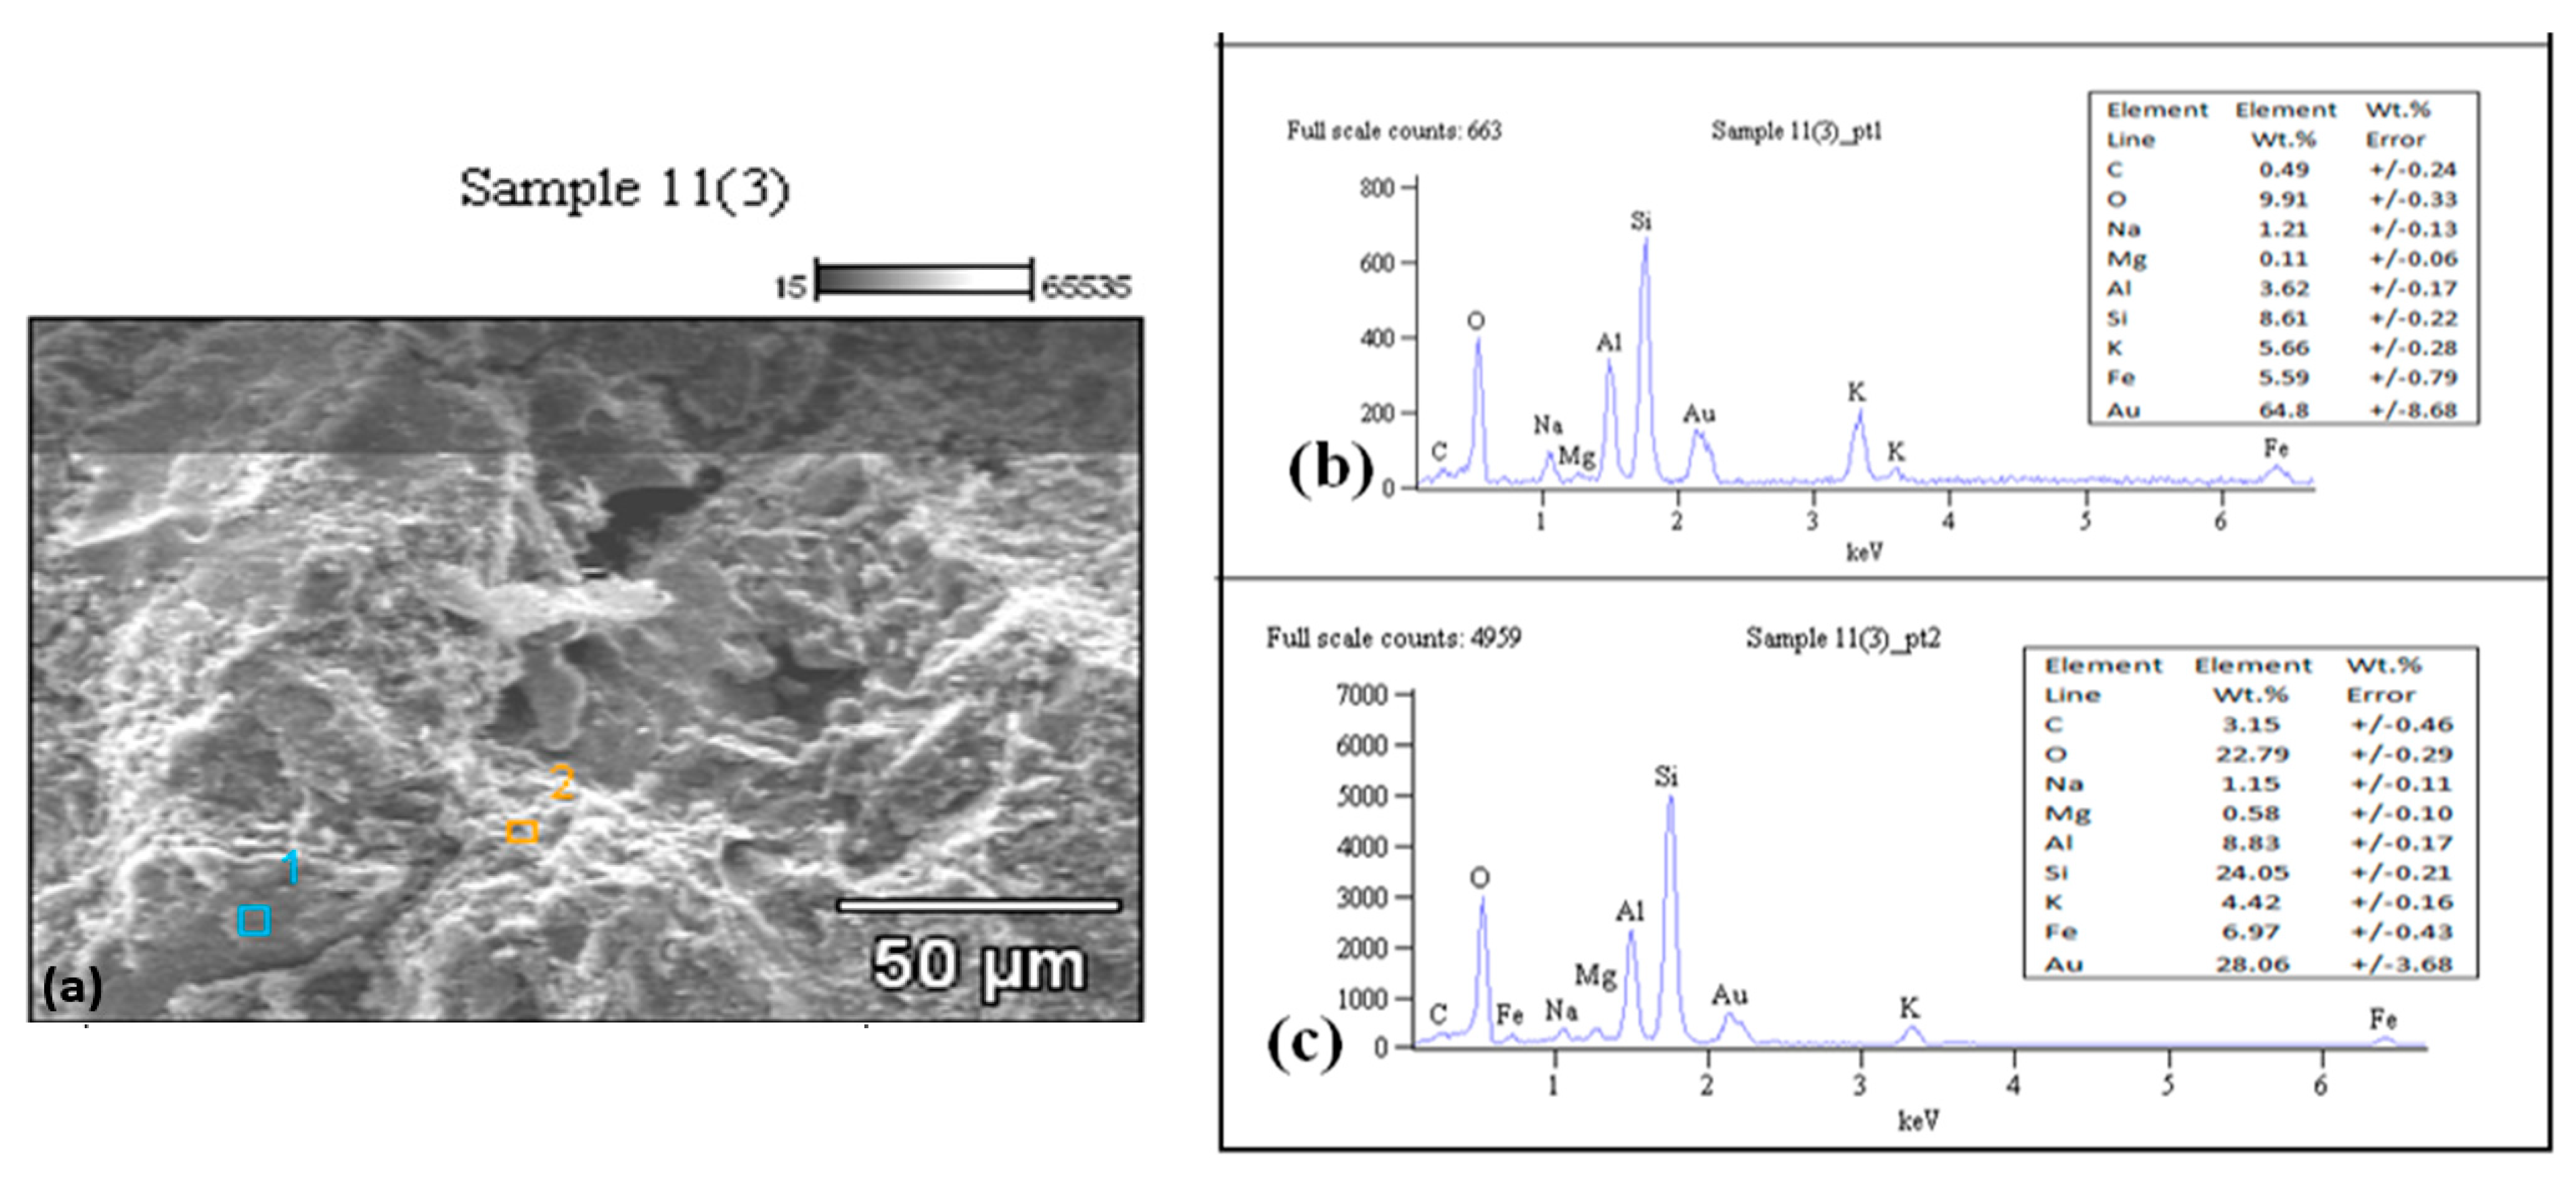
4.1. Mineral Compositions

4.1.1. Quartz

Quartz was abundantly observed within all the sandstone samples. The most common crystal structure for quartz is a monocrystalline structure (Figure 4a). The monocrystalline quartz grains, which also occur as an overgrowth, show uniform to moderately undulose extinction (Figure 4b). The quartz grains mostly vary from subangular to subrounded in shape. In addition, the quartz grains are free of inclusions. The recrystallization that occurs at the grain edge of the quartz grains lead to the development of pores (Figure 4c), as observed under the SEM + EDX analysis.

4.1.2. Feldspar

The second most common mineral that was found in the rocks with different grain types and sizes is feldspar. It exists in both authentic and detrital forms. The various types of feldspar minerals, which can be seen in the thin sections, are plagioclase and alkali (microcline and orthoclase) feldspars. Plagioclase can be identified through the albite twinning of grey and black lines (Figure 5a). Microcline can be found in a few places, and it undergoes recrystallization to albite (Figure 5b). Furthermore, it exhibits cross-hatch twinning, while albite grains have parallel twinning. Some of the plagioclase grains are broken apart due to compaction (Figure 5c). The orthoclase grains exhibit a perthite texture with minor twinning (Figure 5d). The feldspar grains vary from a subangular shape to a subrounded shape, though few are slightly changed to illite.

4.1.3. Lithics

These are referred to as rock fragments, which are eroded and broken to sand size and later form lithic sand grains. They are considered unstable in sedimentary environments and serve as provenance indicators for sediments. The types of lithics that were observed in the thin section of the rock samples were sedimentary, metamorphic, and volcanic types (Figure 6a–c). They occur as subangular to subrounded grains.

4.1.4. Mica

The two types of mica observed in the study area’s rocks were muscovite and biotite, with a more frequent occurrence of muscovite than biotite. Chemically, muscovite is more stable in a depositional environment when compared with biotite. Hence, it can be well retained. Among the common detrital accessory framework minerals, this mineral is recognized for its perfect cleavage and combination of many colors such as blue, yellow, and red (Figure 7a–c).
Among other grains and matrix, muscovite flakes are distinctly parallel or squeezed flat (Figure 7a). Sometimes, detrital muscovite grains are fractured and occur as elongated flaky shapes with boundaries that are well defined (Figure 7b). The fracture suggests that a high overburden pressure resulted in recrystallization. The recrystallization of clay during diagenesis resulted in the development of mica minerals, which can be observed in the clay matrix (Figure 7c).

4.2. Diagenesis of Sandstones and Mudstones

The following diagenetic processes have an impact on the sandstone and mudstone collected from the study area, and they are cementation, mineral replacement, dissolution, and recrystallization.

4.2.1. Cementation

This is among the most significant processes that change loose sediments into consolidated rock, thereby decreasing the porosity level of rocks. The following kinds of cement were observed in the rock samples collected from the study area: calcite, quartz, feldspar, and authigenic clay mineral cement such as kaolinite and illite clay.

4.2.2. Quartz Cement

This type of cement occurs in the rocks due to the precipitation of silica between grains into the openings. Figure 8a shows well-developed quartz overgrowths and cement identified in some pore spaces of the rocks. Therefore, it is formed in the rocks as pore-filling cement. The SEM + EDX analysis (Figure 8b,c) revealed that the quartz primarily consists of silica and oxygen, while sodium, aluminum, and iron elements are present in small quantities. This is accurate in terms of the quartz chemical formula (SiO2).

4.2.3. Calcite Cementation

This kind of cement was observed in the study area’s rock samples. It occurs as either pore-filling cement or as a replacing mineral of a clay matrix. It was found that the cement did not dominate much of the analyzed samples. Calcite was precipitated in the openings and replaced the quartz grains and matrix minerals, as seen in Figure 9. This mineral was also identified by studying the elements composed in the EDX analysis. The observed elemental compositions of calcite correlate with the chemical formula of calcite (CaCO3).

4.2.4. Clay Cementation

Clay minerals (illite and kaolinite) were the main types of clay that served as a means of cementation in the rock samples. Most of the observed clay existed as pore-filling minerals, while some were found replacing the detrital grains. They might have been developed during the changing of one type of clay mineral to the other. Below are the descriptions of the clay minerals observed during the SEM + EDX analyses.

Illite

This mineral was found as a pore-filling mineral (Figure 10a). Illitization generally takes place after kaolinite and smectite have been precipitated and also involves an influx of potassium at a greater temperature [13]. The observed illite occurred in a fabric shape. The EDX graphs (Figure 10a,b) show that the major elements found in the mineral were silica and aluminum, while other minor elements include iron, potassium, and magnesium. The observed elemental compositions of illite correlate with its chemical formula: (K, H3O)(Al, Mg, Fe)2(Si, Al)4O10[(OH)2(H2O)].
Even though illitic clays are sometimes developed after kaolinite has been decomposed, kaolinite is not always decomposed when illitic cement is formed [42].

Kaolinite

Kaolinite clay can be found in the rock samples as clay cement, which fills up the pore spaces. It also exists as a common replacement mineral, which replaces K-feldspar. Kaolinite may be originally detrital or authigenic. Detrital kaolinite is deposited through erosion and transportation from the continental surface, whereas authigenic kaolinite is developed right in the depositional basin. The EDX graph (Figure 11) indicates that the mineral consists primarily of silica and aluminum, with a small quantity of potassium and magnesium.

4.2.5. Feldspar Cementation

This type of cement can be found in the study area. It occurs as pore-filling feldspar (Figure 12a). Feldspar cement acts as an authigenic opening-fill type of cement and depicts an early diagenetic mineral. This type of cement grows up from the mud, thereby filling the pore spaces. An EDX graph, which is found in Figure 12b, shows the elemental composition of the described feldspar minerals.

4.3. Dissolution

Dissolution, as reported by [43], includes removing all or part of the existing minerals in a solution and creating a pore in the rocks, which can serve as a groundwater storage area. Dissolution caused a fracture in the analyzed rock samples (Figure 13). The SEM + EDX results show that some kaolinite was developed owing to the dissolution of K-feldspars, releasing silica, and thereby offering a source of silica for the development of authigenic quartz. The formation of authigenic quartz is also enhanced by the replacement and dissolution of feldspar to illite. Secondary porosity might have been developed due to this.

4.4. Recrystallization

This is a prevalent occurrence in the study area’s rock samples. Recrystallization means changing the shape as well as the size of a specified mineral’s crystals without changing the chemical composition or the mineral composition thereafter. Fine textures and micro-granular minerals can recrystallize into coarse textures when the temperature and pressure rise with a deep burial depth. Smectite and kaolinite progressively change to illite, and later change to sericite after recrystallization (Figure 14a). The findings of the SEM + EDX analysis show that authigenic minerals such as quartz and feldspar overgrowths are the changed silicate mineral recrystallization. Also, it was observed in the rock samples that kaolinite transformed into illite. This may imply that, as a consequence of the partial modification or recrystallization of kaolinite, illite and sericite were developed.

4.5. Mineral Replacement

Mineral replacement takes place when void fluids are not in equilibrium with the rock fragments, hence enhancing solution–precipitation reactions [17]. The texture and composition of rocks are changed during this process, and further fluid migration tends to enhance cementation. The changes in temperature and pressure after being deeply buried may be the reasons that caused mineral replacement. Secondary porosities could be developed during the replacement processes.
The findings of the SEM + EDX analysis show that some cement and grains are replaced by authigenic minerals. Calcite replacing feldspar, clay matrix, and quartz (Figure 15) is a common process of replacement in the examined sandstones. The replacements of minerals in the rocks identified throughout the analysis include calcite replacing quartz, clay matrix, and feldspar, along with kaolinitization and illitization. Plagioclase feldspar was the most affected. Feldspar mineral replacement with calcite promoted the development of openings in the rocks.

4.6. Primary and Secondary Porosity

The important factors that examine the characteristics of the rock reservoir are porosity and permeability. Porosity is categorized into two major types, which are primary and secondary porosity. Primary pores develop during the sedimentation process, while secondary pores are created during diagenesis (following deposition) [44]. The observations from the SEM analysis of the sandstones indicated the two types of porosity. The examined primary pores can be classified as intergranular and micro-pores (Figure 16a). The secondary pores are secondary dissolution pores and fractured pores (Figure 16b).

4.7. Implications of Diagenesis for Aquifer Properties

The correlation between porosity and permeability, which can take several forms, is what determines the quality of an aquifer. The important characteristics of sedimentary rocks that are partly controlled by the grain packing, size, and shape are porosity and permeability [13]. Also, they play an important part in the diagenesis of sediments by regulating the flow of fluids through rocks. A petrographic investigation of the rocks showed primary and secondary porosity, hence suggesting groundwater potential. The SEM shows that some of the rocks are influenced by fracturing and are characterized by a network of tiny fractures. The bedrock becomes more permeable through fractures, permitting more groundwater flow and storage. The presence of quartz cement and overgrowth in sandstones consequently decrease the porosity and permeability in the rocks because they destroy the primary porosity. Regarding aquifer quality, the primary porosity is reduced by cementation and compaction, which is later increased by the dissolution of unstable minerals such as feldspars. The porosity and permeability of the majority of the rocks allow for groundwater storage.

4.8. Density and Porosity Results

Table 2 below shows the dry density, wet density, particle density, and porosity measurements.
The porosity range of the sandstones falls within 0.85–2.02%. The wide range in porosity is due to differences in the number of voids. Some sandstones with a low porosity are highly lithified, while those with a higher porosity have many voids. The mudstones have a porosity range of 1.20–2.56%. The small mud grains increase the surface area, which can facilitate porosity.
From the figure above (Figure 17), it can be seen that the dry density, wet density, and particle density values vary between 2.5763 and 2.6351 g/cm3, 2.6011 and 2.6544 g/cm3, and 2.6205 and 2.6978 g/cm3, respectively. The mudstone has the highest wet density of 2.6544 g/cm3.
Figure 18 shows the estimated porosity of rocks comprising mudstone and sandstone. The porosity values range from 0.85 to 2.56%. The mudstone has the highest porosity of 2.56%, while the sandstone has the lowest porosity of 0.85%.
Rocks from the Daggaboersnek Member have densities that vary between 2.5763 and 2.6978 g/cm3. The porosities vary between 0.85 and 2.56%. These density and porosity values of the rocks from the Balfour Formation fall within the ranges of 1.5–2.8 g/cm3 and 1–10% that were reported by many researchers [34,41,45] who investigated the formations that make up the Karoo Supergroup in South Africa. Furthermore, it was observed that mudstone has the highest porosity value of 2.56%, which is due to the presence of numerous pore spaces within the mudstone. The findings corroborate the results of [46], who drilled a borehole around the study area and reported that some weathered mudstone fragments were found in the samples at a depth of 65 m, whereby the highest water yield of 36,000 L/h was recorded.

5. Conclusions

This paper reported a geological assessment of Alice’s groundwater. This study shows the significant value of this method as a viable method for investigating the factors that influence the groundwater storage capacity of the research area’s rocks and other areas where applicable. The rock types directly impact an area’s groundwater, as easily fractured rock would increase the secondary porosity and permeability. The porosity types present in the research area are mainly composed of primary and secondary intergranular pores, dissolution, and fracture openings. An increased bedrock porosity due to fractures allows for more groundwater to flow through and be stored. Also, fractured areas are incredibly productive with excellent storage potential [47]. The quality of the reservoir is generally improved by the occurrence of dissolution pores and fractures in the rocks. Petrographic analyses show that the rocks contain minerals like calcite, feldspar, lithics, mica, kaolinite, quartz, and illite. The primary diagenetic processes that affect the groundwater storage of the rocks are recrystallization, mineral replacement, dissolution of minerals, and cementation via authigenic minerals. The dissolution of feldspars to illite after a diagenetic change leads to the formation of secondary pores, thus enhancing the groundwater flow. Conversely, diagenetic process, such as cementation (quartz, feldspar, illite, and kaolinite), tends to reduce the porosity and permeability of rocks. The density and porosity measurements revealed that sandstones have a density range between 2.5908 and 2.6820 g/cm3 with a porosity of 0.85–2.02%, and mudstones vary in density from 2.5763 to 2.6978 g/cm3 with a porosity of 1.20–2.56%. Mudstone has the highest porosity values compared to sandstone in the research area, which is contradictory to the normal concept that sandstone has a higher porosity than mudstone, which indicates that secondary porosity is the main porosity for the reservoir rocks in the research area. It is recommended that the study area should be investigated more via geophysical methods (magnetic and electrical resistivity methods) to identify potential groundwater areas for borehole sites. This will assist in the exploration of groundwater in this era of water scarcity.

Author Contributions

Conceptualization, G.O.A.; methodology, G.O.A., O.G. and K.L.; software, G.O.A.; validation, G.O.A., O.G. and K.L.; formal analysis, G.O.A.; investigation, G.O.A.; resources, O.G. and K.L.; data curation, G.O.A.; writing—original draft preparation, G.O.A.; writing—review and editing, O.G. and K.L.; visualization, G.O.A.; supervision, O.G. and K.L.; project administration, G.O.A.; funding acquisition, O.G. and K.L. All authors have read and agreed to the published version of the manuscript.

Funding

This research was funded by the Govan Mbeki Research and Development Centre (GMRDC) of the University of Fort Hare.

Institutional Review Board Statement

Not applicable.

Informed Consent Statement

Not applicable.

Data Availability Statement

Not applicable.

Conflicts of Interest

The authors declare that they have no conflict of interest.

References

  1. Chakkaravarthy, D.N.; Balakrishnan, T. Water Scarcity-Challenging the future. Int. J. Agric. Environ. Biotechnol. 2019, 12, 187–193. [Google Scholar] [CrossRef]
  2. Sirhan, A.; Hamidi, M.; Andrieux, P. Electrical resistivity tomography, an assessment tool for water resource: Case study of Al-Aroub Basin, West Bank, Palestine. Asian J. Earth Sci. 2011, 4, 38. [Google Scholar] [CrossRef]
  3. Adagunodo, T.A.; Akinloye, M.K.; Sunmonu, L.A.; Aizebeokhai, A.P.; Oyeyemi, K.D.; Abodunrin, F.O. Groundwater exploration in Aaba residential area of Akure, Nigeria. Front. Earth Sci. 2018, 6, 66. [Google Scholar] [CrossRef]
  4. Finnigan, G. Building a Workforce for Present and Future Health Emergencies. In Asia Pacific Humanitarian Leadership Conference Proceedings; 2017; pp. 9–14. Available online: https://ojs.deakin.edu.au/index.php/aphl/article/view/814 (accessed on 28 October 2022).
  5. Mckenzie, R.; Siqalaba, Z.N.; Wegelin, W.A. The State of Non-Revenue Water in South Africa (2012); The Water Wheel; Water Research Commission: Pretoria, South Africa, 2013; Volume 12, pp. 1–8. [Google Scholar]
  6. Weaver, M.J.T.; Keeffe, J.O.; Hamer, N.; Palmer, C.G. Water service delivery challenges in a small South African municipality: Identifying and exploring key elements and relationships in a complex social-ecological system. Water SA 2017, 43, 398–408. [Google Scholar] [CrossRef]
  7. Viljoen, G.; van der Walt, K. South Africa’s water crisis—An interdisciplinary approach. Tydskr. Vir Geesteswaternskap. 2018, 58, 483–500. [Google Scholar] [CrossRef]
  8. Woodford, A.C.; Chevallier, L. Hydrogeology of the Main Karoo Basin Current Knowledge and Future Research Needs; WRC Report No TT179/02; Water Research Commission: Gezina, South Africa, 2002. [Google Scholar]
  9. Baudoin, M.-A.; Vogel, C.; Nortje, K.; Naik, M. Living with drought in South Africa: Lessons learnt from the recent El Niño drought period. Int. J. Disaster Risk Reduct. 2017, 23, 128–137. [Google Scholar] [CrossRef]
  10. Chakona, G.; Shackleton, C.M. Household food insecurity along an agro-ecological gradient influences children’s nutritional status in South Africa. Front. Nutr. 2018, 4, 72. [Google Scholar] [CrossRef]
  11. Fourie, F.D. Application of Electro-Seismic Techniques to Geohydrological Investigations in Karoo Rocks. Ph.D. Thesis, University of the Free State, Bloemfontein, South Africa, 2003, unpublished. [Google Scholar]
  12. Ajdukiewicz, J.M.; Lander, R.H. Sandstone reservoir quality prediction: The state of the art. AAPG Bull. 2010, 94, 1083–1091. [Google Scholar] [CrossRef]
  13. Baiyegunhi, C.; Liu, K.; Gwavava, O. Diagenesis and reservoir properties of the Permian Ecca Group sandstones and mudrocks in the Eastern Cape Province, South Africa. Minerals 2017, 7, 88. [Google Scholar] [CrossRef]
  14. Bilal, A.; Mughal, M.S.; Janjuhah, H.T.; Ali, J.; Niaz, A.; Kontakiotis, G.; Antonarakou, A.; Usman, M.; Hussain, S.A.; Yang, R. Petrography and Provenance of the Sub-Himalayan Kuldana Formation: Implications for Tectonic Setting and Palaeoclimatic Conditions. Minerals 2022, 12, 794. [Google Scholar] [CrossRef]
  15. Giles, M.R.; Marshall, J.D. Constraints on the development of secondary porosity in the subsurface: Re-evaluation of processes. Mar. Pet. Geol. 1986, 3, 243–255. [Google Scholar] [CrossRef]
  16. Bloch, S.; Lander, R.H.; Bonnell, L. Anomalously high porosity and permeability in deeply buried sandstone reservoirs: Origin and predictability. AAPG Bull. 2002, 86, 301–328. [Google Scholar]
  17. Worden, R.H.; Burley, S.D. Sandstone diagenesis: The evolution of sand to stone. Sandstone Diagenesis Recent Anc. 2003, 4, 3–44. [Google Scholar]
  18. Chima, P.; Baiyegunhi, C.; Liu, K.; Gwavava, O. Petrography, modal composition and tectonic provenance of some selected sandstones from the Molteno, Elliot and Clarens Formations, Karoo Supergroup, in the Eastern Cape Province, South Africa. Open Geosci. 2018, 10, 821–833. [Google Scholar] [CrossRef]
  19. Makulana, M.; Baiyegunhi, C.; Masango, S. Petrography, modal composition, and tectonic provenance of some selected sandstones from the Swaershoek and Alma Formations (Waterberg Group) and Glentig Formation, Limpopo Province, South Africa: Evidence from framework grains. Arab. J. Geosci. 2022, 15, 1–19. [Google Scholar] [CrossRef]
  20. Adesola, G.O.; Gwavava, O.; Liu, K. Hydrological Evaluation of the Groundwater Potential in the Fractured Karoo Aquifer Using Magnetic and Electrical Resistivity Methods: Case Study of the Balfour Formation, Alice, South Africa. Int. J. Geophys. 2023, 2023, 1891759. [Google Scholar] [CrossRef]
  21. Solomon, S. Remote Sensing and GIS: Applications for Groundwater Potential Assessment in Eritrea. Environmental and Natural Resources Information Systems; Royal Institute of Technology: Stockholm, Sweden, 2003; ISBN 91-7283-457-9. [Google Scholar]
  22. Mpofu, M.; Madi, K.; Gwavava, O. Remote sensing, geological, and geophysical investigation in the area of Ndlambe Municipality, Eastern Cape Province, South Africa: Implications for groundwater potential. Groundw. Sustain. Dev. 2020, 11, 100431. [Google Scholar] [CrossRef]
  23. Owolabi, S.T.; Madi, K.; Kalumba, A.M.; Baiyegunhi, C. A geomagnetic analysis for lineament detection and lithologic characterization impacting groundwater prospecting; a case study of Buffalo catchment, Eastern Cape, South Africa. Groundw. Sustain. Dev. 2021, 12, 100531. [Google Scholar] [CrossRef]
  24. Baiyegunhi, C.; Oloniniyi, T.L.; Gwavava, O. The correlation of dry density and porosity of some rocks from the Karoo Supergroup: A case study of selected rock types between Grahamstown and Queenstown in the Eastern Cape Province, South Africa. IOSR J. Eng. 2014, 4, 30–40. [Google Scholar] [CrossRef]
  25. Reynold, J.M. An Introduction to Applied and Environmental Geophysics, 2nd ed.; John Wiley and Sons: New York, NY, USA, 1997; pp. 117–806. [Google Scholar]
  26. Dandekar, A. Petroleum Reservoir Rock and Fluid Properties; CRC Press: Boca Raton, FL, USA, 2006; pp. 13–17. [Google Scholar]
  27. Selected Building Statistics of the Private Sector as Reported by Local Government Institutions; Statistics South Africa: Johannesburg, South Africa, 2011.
  28. Mrubata, K. Rainfall Analysis at the Alice Ecotope in the Eastern Cape Province of South Africa. Master’s Dissertation, Department of Geology, University of Fort Hare, Alice, South Africa, 2012; pp. 45–46. [Google Scholar]
  29. Amathole District Municipality. Climate Change Vulnerability Assessment and Response Framework. Integr. Dev. Plan Rep. 2011, 11, 1745. [Google Scholar]
  30. Sibanda, T.; Chigor, V.N.; Okoh, A.I. Seasonal and spatio-temporal distribution of faecal-indicator bacteria in Tyume River in the Eastern Cape Province, South Africa. Environ. Monit. Assess. 2013, 185, 6579–6590. [Google Scholar] [CrossRef] [PubMed]
  31. Catuneanu, O.; Hancox, P.J.; Rubidge, B.S. Reciprocal flexural behaviour and contrasting stratigraphies: A new basin development model for the Karoo retroarc foreland system, South Africa. Basin Res. 1998, 10, 417–440. [Google Scholar] [CrossRef]
  32. Johnson, M.; van Vuuren, C.; Visser, J.; Cole, D.; de Wickens, H.; Christie, A.; Roberts, D. The Foreland Karoo Basin, South Africa. In African Sedimentary Basins of the World; Selley, R., Ed.; Elsevier: Amsterdam, The Netherlands, 1997; Volume 3, pp. 269–317. [Google Scholar]
  33. Schluter, T. Geological Atlas of Africa: With Notes on Stratigraphy, Tectonics, Economic Geology, Geohazards and Geosites of Each Country, 2nd ed.; Springer: Berlin, Germany, 2008; pp. 26–28. [Google Scholar]
  34. Johnson, M.R.; Van Vuuren, C.J.; Visser, J.N.; Cole, D.I.; Wickens, H.D.V.; Christie, A.D.; Roberts, D.L.; Brandl, G.; Anhaeusser, C.R.; Thomas, R.J. Sedimentary rocks of the Karoo Supergroup. In The Geology of South Africa; Geological Society of South Africa and Council for Geoscience: Johannesburg, South Africa, 2006; pp. 461–499. [Google Scholar]
  35. Visser, J.N.J. Post-glacial Permian stratigraphy and geography of southern and central Africa: Boundary conditions for climatic modelling. Palaeogeogr. Palaeoclim. Palaeoecol. 1995, 118, 213–243. [Google Scholar] [CrossRef]
  36. Johnson, M.R.; van Vuuren, C.J.; Hegenberger, W.F.; Key, R.; Shoko, U. Stratigraphy of the Karoo Supergroup in southern Africa: An overview. J. Afr. Earth Sci. 1996, 23, 3–15. [Google Scholar] [CrossRef]
  37. Oghenekome, M.E. Sedimentary Environments and Provenance of the Balfour Formation (Beaufort Group) in the Area between Bedford and Adelaide, Eastern Cape Province, South Africa. Master’s Dissertation, University of Fort Hare, Alice, South Africa, 2012; p. 76. [Google Scholar]
  38. Usher, B.H.; Pretorius, J.A.; Van Tonder, G.J. Management of a Karoo fractured-rock aquifer system-Kalkveld water user association (WUA). Water SA 2007, 32, 9–19. [Google Scholar] [CrossRef]
  39. Rose, R.P. The characterisation of fractured Karoo Aquifers near Beaufort West. Ph.D. Thesis, University of Pretoria, Pretoria, South Africa, 2017. [Google Scholar]
  40. atemaunzanga, D. Lithostratigraphy, Sedimentology and Provenance of the Balfour Formation (Beaufort Group) in the Fort Beaufort-Alice, Eastern Cape Province, South Africa. Master’s Thesis, University of Fort Hare, Alice, South Africa, 2009; pp. 1–140, unpublished. [Google Scholar]
  41. Baiyegunhi, C.; Gwavava, O. Variations in isochore thickness of the Ecca sediments in the Eastern Cape Province of South Africa, as deduced from gravity models. Acta Geol. Sin. 2016, 90, 1699–1712. [Google Scholar] [CrossRef]
  42. Hurst, A.; Irwin, H. Geological Modelling of Clay Diagenesis in Sandstones. Clay Min. 1982, 17, 5–22. [Google Scholar] [CrossRef]
  43. Boggs, S.J. Principles of Sedimentology and Stratigraphy; Pearson Education, Inc.: Upper Saddle River, NJ, USA, 2014; 564p. [Google Scholar]
  44. Selley, R.C. Applied Sedimentology; Academic Press: Cambridge, MA, USA, 2000; pp. 128–129. [Google Scholar]
  45. Baiyegunhi, C.; Gwavava, O. Magnetic investigation and 2½ D gravity profile modelling across the Beattie magnetic anomaly in the southeastern Karoo Basin, South Africa. Acta Geophys. 2017, 65, 119–138. [Google Scholar] [CrossRef]
  46. Liuji, Y. Measurement of the Bulk Flow and Transport Characteristics of Selected Fractured Rock Aquifer Systems in South Africa: A Case Study of the Balfour Formation in the Eastern Cape Province, South Africa. Master’s Dissertation, University of Fort Hare, Alice, South Africa, 2011; pp. 41–42, unpublished. [Google Scholar]
  47. Pietersen, K.; Beekman, H.E.; Holland, M. South African groundwater governance case study. In Report Prepared for the World Bank in Partnership with the South African Department Groundwater Issues in Hard Rock & Geophysics 11 of Water Affairs and the Water Research Commission; WRC Report No. KV 273/11; Water Research Commission: Gezina, South Africa, 2011. [Google Scholar]
Figure 1. Map of the study area showing the Tyume River.
Proceedings 87 00039 g001
Figure 2. Detailed geological map of Alice [40,41].
Proceedings 87 00039 g002
Figure 3. Photo demonstrating the use of Archimedes’ principle in rock sample measurements.
Proceedings 87 00039 g003
Figure 4. Petrographic study of sandstone displaying (a) quartz grain (red arrows), plagioclase (blue arrows), and muscovite grains (yellow arrows); (b) quartz overgrowth (yellow arrow) and muscovite grains (red arrow); and (c) scanning electronic microscopy (SEM) photomicrograph and the EDX graphs indicating a quartz composition that is rich in Si and O (SiO2) with various elements present in quartz grains at points 3 and 5.
Proceedings 87 00039 g004
Figure 5. Thin section analysis illustrating (a) plagioclase feldspar (blue arrows); (b) microcline partially altered to albite (yellow arrow); (c) feldspar, which was broken (red arrow) along cleavage; and (d) perthitic texture of feldspar (red arrow).
Proceedings 87 00039 g005
Figure 6. Thin section analysis showing (a) metamorphic lithic (blue arrow) and poorly sorted quartz grains (red arrow); (b) mudstone showing quartz (white points), feldspar (red arrow), and muscovite (yellow arrow); (c) volcanic lithic (blue arrow) with detrital quartz (white), feldspar (yellow arrow), and muscovite (red arrow).
Proceedings 87 00039 g006
Figure 7. Petrographic image displaying (a) biotite (yellow arrow) and muscovite (red arrows); (b) deformed muscovite flakes (yellow arrow); and (c) clay matrix, which was recrystallized to muscovite (red arrow).
Proceedings 87 00039 g007
Figure 8. Thin section of sandstone illustrating (a) quartz cement (yellow arrows) and quartz overgrowth (black arrow); (b) scanning electron microscopy (SEM) photomicrograph indicating quartz grain (yellow arrow); and (c) SEM + EDX graph indicating the Si- and O-rich composition of quartz, with various elements present in quartz grain at point 1.
Proceedings 87 00039 g008
Figure 9. Thin section analysis illustrating calcite cement (yellow arrows) replacing quartz grains and clay matrix.
Proceedings 87 00039 g009
Figure 10. (a) SEM photomicrograph of sandstone displaying illite, which occurs in a fibrous shape (yellow arrows); (b) SEM + EDX indicating the composition of various elements present in illite at point 1; (c) graphs indicating the composition of various elements present in clay mineral cement at point 2.
Proceedings 87 00039 g010
Figure 11. (a) SEM photomicrograph of sandstone indicating kaolinite cement (yellow arrow), quartz grain (red arrow), plagioclase grain consisting of Ca (black arrow), and intercrystalline pore/fracture, which can serve as water storage area (blue arrow); (b) SEM photomicrograph of sandstone indicating plagioclase grain at point 1, kaolinite cement at point 2 at point 1, and kaolinite cement, which is rich in Si, Al, K, and O at point 3; (c) SEM + EDX indicating the composition of different elements found in plagioclase grain at point 1; (d) SEM + EDX graphs indicating the composition of different elements found in kaolinite cement at point 2; (e) SEM + EDX analyses of sandstone showing kaolinite cement, which is rich in Si, Al, K, and O. The Au peak was due to Au coating.
Proceedings 87 00039 g011
Figure 12. SEM image of mudstone from the study area indicating (a) intergranular pores (blue arrow) and authigenic feldspar (yellow arrow); (b) EDX graph indicating the composition of several elements existing in authigenic feldspar. The Au peak was due to Au coating.
Proceedings 87 00039 g012
Figure 13. SEM image of mudstone from the study area indicating various dissolution pores/fractures (yellow arrows).
Proceedings 87 00039 g013
Figure 14. (a) SEM photomicrograph showing kaolinite (point 1), illite (point 2), and intergranular pores (yellow arrows); (b) EDX graph indicating the composition of various elements present in kaolinite at point 1; (c) graph indicating the composition of various elements present in illite at point 2.
Proceedings 87 00039 g014
Figure 15. (a) SEM photomicrograph showing plagioclase feldspar (point 1) and calcite (point 2); (b) EDX graph indicating the composition of various elements present in plagioclase feldspar (point 1); (c) EDX graph showing the composition of various elements present in calcite replacing plagioclase (point 2).
Proceedings 87 00039 g015
Figure 16. Scanning electron microscopy photomicrograph indicating (a) primary intergranular openings and secondary fracture (left 3 arrows along a crack) in sandstone (red arrows); (b) primary micro-pores in a sandstone collected from the study area (red arrows).
Proceedings 87 00039 g016
Figure 17. Bar chart showing densities of the rocks (S represents sandstone and M represents mudstone).
Proceedings 87 00039 g017
Figure 18. Bar chart of porosity of the rocks (S represents sandstone and M represents mudstone).
Proceedings 87 00039 g018
Table 1. Lithostratigraphy of the Karoo Supergroup in the Eastern Cape Province [34].
SupergroupGroupSubgroupFormationMemberLithology
KAROOSTORMBERG Drakensberg Basalt
Pyroclastic Deposits
Clarens Sandstone
Elliot Red Mudstone
Sandstone
Molteno Coarse Sandstone
Khaki and Grey Shale
Coal Measures
BEAUFORTTARKASTDBurgersdorp Mudstone
Sandstone
Grey Shale
Katberg Sandstone,
Red Mudstone
Grey Shale
ADELAIDEBalfourPalingkloof Red Mudstone
Sandstone
Grey Shale
Elandsberg Sandstone
Siltstone
Barberskrans Sandstone
Khaki Shale
DaggaboersnekGrey Shale
Sandstone
Siltstone
Oudeberg Sandstone
Khaki Shale
Middleton Shale
Sandstone
Red Mudstone
Koonap Grey Sandstone
Shale
ECCA Waterford Sandstone
Shale
Fort Brown Shale
Sandstone
Ripon Sandstone
Shale
Collingham Grey Shale
Yellow Claystone
Whitehill Black Shale
Chert
Prince Albert Khaki Shale
Dwyka Diamictite
Tillite
Shale
Table 2. Density and porosity results of the collected rock samples (S represents sandstone and M represents mudstone).
LithologyDry
Density
(g/cm3)
Wet
Density
(g/cm3)
Particle
Density
(g/cm3)
Porosity
(%)
S12.60652.61512.62890.85
S22.60832.62232.64541.40
S32.61682.63402.66251.72
S42.59082.60212.62051.13
S52.62782.64802.68202.02
M12.63512.64992.67481.48
M22.62842.64042.66021.20
M32.57632.60112.64172.48
M42.62872.65442.69782.56
M52.61522.63362.66411.84
Disclaimer/Publisher’s Note: The statements, opinions and data contained in all publications are solely those of the individual author(s) and contributor(s) and not of MDPI and/or the editor(s). MDPI and/or the editor(s) disclaim responsibility for any injury to people or property resulting from any ideas, methods, instructions or products referred to in the content.

