1. Introduction
Tectonic intensity greatly affects the development of depositional successions in an area, which makes it crucial for knowledge about the period that took place. Inversion tectonics is characterized as the reverse from subsidence to uplift due to the contraction and subsequent reactivation of previously extensional faults [
1,
2,
3].
Landslides contribute to dismantling active mountain belts [
4,
5] and faults control the location and abundance of landslides caused by seismic and meteorological triggers [
6,
7]. Landscape evolution models predict higher rates of landslide erosion near faults [
8,
9]. However, empirical evidence of the long-term regional dependency of landslides on active faults remains scarce [
10]. A slump is a type of slide (movement as a mass) that takes place within thick unconsolidated deposits. Slumps involve movement along one or more curved failure surfaces, with downward motion near the top and outward motion toward the bottom. They are typically caused by an excess of water within these materials on a steep slope [
11].
The objective of this study is to recognize the generating mechanism of slides and slumps, to understand their relationship with the basin geometry and evolution and to relate them to fault activity and the age of their formation.
2. Geological Setting
The Hellenic Fault and Thrust Belt (HFTB) dominates the External Hellenides and is mainly controlled by the collision and the continued convergence of the African and Eurasian plates since the Mesozoic [
12].
In Kefalonia Island, the Apulian Platform Margins (APM) were deformed from the compression of the Ionian Thrust, producing several small foreland basins. The Paliki Peninsula is in close proximity to the Kefalonia strike-slip fault and exhibits slumped blocks in the opposite direction (eastward directed) to younger deposits [
13] (
Figure 1).
The main structural pattern of Kefalonia Island consists of inverse faults and overthrusts. The over-thrust of the Ionian Basin on the Pre-Apulian Platform is affected by two thrusts, the Atheras and Enos thrusts, causing contact between different depositional successions [
15] (
Figure 2).
Accordi et al. [
15,
16] introduced six (6) different sectors (from I to VI) in the study area of Paliki Peninsula (
Figure 3). From sector I up to sector III, located west of the Atheras Thrust, a progressive increase of a hiatus was recognized. A subaerial exposure of the whole area was suggested, which was terminated by the onset of shallow water sedimentation, followed by an increasing deepening. East of the Atheras thrust, in the Rahi-Loutsa sector (Sector IV), the restricted inner-ramp facies were missing, whereas the sequence shows a wider textural variability in the middle-outer ramp facies, some in situ, some others resedimented. Sector V in Zola is the tectonic contact between the shallow water succession of sector IV and the toe of slope succession of sector VI, hidden by Miocene and Plio-Pleistocene deposits. Finally, east of Enos thrust, sector VI, with a toe of slope sedimentation, which persists throughout the Senonian without significate changes, was recognized.
In general, it was introduced that from west to east, at the lower stratigraphic areas, a sabha and tidal flat environment (Atheras sector III) pass laterally to a subtidal protected lagoon (Rahi-Loutsa sector IV) and finally to the toe of the slope (Zola sector V). In the upper stratigraphic areas and from west to east, a tidal flat–protected lagoon pass from a subtidal-protected lagoon to an open marine shoal and finally to the toe of the slope.
3. Material and Methods
The depositional conditions and the age determinations were based on selected samples from the western part of Kefalonia Island, from which thin sections were prepared. Sampling was run in carbonate deposits of different ages in the Paliki Peninsula and was organized according to the pre-existing geological map of Kefalonia Island. Eighteen samples in Paliki Peninsula were collected.
The selection of the samples was based on lithology and facies alternations (
Figure 3). All samples were cut and thin sections were prepared for microfacies analysis in order to establish the temporal and spatial changes and the evolution of the respective depositional paleoenvironments in the study area (
Figure 3).
Microfacies analysis was used to identify the depositional environments and the dynamic conditions of the carbonate sequence in the northern part of Paliki Peninsula in different positions of the basin. The textural characteristics of the microfacies types were defined according to Dunham’s [
17] classification modified by Embry and Klovan [
18] and Flügel [
19], and their description includes biogenic and inorganic dominant components of depth and depositional environment [
20,
21,
22].
4. Depositional Conditions and Age Determination
The microfacies analysis in the studied thin sections (for the location of samples see
Figure 3b) showed that we have samples that deposited in deep water conditions in a pelagic environment (FZ3/FZ4) as well as some samples that deposited in a shallower water condition in an open marine-restricted environment (FZ7/FZ8).
Samples A1, A3, A14, A15 and A17 were classified as SMF 3, which deposited in a moderately inclined sea floor and basinward of the steeper slope environment that belongs to facies zone FZ4. Samples A13 and A18 are classified as SMF 5 type that belongs to facies zone FZ3. Both FZ3 and FZ4 facies zones represent slope depositional environment conditions.
In addition, samples A2, A4, A5, A7 and A8 were classified as SMF 8–9 types, which belongs to facies zone FZ7. Although A6 and A16 were classified as SMF 17–18 types, which also belongs to the FZ7 facies zone. There were also some samples (A9, A10, A11, A12) that were classified as SMF 19–20 types and belong to facies zone FZ8. In the samples that represent FZ7 and FZ8 facies zones, we have the presence of benthic foraminifera and algae. Both FZ7 and FZ8 facies zones represent an open marine-restricted environment.
5. Field Work
The studied section along the road from Argostoli to Lixouri and close to the isthmus of Paliki peninsula is 230 m in length and up to 10 m thick, with an overall NW–SE direction, with a 15° up to 23° dip (
Figure 4). Seventeen (17) different beds were recognized, some of which present internal differences and could be related to different periods of development. The beds of the studied section present different thicknesses from medium- to thick-bedded limestones (0.3 m to 2 m).
Two slump horizons, up to 1 m thick each, with sharp and erosional contacts, were recognized in the eastern side of the section. Twelve (12) faults were measured in the western part of the section. The above faults have a listric geometry, with an ESE–WNW direction. Most of them dip to the west and some of them show an east dip. The synchronous activity of the above faults produced either a synthetic scale or a horst geometry. A detachment surface of a giant slide, up to 5 m thick, also was recognized in the western part of the studied section. Finally, a recent fluvial channel, 20 m wide and 4 m thick, with erosional contact, was recognized, which was developed due to synthetic and antithetic fault activity.
5.1. Slump Horizons
The presence of two slump horizons, horizons two (2) and seven (7), was recognized. Both slumps showed that they were sourced from the east, as a result of tectonic activity (
Figure 5).
The first slump horizon (2) showed an outcrop that was 71 m long and 1.8 m thick, with a flat base, erosional upper surface (
Figure 5b) and high lateral stable thickness. Over the later time period, five (5) undeformed horizons were developed with flat bases, except for horizon 3, which rests over horizon 2, with erosional contact (
Figure 5c).
The second slump horizon (7) wedged out northwards and showed an outcrop of 88 m long and 1.2 m thick (
Figure 5c), with a reduction of its thickness from 1.2 m to 0.3 m (
Figure 5d).
The geometry of these two slumps and the internal clast size introduce that both were sourced from the south.
5.2. Normal with Listric Geometry Faults, Most of Them with an ESE–WNW Direction
In the studied section, twelve (12) normal faults were measured, only in the western part of the section. Most of them showed an ESE–WNW direction and only a few of them showed an NNE–SSW direction. In addition, there are faults with opposite dip directions (synthetic and antithetic faults), and as a result, highs and troughs were developed internally to the basin during sedimentation (
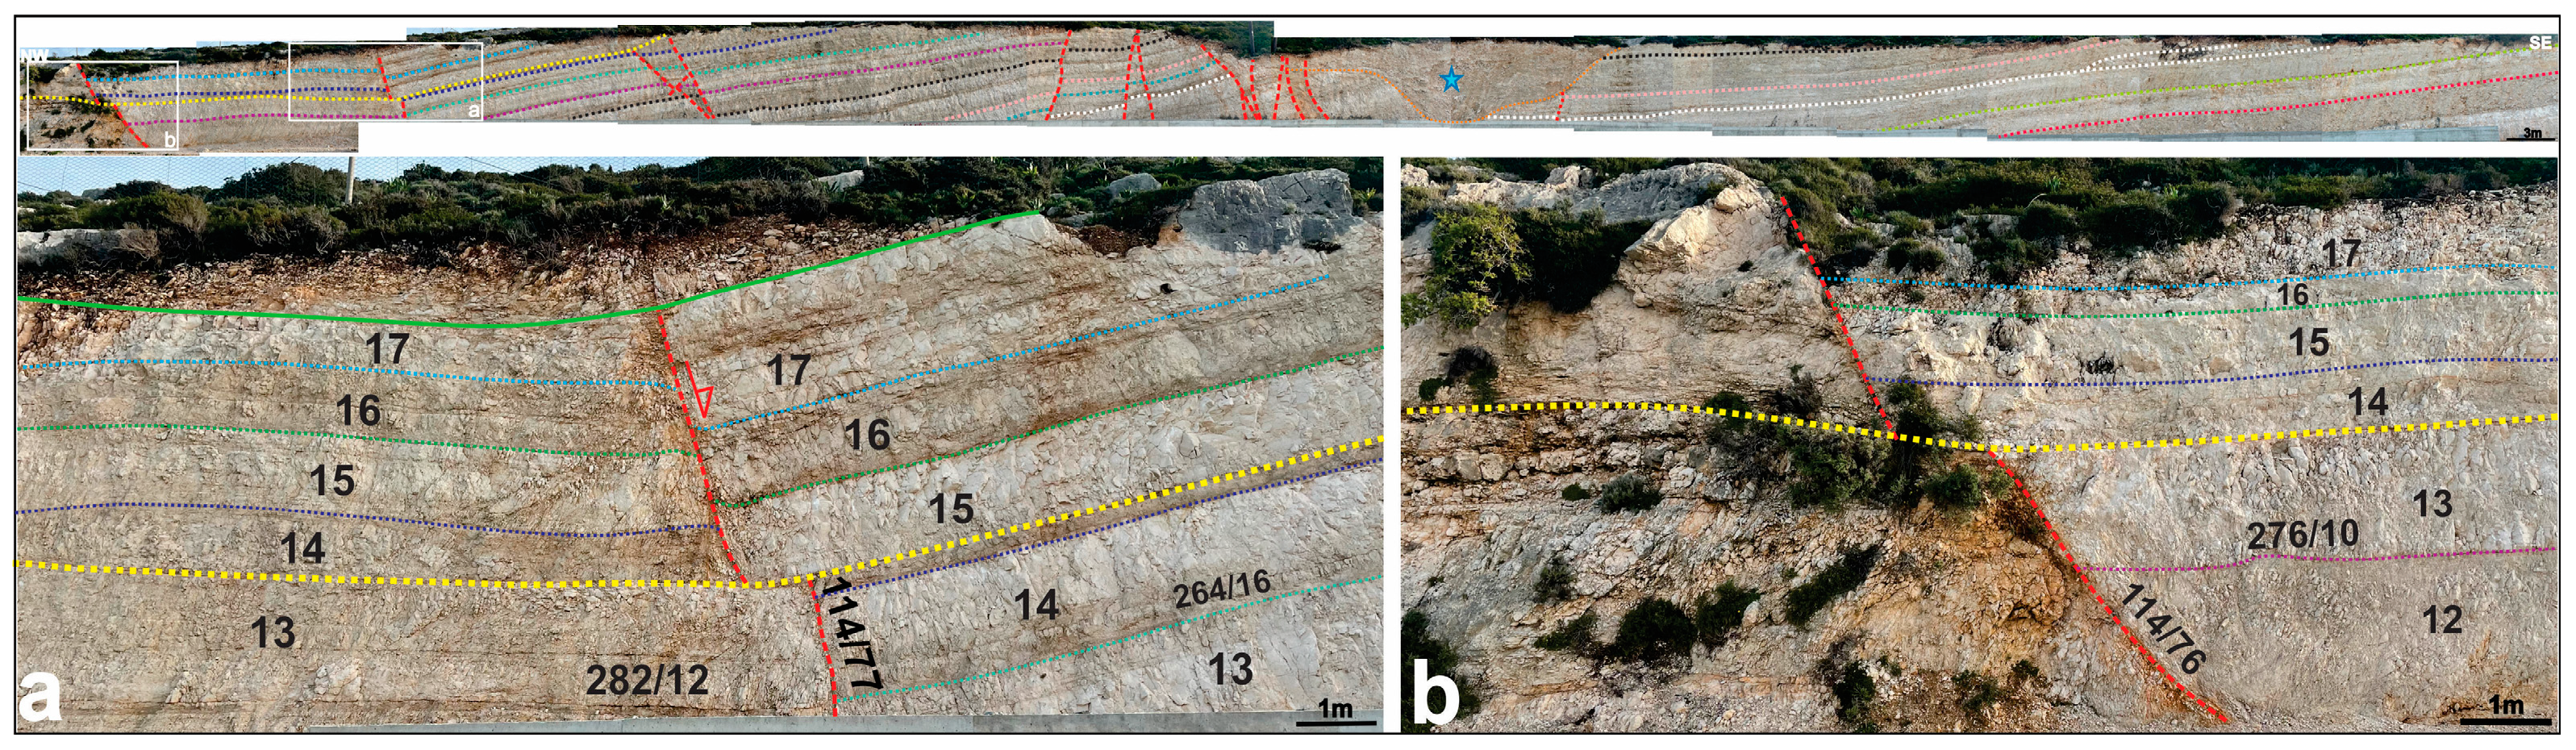
Figure 6a). The above faults showed movements of the downthrown blocks ranging from 2 cm to 30 cm. Finally, this tectonic activity seems to terminate in the upper stratigraphic outcropped level during sedimentation (light green line in
Figure 6a,b).
5.3. Giant Slide
In the western part of the studied section, a detachment surface up to 5 m thick, on which a giant slide took place, was recognized (yellow dashed line, in
Figure 7a,b). This detachment surface crosscut the pre-existing faults and moved the whole block to the west. The above slide indicates an instability of the basin floor, with consolidated sediments producing a movement of at least 0.9 m to the west (
Figure 7a,b).
5.4. Additional Data
In the eastern side of the studied section, recent fluvial deposits were recognized in a channelized geometry body that seems to follow a N–S direction, parallel with the major measured faults’ direction (
Figure 8).
It seems that the synchronous activity of synthetic and antithetic faults produced a subsided block with a channel geometry where the river flowed (
Figure 8) and eroded the underlying deposits. In the main channel axis, more than 10 m wide, deposits more than 4 m thick were accumulated. It is not clear if this event took place before or after the movement of the giant slide and if the same faults influenced the two different events. Presently, this channel is situated 85 m above sea level without any clear evidence about the time of its development.
6. Discussion
A detailed analysis of the studied section taking into account our microfacies results from the surrounding areas and previous results, as well as different approaches for the sedimentary conditions, the basin evolution and the interaction between different factors, were arranged. These approaches referred to the depositional environments and the dynamic conditions of the carbonate sequence in the northern part of Paliki Peninsula, part of Kefalonia Island.
Microfacies analysis showed two different types of depositional conditions (FZ3/FZ4 and FZ7/FZ8). The samples from the studied section showed that they were deposited in either deep-water conditions, in a pelagic environment (FZ3/FZ4), or in a shallower water condition, in an open marine-restricted environment (FZ7/FZ8). The deep-water samples that are situated close to the Atheras fault, in a very restricted but elongated basin, showed that during the Cretaceous, the above fault plane acted as a normal fault, with listric geometry, dips to the west and that deep-water conditions were developed in its hanging wall block. On the other hand, the Enos fault plane dips to the east, and gradually, the basin deepened eastwards towards the Ionian basin. Later and during the compressional regime (middle Miocene), Atheras faults inverted to back-thrust faults and Enos inverted to a thrust fault. Moreover, the synchronous activity of Atheras and Enos faults created an intrabasinal high in the block between them (
Figure 9a,b).
As the studied area is situated far from the Ionian thrust and taking into account the present results in combination with previous results [
13,
15,
23], it seems that the Apulian Platform was very close to the west of the studied Paliki Peninsula.
It is obvious that the Enos fault, acting as a normal fault during the Cretaceous, was the responsible fault due to the activity of the studied area as it was developed. Due to the activity of the above fault, the studied section rotated to the west and an unstable basin floor was formed, from which the giant slide was produced.
7. Conclusions
Three major points, or events, took place in chronological order. First, two slumps were developed and sourced from the east and from the uplifted footwall of a normal fault situated east of the studied section. Second, many normal faults cross-cut the studied sections, with listric geometry, displacement up to 30 cm and an ESE–WNW direction, mostly west-dipping and less east-dipping, producing either a synthetic scale or a horst geometry. These faults acted during the sedimentation as their activity ended before the end of the sedimentation. Third, a giant slide was produced as a result of an unstable basin floor due to the whole block rotation to the west and the instability of the sediments. This slide cut the pre-existing normal faults and the block moved at least 0.9 m to the west.
Author Contributions
Conceptualization N.D. and A.Z.; methodology, N.D., G.I. and A.Z.; software, N.D.; formal analysis, N.D., G.I., E.Z., P.P. and N.B.; investigation, N.D., G.I. and A.Z.; resources, N.D.; data curation, N.D.; writing—original draft preparation, N.D., G.I. and A.Z.; writing—review and editing, N.D., G.I., N.B. and A.Z.; supervision, A.Z. All authors have read and agreed to the published version of the manuscript.
Funding
Nicolina Bourli is a Post-Doc Researcher, and she was financially supported by the “Hellenic Hydrocarbon Resources Management S.A. (HHRM S.A.)”.
Institutional Review Board Statement
Not applicable.
Informed Consent Statement
Not applicable.
Data Availability Statement
Not applicable.
Conflicts of Interest
The authors declare no conflict of interest.
References
- Cooper, M.A.; Williams, G.D.; de Graciansky, P.C.; Murphy, R.W.; Needham, T.; De Paor, D.; Stoneley, R.; Todd, S.P.; Turner, J.P.; Ziegler, P.A. Inversion tectonic—A discussion. In Inversion Tectonics; Cooper, M.A., Williams, G.D., Eds.; Geological Society Special Publications: London, UK, 1989; Volume 44, pp. 335–347. [Google Scholar]
- Cooper, M.; Warren, M.J. Inverted fault systems and inversion tectonic settings. In Regional Geology and Tectonics: Principles of Geologic Analysis; Elsevier: Amsterdam, The Netherlands, 2020; pp. 169–204. [Google Scholar]
- Williams, G.D.; Powell, C.M.; Cooper, M.A. Geometry and Kinematics of INVERSION Tectonics; Geological Society Special Publications: London, UK, 1989; Volume 44, pp. 3–15. [Google Scholar]
- Burbank, D.W.; Leland, J.; Fielding, E.J.; Anderson, R.S.; Brozovic, N.; Reid, M.R.; Duncan, C. Bedrock incision, rock uplift and threshold hillslopes in the northwestern Himalayas. Nature 1996, 379, 505–510. [Google Scholar] [CrossRef]
- Larsen, I.J.; Montgomery, D.R.; Korup, O. Landslide erosion controlled by hillslope material. Nat. Geosci. 2010, 3, 247–251. [Google Scholar] [CrossRef]
- Guzzetti, F.; Cardinali, M.; Reichenbach, P. The influence of structural setting and lithology on landslide type and pattern. Environ. Eng. Geosci. 1996, 2, 531–555. [Google Scholar] [CrossRef]
- Scheingross, J.S.; Minchew, B.M.; Mackey, B.H.; Simons, M.; Lamb, M.P.; Hensley, S. Fault-zone controls on the spatial distribution of slow-moving landslides. Geol. Soc. Am. Bull. 2013, 125, 473–489. [Google Scholar] [CrossRef]
- Densmore, A.L.; Anderson, R.S.; McAdoo, B.G.; Ellis, M.A. Hillslope evolution by bedrock landslides. Science 1997, 275, 369–372. [Google Scholar] [CrossRef] [PubMed]
- Chen, A.; Darbon, J.; Morel, J.-M. Landscape evolution models: A review of their fundamental equations. Geomorphology 2014, 219, 68–86. [Google Scholar] [CrossRef]
- Bucci, F.; Santangelo, M.; Cardinali, M.; Fiorucci, F.; Guzzetti, F. Landslide distribution and size in response to Quaternary fault activity: The Peloritani Range, NE Sicily, Italy. Earth Surf. Process. Landf. 2016, 41, 711–720. [Google Scholar] [CrossRef]
- Earle, S. Physical Geology, 2nd ed.; Victoria, B.C., Ed.; BCcampus: Victoria, BC, Canada, 2019; pp. 493–498. [Google Scholar]
- Zelilidis, A.; Piper, D.J.W.; Vakalas, J.; Avramidis, P.; Getsos, K. Oil and gas plays in Albania: Do equivalent plays exist in Greece? J. Pet. Geol. 2003, 26, 29–48. [Google Scholar] [CrossRef]
- Tserolas, P.; Maravelis, A.; Pasadakis, N.; Zelilidis, A. Organic geochemical features of the Upper Miocene successions of Lefkas and Cephalonia islands, Ionian Sea, Greece: An integrated geochemical and statistical approach. Arab. J. Geosci. 2018, 11, 105. [Google Scholar] [CrossRef]
- Bourli, N.; Maravelis, A.G.; Zelilidis, A. Classification of soft sediment deformation in carbonates based on the Lower Cretaceous Vigla Formation, Kastos, Greece. Int. J. Earth Sci. 2020, 109, 2599–2614. [Google Scholar] [CrossRef]
- Accordi, G.; Carbone, F.; Di Carlo, M.; Pignatti, J. Microfacies analysis of deep-water breccias clasts: A tool for interpreting shallow-vs. deep-ramp Paleogene sedimentation in Cephalonia and Zakynthos (Ionian Islands, Greece). Facies 2014, 60, 445–466. [Google Scholar] [CrossRef]
- Accordi, G.; Carbone, F.; Pignatti, J. Depositional history of a Paleogene carbonate ramp (western Cephalonia, Ionian Islands, Greece). Geol. Romana 1999, 34, 131–205. [Google Scholar]
- Dunham, R.J. Classification of carbonate rocks according to depositional texture. In Classification of Carbonate Rocks; Ham, W.E., Ed.; American Association of Petroleum Geologists: Tulsa, Oklahoma, 1962; pp. 108–121. [Google Scholar]
- Embry, A.F.; Klovan, J.E. A late Devonian reef tract on northeastern Banks Island. N.W.T. Bull. Can. Pet. Geol. 1971, 19, 730–781. [Google Scholar]
- Flügel, E. Microfacies Analysis of Carbonate Rocks; Springer: Berlin/Heidelberg, Germany, 2004. [Google Scholar]
- Hottinger, L. Alveolinids, Cretaceous-Tertiary larger Foraminifera. Exxon Production Research Company, Technical Information Services. Laboratories 1974, 87, 106. [Google Scholar]
- Hottinger, L. Shallow benthic foraminiferal assemblages as signals for depth of their deposition and their limitations. Bull. De La Société Géologique De Fr. 1997, 168, 491–505. [Google Scholar]
- Pomoni-Papaioannou, F.; Zoumpouli, E.; Zelilidis, A.; Iliopoulos, G. Microfacies and benthic foraminiferal assemblages of the carbonate succession of the Cretaceous platform in the Sami area (NW of Kefallinia, W Greece): Biostratigraphy and palaeoenvironments. In Proceedings of the 29th IAS Meeting of Sedimentology, Schladming, Austria, 10–13 September 2012. [Google Scholar]
- Bourli, N.; Kokkaliari, M.; Dimopoulos, N.; Iliopoulos, I.; Zoumpouli, E.; Iliopoulos, G.; Zelilidis, A. Comparison between siliceous concretions from the Ionian Basin and the Apulian Platform Margins (Pre-Apulian zone), western Greece: Implication of differential diagenesis on nodules evolution. Minerals 2021, 11, 890. [Google Scholar] [CrossRef]
Figure 1.
Simplified geological map of the Ionian Basin and the Apulian Platform Margins (APM) showing the major structural elements. The studied Kefalonia Island is marked with a red box [
14].
Figure 1.
Simplified geological map of the Ionian Basin and the Apulian Platform Margins (APM) showing the major structural elements. The studied Kefalonia Island is marked with a red box [
14].
Figure 2.
The geological map of the Island of Kefalonia. The studied Paliki Peninsula is marked with a red box.
Figure 2.
The geological map of the Island of Kefalonia. The studied Paliki Peninsula is marked with a red box.
Figure 3.
(a) The geological map of the studied Paliki Peninsula. The red box shows the studied area. (b) A detailed map showing the studied northern part of the Paliki Peninsula with the location of the selected samples.
Figure 3.
(a) The geological map of the studied Paliki Peninsula. The red box shows the studied area. (b) A detailed map showing the studied northern part of the Paliki Peninsula with the location of the selected samples.
Figure 4.
(a) Panoramic view of the study area. The red dashed lines show the normal faults that influenced sedimentation processes and the black box shows the studied section. (b) An overview of the studied section. Star shows the axis plain.
Figure 4.
(a) Panoramic view of the study area. The red dashed lines show the normal faults that influenced sedimentation processes and the black box shows the studied section. (b) An overview of the studied section. Star shows the axis plain.
Figure 5.
On the top, (a) the studied section is shown and the white box showing the exact location of photograph a is marked; (b) a slump horizon (horizon 2) between the undeformed horizons (1, 3) with an erosional top surface; (c,d) medium interbedded limestones showing the two slump horizons (2, 7) and their lateral extension. Star shows the axis plain.
Figure 6.
On the top and in the general view of the studied section, the exact location of photographs a, b are marked with white boxes. (a,b) The activity of synthetic and antithetic normal faults with an ESE–WNW direction are marked. See the intrabasinal basement high or the synthetic scale with 2 cm to 30 cm displacement. Light green line in the upper stratigraphic outcropped level shows the end of the tectonic activity during sedimentation. Star shows the axis plain.
Figure 7.
On the top and in the general view of the studied section, the exact location of photographs (a,b) are marked with white boxes. (a,b) In two different locations, a detachment surface produced a huge block and giant slide (yellow line), up to 5 m thick. The giant slide moved at least 0.9 m to the west. Star shows the axis plain.
Figure 8.
On the top and in the general view of the studied section, the exact location of the photograph is marked with a white box. There is a channel geometry body, with a N–S direction and erosional base, filled up with recent fluvial deposits, showing that measured faults are still active. Star shows the axis plain.
Figure 9.
Modified from Google Earth, a map in which the major faults (red dashed lines) were added, and the different depositional conditions of the studied samples are shown with different pin colors. The red pins show shallow water conditions and the green pins deep water conditions according to microfacies analysis of the studied thin sections. Additionally, for a cross-section A-A’, with a WNW–ESE direction, two proposed conditions, (a) during the rift stage and (b) during the compressional regime, were introduced.
| Disclaimer/Publisher’s Note: The statements, opinions and data contained in all publications are solely those of the individual author(s) and contributor(s) and not of MDPI and/or the editor(s). MDPI and/or the editor(s) disclaim responsibility for any injury to people or property resulting from any ideas, methods, instructions or products referred to in the content. |
© 2023 by the authors. Licensee MDPI, Basel, Switzerland. This article is an open access article distributed under the terms and conditions of the Creative Commons Attribution (CC BY) license (https://creativecommons.org/licenses/by/4.0/).


 ,
, 


