Assessment of Chimpanzee Nest Detectability in Drone-Acquired Images
by
 ,
,
Noémie Bonnin
1,*, 
Alexander C. Van Andel
2,
Jeffrey T. Kerby
3,
Alex K. Piel
1,
Lilian Pintea
4 and
Serge A. Wich
1,5 
1
School of Natural Sciences and Psychology, Liverpool John Moores University, Liverpool L3 3AF, UK
2
IUCN National Committee of The Netherlands, 1018 DD Amsterdam, The Netherlands
3
Neukom Institute for Computational Science, Dartmouth College, Hanover, NH 03755, USA
4
Conservation Science Department, the Jane Goodall Institute, 1595 Spring Hill Road, Suite 550, Vienna, VA 22182, USA
5
Institute for Biodiversity and Ecosystem Dynamics, University of Amsterdam, Science Park 904, 1098 XH Amsterdam, The Netherlands
*
Author to whom correspondence should be addressed.
Drones 2018, 2(2), 17; https://doi.org/10.3390/drones2020017
Submission received: 6 March 2018
/
Revised: 12 April 2018
/
Accepted: 18 April 2018
/
Published: 23 April 2018
(This article belongs to the Special Issue Drones for Biodiversity Conservation and Ecological Monitoring)
Abstract
:As with other species of great apes, chimpanzee numbers have declined over the past decades. Proper conservation of the remaining chimpanzees requires accurate and frequent data on their distribution and density. In Tanzania, 75% of the chimpanzees live at low densities on land outside national parks and little is known about their distribution, density, behavior or ecology. Given the sheer scale of chimpanzee distribution across western Tanzania (>20,000 km2), we need new methods that are time and cost efficient while providing precise and accurate data across broad spatial scales. Scientists have recently demonstrated the usefulness of drones for detecting wildlife, including apes. Whilst direct observation of chimpanzees is unlikely given their elusiveness, we investigated the potential of drones to detect chimpanzee nests in the Issa valley, western Tanzania. Between 2015 and 2016, we tested and compared the capabilities of two fixed-wing drones. We surveyed twenty-two plots (50 × 500 m) in gallery forests and miombo woodlands to compare nest observations from the ground with those from the air. We performed mixed-effects logistic regression models to evaluate the impact of image resolution, seasonality, vegetation type, nest height and color on nest detectability. An average of 10% of the nests spotted from the ground were detected from the air. From the factors tested, only image resolution significantly influenced nest detectability in drone-acquired images. We discuss the potential, but also the limitations, of this technology for determining chimpanzee distribution and density and to provide guidance for future investigations on the use of drones for ape population surveys. Combining traditional and novel technological methods of surveying allows more accurate collection of data on animal distribution and habitat connectivity that has important implications for ape conservation in an increasingly anthropogenically-disturbed landscape.
1. Introduction
As with other great ape species, chimpanzee numbers have declined over the past decades and the species is currently threatened by extinction [1]. Several studies have documented the impact of habitat loss [2,3,4], poaching [5,6,7] and infectious disease [8,9] on wild populations. In Tanzania, 75% of wild chimpanzees are found within a 20,000 km2 area of national parks [10,11,12,13,14,15]. Monitoring these chimpanzees is therefore crucial for their conservation in Tanzania. For conservation management, it is important to establish where and how many individuals remain and to understand the potential connectivity between populations. These data represent key information that is used towards creating baseline estimates for assessing the effectiveness of conservation efforts over time [16,17].
There are several established methods for studying and monitoring wild animal populations. Line transect surveys are widely used to estimate population density for a variety of mammal species, including great apes [18,19,20,21]. Data from direct observations of animals or indirect evidence such as dung [10], nests [22,23] and calls [24] can be converted into density and subsequently population estimates across larger landscapes [25]. Indirect evidence is especially important in great ape surveys given the elusive nature of the species and their extensive range and distribution [26].
Traditional land-based transects are time-consuming and expensive, and for these reasons geographically wide surveys are not repeated frequently [26]. Aerial surveys with light aircraft can be effective across broad areas for counting large mammals [27,28], but have limitations. While such surveys may provide an unbiased population size estimate for large mammals found in open areas (e.g., elephants, buffalos, zebras), they are unlikely to provide accurate estimates for smaller species (e.g., black-backed jackal, bushbuck, vervet monkey) [29] or those that live in habitats with greater canopy cover. Furthermore, aircraft surveys are logistically difficult to implement due to their very high cost and the risk they pose to operators (i.e., aircraft crashes) [30]. Due to their increasing availability, high resolution satellite images have also been used to detect animals or their signs [31]. Although promising, this method is also unlikely to provide accurate estimates for small species and is hampered by cost and atmospheric interference from clouds, especially problematic in the tropical regions where great apes are distributed [32]. Camera-traps and acoustic sensors are other promising remote technologies that enable broad spatiotemporal and precise information on animals that are elusive and otherwise difficult to study [33,34]. Nevertheless, these methods have high initial costs and still require intensive manual labor for deployment, memory card collection and substantial expertise in subsequent data analyses.
Recently, scientists have started to deploy drones—remotely operated aircraft with autonomous flight capabilities—for wildlife monitoring [35,36,37]. This application allows for rapid and frequent monitoring across moderate to broad spatial extents while providing high-resolution spatial data. Several studies have now reported successful animal detection using drone-derived aerial imagery, ranging from birds [36,38] to large terrestrial [39,40] and marine [41,42,43,44] mammals. Recent studies on using drones to detect indirect signs of animals have also reported promising results in detecting orangutan [45] as well as chimpanzee [46] nests.
Given the extent of the area in need of monitoring, exploring drone applications for chimpanzee population surveys in Tanzania may reduce cost and time investments. Visibility bias (i.e., failure to detect all animals within a sampled area) is a primary source of error in aerial surveys [27,29,47]. Prior to the widespread deployment of drones for a census, it is important to first evaluate bias in the method (i.e., calculate a correction factor) by comparing the resulting detections with traditional ground survey results. Numerous factors can impact the detectability of a direct or indirect sign of wildlife [25,48]. Thus, it is critical to determine what affects chimpanzee nest detectability in drone-acquired images. In the current study, we assessed several factors known to affect target detectability in aerial images: image resolution [39,49]; canopy cover and vegetation type [29,39,46,50]; and target size and color [29,42].
In summary, our objectives were to (1) evaluate drone performance for chimpanzee nest surveys by comparing ground and aerial surveys; and (2) assess the factors that influence detectability from drone data. Based on the results of previous studies, we hypothesized that using a higher resolution camera as well as flying at a lower altitude would increase the nest detection probability. We also expected a higher detection probability during the leaf-off season and in the more open miombo woodland vegetation than the closed riverine forest. Finally, we predicted that nests higher in the canopy and with a color that contrasts with their surroundings will be easier to detect.
2. Materials and Methods
2.1. Study Site
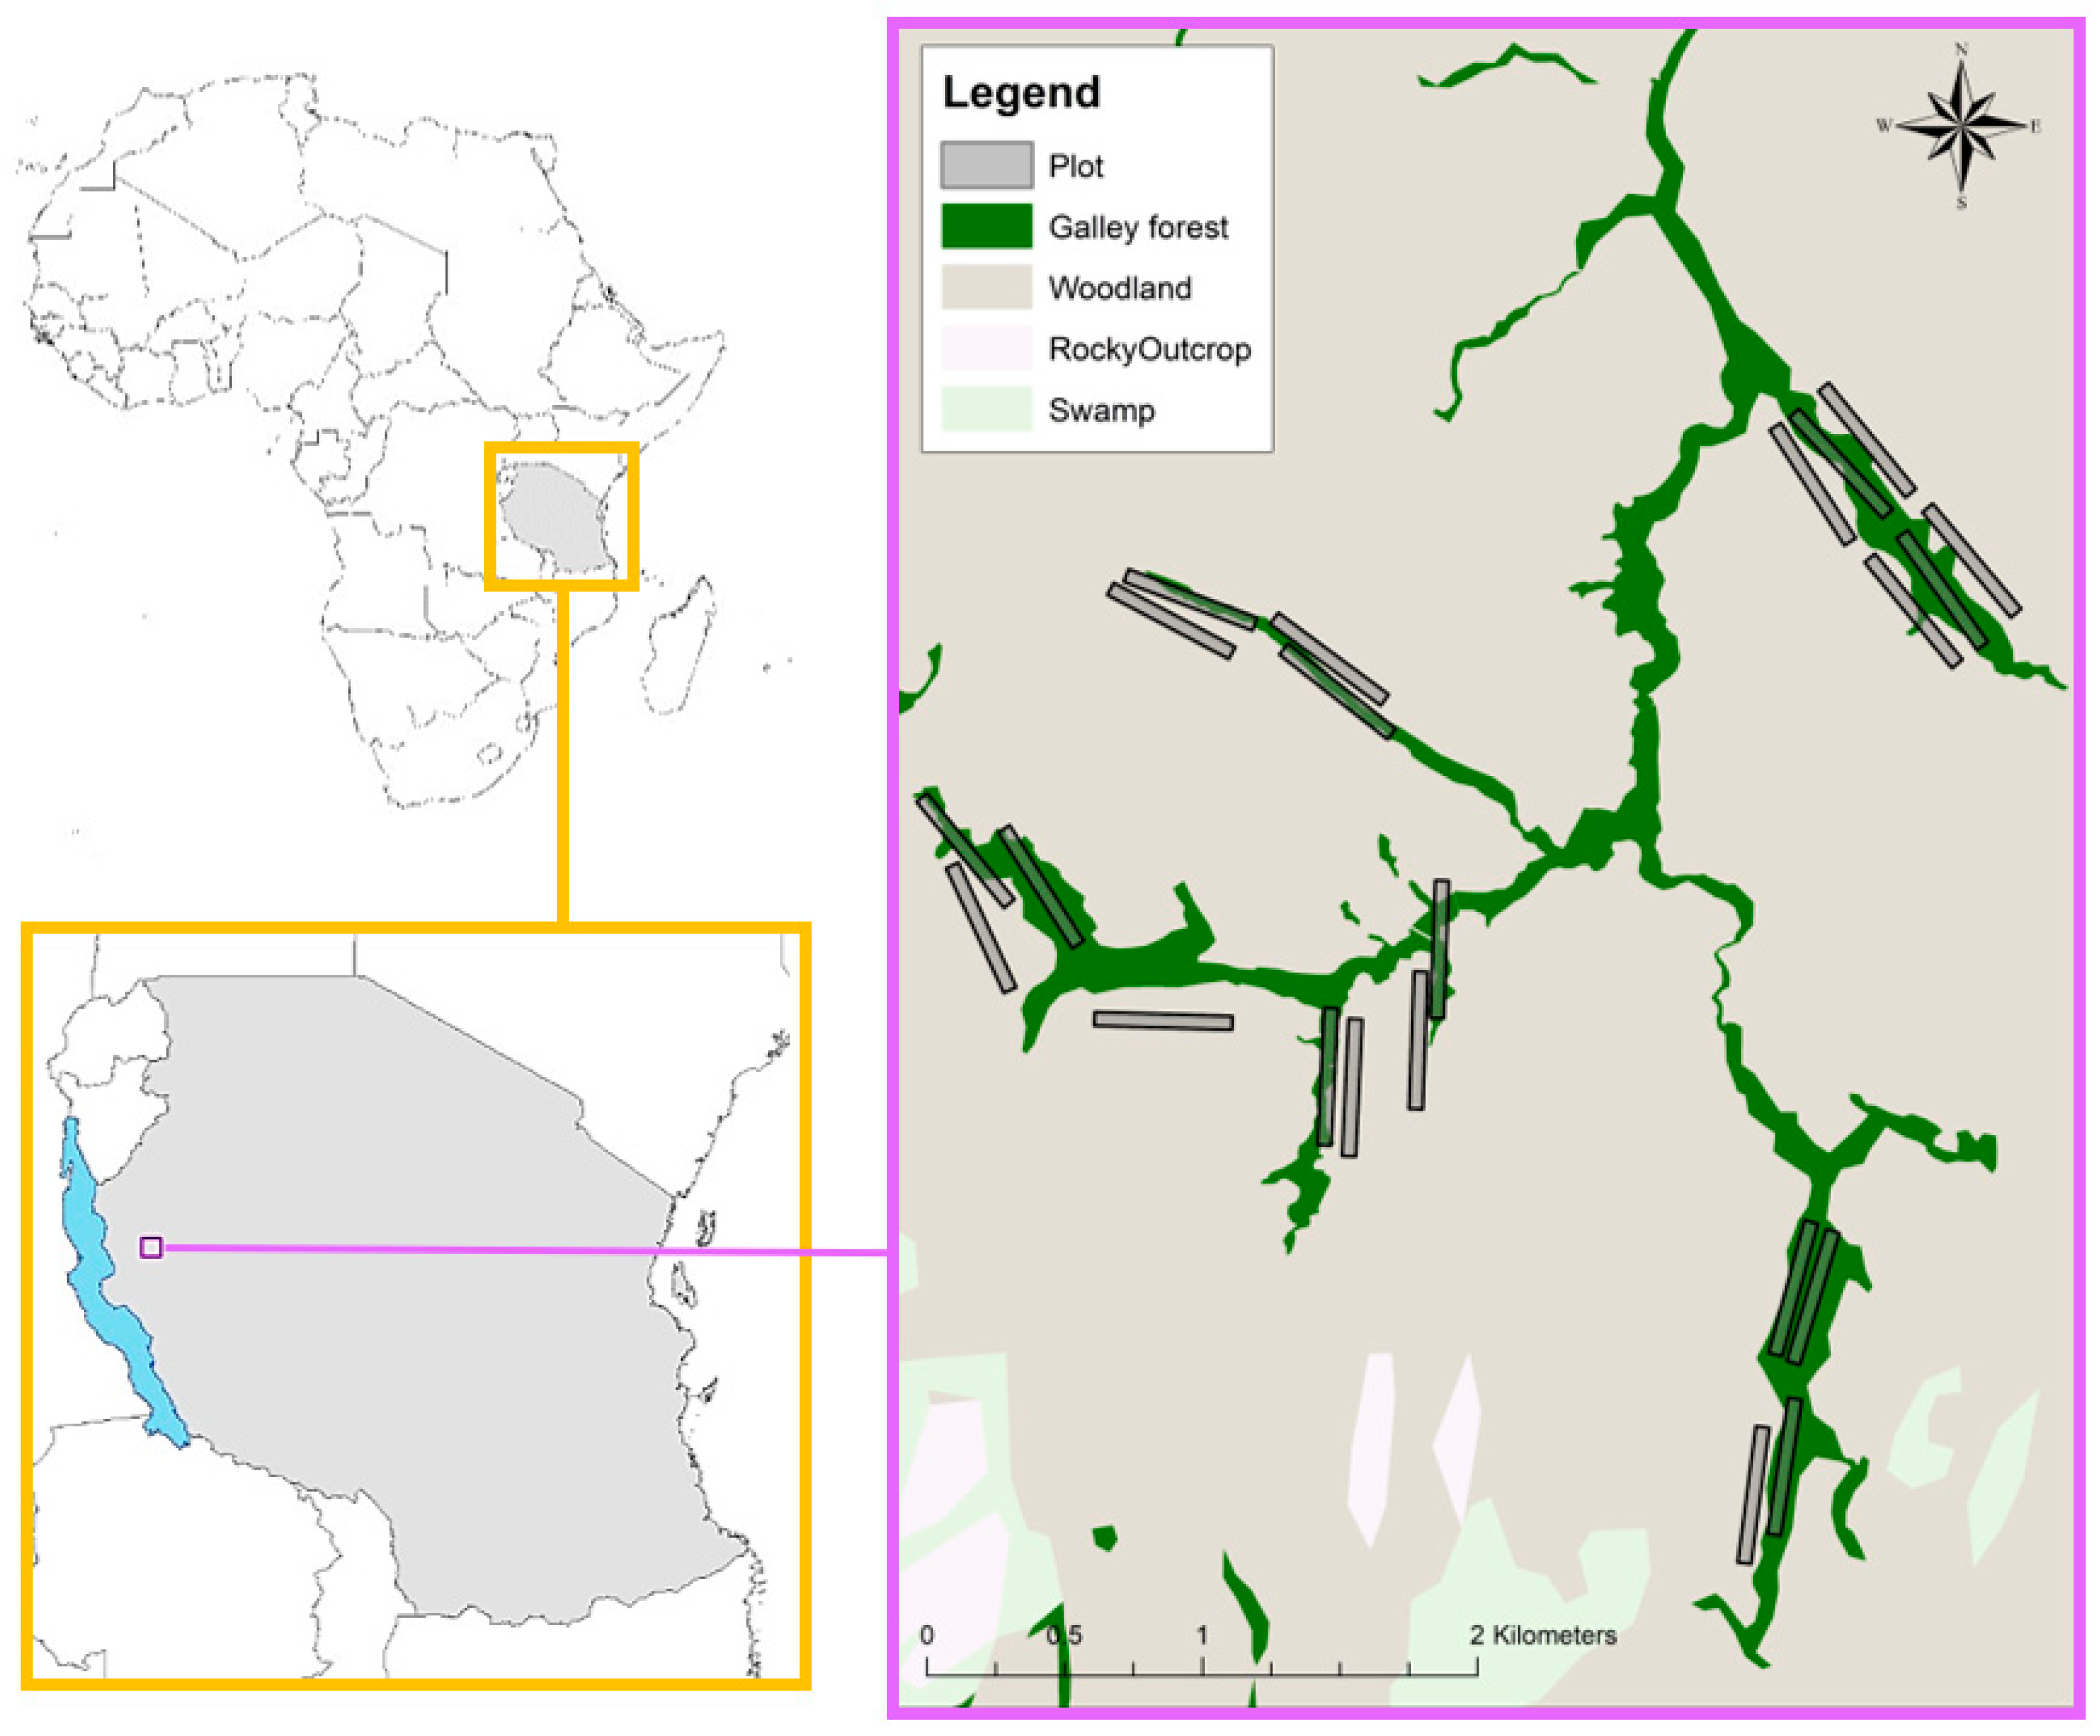
The study was conducted in May 2015 and September 2016 (beginning and end of dry seasons, respectively) in the Issa Valley, western Tanzania (Figure 1 and Figure 2). The area is characterized by a landscape mosaic, dominated by miombo woodland (named for the dominant tree genera of Brachystegia and Julbernardia) interspersed with grasslands, swamps and gallery forest restricted to steep ravines. Open vegetation (e.g., miombo woodland, grassland and swamps) represents more than 90% of the 85 km2 study area (Piel et al., unpublished data; Figure 1). The region is one of the driest, most open and seasonally extreme habitats in which chimpanzees live [51], with annual temperatures ranging from 11 °C to 35 °C and a dry season (<100 mm of rainfall) lasting from May to October.
2.2. Ground Surveys
To collect chimpanzee nest data from the ground for comparison with drone observations, we created 22 plots, each 50 × 500 m, stratified equally across gallery forest and miombo woodland (Figure 1). Within each plot, two experienced observers walked slowly and recorded the GPS location of all observed chimpanzee nests. Only one inspection per plot was performed. During the 2015 survey, data were collected using the open data kit [52] on NEXUS 7 tablets with an average accuracy of 15 m. In 2016, we used the global navigation satellite system (GNSS) Mobile Mapper 20 (MM20, http://www.spectraprecision.com), allowing us to collect data with a <1 m accuracy. For each nest, we collected additional data, including nest height from ground (estimated to the nearest meter), vegetation type (open or closed) and the nest color (green or brown).
2.3. Aerial Surveys
For the aerial surveys, we used two drone models paired with two different cameras (Figure 3).
Pairing A: The ConservationDrones.org X5 (Skywalker X5 frame; hobbyking.com [similar to HBS FX61]) equipped with a GPS-enabled Canon S100 camera (resolution: 4000 × 3000 pixels; sensor size: 7.6 × 5.7 mm) operating a CHDK firmware modification.
Pairing B: The more stable HBS Skywalker 100 km Long Range Fix Wings drone (Skywalker 2013 body 1880 mm; hobbyking.com) fitted with a Sony RX100M2 (resolution: 5472 × 3648 pixels; sensor size: 13.2 × 8.8 mm). Both were equipped with an autopilot system based on the ‘ArduPilot Mega’ (APM), which includes a computer processor, GPS, data logger, pressure and temperature sensor, airspeed sensor, triple-axis gyro, and accelerometer. Cameras were triggered automatically based on a predefined flight plan to produce at least 60% front- and side-overlap among images. Missions were planned using the open-source software APM Mission Planner (http://planner.ardupilot.com/) on a standard Windows-based laptop. Once we completed the missions, we geotagged the images from the Sony camera using the same software. Geotagging was not necessary for the Canon images as the camera was GPS-equipped.
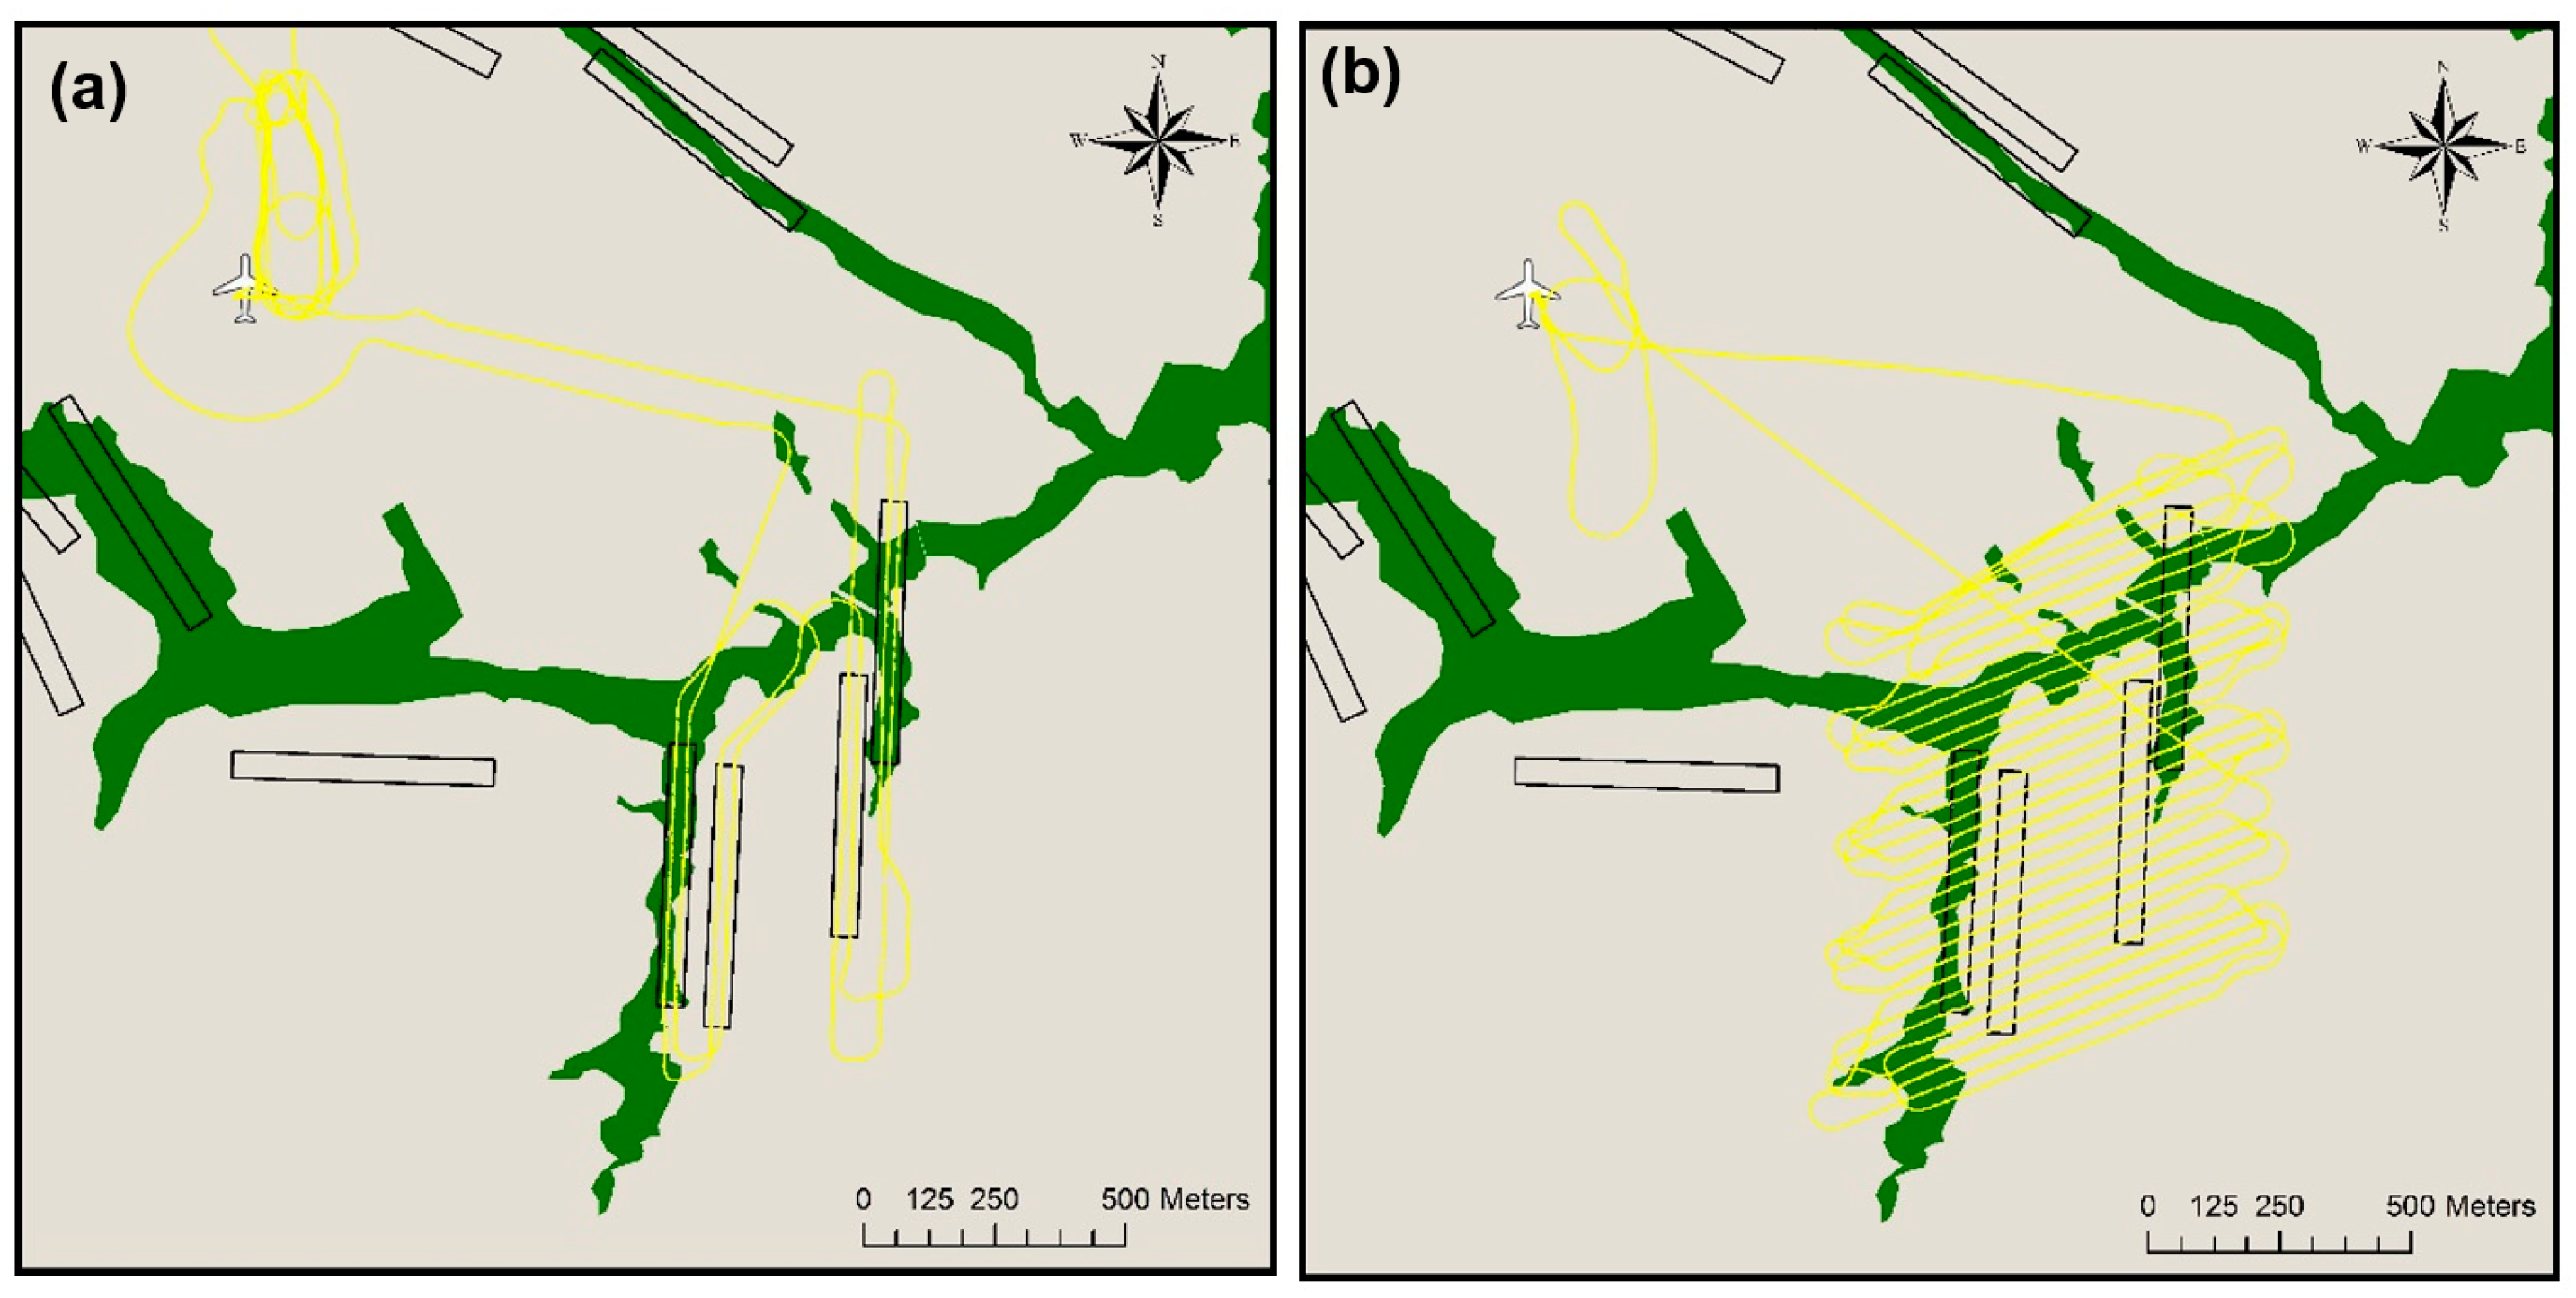
The drones performed two types of missions: straight line transects and grid missions (Figure 4).
Line transects: Straight line missions covering the areas within the ground plots at an average altitude of 90 m above ground level (AGL). We investigated aerial images obtained during these missions for the presence of chimpanzee nests.
Grid missions: Grid pattern missions flown at an average altitude of 120 m above ground level with extensive overlap (>60%) between flight legs to allow for the creation of orthomosaics. We produced orthomosaics using the geotagged images in Pix4D mapper (https://pix4d.com, version 4.0.25). Although ground control points (GCPs) were set up in each area for both years, the GCPs from 2015 could not be localized in the aerial images. The resulting accuracy of the orthomosaics was that of the Canon S100 camera GPS (average accuracy of 5 m). Improved GCPs were set up in 2016 allowing a georeferencing accuracy within a meter. We used the orthomosaics for the subsequent spatial relocation of aerial observations made while interpreting the photos from the nest counting missions.
2.4. Nest Detection
One observer (NB) examined the 1227 images resulting from the transect missions falling within the plots. Images were imported into the WiMUAS software [53] and investigated for the presence of nests. The aerial observation location was subsequently exported to a georeferenced shapefile. Because the resulting file was accurate to within 50 m, each aerial observation was relocated using the orthomosaics. Due to the 15 m inaccuracy of the 2015 ground data, a buffer of 15 m was created around each nest and if an aerial observation was recorded within this 15 m radius that was considered an aerial nest detection.
2.5. Analyses
All statistical analyses were conducted in the R studio (version 1.0.136).
2.5.1. Performance of the Aerial Detection
We calculated recall and false alarm rates to estimate the performance of nest detection using drone imagery [54]. Recall is the percentage of successful detection (i.e., the proportion of nests observed from the ground detected during the aerial survey in relation to the total number of nests observed from the ground). The false alarm rate is the proportion of false detections (the number of aerial observations not aligning with nests found from the ground by the total number aerial observations). Because the data were not normally distributed, we used non-parametric statistics. A Wilcoxon-signed rank test was applied to compare the number of nests per plot found on the ground and on the aerial drone survey. We further ran a Spearman rank correlation to test for associations between the number of nests per plot across the two survey methods.
2.5.2. Factors Influencing Detectability
We used three generalized linear models (GLM) with a binomial error structure and logit-link function to evaluate which factors (drone/camera pairing, season, vegetation type, nest age, nest height and flight altitude above ground level (AGL)) influenced the recall rate and the false alarm rate. The models were fitted using the GLM function from the lme4 package [55]. We fitted all terms of interest and tested significance via likelihood ratio tests to determine which factors resulted in a significant reduction in explanatory power when removed [56].
Factors influencing the recall rate: For the first model, the recall rate was fitted following the method from Lopez-Bao [57]. The number of nest detection successes vs. number of failures by plot (modelled as 1 = success and 0 = failure) was fitted as the dependent variable. Drone/camera pairing (Pairing A or Pairing B), season (May 2015 or September 2016) and vegetation type (open or closed) were each fitted as two-level fixed effects. As it was not possible to test the influence of all variables in this model (e.g., nest color and nest height required a perfect individual nest match between the ground and aerial survey), we fitted a second model. This second model included only the data from the 2016 survey, for which aerial observations could be more accurately matched to individual nests found on the ground. We fitted the nest detection event (not detected = 0, detected = 1) as the dependent variable. Vegetation type (open vs. closed) and nest color (green or brown) were each fitted as the two-level fixed effect and flight altitude AGL and nest height were fitted as covariates. We determined flight altitude AGL by subtracting the elevation (extracted from a Shuttle Radar Topographic Mission (SRTM) layer—30 m resolution; http://earthexplorer.usgs.gov) from the flight altitude above mean sea level (extracted from the geotagged images) at each recorded nest location.
Factors influencing the false alarm rate: In the last model, the false detection event (true detection = 0, false detection = 1) was fitted as dependent variable. Drone/camera pairing (Pairing A or Pairing B), season (May 2015 or September 2016) and vegetation type (open or closed) were each fitted as two-level fixed effects and flight altitude AGL was fitted as a covariate.
3. Results
3.1. Performance of the Aerial Detection
Considering both survey seasons (May 2015 and September 2016) and the results from both drone/camera pairings (pairing A and pairing B), we documented 667 chimpanzee nests from the ground (Supplementary Figure S1) and 112 from aerial observations (Figure 5; Supplementary Figure S2). Of these aerial observations, 64 fell within the 15 m radius of a nest that had been spotted from the ground and were considered to be nests, representing a 9.6% recall rate and 42.8% false alarm rate. Although the image analysis resulted in significantly fewer nest records per plot compared to what the ground teams documented (Wilcoxon- signed rank test: v = 981; p < 0.001; n = 47), the number of nests detected from aerial survey imagery showed a significantly positive correlation with those recorded on the ground per plot (Spearman’s ρ = 0.53; p < 0.001, n = 47).
3.2. Factors Influencing Detectability
3.2.1. Factors Influencing the Recall Rate
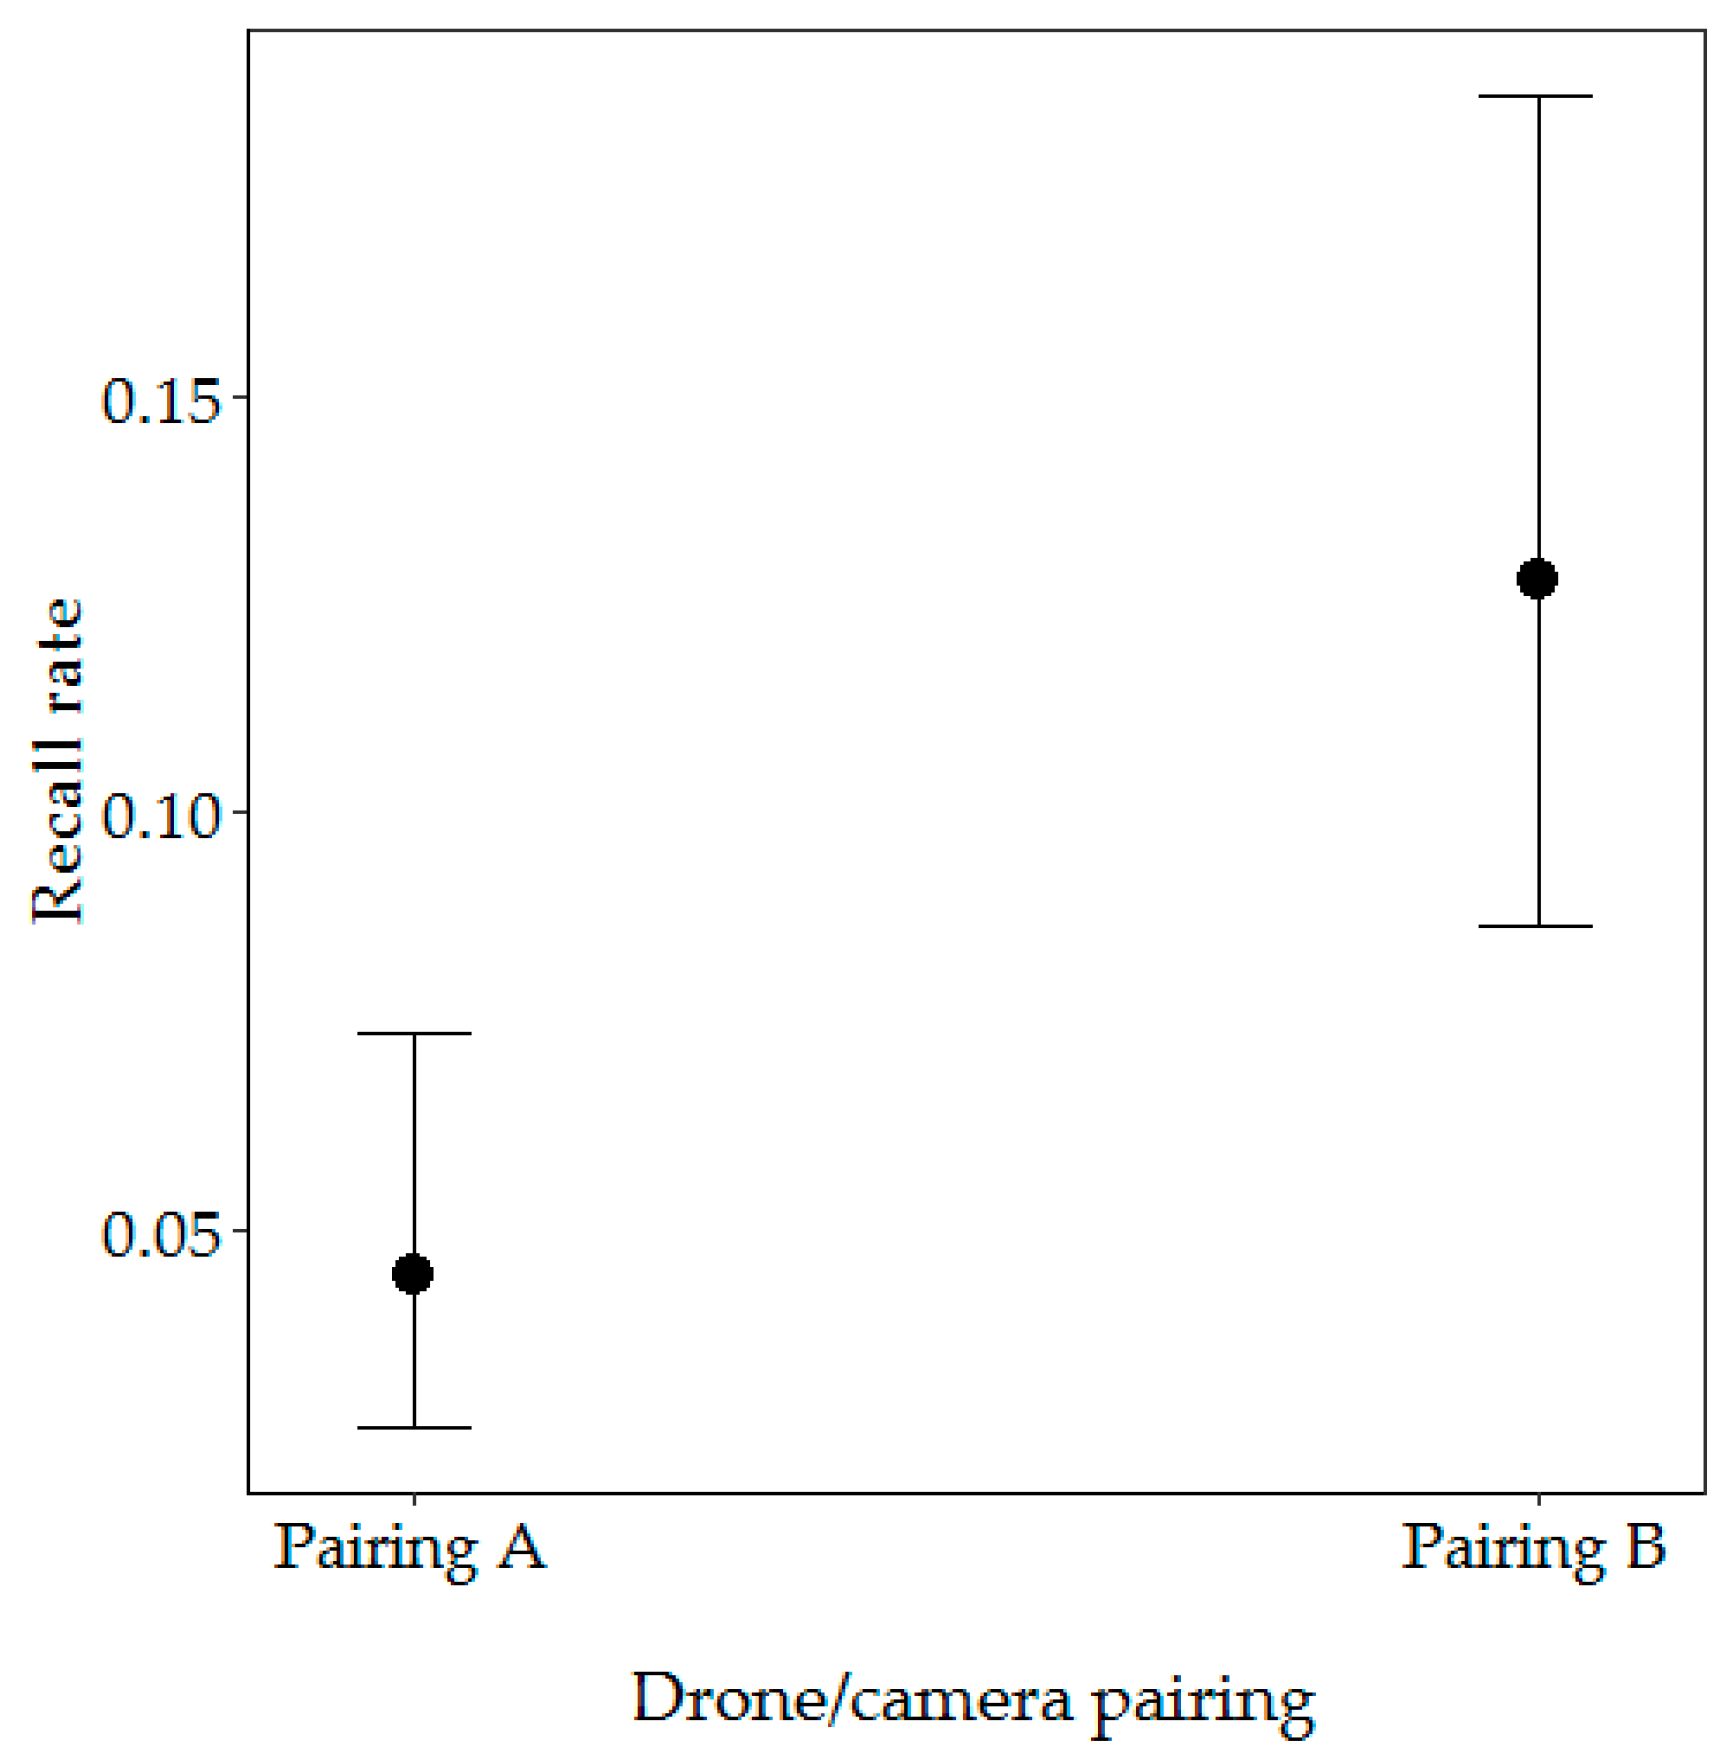
Our first model included drone/camera pairing and season and vegetation type. From these variables, only drone/camera pairing significantly influenced the recall rate (likelihood ratio test: X2 = −10.96, p < 0.001), with the highest probability of nest detection with Pairing B (12.81% probability) (Figure 6). There was no significant difference in the recall rate between open and closed vegetation types (likelihood ratio test: X2 = 93.1, df = 41, p = 0.747) or between the beginning and end of the dry season (likelihood ratio test: X2 = 93, df = 43, p = 0.551) (Table 1).
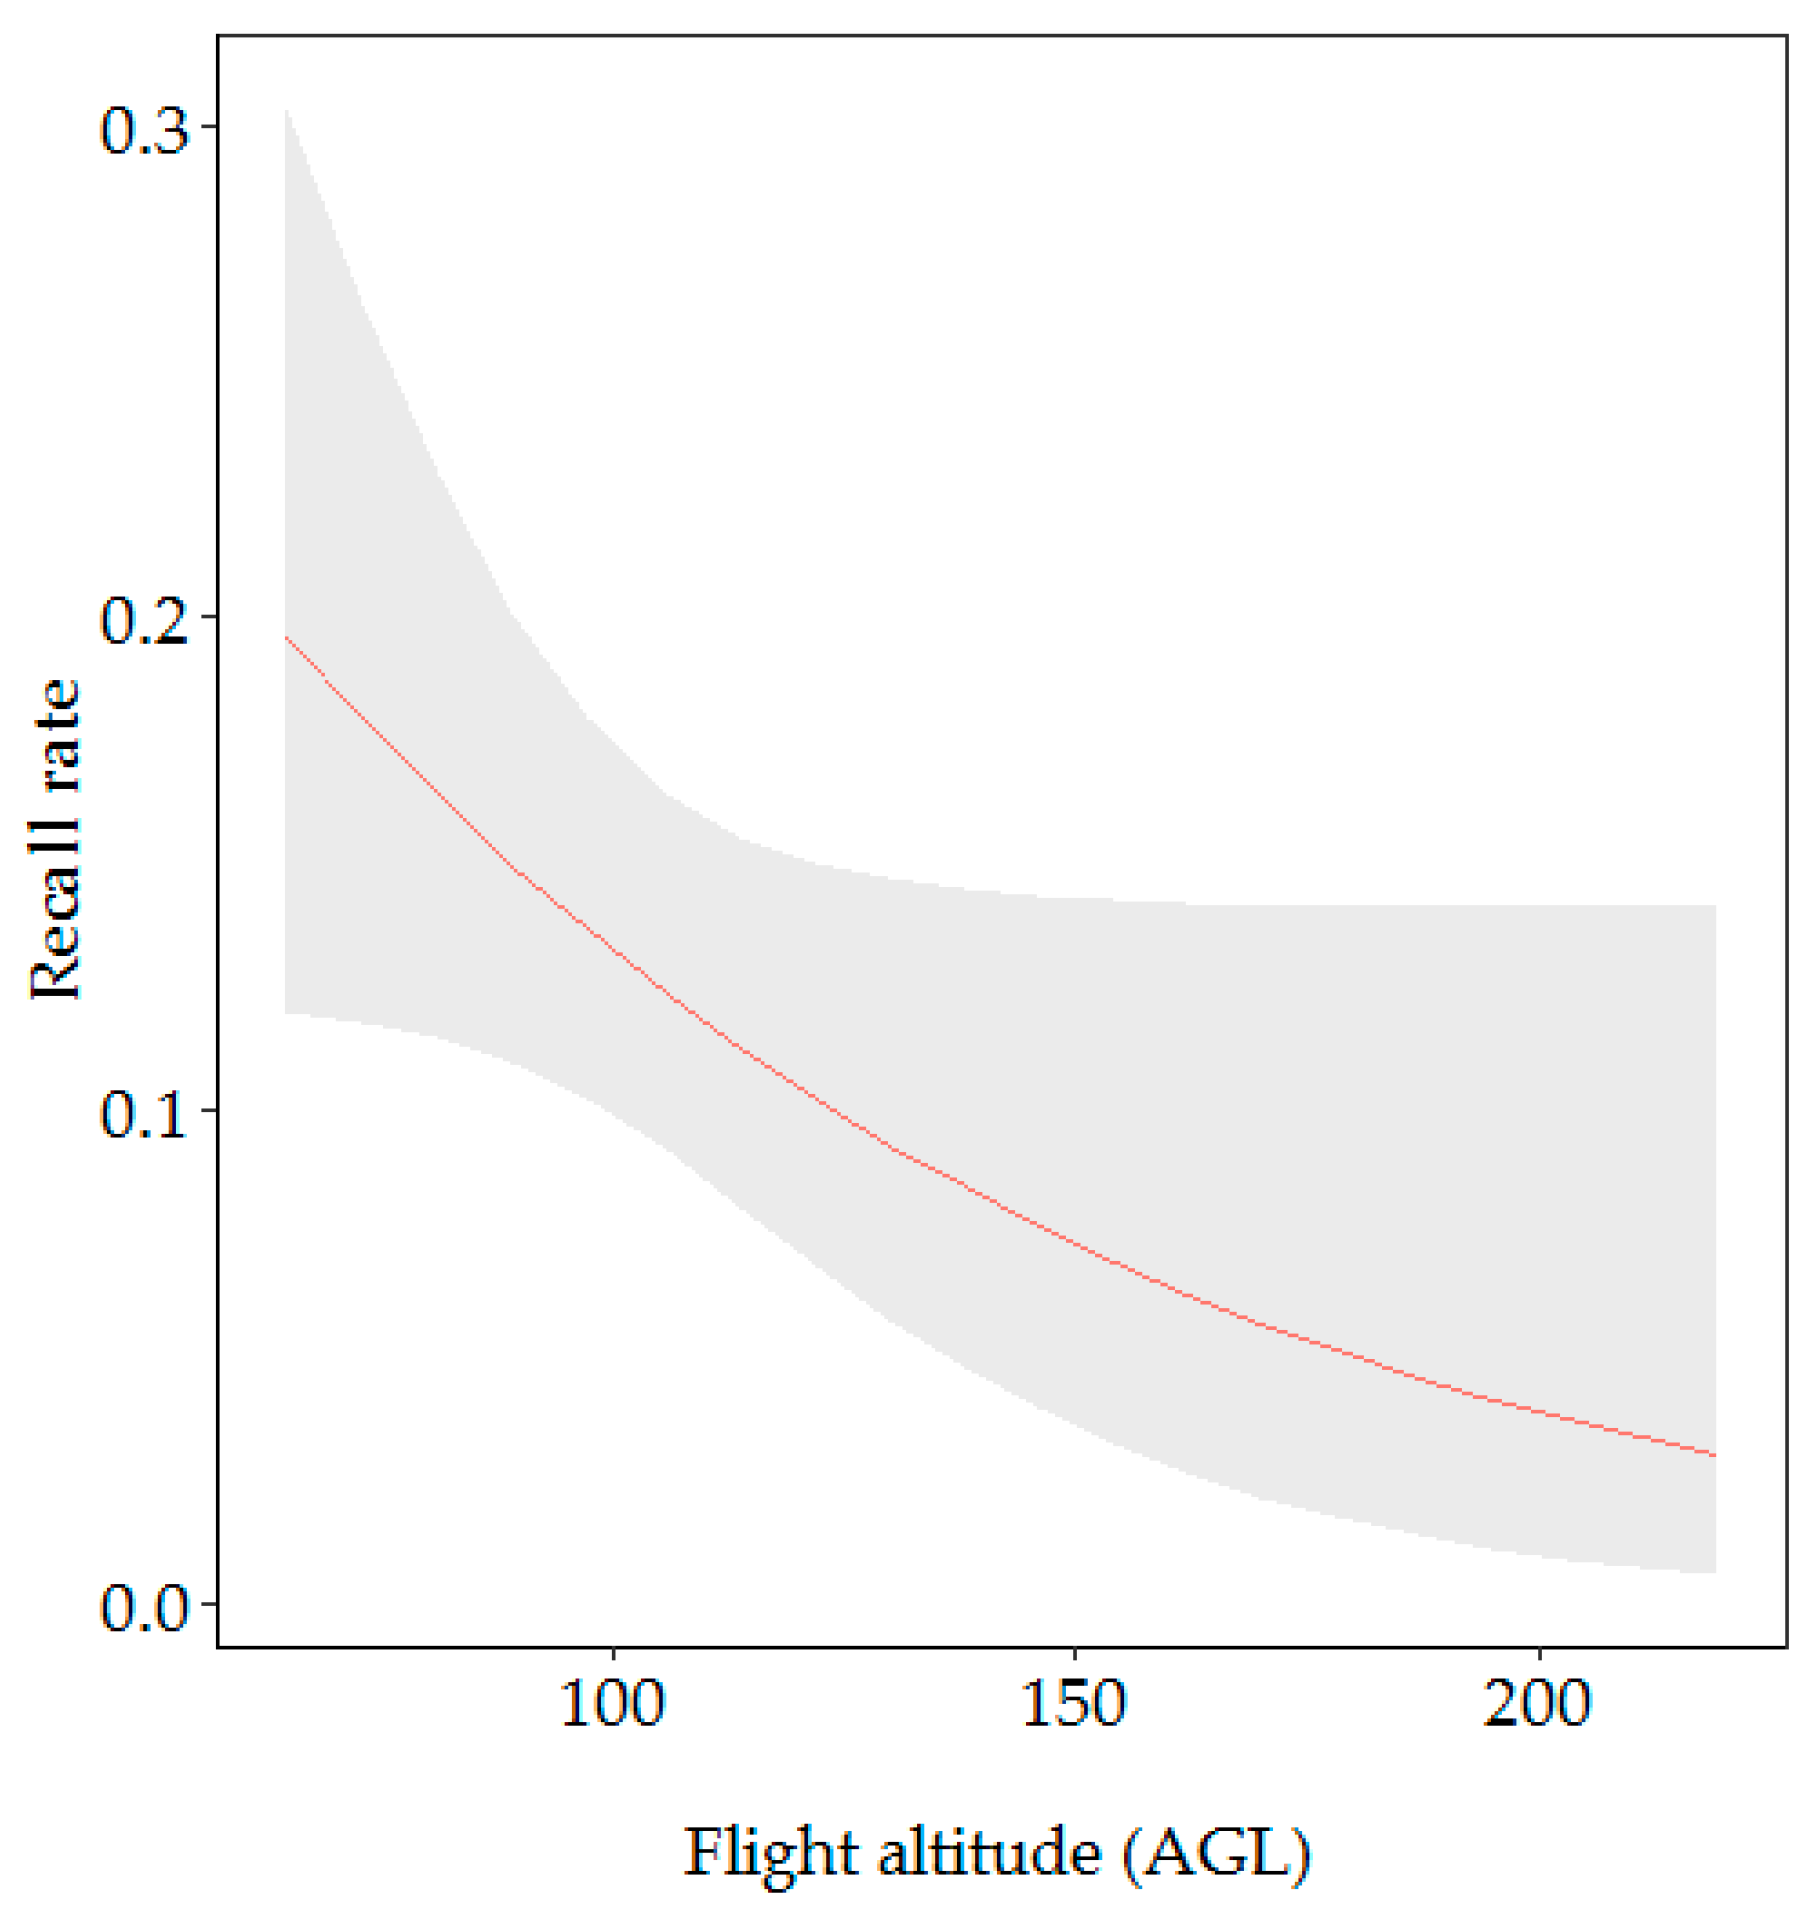
Our second model (for 2016 data only) included flight altitude, nest height and vegetation type. We decided to remove nest color from our second model as of the 337 nests recorded by the ground survey team in 2016, only one was green. The recall rate differed significantly across flight altitude AGL (likelihood ratio test: X2 = 4.35, p < 0.05), with nests more likely to be detected when flying at a lower altitude (19.58% probability) (Figure 7). We found a trend towards higher detectability in closed rather than open vegetation (likelihood ratio test: X2 = 2.79, p < 0.1) (Table 2). There was no significant difference in nest detection depending on nest height within the tree (likelihood ratio test: X2 = 0.07, p = 0.789).
3.2.2. Factors Influencing the False Alarm Rate
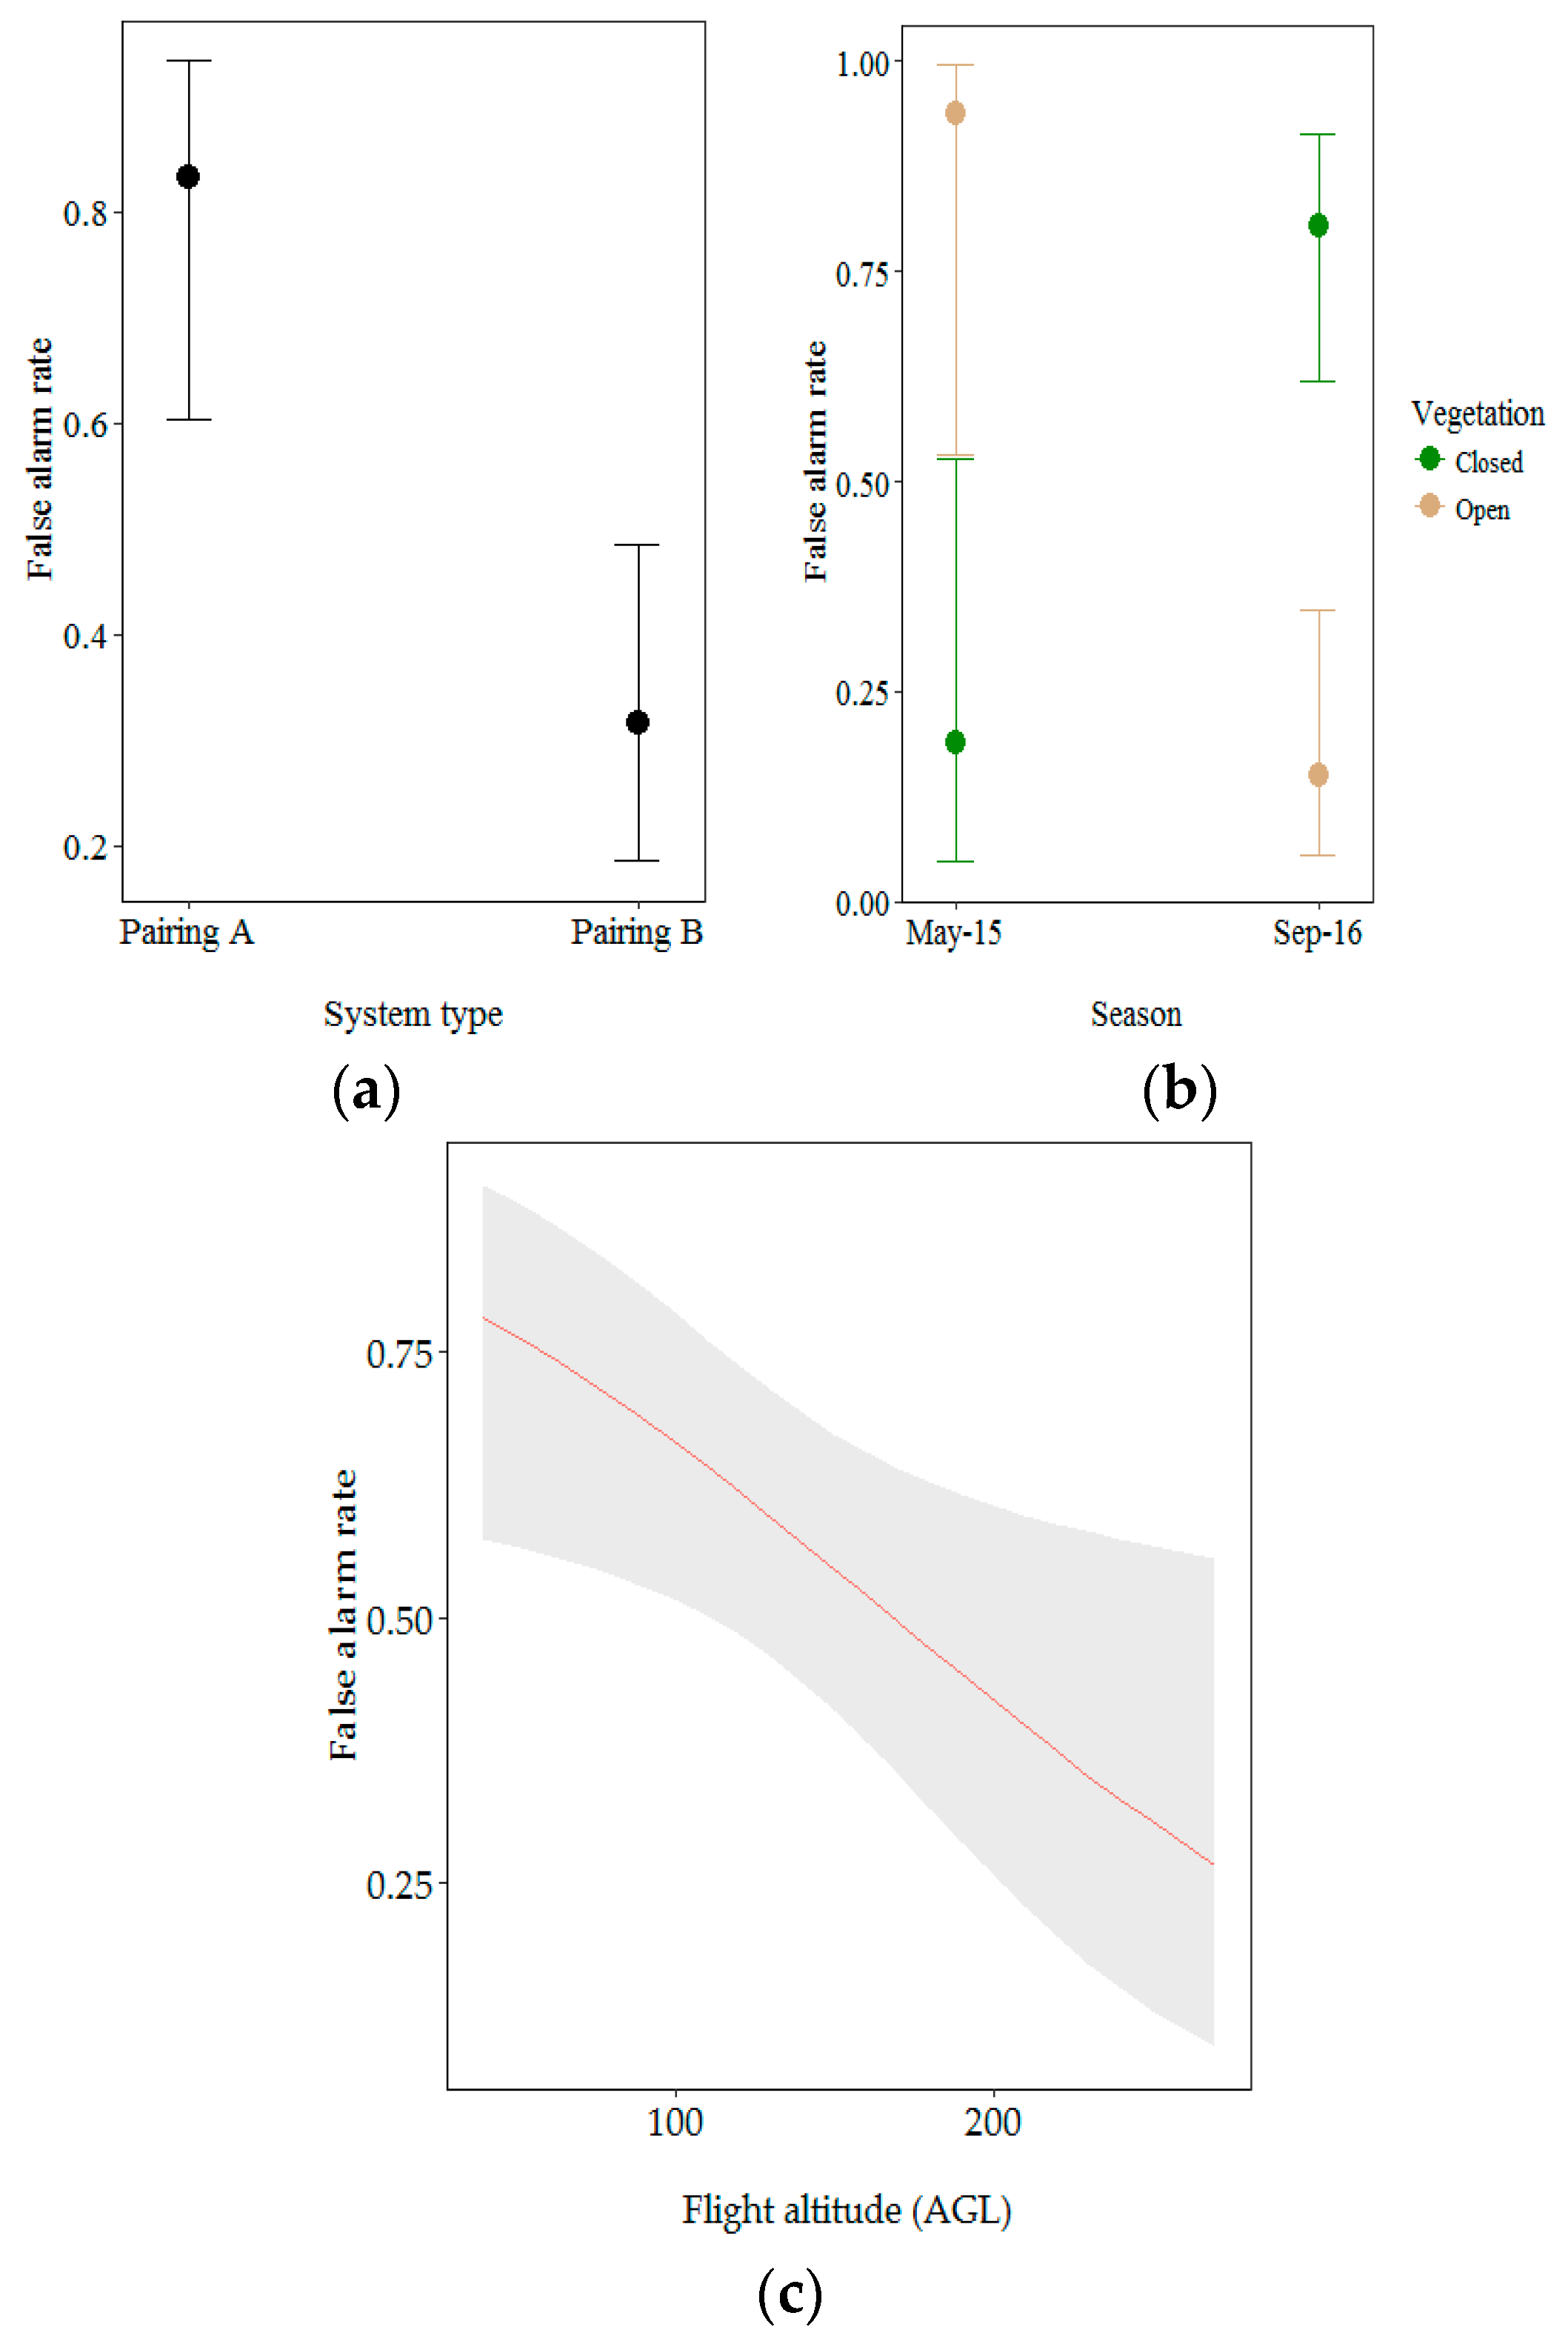
For this model, we investigated the influence of drone/camera pairing, season, vegetation type and flight altitude AGL on the false alarm rate. Drone/camera pairing, vegetation type and flight altitude AGL significantly influenced the false alarm rate (Table 3). Aerial observations from Pairing A were more likely to be false positives (0.83% probability). The overall false alarm rate was higher in closed vegetation than in open vegetation but significantly differed between seasons (likelihood ratio test: X2 = 4.01, p < 0.05). Aerial observations made at the beginning of the dry season (May 2015) were more likely to be false positives when recorded in open vegetation (0.94% probability opposed to 0.19% probability for closed vegetation). The false alarm rate significantly increased at lower altitude (likelihood ratio test: X2 = 9.55, p < 0.05) (Figure 8).
4. Discussion
We investigated the feasibility of using drones to detect chimpanzee nests in the Issa Valley, western Tanzania, and evaluated the influence of image resolution, seasonality, vegetation type, nest height and color on nest detectability. An average of 10% of the nests observed from the ground were detected from the air, with improved nest detection in imagery with higher spatial resolution. Our overall detection rate was lower than that previously reported for chimpanzee nests in Gabon (39.9%) [46] and orangutan nests in Indonesia (17.4%) [45]. This discrepancy is likely due to methodological differences and our systematic approach. In their study, van Andel et al. [46] used two approaches that biased the probability of detection. In the first, they collected nest data first via ground surveys and then used the location of the recorded nests to confirm their presence in drone images. In the second, nests were first detected on drone images and then confirmed on the ground using the location of the aerial observations. These methods effectively demonstrated that it was indeed possible to detect chimpanzee nests from drones, although these specific approaches resulted in an increased probability of detecting a nest in the drone images for the first approach and on the ground for the second approach. Wich et al. [45] used a buffer of 25 m around nests recorded on the ground to select which nest detected from the air would be included in the analyses, comparing the relative density of nests from the aerial and ground-based surveys. The smaller 15 m buffer used in our study could be associated with our smaller detection rate, i.e., we were more conservative regarding what constituted a match. Moreover, aerial nest surveys may be more efficient for orangutan nests as they tend to build nests higher in the tree canopy and visual contrasts of nest materials and canopy color are seemingly more apparent in these habitats [58,59].
Of the factors hypothesized to influence the probability of chimpanzee nest detection in drone-derived aerial imagery, only image resolution was identified as having a significant influence on the recall rate, with a higher probability of nest detection associated with the higher-resolution camera at a lower flight altitude AGL. This finding is consistent with that of Mulero-Pázmány et al. [39], who also found that the targets (i.e., rhinoceros, people acting as poachers) were better detected with a lower-flying drone. Our results are also consistent with those of Dulava et al. [49], who reported a significant negative relation between ground sampling distance (GSD) and correct waterbird identification with a minimum of 5 mm GSD. In our study, we favored flight altitude AGL above GSD as a measure of resolution because of identical camera parameters, however, the two are conceptually interchangeable. We obtained the highest probability of nest detection at the lowest possible flight altitude (AGL: 65 m), corresponding to 1.4 cm GSD. Flying at lower altitude would have threatened drone safety. These findings reflect the inherent trade-offs between monitoring at a high spatial resolution (grain) versus across broad spatial extents, such as ground sampling distance (GSD) and ground sampling area (GSA), scale inversely with one another. This highlights the importance of the a priori identification of the minimum GSD required to detect ground targets from the air during the survey design period, particularly if planning for extensive area surveys where the balance between GSD and GSA should be optimized.
Contrary to expectations, we did not find a significant influence of nest height on aerial nest detection. Nests constructed higher in trees are expected to be more visible from the air, however, the visibility also depends on the height of the tree (i.e., a nest at 15 m will be more visible in a tree of 15 m height than in a tree of 20 m). The inclusion of tree height into models will be important in subsequent analyses.
Another surprising result of our study was the lack of influence of canopy cover and vegetation type, with no significant differences between the probability of nest detection in the leaf-off season and the “greener season” as well as between the more open miombo woodland vegetation and the closed, riverine forest. Even more surprising, the probability of nest detection tended to be higher in closed rather than in open vegetation. This finding contradicts numerous other studies that demonstrated a significant improvement of target detection from drone imagery in more open habitats (e.g., [29,39,46,50,60]). A possible explanation for this might be the difficulty of detecting brown nests against a similarly colored background, in this case the less continuous and more earth-toned colors of the Miombo woodland and the grassland mosaic. Light body color has been demonstrated to negatively influence animal detection during aerial surveys in a conservation area of northern Tanzania (e.g., dark Ostrich (Struthio camelus) better detected than light Grant’s gazelle (Nanger granti)) [29]. The results from Chabot and Bird [61] further support the importance of contrast in target detection. In their investigation into the use drones to survey flocks of geese they reported a poor detection of low-contrast Canada Geese (Branta canadensis) but good aerial survey performance for the high-contrast Snow Geese (Chen caerulescens) resulting in more efficient aerial count compared to ground count (60% higher). We were unable to test the role of contrast in our study due to an insufficient sample of recent (green) nests.
Findings from the analysis of the factors influencing false alarm rates support this hypothesis. Different vegetation types significantly affected the false alarm rate depending on the season. The false alarm rate was higher in miombo woodland at the beginning of the dry season. The canopy cover in miombo woodland is much higher during this period than at the end of the dry season. At the beginning of the dry season, the miombo woodland reflects a mosaic of green leaves and a brown understory, leading to potential misinterpretation of aerial data. At the end of the dry season, however, reflection is mostly from the brown understory, making nest detection more difficult but more accurate. As only Paring A was flown in both seasons, we acknowledge that technological factors may play a role in these seasonal effects, however we strongly believe future studies will benefit from considering and further exploring the effects of seasonal canopy differences on nest detection.
The limitations on the use of drones to survey chimpanzees are threefold. Firstly, only a small proportion of chimpanzee nests are detectable from the air. Most chimpanzee nests are built in the middle of the tree crown [62] making them undetectable from above the tree canopy [46]. Chimpanzees also exhibit ground night nesting [63], which would also be difficult to detect from aerial surveys. Secondly, the high proportion of false alarm rate highlighted in this study is problematic. The false alarm rate is an important parameter that must be taken into consideration when assessing new wildlife survey methods, as it may lead to an overestimation of the population density [29]. However, the false alarm rate has not been described in previous studies investigating the use of drones to detect great ape nests. In this study, we reported a 42.8% false alarm rate. These aerial observations, for which the location did not align with any of the nests spotted from the ground, can be explained in two ways: (1) These could be nests visible from the air, but not the ground, as would be the case of nests high in the canopy that might be obscured from ground teams by the mid-canopy. Van Schaik et al. [64] noted that nests can go undetected during ground surveys, resulting in an underestimation of ape densities; (2) alternatively, false positives could represent dead leaves or canopy gaps revealing the brown understory that was mistaken for nests. This uncertainty represents an important problem in the deployment of drones to assess chimpanzee presence/density, especially in a new area where little information is available. We argue here that whilst aerial imagery offers an improvement in spatial coverage and data collection time and frequency, this approach still requires complimentary validation from ground surveys. Finally, the time associated with analyzing thousands of images to identify nests represents an additional key limitation to using drones in this context.
The limitations we discussed above are significant but not prohibitive, and the findings from our study provide guidance for future investigation on the use of drones for ape population surveys. Firstly, it is important to generate high spatial resolution images and lower GSD, providing greater details and significantly increasing the probability of nest detection. For our survey, we decided to use fixed-wing drone models allowing longer flights that can cover larger areas. Because of the mountainous terrain, flying at lower altitude was not possible. Most chimpanzees do not live across mountainous terrain, therefore this problem would not affect large parts of their range. Multirotor drones have smaller flight time capacities but can fly at lower altitudes [65]. This technology is improving rapidly (e.g., drone design optimization allowing longer flight time [66,67]), which could make multirotors a viable option in the future. Meanwhile, camera resolution is improving, which will allow future studies to obtain higher resolution images from fixed wing surveys. Reliable detection also requires a high contrast background. During both our survey seasons, the brown understory made nest identification difficult. We therefore recommend conducting future surveys during seasons with green vegetation on the ground to contrast otherwise brown nests. We acknowledge that this context might reduce the probability of detecting fresh green nests, however, given their low abundance, their non-detectability is less likely to impact chimpanzee density estimations. Multispectral sensors may help address this problem. Widely used for landcover classification and vegetation monitoring [68,69,70,71,72,73] this technology uses green, red, red-edge and near infrared wavebands to capture detail not available to standard RGB cameras. Green vegetation materials are characterized by high reflectance in the near infra-red (NIR) domain (outside of the spectral range of human vision); a multispectral camera can provide useful contrast to discriminate between live and dead vegetation. Furthermore, it would be interesting to assess the potential of oblique aerial images. This perspective may offer better glimpses through foliage and more intuitively interpretable representations of the targets. Another step would be to assess the potential of 3D mapping of the canopy surface for nest detection. 3D models can now be created using point clouds from drone imagery [74] providing better perspectives for visual interpretation of the data. Another complimentary approach would be to use light detection and ranging (LiDAR) technology. Recently developed at sizes suitable for drone payloads [75], this remote sensing technique offers new insights beyond simple top of canopy structure that may help nest detectability algorithms. For example, these technologies could be used to better establish the habitat characteristics of trees holding nests. These data could be used in computer vision algorithms [76,77,78,79] to refine automatic nest detection, possibly reducing the false alarm rate. A recent study on using a drone to detect eagle nests reported 75% nest detection using a semi-automated method [80]. Similar to the difficulties encountered with chimpanzee nest detection, eagle nests are found in highly heterogeneous environments with many features that resemble nests, at small scale (~1–2 m), and with variable nest size, shape and context. This result is promising for broader nest detection applications, including those of great apes.
Given the shy and elusive nature of great apes, direct surveys are rarely feasible. Researchers thus must rely on indirect signs to estimate population density. However, to convert nest counts into ape density, the nest decay rate and nest production rate are required. These factors are highly dependent on apes species and environmental characteristics, and therefore require extensive study [26]. Recent studies have now shown the potential of thermal cameras mounted on drones for animal detection [39,76,81]. However, this approach would require extensive spatial coverage and further research is required to assess whether apes could be detected using a thermal camera mounted on a drone.
5. Conclusions
The design and execution of great ape surveys are crucial to allocating conservation efforts to where they are most needed, but face many logistical challenges, particularly when they must be implemented across broad areas. Drone surveys could be a revolutionary method, allowing rapid and frequent monitoring in remote and poorly-understood areas, with data accessible immediately and containing a rich variety of information about habitat and other conservation revelation conditions. The limitations we discussed above are meaningful but not prohibitive, and the rapid pace of technological improvement suggests many promising solutions in a near future. Assessing the potential of drones to detect chimpanzee nests has major implications, not only for chimpanzee monitoring across Tanzania, but also for all great apes monitoring. This technology could be applied to survey extensive areas filling problematic gaps in our current understanding of ape distribution and abundance [82], providing key information for conservationists.
Supplementary Materials
The following are available online at https://www.mdpi.com/2504-446X/2/2/17/s1, Figure S1: Locations of nests observed from the ground, Figure S2: Aerial observations (true positives and false positives) recorded from drone surveys.
Acknowledgments
We thank the Tanzanian Wildlife Research Institute (TAWIRI) and Commission for Science and Technology (COSTECH) for permission to carry out research in Tanzania. This work was supported by Tuungane/The Nature Conservancy, the Jane Goodall Institute (JGI) with additional support through the USAID and NASA’s Ecological Forecasting for Conservation and Natural Resource Management program and National Geographic. Special thanks to DigitalGlobe and Esri for inkind contribution and support with satellite imagery and GIS software. We are also extremely grateful to Mashaka Alimas, Jonas Bukende, Adrienne Chitayat, Patrick Hassan, Mlela Juma, Shedrack Lucas, Msigwa Rashid, Godfrey Stephano, Eden Wondra and Elizabeth Yarwood for field assistance. We thank Keeyen Pang from Hornbillsurveys for building the drones and his support. Many thanks to James Waterman for his statistical advice. Finally, thank you to Anne-Sophie Crunchant, Camille Guiliano and Ineke Knot for their valuable feedback on the manuscript.
Author Contributions
S.A.W., A.K.P., A.C.V.A. and J.T.K. conceived and designed the study; N.B., J.T.K. and A.C.V.A. collected the data; N.B. analyzed the data; N.B. wrote the manuscript with editorial contributions from S.A.W., A.K.P., J.T.K. and A.C.V.A.
Conflicts of Interest
The authors declare no conflict of interest.
References
- International Union for Conservation of Nature (IUCN). The IUCN Red List of Threatened Species. Version 2017-2. 2017. Available online: http://www.iucnredlist.org (accessed on 21 September 2017).
- Campbell, G.; Kuehl, H.; N’Goran Kouamé, P.; Boesch, C. Alarming decline of West African chimpanzees in Côte d’Ivoire. Curr. Biol. 2008, 18, 903–904. [Google Scholar] [CrossRef] [PubMed]
- Junker, J.; Blake, S.; Boesch, C.; Campbell, G.; du Toit, L.; Duvall, C.; Ekobo, A.; Etoga, G.; Galat-Luong, A.; Gamys, J.; et al. Recent decline in suitable environmental conditions for African great apes. Divers. Distrib. 2012, 18, 1077–1091. [Google Scholar] [CrossRef]
- Wich, S.A.; Garcia-Ulloa, J.; Kühl, H.S.; Humle, T.; Lee, J.S.H.; Koh, L.P. Will oil palm’s homecoming spell doom for Africa’s great apes? Curr. Biol. 2014, 24, 1659–1663. [Google Scholar] [CrossRef] [PubMed]
- Bowen-Jones, E.; Pendry, S. The threat to primates and other mammals from the bushmeat trade in Africa, and how this threat could be diminished. Oryx 1999, 33, 233–246. [Google Scholar] [CrossRef]
- McLennan, M.R.; Hyeroba, D.; Asiimwe, C.; Reynolds, V.; Wallis, J. Chimpanzees in mantraps: lethal crop protection and conservation in Uganda. Oryx 2012, 46, 598–603. [Google Scholar] [CrossRef]
- Piel, A.K.; Lenoel, A.; Johnson, C.; Stewart, F.A. Deterring poaching in western Tanzania: The presence of wildlife researchers. Glob. Ecol. Conserv. 2015, 3, 188–199. [Google Scholar] [CrossRef]
- Walsh, P.D.; Abernethy, K.A.; Bermejo, M.; Beyers, R.; De Wachter, P.; Akou, M.E.; Huijbregts, B.; Mambounga, D.I.; Toham, A.K.; Kilbourn, A.M.; et al. Catastrophic ape decline in western equatorial Africa. Nature 2003, 422, 611–614. [Google Scholar] [CrossRef] [PubMed]
- Rudicell, R.S.; Holland Jones, J.; Wroblewski, E.E.; Learn, G.H.; Li, Y.; Robertson, J.D.; Greengrass, E.; Grossmann, F.; Kamenya, S.; Pintea, L.; et al. Impact of simian immunodeficiency virus infection on chimpanzee population dynamics. PLoS Pathog. 2010, 6, e1001116. [Google Scholar] [CrossRef] [PubMed]
- Moore, D.L.; Vigilant, L. A population estimate of chimpanzees (Pan troglodytes schweinfurthii) in the Ugalla region using standard and spatially explicit genetic capture—recapture methods. Am. J. Primatol. 2013. [Google Scholar] [CrossRef] [PubMed]
- Plumptre, A.J.; Rose, R.; Nangendo, G.; Williamson, E.A.; Didier, K.; Hart, J.; Mulindahabi, F.; Hicks, C.; Griffin, B.; Ogawa, H.; et al. Eastern Chimpanzee (Pan troglodytes schweinfurthii) Status Survey and Conservation Action Plan 2010–2020; International Union for Conservation of Nature (IUCN): Gland, Switzerland, 2010. [Google Scholar]
- Piel, A.K.; Stewart, F.A. Census and Conservation Status of Chimpanzees (Pan troglodytes schweinfurthii) Across the Greater Mahale Ecosystem; The Nature Conservancy: Arlington, VA, USA, 2014; 74p. [Google Scholar]
- Kano, T.; Ogawa, H.; Asato, R.; Kanamori, M. Distribution and density of wild chimpanzees on the northwestern bank of the Malagarasi River, Tanzania. Primate Res. 1999, 15, 153–162. [Google Scholar] [CrossRef]
- Ogawa, H.; Yoshikawa, M.; Mbalamwezi, M. A Chimpanzee bed found at Tubila, 20 km from Lilanshimba habitat. Pan Africa News 2011, 18, 5–6. [Google Scholar] [CrossRef] [Green Version]
- Zamma, K.; Inoue, E. On the chimpanzees of Kakungu, Karobwa and Ntakata. Pan Africa News 2004, 11, 8–10. [Google Scholar] [CrossRef] [Green Version]
- Plumptre, A.J.; Cox, D. Counting primates for conservation: Primate surveys in Uganda. Primates 2006, 47, 65–73. [Google Scholar] [CrossRef] [PubMed]
- Nichols, J.D.; Williams, B.K. Monitoring for conservation. Trends Ecol. Evol. 2006, 21, 668–673. [Google Scholar] [CrossRef] [PubMed]
- Silveira, L.; Jácomo, A.T.A; Diniz-Filho, J.A.F. Camera trap, line transect census and track surveys: A comparative evaluation. Biol. Conserv. 2003, 114, 351–355. [Google Scholar] [CrossRef]
- Piel, A.K.; Cohen, N.; Kamenya, S.; Ndimuligo, S.A.; Pintea, L.; Stewart, F.A. Population status of chimpanzees in the Masito-Ugalla Ecosystem, Tanzania. Am. J. Primatol. 2015, 77, 1027–1035. [Google Scholar] [CrossRef] [PubMed]
- Wich, S.A.; Singleton, I.; Nowak, M.G.; Utami Atmoko, S.S.; Nisam, G.; Arif, S.M.; Putra, R.H.; Ardi, R.; Fredriksson, G.; Usher, G.; et al. Land-cover changes predict steep declines for the Sumatran orangutan (Pongo abelii). Sci. Adv. 2016, 2, e1500789. [Google Scholar] [CrossRef] [PubMed]
- Stokes, E.J.; Strindberg, S.; Bakabana, P.C.; Elkan, P.W.; Iyenguet, F.C.; Madzoké, B.; Malanda, G.A.F.; Mowawa, B.S.; Moukoumbou, C.; Ouakabadio, F.K.; et al. Monitoring great ape and elephant abundance at large spatial scales: Measuring effectiveness of a conservation landscape. PLoS ONE 2010, 5, e10294. [Google Scholar] [CrossRef] [PubMed]
- Kouakou, C.Y.; Boesch, C.; Kuehl, H. Estimating chimpanzee population size with nest counts: Validating methods in Ta? National Park. Am. J. Primatol. 2009, 71, 447–457. [Google Scholar] [CrossRef] [PubMed]
- Spehar, S.N.; Mathewson, P.D.; Nuzuar; Wich, S.A.; Marshall, A.J.; Kühl, H.; Nardiyono; Meijaard, E. Estimating orangutan densities using the standing crop and marked nest count methods: Lessons learned for conservation. Biotropica 2010, 42, 748–757. [Google Scholar] [CrossRef]
- Kidney, D.; Rawson, B.M.; Borchers, D.L.; Stevenson, B.C.; Marques, T.A.; Thomas, L. An efficient acoustic density estimation method with human detectors applied to gibbons in Cambodia. PLoS ONE 2016, 11, e155066. [Google Scholar] [CrossRef] [PubMed] [Green Version]
- Buckland, S.T.; Anderson, D.R.; Burnham, K.P.; Laake, J.L.; Borchers, D.L.; Thomas, L. Introduction to Distance Sampling: Estimating Abundance of Biological Populations; Oxford University Press: Oxford, UK, 2001. [Google Scholar]
- Kühl, H.; Maisels, F.; Ancrenaz, M.; Williamson, E.A. Best Practice Guidelines for Surveys and Monitoring of Great Ape Populations; International Union for Conservation of Nature (IUCN): Gland, Switzerland, 2009. [Google Scholar]
- Jachmann, H. Comparison of aerial counts with ground counts for large African herbivores. J. Appl. Ecol. 2002, 39, 841–852. [Google Scholar] [CrossRef]
- Kirkman, S.P.; Yemane, D.; Oosthuizen, W.H.; Meÿer, M.A.; Kotze, P.G.H.; Skrypzeck, H.; Vaz Velho, F.; Underhill, L.G. Spatio-temporal shifts of the dynamic Cape fur seal population in Southern Africa, based on aerial censuses (1972–2009). Mar. Mammal Sci. 2013, 29, 497–524. [Google Scholar] [CrossRef]
- Greene, K.; Bell, D.; Kioko, J.; Kiffner, C. Performance of ground-based and aerial survey methods for monitoring wildlife assemblages in a conservation area of northern Tanzania. Eur. J. Wildl. Res. 2017, 63, 77. [Google Scholar] [CrossRef]
- Sasse, D.B. Job-related mortality of wildlife workers in the United States, 1937–2000. Wildl. Soc. Bull. 2003, 31, 1000–1003. [Google Scholar]
- Yang, Z.; Wang, T.; Skidmore, A.K.; De Leeuw, J.; Said, M.Y.; Freer, J. Spotting East African mammals in open savannah from space. PLoS ONE 2014, 9, e115989. [Google Scholar] [CrossRef] [PubMed]
- Hansen, M.C.; Roy, D.P.; Lindquist, E.; Adusei, B.; Justice, C.O.; Altstatt, A. A method for integrating MODIS and Landsat data for systematic monitoring of forest cover and change in the Congo Basin. Remote Sens. Environ. 2008, 112, 2495–2513. [Google Scholar] [CrossRef]
- Rowcliffe, J.M.; Carbone, C. Surveys using camera traps: Are we looking to a brighter future? Anim. Conserv. 2008, 11, 185–186. [Google Scholar] [CrossRef]
- Blumstein, D.T.; Mennill, D.J.; Clemins, P.; Girod, L.; Yao, K.; Patricelli, G.; Deppe, J.L.; Krakauer, A.H.; Clark, C.; Cortopassi, K.A.; et al. Acoustic monitoring in terrestrial environments using microphone arrays: Applications, technological considerations and prospectus. J. Appl. Ecol. 2011, 48, 758–767. [Google Scholar] [CrossRef]
- Koh, L.P.; Wich, S.A. Dawn of drone ecology: low-cost autonomous aerial vehicles for conservation. Trop. Conserv. Sci. 2012, 5, 121–132. [Google Scholar] [CrossRef] [Green Version]
- Chabot, D.; Bird, D.M. Wildlife research and management methods in the 21st century: Where do unmanned aircraft fit in? J. Unmanned Veh. Syst. 2015, 3, 137–155. [Google Scholar] [CrossRef]
- Wich, S.A. Drones and conservation. In Drones and Aerial Observation: New Technologies for Property Rights, Human Rights, and Global Development. A Primer; Kakaes, K., Ed.; New America: Washington, DC, USA, 2015; pp. 63–71. [Google Scholar]
- Chabot, D.; Carignan, V.; Bird, D.M. Measuring habitat quality for least bitterns in a created wetland with use of a small unmanned aircraft. Wetlands 2014, 34, 527–533. [Google Scholar] [CrossRef]
- Mulero-Pázmány, M.; Stolper, R.; Van Essen, L.D.; Negro, J.J.; Sassen, T. Remotely piloted aircraft systems as a rhinoceros anti-poaching tool in Africa. PLoS ONE 2014, 9, e83873. [Google Scholar] [CrossRef] [PubMed]
- Vermeulen, C.; Lejeune, P.; Lisein, J.; Sawadogo, P.; Bouché, P. Unmanned aerial survey of elephants. PLoS ONE 2013, 8, e54700. [Google Scholar] [CrossRef] [PubMed]
- Hodgson, A.J.; Kelly, N.; Peel, D. Unmanned aerial vehicles (UAVs) for surveying Marine Fauna: A dugong case study. PLoS ONE 2013, 8, e79556. [Google Scholar] [CrossRef] [PubMed]
- Koski, W.R.; Allen, T.; Ireland, D.; Buck, G.; Smith, P.R.; Macrender, A.M.; Halick, M.A.; Rushing, C.; Sliwa, D.J.; McDonald, T.L. Evaluation of an unmanned airborne system for monitoring marine mammals. Aquat. Mamm. 2009, 35, 347–357. [Google Scholar] [CrossRef]
- Koski, W.R.; Gamage, G.; Davis, A.R.; Mathews, T.; LeBlanc, B.; Ferguson, S.H. Evaluation of UAS for photographic re-identification of bowhead whales, Balaena mysticetus. J. Unmanned Veh. Syst. 2015, 3, 22–29. [Google Scholar] [CrossRef]
- Hodgson, A.; Peel, D.; Kelly, N. Unmanned aerial vehicles for surveying marine fauna: Assessing detection probability. Ecol. Appl. 2017, 27, 1253–1267. [Google Scholar] [CrossRef] [PubMed]
- Wich, S.A.; Dellatore, D.; Houghton, M.; Ardi, R.; Koh, L.P. A preliminary assessment of using conservation drones for Sumatran orang-utan (Pongo abelii) distribution and density. J. Unmanned Veh. Syst. 2015, 4, 45–52. [Google Scholar] [CrossRef]
- Van Andel, A.C.; Wich, S.A.; Boesch, C.; Koh, L.P.; Robbins, M.M.; Kelly, J.; Kuehl, H.S. Locating chimpanzee nests and identifying fruiting trees with an unmanned aerial vehicle. Am. J. Primatol. 2015, 77, 1122–1134. [Google Scholar] [CrossRef] [PubMed]
- Pollock, K.H.; Kendall, W.L. Visibility bias in aerial surveys: A review of estimation procedures. J. Wildl. Manag. 1987, 51, 502–510. [Google Scholar] [CrossRef]
- Buckland, S.; Anderson, D.R.; Burnham, K.; Laake, J.; Borchers, D.; Thomas, L. Advanced Distance Sampling: Estimating Abundance of Biological Populations; Oxford University Press: Oxford, UK, 2004. [Google Scholar]
- Dulava, S.; Bean, W.T.; Richmond, O.M.W. Environmental reviews and case studies: Applications of unmanned aircraft systems (UAS) for waterbird surveys. Environ. Pract. 2015, 17, 201–210. [Google Scholar] [CrossRef]
- Patterson, C.; Koski, W.; Pace, P.; Mcluckie, B.; Bird, D.M. Evaluation of an unmanned aircraft system for detecting surrogate caribou targets in Labrador. J. Unmanned Veh. Syst. 2016, 4, 53–69. [Google Scholar] [CrossRef]
- Moore, J. Savanna chimpanzees. In Topics in Primatology, Vol.1 Human Origins; Nishida, T., McGrew, P., Marler, P., Pickford, M., de Waal, F., Eds.; University of Tokyo Press: Tokyo, Japan, 1992; pp. 99–118. [Google Scholar]
- Anokwa, Y.; Hartung, C.; Brunette, W.; Borriello, G.; Lerer, A. Open source data collection in the developing world. Computer 2009, 42. [Google Scholar] [CrossRef]
- Linchant, J.; Lhoest, S.; Quevauvillers, S.; Semeki, J.; Lejeune, P.; Vermeulen, C. WIMUAS: Developing a tool to review wildlife data from various UAS flight plans. Int. Arch. Photogramm. Remote Sens. Spat. Inf. Sci. ISPRS Arch. 2015, 40, 379–384. [Google Scholar] [CrossRef]
- Macmillan, N.A.; Creelman, C.D. Detection Theory: A User’s Guide; Laurence Erlbaum Associates Inc.: Mahwah, NJ, USA, 2005. [Google Scholar]
- Bates, D.; Maechler, M.; Bolker, B.; Walker, S. lme4: Linear mixed-effects models using Eigen and S4. R Package Version 2014, 1, 1–23. [Google Scholar]
- Crawley, M.J. The R Book; John Wiley & Sons, Ltd.: Hoboken, NJ, USA, 2017. [Google Scholar]
- López-Bao, J.V.; Rodríguez, A.; Palomares, F. Behavioural response of a trophic specialist, the Iberian lynx, to supplementary food: Patterns of food use and implications for conservation. Biol. Conserv. 2008, 141, 1857–1867. [Google Scholar] [CrossRef]
- Ancrenaz, M.; Gimenez, O.; Ambu, L.; Ancrenaz, K.; Andau, P.; Goossens, B.; Payne, J.; Sawang, A.; Tuuga, A.; Lackman-Ancrenaz, I. Aerial surveys give new estimates for orangutans in Sabah, Malaysia. PLoS Biol. 2005, 3, e30003. [Google Scholar] [CrossRef] [PubMed] [Green Version]
- van Casteren, A.; Sellers, W.I.; Thorpe, S.K.S.; Coward, S.; Crompton, R.H.; Myatt, J.P.; Ennos, A.R. Nest-building orangutans demonstrate engineering know-how to produce safe, comfortable beds. Proc. Natl. Acad. Sci. USA 2012, 109, 6873–6877. [Google Scholar] [CrossRef] [PubMed]
- Pearse, A.T.; Gerard, P.D.; Dinsmore, S.J.; Kaminski, R.M.; Reinecke, K.J. Estimation and correction of visibility bias in aerial surveys of wintering ducks. J. Wildl. Manag. 2008, 72, 808–813. [Google Scholar] [CrossRef]
- Chabot, D.; Bird, D.M. Evaluation of an off-the-shelf unmanned aircraft system for surveying flocks of geese. Waterbirds 2012, 35, 170–174. [Google Scholar] [CrossRef]
- Stewart, F.A. The Evolution of Shelter: Ecology and Ethology of Chimpanzee Nest Building; University of Cambridge: Cambridge, UK, 2011. [Google Scholar]
- Hicks, T.C. A Chimpanzee Mega-Culture? Exploring Behavioral Continuity in Pan Troglodytes Schweinfurthii Across Northern DR Congo. Ph.D. Dissertation, Universiteit Van Amsterdam, Amsterdam, The Netherland, 2010. [Google Scholar]
- Van Schaik, C.P.; Wich, S.A.; Utami, S.S.; Odom, K. A simple alternative to line transects of nests for estimating orangutan densities. Primates 2005, 46, 249–254. [Google Scholar] [CrossRef] [PubMed]
- Gonzalez, L.F.; Montes, G.A.; Puig, E.; Johnson, S.; Mengersen, K.; Gaston, K.J. Unmanned aerial vehicles (UAVs) and artificial intelligence revolutionizing wildlife monitoring and conservation. Sensors 2016, 16, 97. [Google Scholar] [CrossRef] [PubMed] [Green Version]
- Selby, W.; Corke, P.; Rus, D. Autonomous aerial navigation and tracking of marine animals. In Proceedings of the Australasian Conference on Robotics and Automation, Melbourne, Australia, 7–9 December 2011; pp. 1–7. [Google Scholar]
- Abd-Elrahman, A.; Pearlstine, L.; Percival, F. Development of pattern recognition algorithm for automatic bird. Surv. Land Inf. Sci. 2005, 65, 37. [Google Scholar]
- Hodgson, J.C.; Mott, R.; Baylis, S.M.; Pham, T.T.; Wotherspoon, S.; Kilpatrick, A.D.; Segaran, R.R.; Reid, I.; Terauds, A.; Koh, L.P. Drones count wildlife more accurately and precisely than humans. Methods Ecol. Evol. 2018, 1, 1–19. [Google Scholar] [CrossRef]
- Andrew, M.E.; Shephard, J.M. Semi-automated detection of eagle nests: An application of very high-resolution image data and advanced image analyses to wildlife surveys. Remote Sens. Ecol. Conserv. 2017, 3, 66–80. [Google Scholar] [CrossRef]
- Duffy, J.P.; Anderson, K. A 21st-century renaissance of kites as platforms for proximal sensing. Prog. Phys. Geogr. Earth Environ. 2016, 40, 352–361. [Google Scholar] [CrossRef]
- Du, T.; Schulz, A.; Csail, M.; Zhu, B.; Bickel, B.; Matusik, W. Computational multicopter design. ACM Trans. Graph. 2016, 35. [Google Scholar] [CrossRef]
- Magnussen, Ø.; Hovland, G.; Ottestad, M. Multicopter UAV design optimization. In Proceedings of the 2014 IEEE/ASME 10th International Conference on Mechatronic and Embedded Systems and Applications (MESA), Senigallia, Italy, 10–12 September 2014. [Google Scholar] [CrossRef]
- Berni, J.A.J.; Member, S.; Zarco-tejada, P.J.; Suárez, L.; Fereres, E. Thermal and narrowband multispectral remote sensing for vegetation monitoring from an unmanned aerial vehicle. IEEE Trans. Geosci. Remote Sens. 2009, 47, 722–738. [Google Scholar] [CrossRef] [Green Version]
- Gini, R.; Passoni, D.; Pinto, L.; Sona, G. Use of unmanned aerial systems for multispectral survey and tree classification: A test in a park area of northern Italy. Eur. J. Remote Sens. 2014, 47, 251–269. [Google Scholar] [CrossRef]
- Woll, C.; Prakash, A.; Sutton, T. A case-study of in-stream juvenile salmon habitat classification using decision-based fusion of multispectral aerial images. Appl. Remote Sens. 2011, 2, 37–46. [Google Scholar]
- Sugiura, R.; Noguchi, N.; Ishii, K. Remote-sensing technology for vegetation monitoring using an unmanned helicopter. Biosyst. Eng. 2005, 90, 369–379. [Google Scholar] [CrossRef]
- Arnold, T.; De Biasio, M.; Fritz, A.; Leitner, R. UAV-based measurement of vegetation indices for environmental monitoring. In Proceedings of the 2013 7th International Conference on Sensing Technology, ICST, Wellington, New Zealand, 3–5 December 2013; pp. 704–707. [Google Scholar]
- De Biasio, M.; Arnold, T.; Leitner, R.; McGunnigle, G.; Meester, R. UAV-based environmental monitoring using multi-spectral imaging. Proc. SPIE 2010, 766811. [Google Scholar] [CrossRef]
- Greenwood, F. How to make maps with drones. In Drones and Aerial Observation: New Technologies for Property Rights, Human Rights, and Global Development; New America: Washington, DC, USA, 2015; pp. 35–47. [Google Scholar]
- Wallace, L.; Lucieer, A.; Watson, C.; Turner, D. Development of a UAV-LiDAR system with application to forest inventory. Remote Sens. 2012, 4, 1519–1543. [Google Scholar] [CrossRef]
- Gooday, O.J.; Key, N.; Goldstien, S.; Zawar-Reza, P. An assessment of thermal-image acquisition with an unmanned aerial vehicle (UAV) for direct counts of coastal marine mammals ashore. J. Unmanned Veh. Syst. 2018. [Google Scholar] [CrossRef]
- Hicks, T.C.; Tranquilli, S.; Kuehl, H.; Campbell, G.; Swinkels, J.; Darby, L.; Boesch, C.; Hart, J.; Menken, S.B.J. Absence of evidence is not evidence of absence: Discovery of a large, continuous population of Pan troglodytes schweinfurthii in the Central Uele region of northern DRC. Biol. Conserv. 2014, 171, 107–113. [Google Scholar] [CrossRef]
Figure 1.
Location and map of the Issa Valley showing the distribution of all plots. Vegetation class layer produced by Caspian Johnson (unpublished).
Figure 1.
Location and map of the Issa Valley showing the distribution of all plots. Vegetation class layer produced by Caspian Johnson (unpublished).

Figure 2.
Partial orthomosaics of the study site representative of the vegetation at the beginning (May 2015) and at the end (September 2016) of the dry season.
Figure 2.
Partial orthomosaics of the study site representative of the vegetation at the beginning (May 2015) and at the end (September 2016) of the dry season.
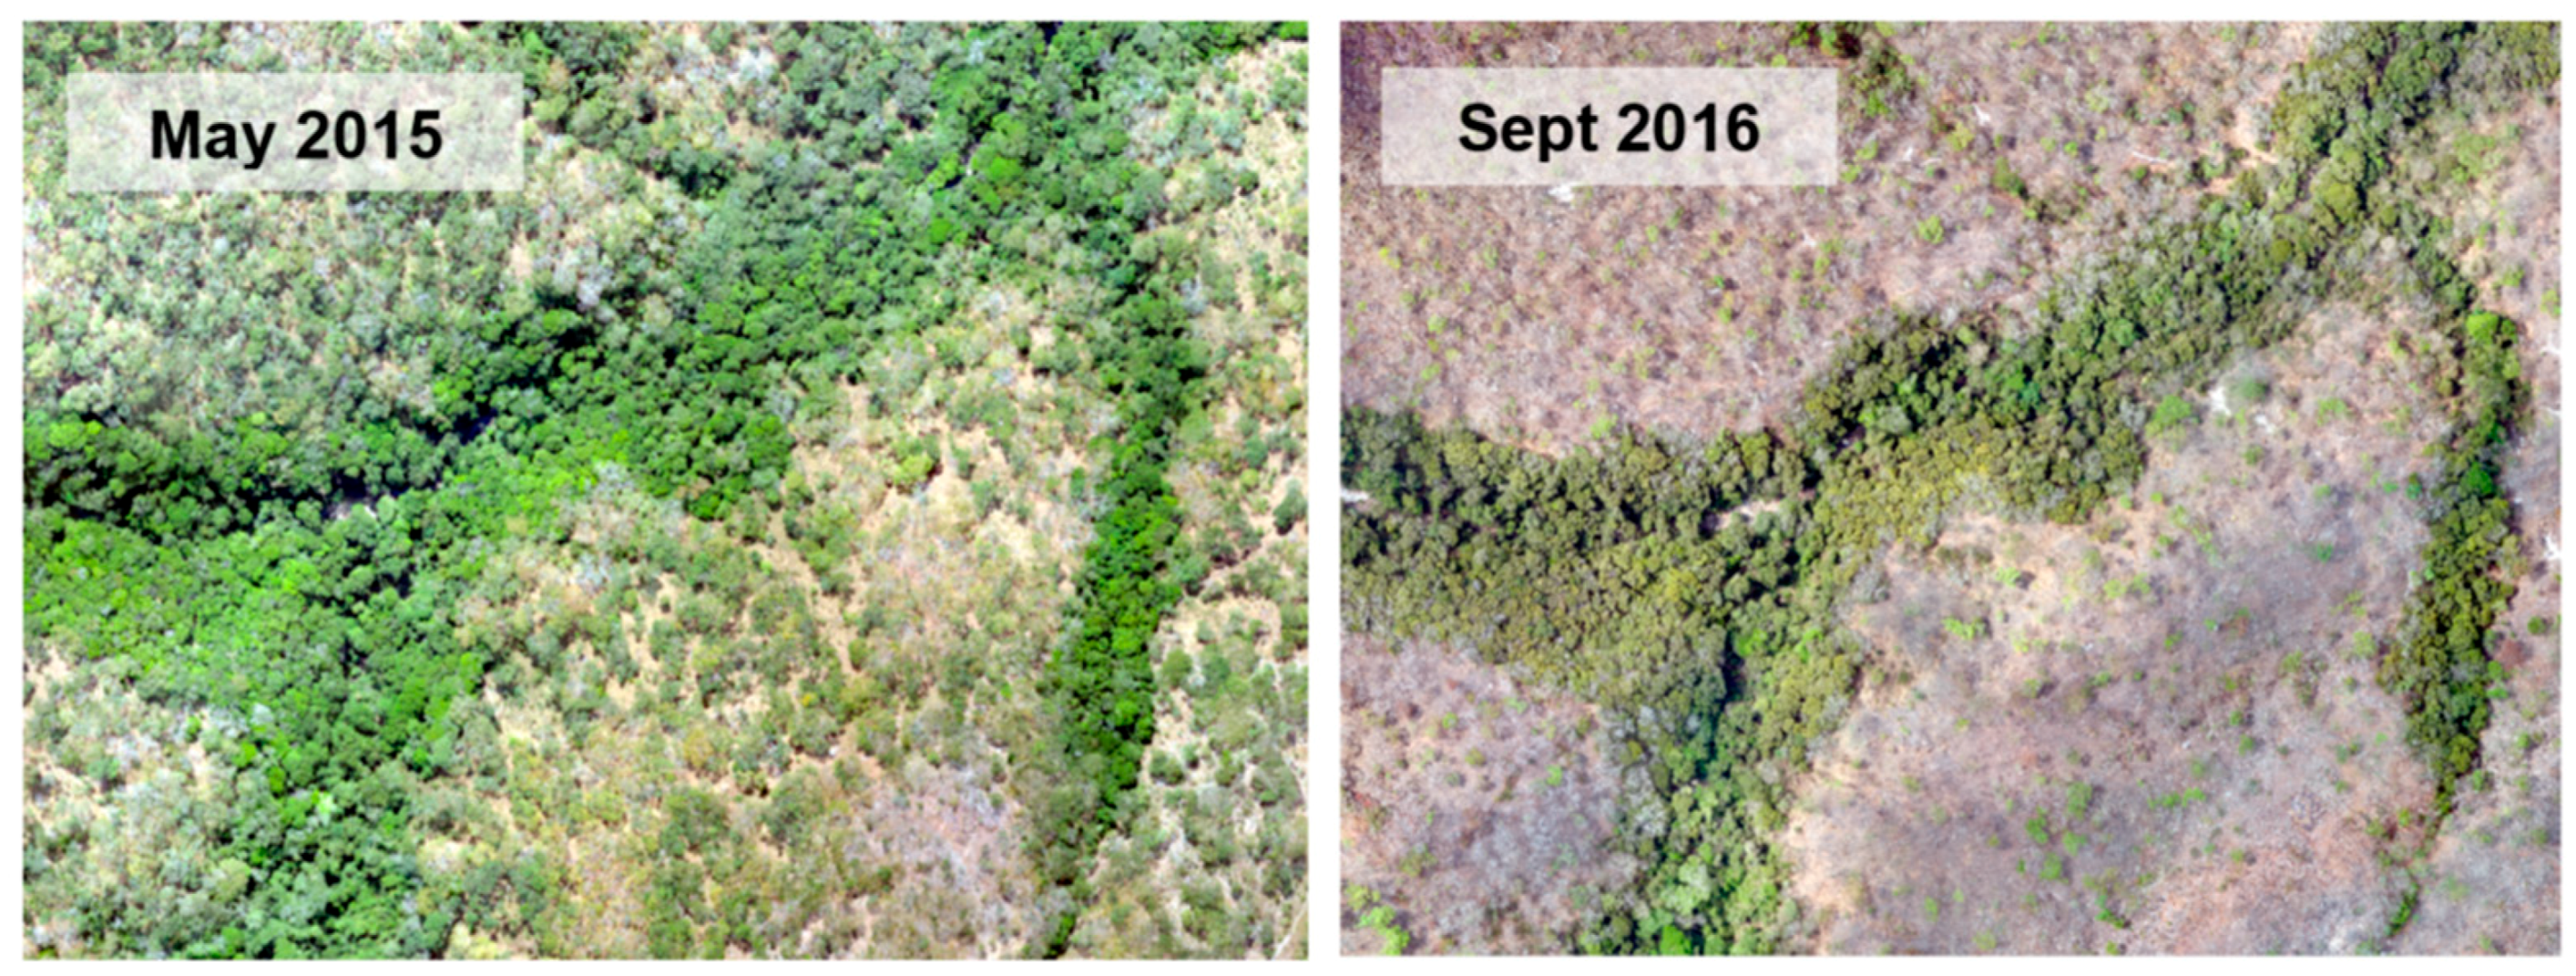
Figure 3.
Types of drone/camera pairing deployed: (a) Pairing A; (b) Pairing B.
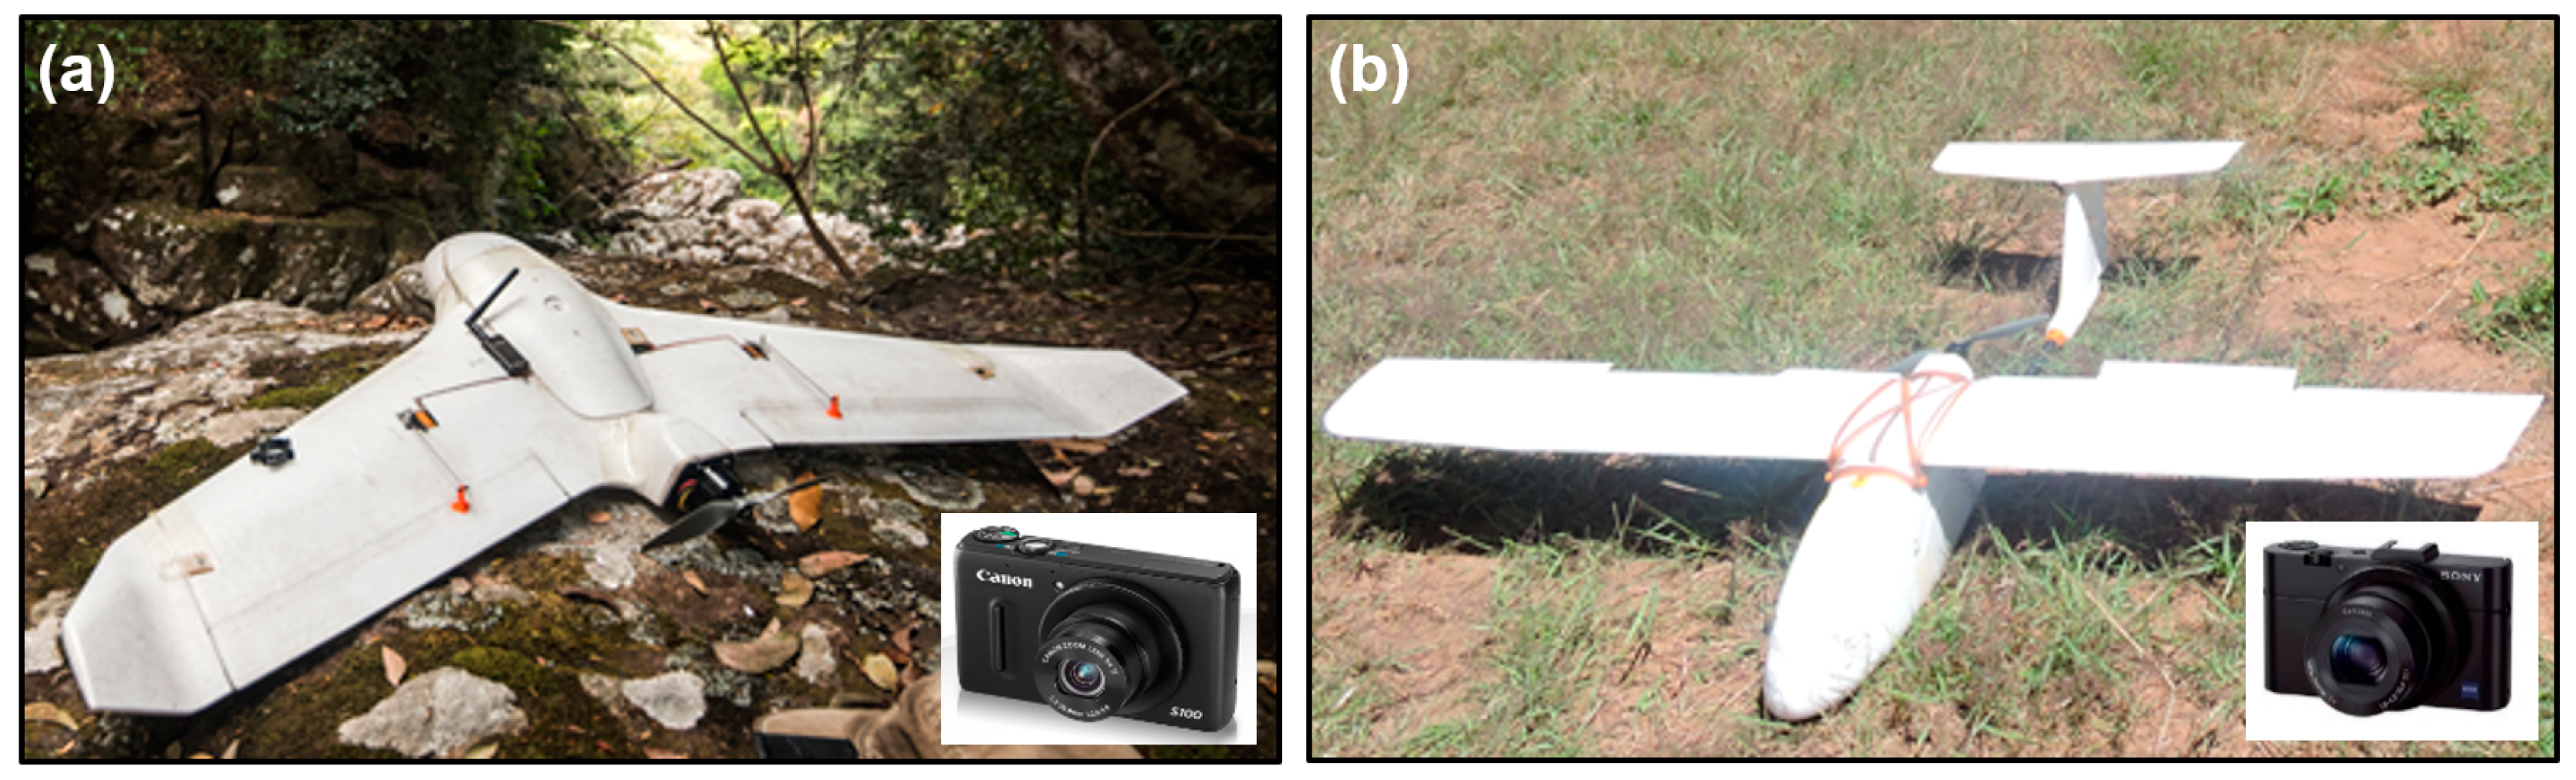
Figure 4.
Types of mission flown: (a) Line transect; (b) Grid mission.

Figure 5.
Examples of images of chimpanzee nests: captured during drone surveys (a,b) and observed from the ground (c,d).
Figure 5.
Examples of images of chimpanzee nests: captured during drone surveys (a,b) and observed from the ground (c,d).
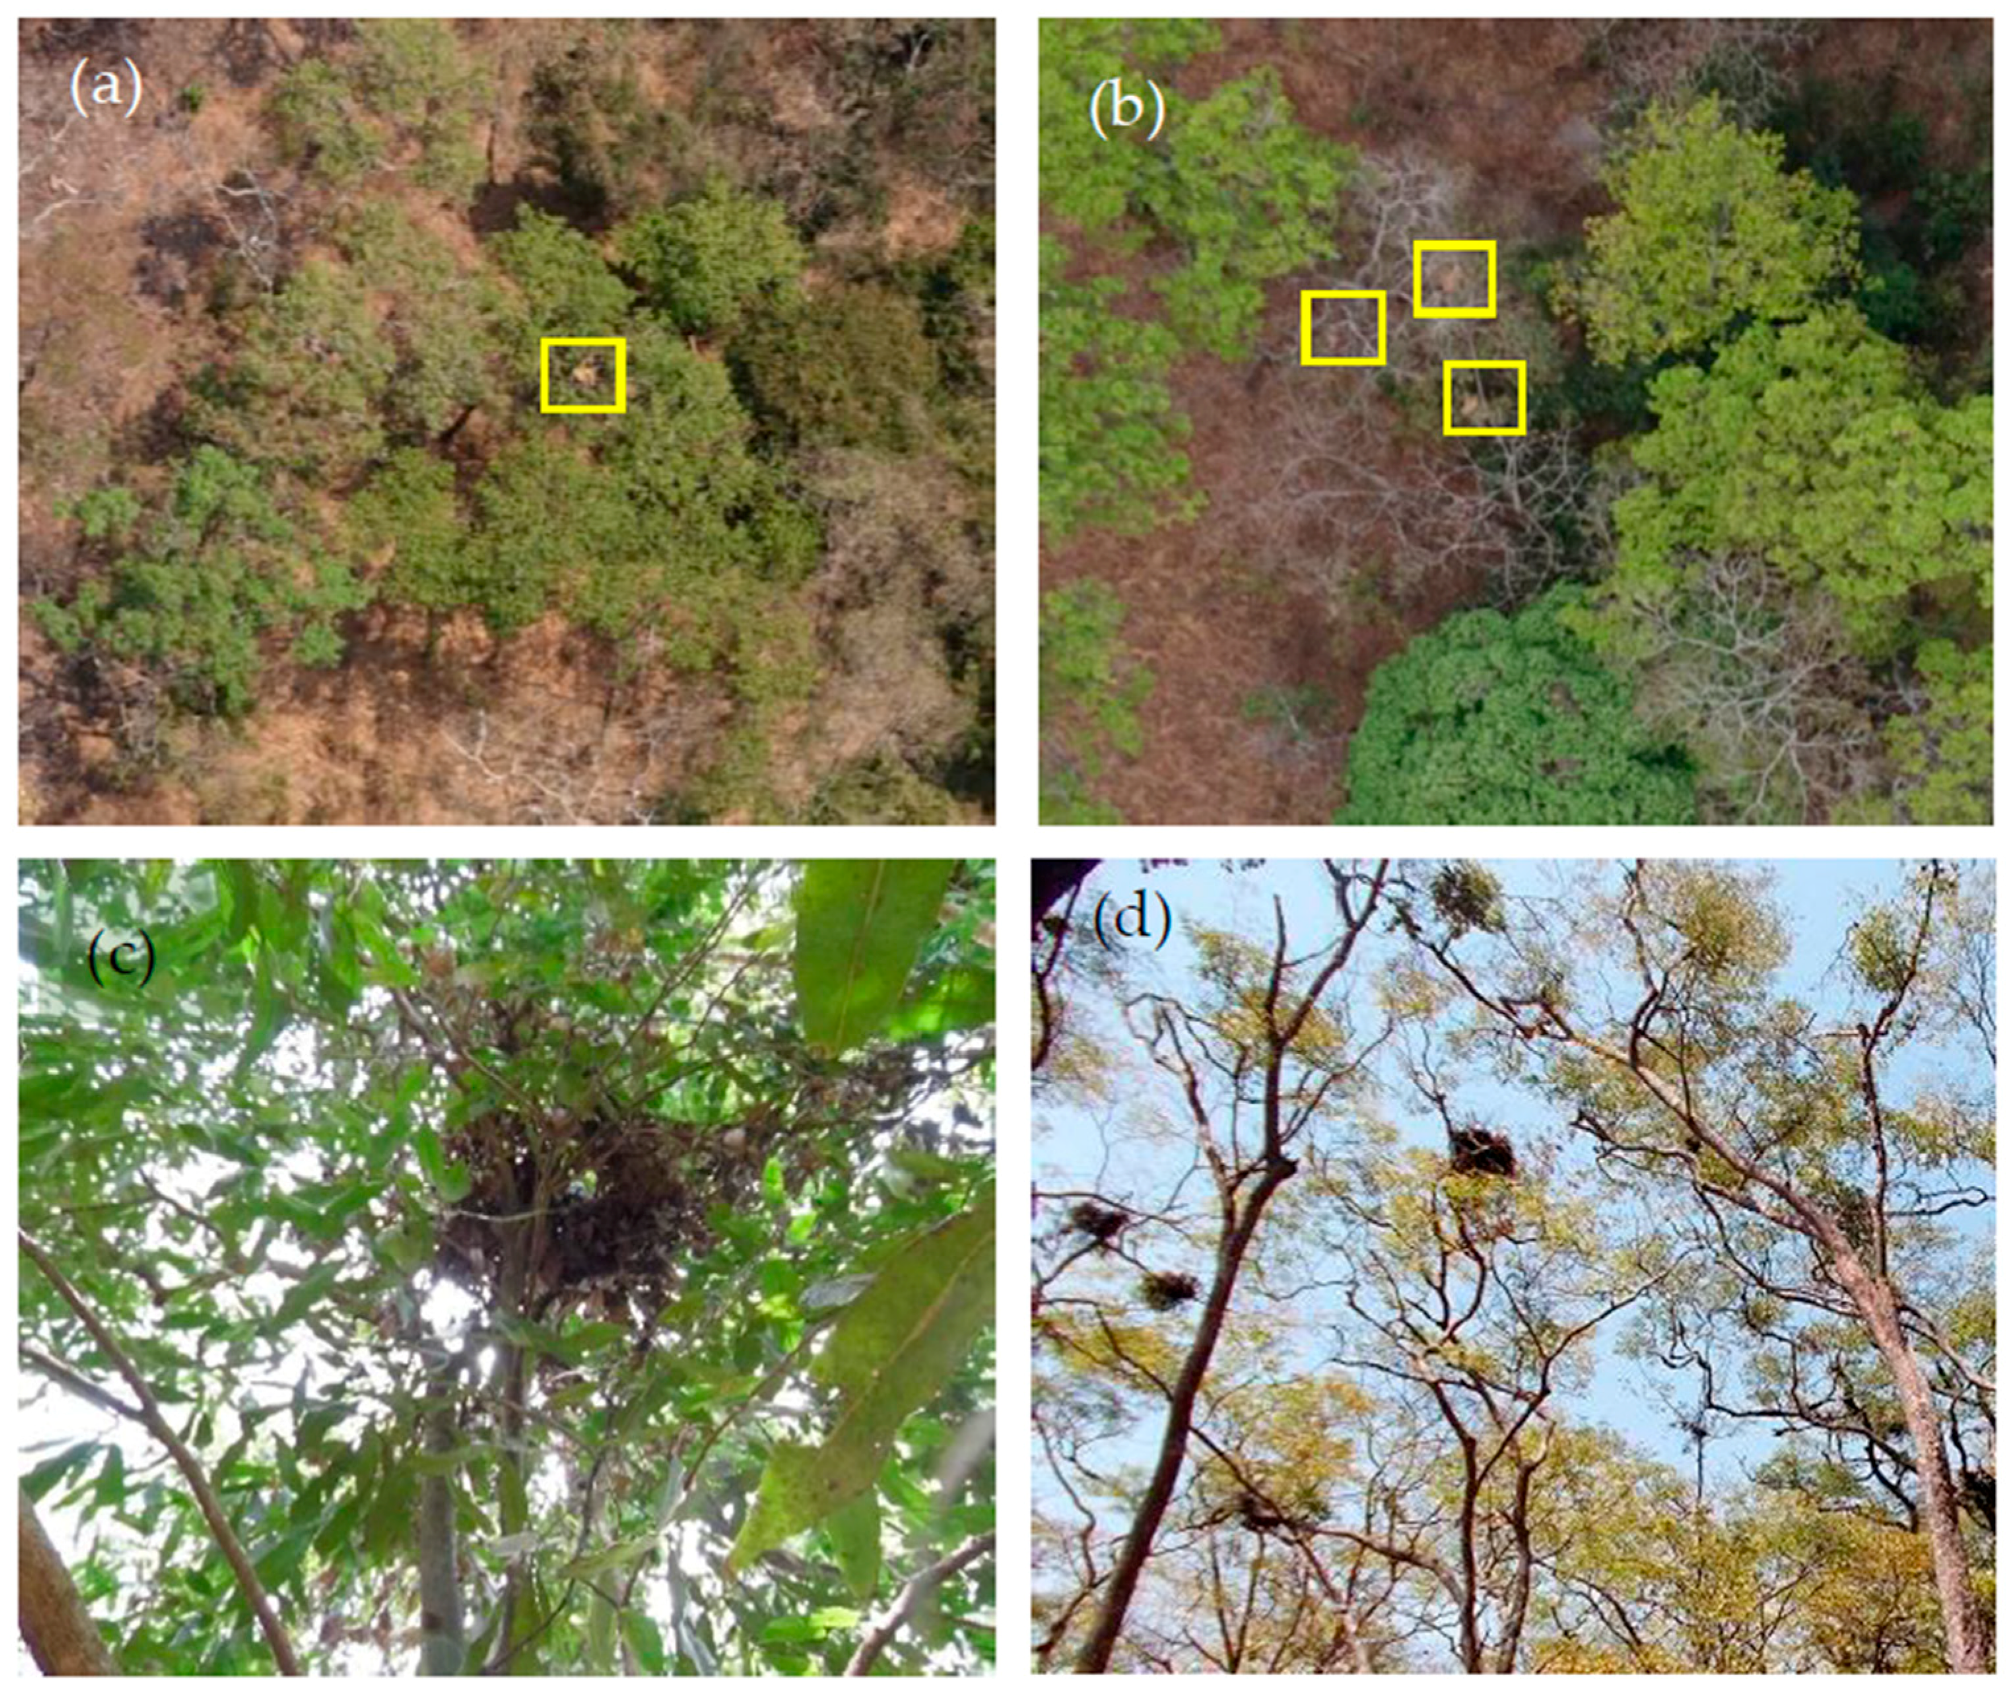
Figure 6.
Effect of drone/camera pairing on the recall rate. Error bars represent 95% confidence intervals for the predicted probabilities.
Figure 6.
Effect of drone/camera pairing on the recall rate. Error bars represent 95% confidence intervals for the predicted probabilities.

Figure 7.
Effect of the flight altitude (AGL) on the recall rate. Grey ribbon represents 95% confidence intervals for predicted probabilities.
Figure 7.
Effect of the flight altitude (AGL) on the recall rate. Grey ribbon represents 95% confidence intervals for predicted probabilities.

Figure 8.
Effect of (a) drone/camera pairing; (b) vegetation type within season and (c) flight altitude above ground level (AGL) on the false alarm rate. Error bars and grey ribbon represent 95% confidence intervals for predicted probabilities.
Figure 8.
Effect of (a) drone/camera pairing; (b) vegetation type within season and (c) flight altitude above ground level (AGL) on the false alarm rate. Error bars and grey ribbon represent 95% confidence intervals for predicted probabilities.


Table 1.
Outcomes of GLM to investigate the effect of drone/camera pairing, season and vegetation on the recall rate.
Table 1.
Outcomes of GLM to investigate the effect of drone/camera pairing, season and vegetation on the recall rate.
| Predictors | LRT | Parameter Estimate | ||||
|---|---|---|---|---|---|---|
| Χ2 | p Value | Estimate | Std. E. | z Value | Pr (>|z|) | |
| (Intercept) | −2.96 | 0.59 | −5.01 | 5.66 × 10⁻⁷ | ||
| Drone/camera pairing (Pairing A) | 10.96 | 0.004 ** | ||||
| Pairing B | 1.43 | 0.57 | −2.49 | 0.013 * | ||
| Vegetation (closed) | 0.89 | 0.828 | ||||
| Open | 0.3 | 0.84 | 0.37 | 0.722 | ||
| Season (May 2015) | 0.40 | 0.818 | ||||
| Sep-16 | −0.35 | 0.78 | −0.45 | 0.651 | ||
| Drone/camera pairing: Vegetation | 0.55 | 0.457 | ||||
| Pairing A: Open vegetation | 0.57 | 0.76 | 0.74 | 0.458 | ||
| Vegetation: Season | 7.29 | 0.993 | ||||
| Open vegetation: September 2016 | 0.01 | 1 | 0.01 | 0.993 | ||
The p value for each term is based on the chi-squared test (likelihood ratio test (LRT)) for change in the deviance when comparing models with or without that term. Parameter estimates are reported for all terms in the full model. * = p < 0.05; ** = p < 0.01.
Table 2.
Outcomes of GLM to investigate the effect of altitude, vegetation type and nest height on the recall rate.
Table 2.
Outcomes of GLM to investigate the effect of altitude, vegetation type and nest height on the recall rate.
| Predictors | LRT | Parameter Estimate | ||||
|---|---|---|---|---|---|---|
| Χ2 | p Value | Estimate | Std. E. | z Value | Pr (>|z|) | |
| (Intercept) | −1.53 | 0.28 | −5.45 | 4.98 × 10⁻⁸ | ||
| Flight altitude AGL | 4.35 | 0.037 * | −0.47 | 0.25 | −1.90 | 0.057 |
| Vegetation (closed) | 2.79 | 0.094 | ||||
| Open | −0.68 | 0.40 | −1.70 | 0.089 | ||
| Nest height | 0.07 | 0.789 | 0.04 | 0.17 | 0.27 | 0.789 |
The p value for each term is based on the chi-squared test (likelihood ratio test (LRT)) for change in deviance when comparing models with or without that term. Parameter estimates are reported for all terms in the full model. * = p < 0.05.
Table 3.
Outcomes of GLM investigating the effect of the drone/camera pairing, season, vegetation type and flight altitude AGL on the false alarm rate.
Table 3.
Outcomes of GLM investigating the effect of the drone/camera pairing, season, vegetation type and flight altitude AGL on the false alarm rate.
| Predictors | LRT | Parameter Estimate | ||||
|---|---|---|---|---|---|---|
| Χ2 | p Value | Estimate | Std. E. | z Value | Pr (>|z|) | |
| (Intercept) | −3.03 | 1.19 | −2.54 | 0.011 * | ||
| Drone/camera pairing (Pairing A) | 14.14 | 1.17 × 10⁻⁴ *** | ||||
| Pairing B | 3.69 | 1.08 | 3.40 | 6.73 × 10⁻⁴ *** | ||
| Vegetation (closed) | 23.23 | 1.44 × 10⁻⁶ *** | ||||
| Open | 5.72 | 1.99 | 2.87 | 0.004 ** | ||
| Season (May 2015) | 0.04 | 0.834 | ||||
| Sep-16 | 2.86 | 1.16 | 2.47 | 0.013 * | ||
| Flight altitude AGL | 9.55 | 0.002 ** | 2.01 | 0.90 | 2.24 | 0.025 * |
| Drone/camera pairing: Vegetation | 0.05 | 0.824 | ||||
| Pairing A: Open vegetation | −3.72 | 1.56 | −2.38 | 0.017 * | ||
| Season: Vegetation | 4.01 | 0.045 * | ||||
| Sept 2016: Open vegetation | −7.27 | 1.83 | −3.98 | 6.83 × 10⁻⁵ *** | ||
| Vegetation: Flight altitude AGL | 0.37 | 0.542 | ||||
| Open vegetation: Flight altitude AGL | −5.98 | 1.63 | −3.67 | 2.40 × 10⁻⁴ *** | ||
The p value for each term is based on the chi-squared test (likelihood ratio test (LRT)) for change in deviance when comparing models with or without that term. Parameter estimates are reported for all terms in the full model. * = p < 0.05; ** = p < 0.01; *** = p < 0.001.
© 2018 by the authors. Licensee MDPI, Basel, Switzerland. This article is an open access article distributed under the terms and conditions of the Creative Commons Attribution (CC BY) license (http://creativecommons.org/licenses/by/4.0/).
Share and Cite
MDPI and ACS Style
Bonnin, N.; Van Andel, A.C.; Kerby, J.T.; Piel, A.K.; Pintea, L.; Wich, S.A. Assessment of Chimpanzee Nest Detectability in Drone-Acquired Images. Drones 2018, 2, 17. https://doi.org/10.3390/drones2020017
AMA Style
Bonnin N, Van Andel AC, Kerby JT, Piel AK, Pintea L, Wich SA. Assessment of Chimpanzee Nest Detectability in Drone-Acquired Images. Drones. 2018; 2(2):17. https://doi.org/10.3390/drones2020017
Chicago/Turabian StyleBonnin, Noémie, Alexander C. Van Andel, Jeffrey T. Kerby, Alex K. Piel, Lilian Pintea, and Serge A. Wich. 2018. "Assessment of Chimpanzee Nest Detectability in Drone-Acquired Images" Drones 2, no. 2: 17. https://doi.org/10.3390/drones2020017