Multirotor Drone Aerodynamic Interaction Investigation


School of Aerospace Engineering, Georgia Institute of Technology, Atlanta, GA 30332, USA
*
Author to whom correspondence should be addressed.
Drones 2018, 2(4), 43; https://doi.org/10.3390/drones2040043
Submission received: 1 November 2018
/
Revised: 26 November 2018
/
Accepted: 30 November 2018
/
Published: 3 December 2018
Abstract
:Aerodynamic interactions between rotors are important factors affecting the performance of in-plane multirotor Unmanned Air Vehicles (UAVs) or drones, which are the majority of small size UAVs (or mini-drones). Optimal design requires knowledge of the flow features. The low Reynolds number of many UAV rotors raises the question of how these features differ from those expected by traditional analytical methods for rotorcraft. Aerodynamics of a set of side-by-side rotors in hover over a range of rotor separation and Reynolds number is studied using high-speed Stereo Particle Image Velocimetry (SPIV) and performance measurements. The instantaneous and time-averaged SPIV data presented here indicate an increase in inter-rotor wake interactions with decrease in rotor spacing and Reynolds number. A dip in rotor efficiency at small rotor spacing at low Reynolds number is observed through thrust and torque measurements. The basic components of in-plane multirotor wake and velocity profiles are identified and discussed to help generalize the findings to a wide range of drones. However, the data provide confidence in traditional analysis tools, with small modifications.
Keywords:
drone; UAV; multirotor; aerodynamics; PIV; wake interactions; low Reynolds number; performance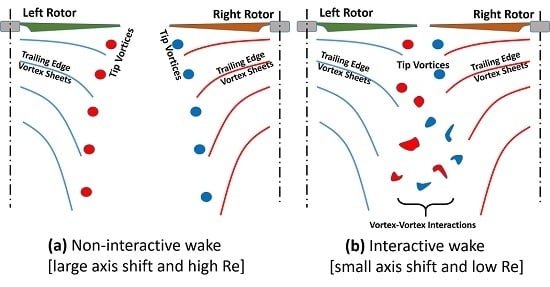
1. Introduction
Quadcopters, hexacopters, and in-plane octocopters appear to dominate the current commercial and recreational markets for Vertical Takeoff Landing UAVs (VTOL UAVs). These configurations offer much higher flexibility in size and placement of rotors and payload when compared with traditional single rotor or coaxial rotor configurations. Research in electronics and controls in the past two decades has made such UAVs more reliable, safer, and easier to control in a variety of flight conditions. A recent paper by Gonzalez et al. [1] gives an overview of types of UAVs, describes all the necessary subsystems with their importance, and also mentions a few present day applications. Floreano et al. describe the potential of small size UAVs to a great extent and cover all important current challenges on different fronts which need to be addressed, in their review paper [2]. The authors rightly make an observation that aerial vehicles do not scale down well in terms of aerodynamic efficiency, affecting performance. Hassanalian et al. [3] also talk extensively about classification, applications, and current challenges of UAVs. Some of the most common present day applications of small size VTOL UAVs are aerial photography, remote sensing, surveying, accident scene investigation etc.
The current aerodynamics knowledge in this small scale regime is limited to design and optimization of isolated rotors, with multirotor configurations being designed largely on an ad hoc basis. A good understanding of rotor-rotor and rotor-body aerodynamic interactions for multirotor UAVs is important for well-informed design optimization to push beyond the current performance limitations. Performance enhancements in endurance, range, payload and/or speed are crucial for utilizing drones in applications such as firefighting, rescue operations, EMS, organ transport, retail delivery and so on, which have potential to cause great socio-economic impact.
Knowledge and tools created over a span of about a century for helicopter rotors are not directly valid for most UAVs due to the huge difference in Reynolds number (Re) range. The approximations used in helicopter rotor theories are primarily based on the assumption that very high Re flows act mostly like inviscid, irrotational flows everywhere except in small regions containing high vorticity. Thin boundary layers and strong, tightly concentrated tip vortices, and thin vortex-sheet wakes are assumed in calculations that use the Blade Element, Prescribed Wake and Free Wake methods. Outside these thin regions of vorticity, the flow is presumed to be inviscid, irrotational and hence amenable to potential flow methods. At low Re, the effects of viscosity become more comparable to inertial effects. Hence helicopter rotor theories based on the above assumption of high Reynolds number cannot be expected a priori to give reliable predictions. To what extent can these methods be trusted, and how much do they affect predictions when there are multiple rotors in close proximity? These are the motivating questions behind the experimental research presented in this paper.
The prior studies relevant to the the problem can be separated into low-Re airfoils, low-Re rotors and large scale multi-rotor vehicles. In the area of low Re rotor, research so far has been on performance measurements, design, optimization, and CFD of micro aerial vehicle (MAV) scale rotors. Bohorquez and Hein [4,5,6] contributed through hover performance tests, Kunz and Rubio [7,8] through design and analysis, Lakshminarayan, Schroeder through CFD study [9,10,11,12]. On the multirotor side, there are some experimental studies by Radhakrishnan [13] and Ramasamy [14], computational studies by Griffiths [15], Gupta [16], Lee [17], Rajagopalan [18], and Yoon [19]. There have been a couple of aerodynamics studies on quadrotors as well in recent past. Huang et al. [20] studied aerodynamics, blade flapping and controls of a quadrotor UAV in aggressive maneuvering. Carroll et al. [21] worked on optimizing rotors for quadrotor arrangement for wake interference by a model using Biot–Savart rule. A more extensive literature review on the low-Re multirotor aerodynamics is covered in our prior papers [22,23].
The current study continues our prior efforts to understand low Re multirotor flows presented in [22,23]. The prior effort was focused on the special case of quadrotors and included flow visualization and performance measurements on a small size quadrotor setup. The present work is more generalized for use in any in-plane multirotor configuration. All in-plane multirotors can be interpreted as pairs of rotors placed side-by-side. Hence studying one pair of side-by-side rotors at a range of conditions should provide a fair idea about all possible in-plane configurations. The present study includes high-speed stereo particle image velocimetry and performance measurements on a setup comprising of two counter-rotating side-by-side rotors. Some instantaneous and mean flow field results are presented here for a range of test conditions along with analysis and discussion for use by UAV designers.
The rest of this paper is organized as follows: Section 2 describes test facility, setup, test conditions and estimated uncertainties in the measurements. Section 3 presents performance measurement and flow field results through PIV for all the test cases. The results are interpreted and discussed in Section 4, highlighting differences and commonality in the cases through velocity profile plots and conceptual sketches.
2. Material and Methods
2.1. Facility and Experimental Setup
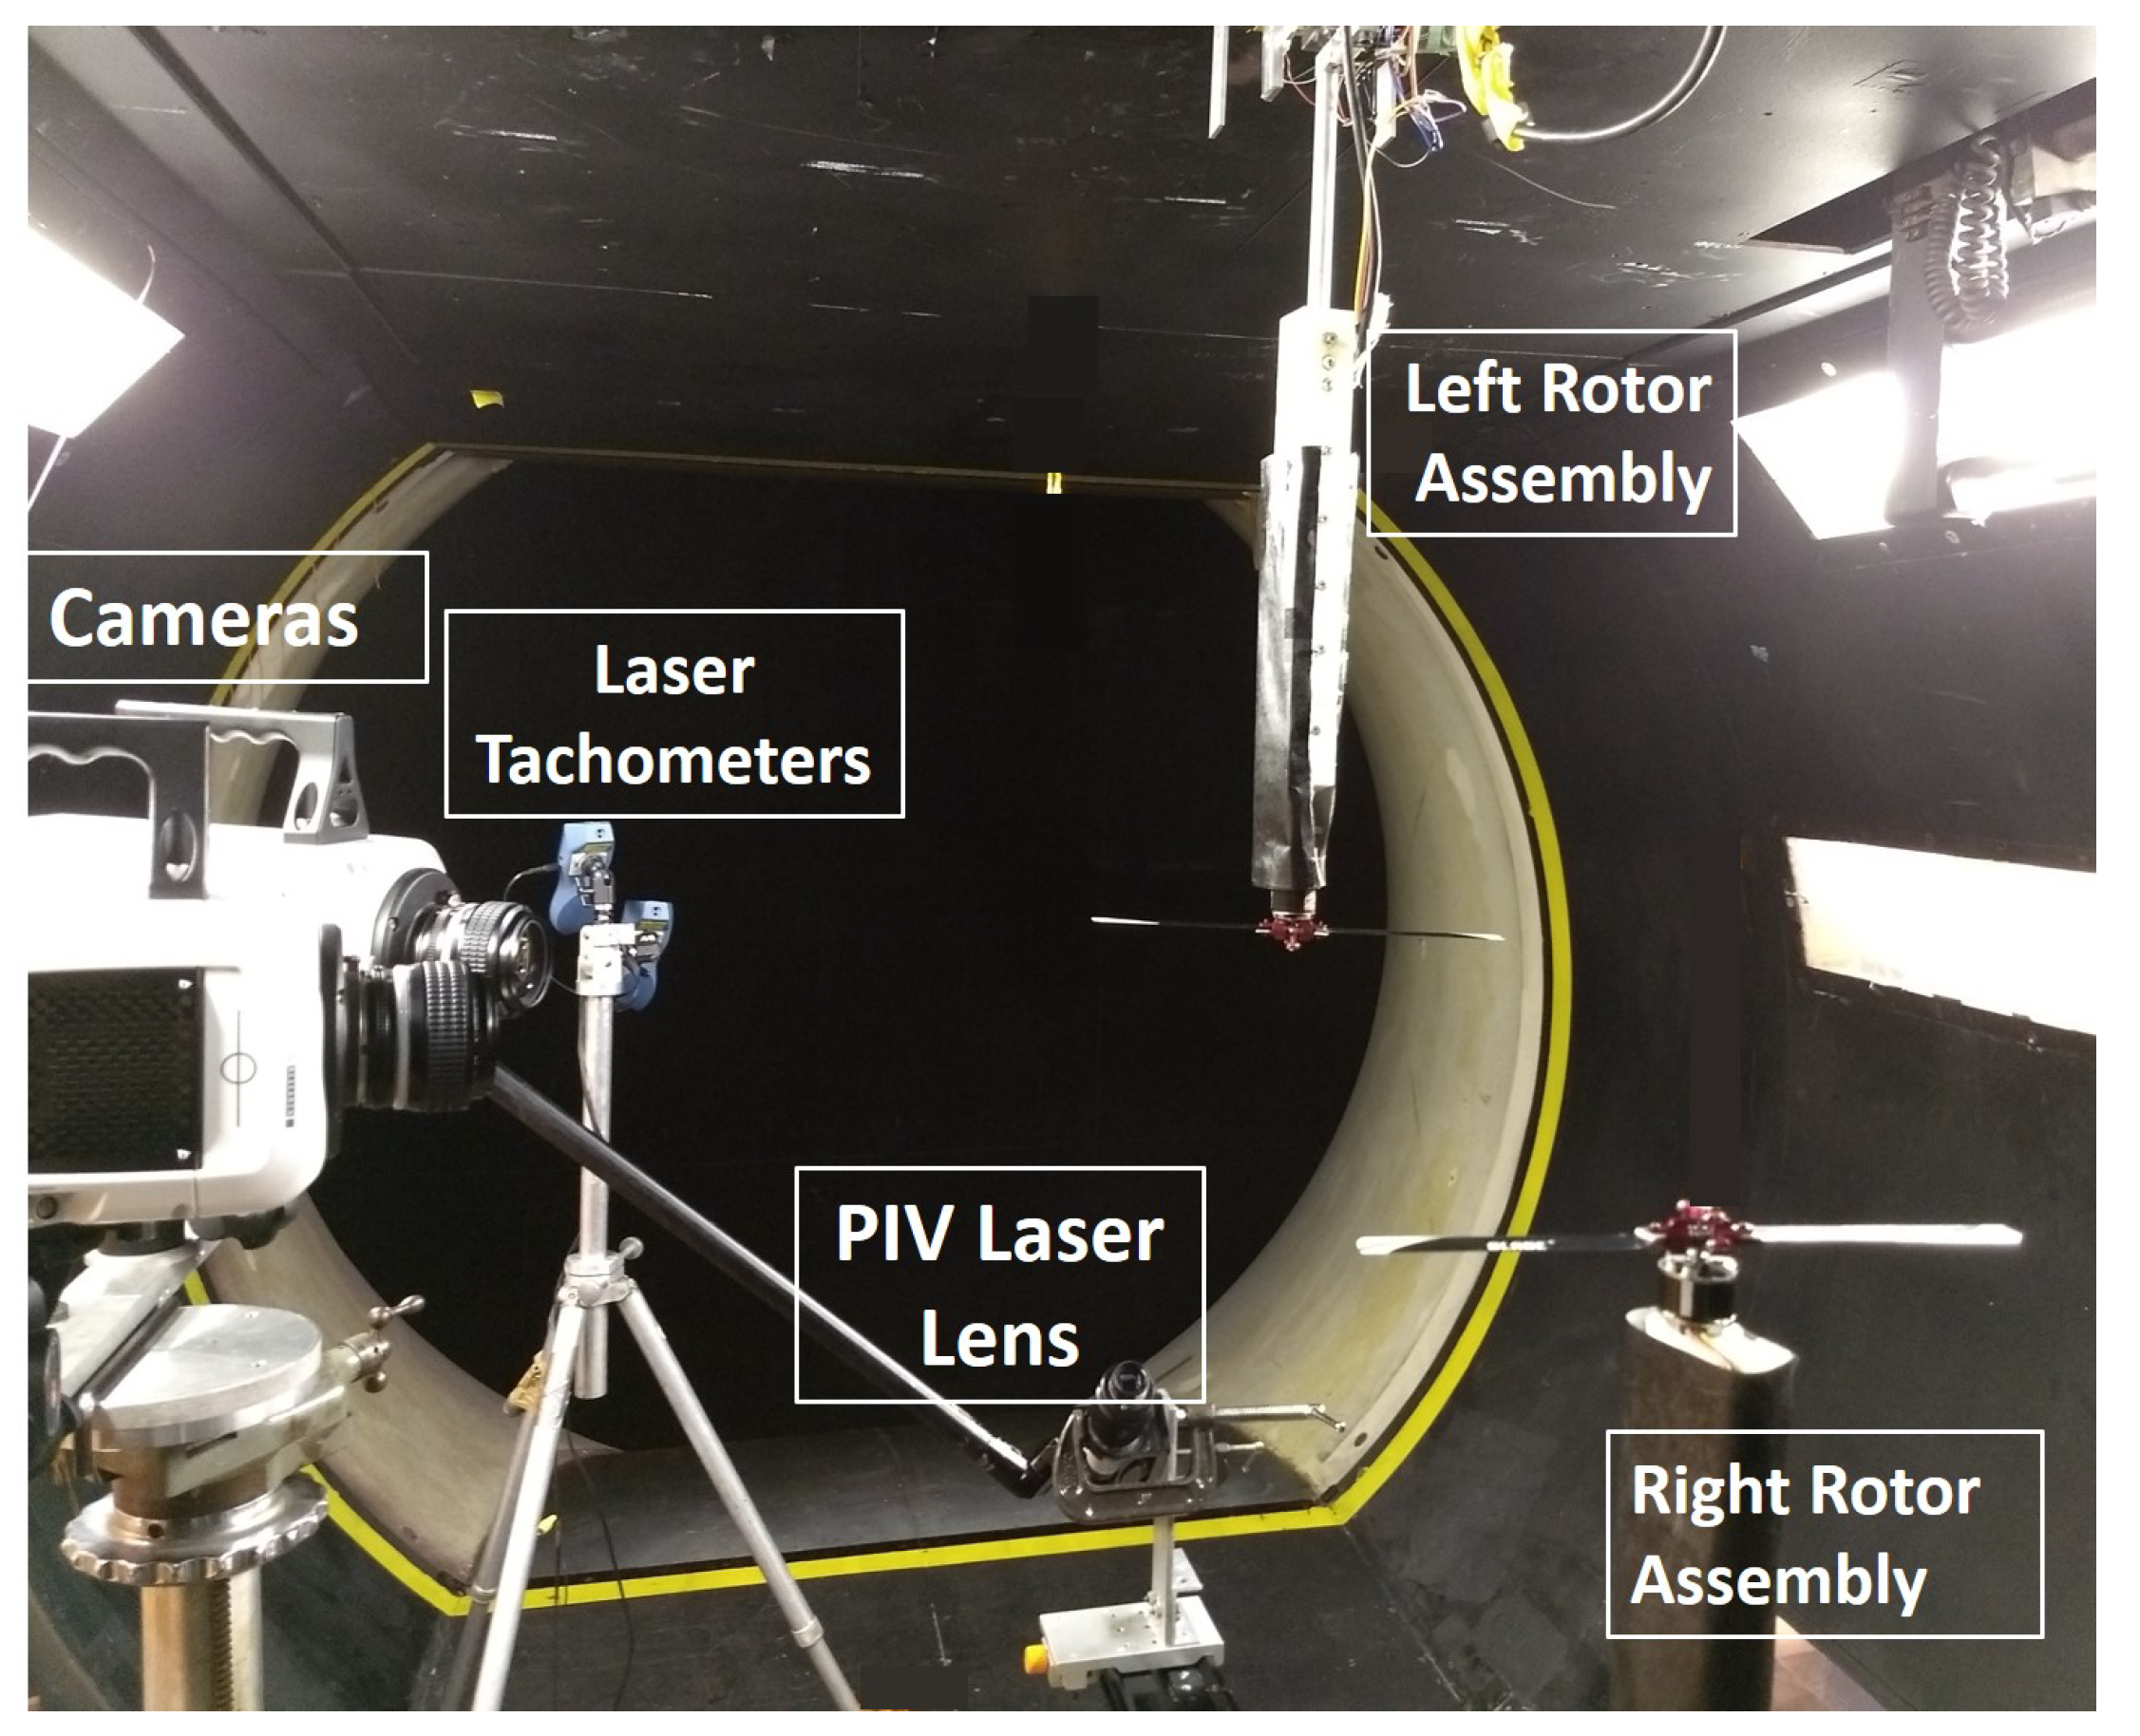
The wind tunnel test facility and the hi-speed stereo PIV (SPIV) flow diagnostics equipment used in this study are same as those used for the small quadrotor tests described in the prior paper [23]. However, the test setup for the present test is different. The current setup consists of two identical rotors placed side-by-side, and rotating in opposite directions. Each rotor assembly module is instrumented with a one-kgf range load cell for thrust measurement and a 100-gm range load cell installed tangentially about the rotation axis to measure rotor torque. Both rotors had variable collective pitch assembly actuated through servo motors to allow varying blade pitch mid-test to achieve trim conditions. The brushless DC (BLDC) motors powering the rotors were controlled using a microcontroller implementing a feedback control loop, getting rotor speed data through a laser tachometer. The feedback loop helped keep rotor within ±10 RPM of the set value. Figure 1 is a labeled photo of the bi-rotor setup.
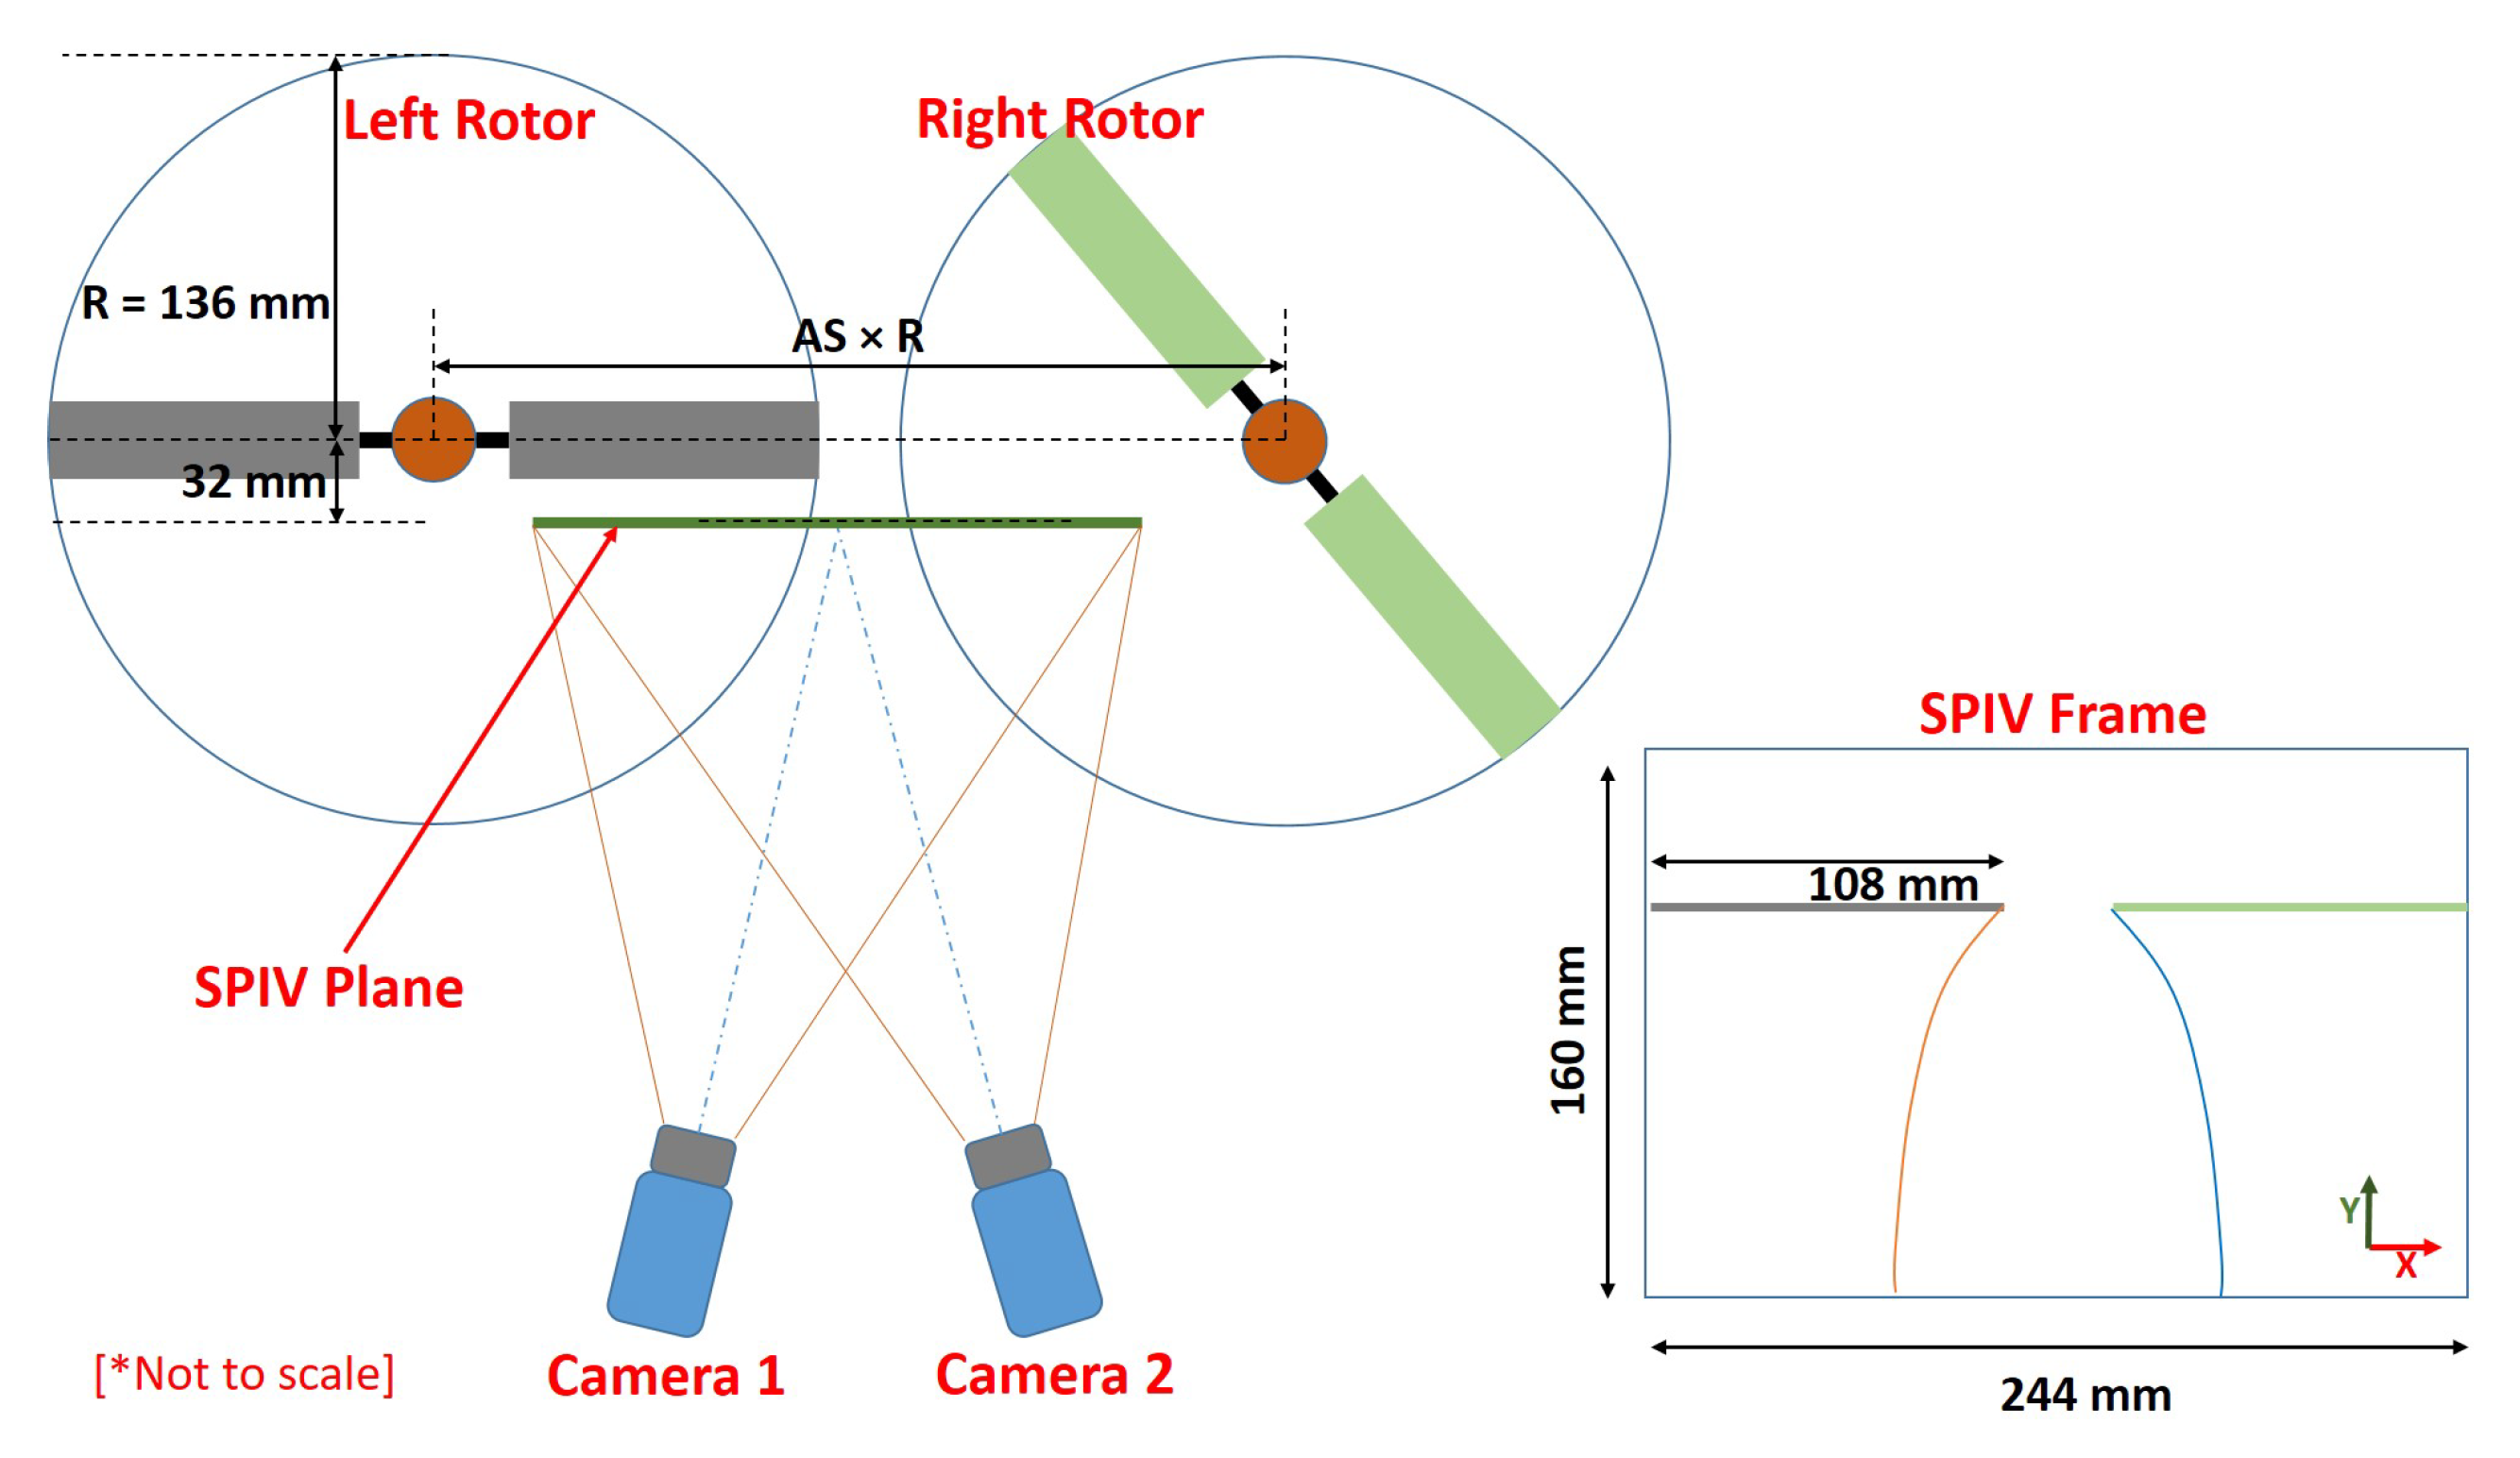
Among the two rotors, the right-hand side rotor assembly could be shifted in the horizontal plane to vary the distance between the two rotor axes. The left-hand side rotor and the SPIV system was not moved between cases. The SPIV plane was kept 32 mm off the plane of the rotor axes towards the cameras to avoid laser shadows and obstructions due to the rotor mounts. The left-hand side rotor rotated counter-clockwise and the right-hand side rotor rotated clockwise when seen from above. The relative position of the cameras, SPIV plane and the setup is depicted in Figure 2 for better understanding of the SPIV result figures.
2.2. Trim and Test Conditions
The experiments were performed at two separate rotor blade tip Reynolds numbers (Re) of 40,000 (40k) and 80,000 (80k). The Reynolds number used here is defined in expression (1). Rotor RPM was varied to change the Re. The rotors were operated at constant average coefficient of thrust () of 0.004 and the torques on both were matched to depict steady hover flight condition by adjusting blade pitches. The distance between the rotor axes or axis shift (AS) was varied from 2.1 × R to 2.5 × R.
Table 1 lists rotor specifications and test conditions.
2.3. Uncertainty Estimates
The hi-speed PIV data were captured at the rate of 400 frames per second. The physical resolution of the SPIV plane images was 0.087 mm × 0.087 mm which is a function of distance of the camera from the plane and lens used. Velocity vector computations were done by the DaVis software in four passes. The interrogation window size for the first two passes was 64 × 64 pixels with 50% overlap, and for the next two passes was 32 × 32 pixels with 50% overlap. The computed vector field after the passes has the resolution of 1.392 mm × 1.392 mm (or 16 × 16 pixels). The air was seeded using atomized mineral oil particles of diameter ranging from 5–10 m. The relaxation time, or the time taken by the seeder particle to follow a step change in air velocity found analytically using stokes flow assumptions, is in the order of 0.25 ms. The smallest characteristic time scale in the flow estimated from the vorticity data is in the order of 1–2 ms. Hence, error in the PIV measurements due to seeder particle lag can be neglected. The seeding density was kept uniform by seeding the whole test section well in advance before commencing the PIV tests. No pockets of unseeded or over seeded regions were found in the raw camera images. Each interrogation window of 32 × 32 pixels covered about 8–12 seeder particles everywhere in the PIV plane.
The standard deviation of the thrust and torque measurements for all tests was within 4% and 3% respectively. The maximum uncertainty in Figure of Merit (FM) was computed to be 9% after accounting for systematic deviations from the mean due to flow structures and random measurement errors. Uncertainties in the instantaneous in-plane velocity components in the area of interest are within 6% of the mean velocity values. The velocity vector uncertainties were estimated using the DaVis software which uses the method by Sciachitano et al. [24].
3. Results
3.1. Performance Measurements
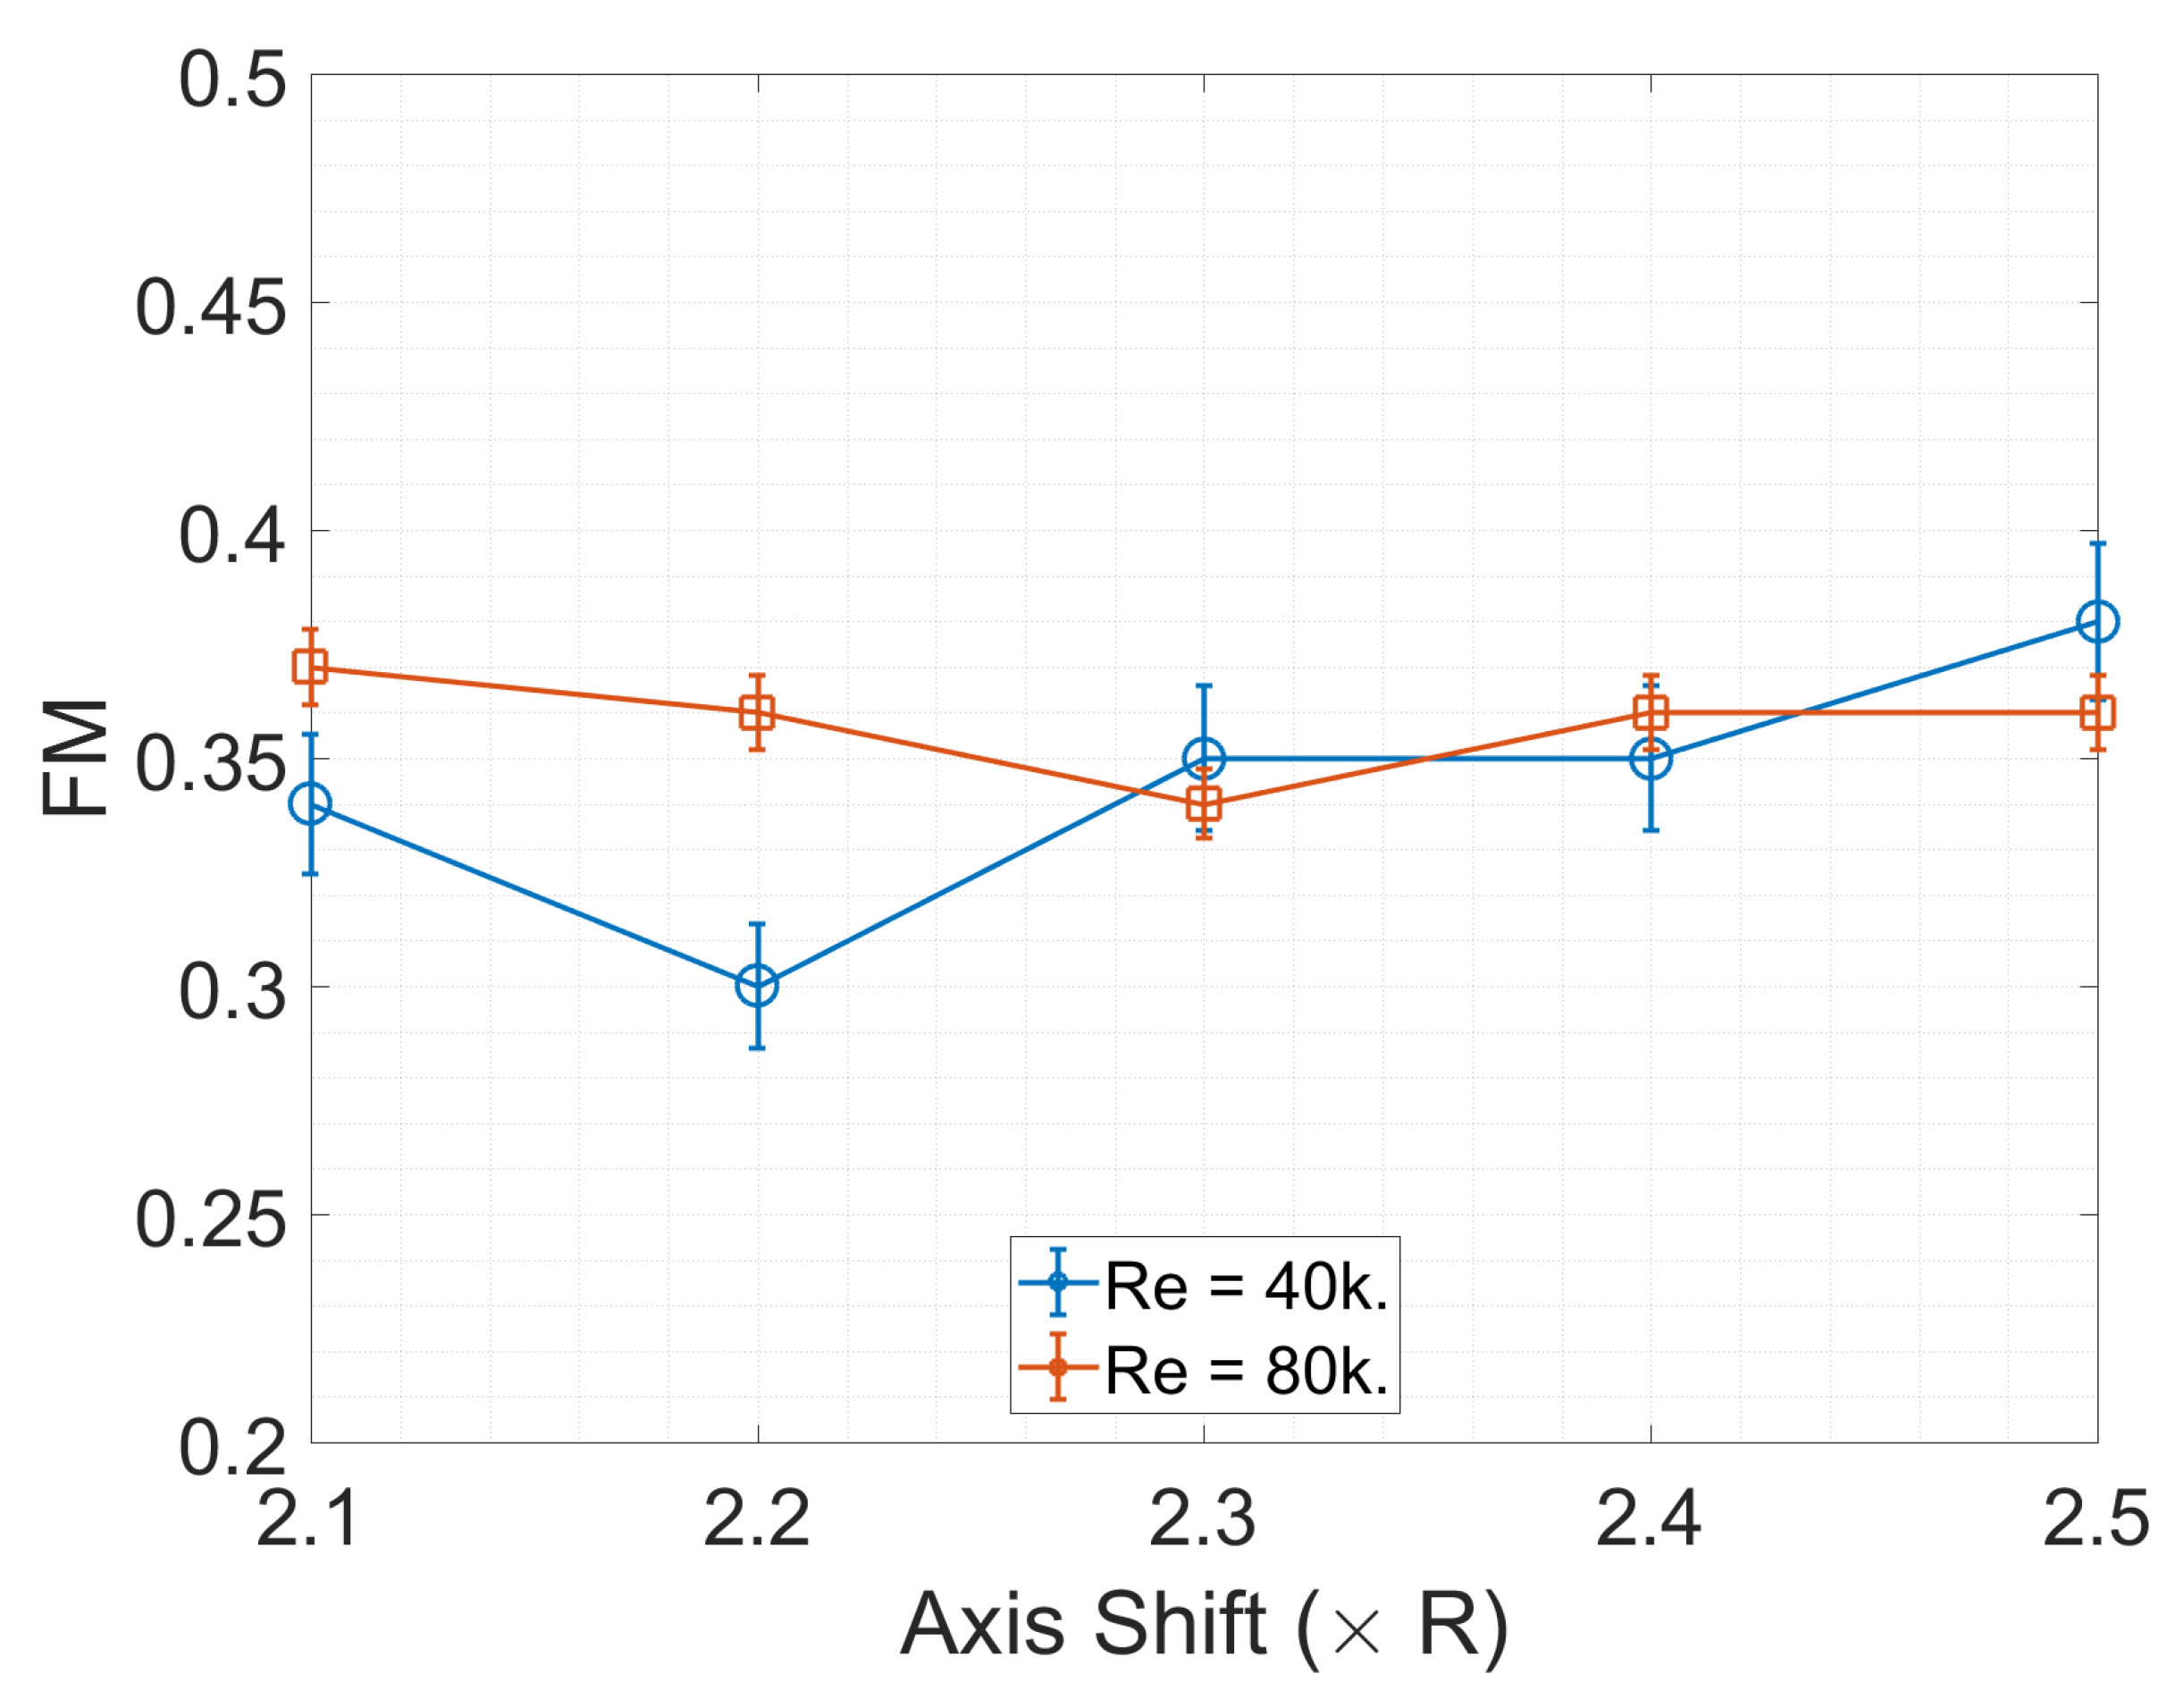
Performance of the rotors is evaluated using thrust and torque measurement results. The loadcell readings in Newtons and Newton-meter for thrust and torque, respectively, are converted to the non-dimensional Coefficient of Thrust () and Coefficient of Torque () form to account for the variations in rotor speed and dimensions while comparing among cases. The coefficients of thrust and torque are used to find Figure of Merit (FM) which is a measure of efficiency (or power requirement) of a rotor compared to the theoretical best found using the momentum theory. Here we compare the rotor performance among all cases using FM. The expression used for computing FM of the bi-rotor setup is given in Equation (2). The Figure 3 is a plot of FM for the rotor tests performed at two Re at a range of axis shifts.
3.2. Instantaneous Flow Fields
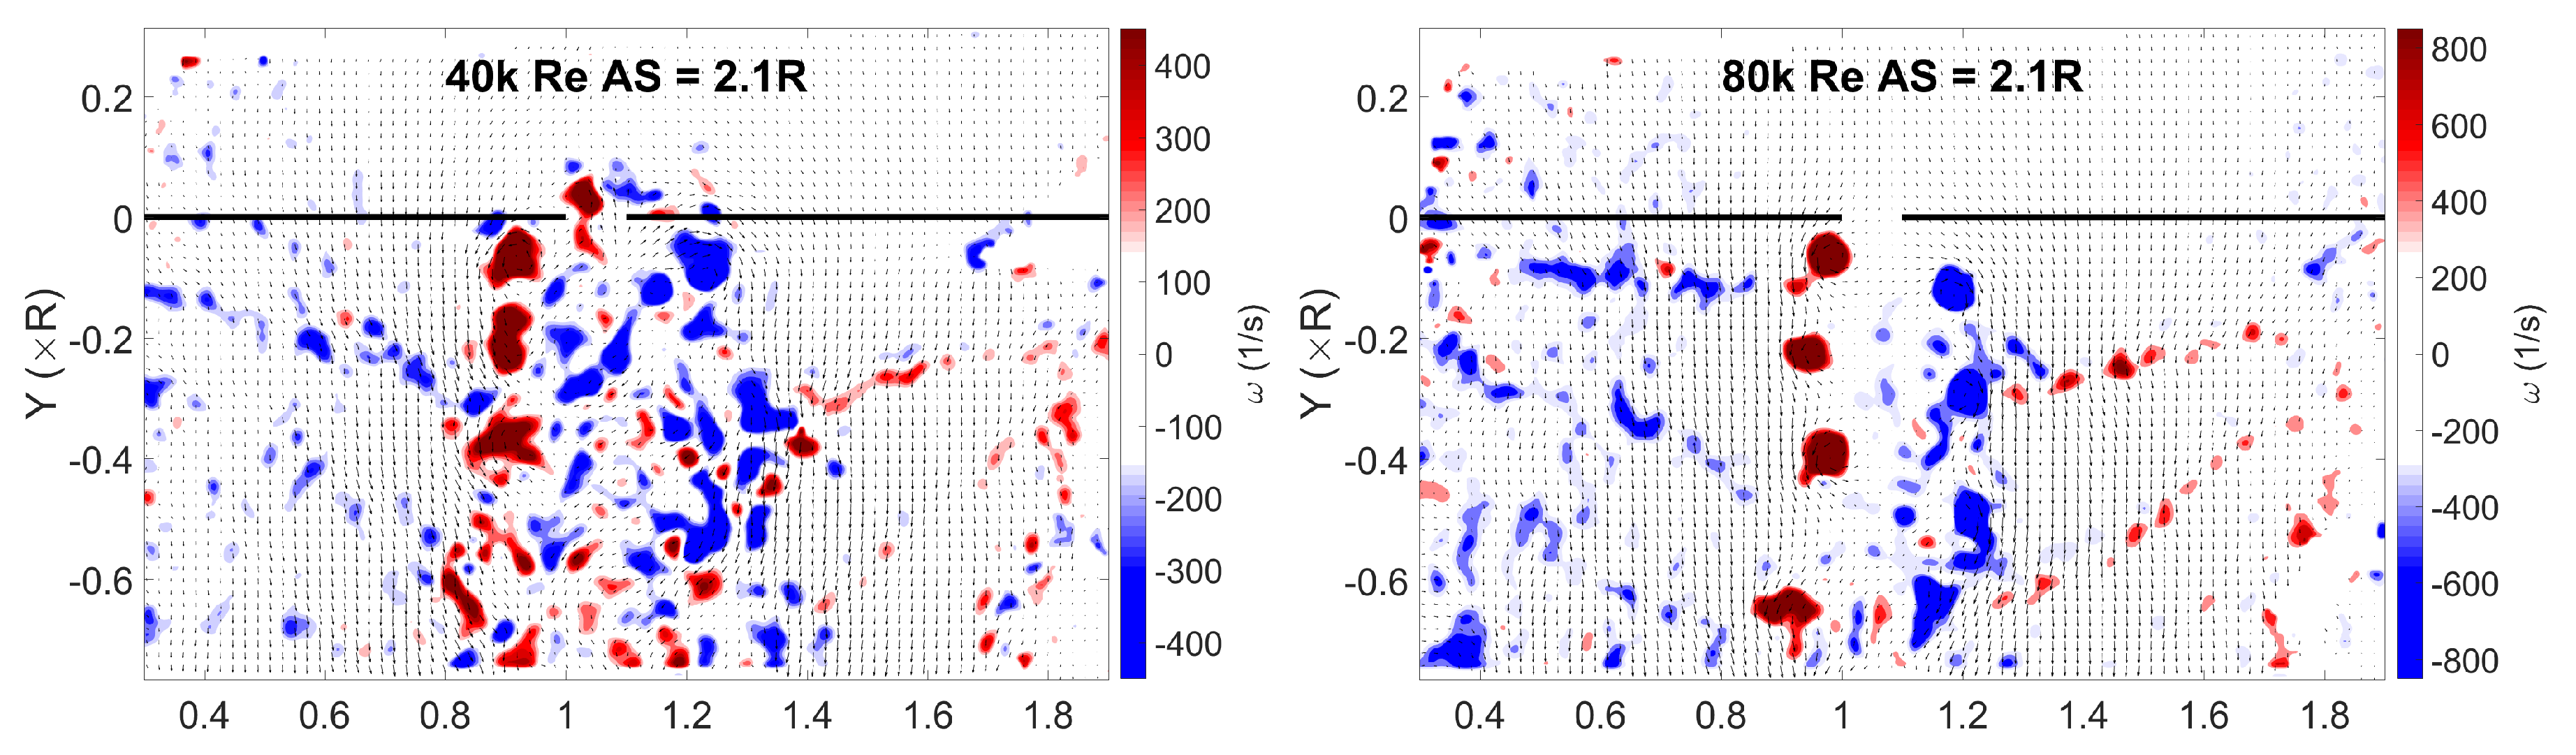
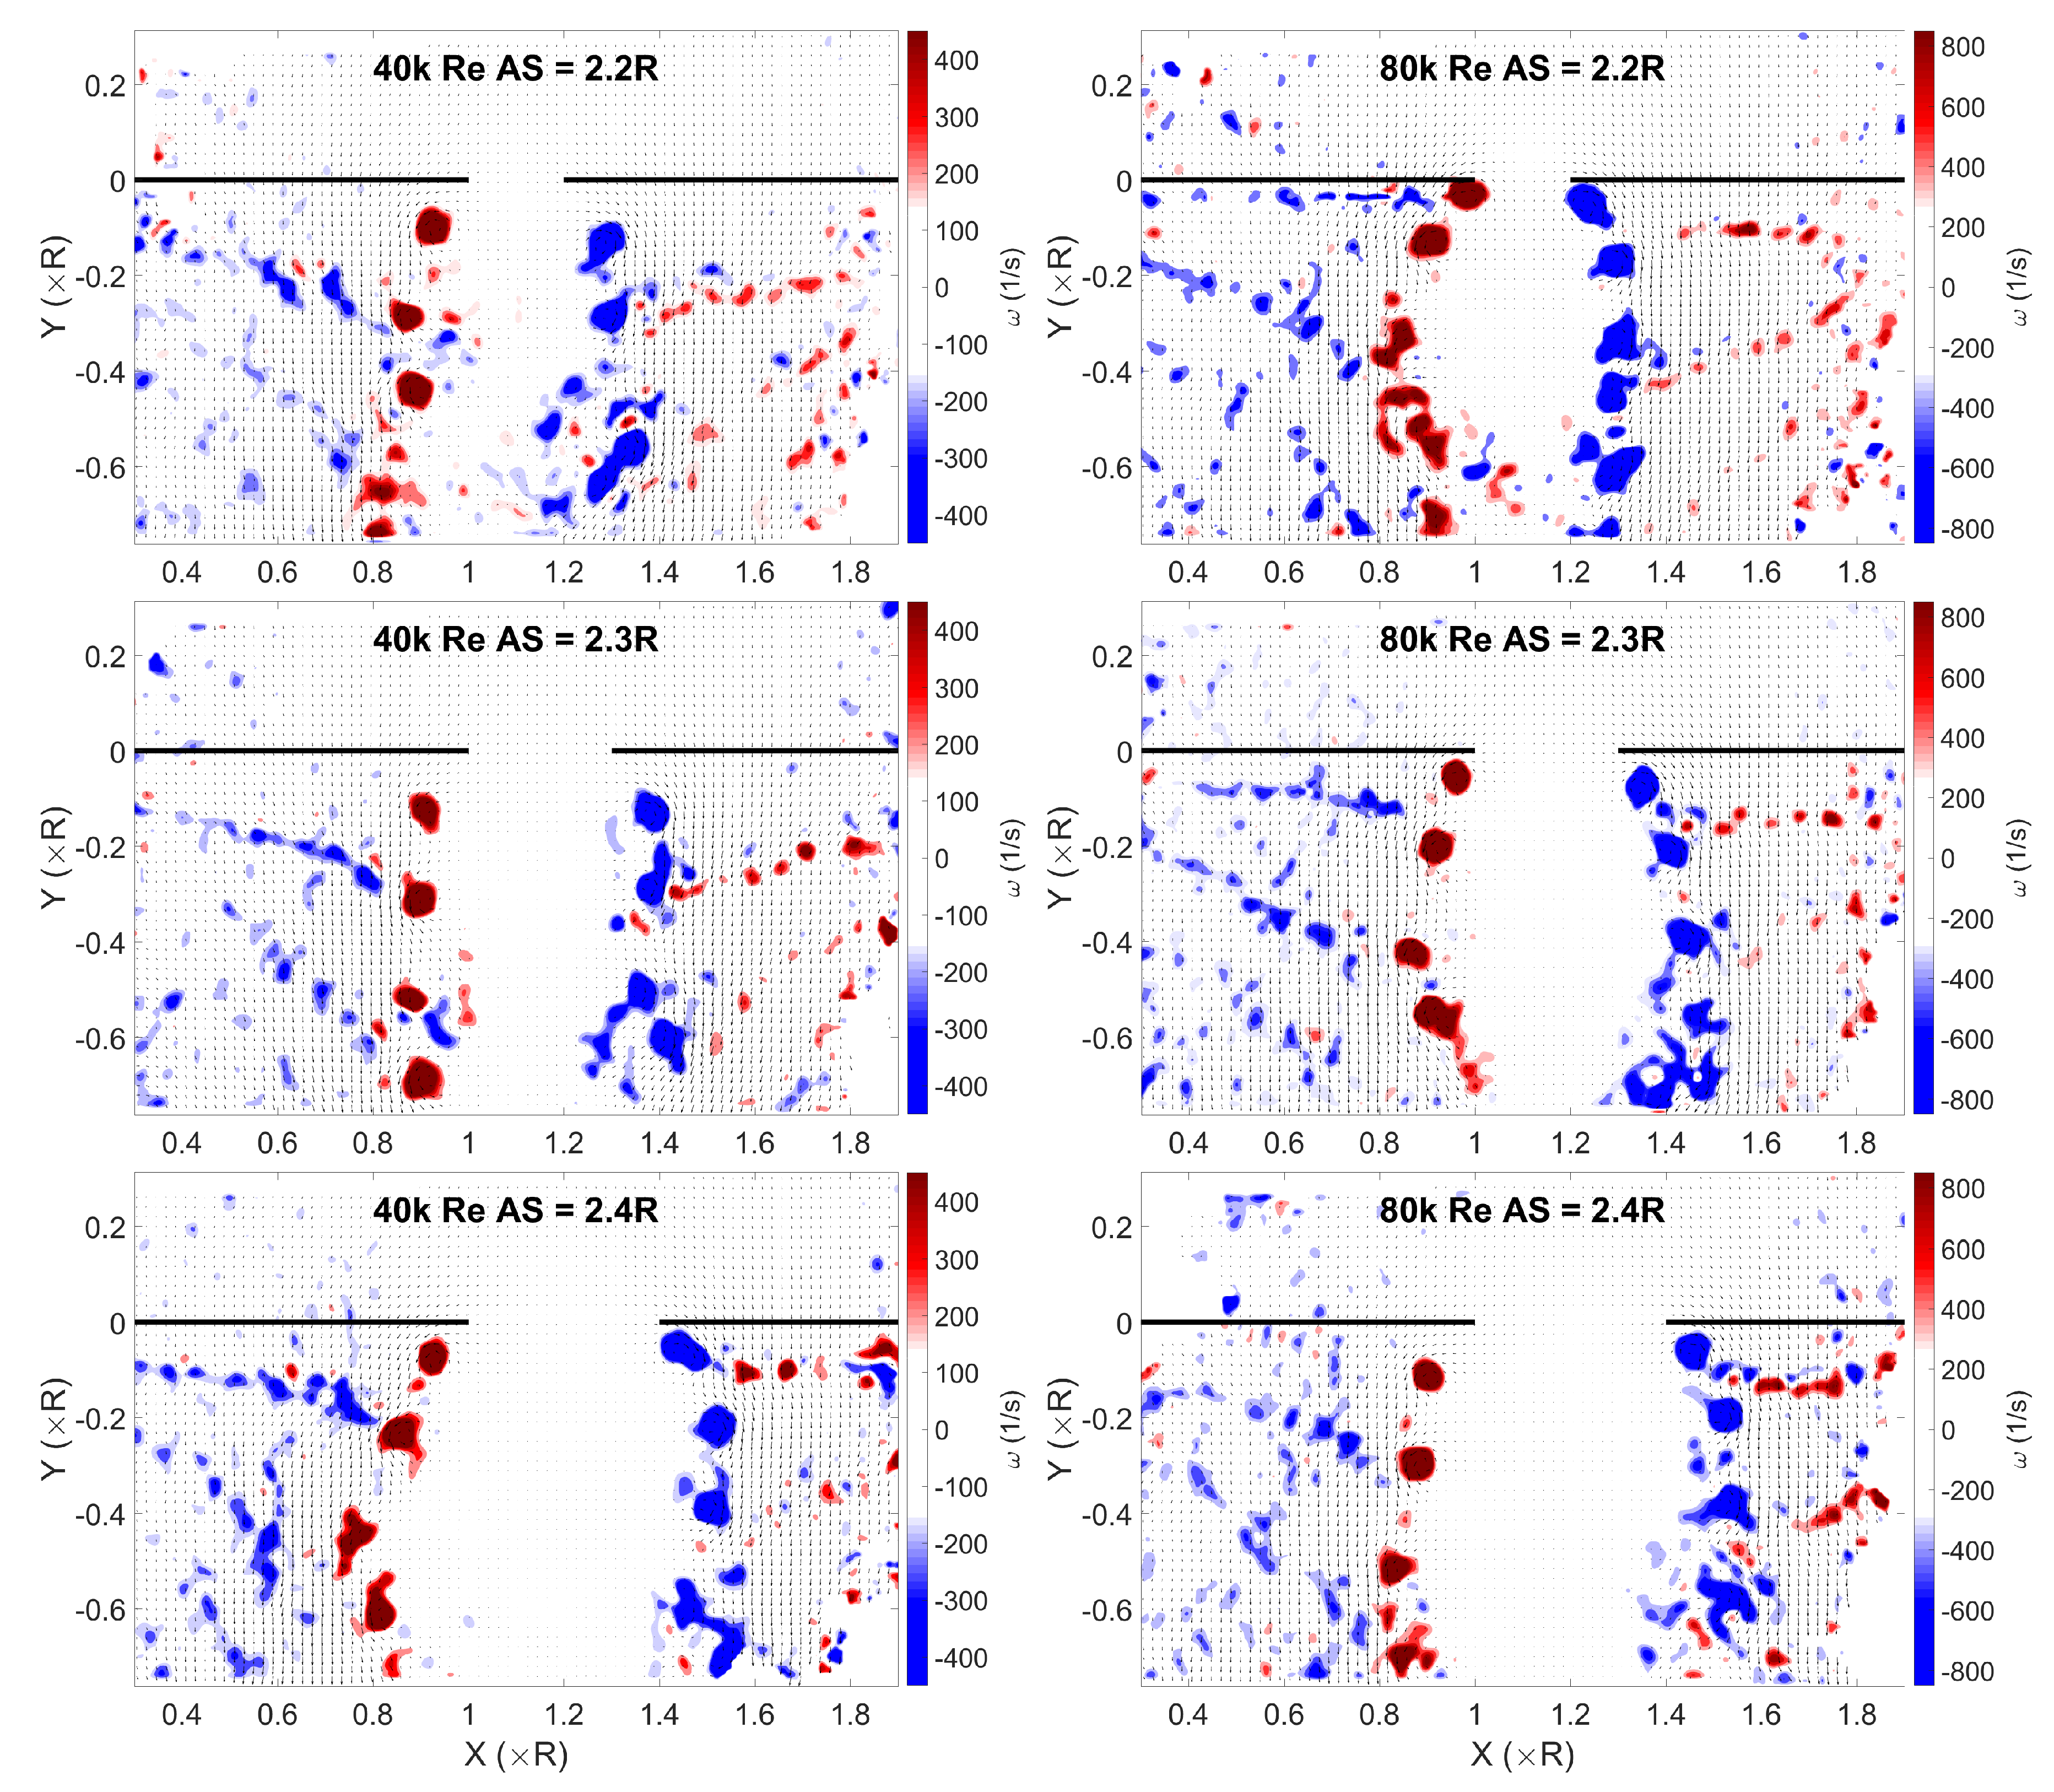
Figure 4 shows how instantaneous flow field looks like for each of the test cases. The vorticity contour plots in the figure help in identifying tip vortices and trailing edge vortex sheets which are the most prominent features in a rotor wake. When following the wake from the left-hand side rotor, red circular spots correspond to tip vortices and coherent blue streaks correspond to trailing edge vortex sheets. Similarly, when following the right-hand side rotor wake, blue circular spots correspond to vortices and coherent red streaks correspond to trailing edge vortex sheets.The horizontal black lines in the plots represent rotors.
3.3. Mean Flow Fields
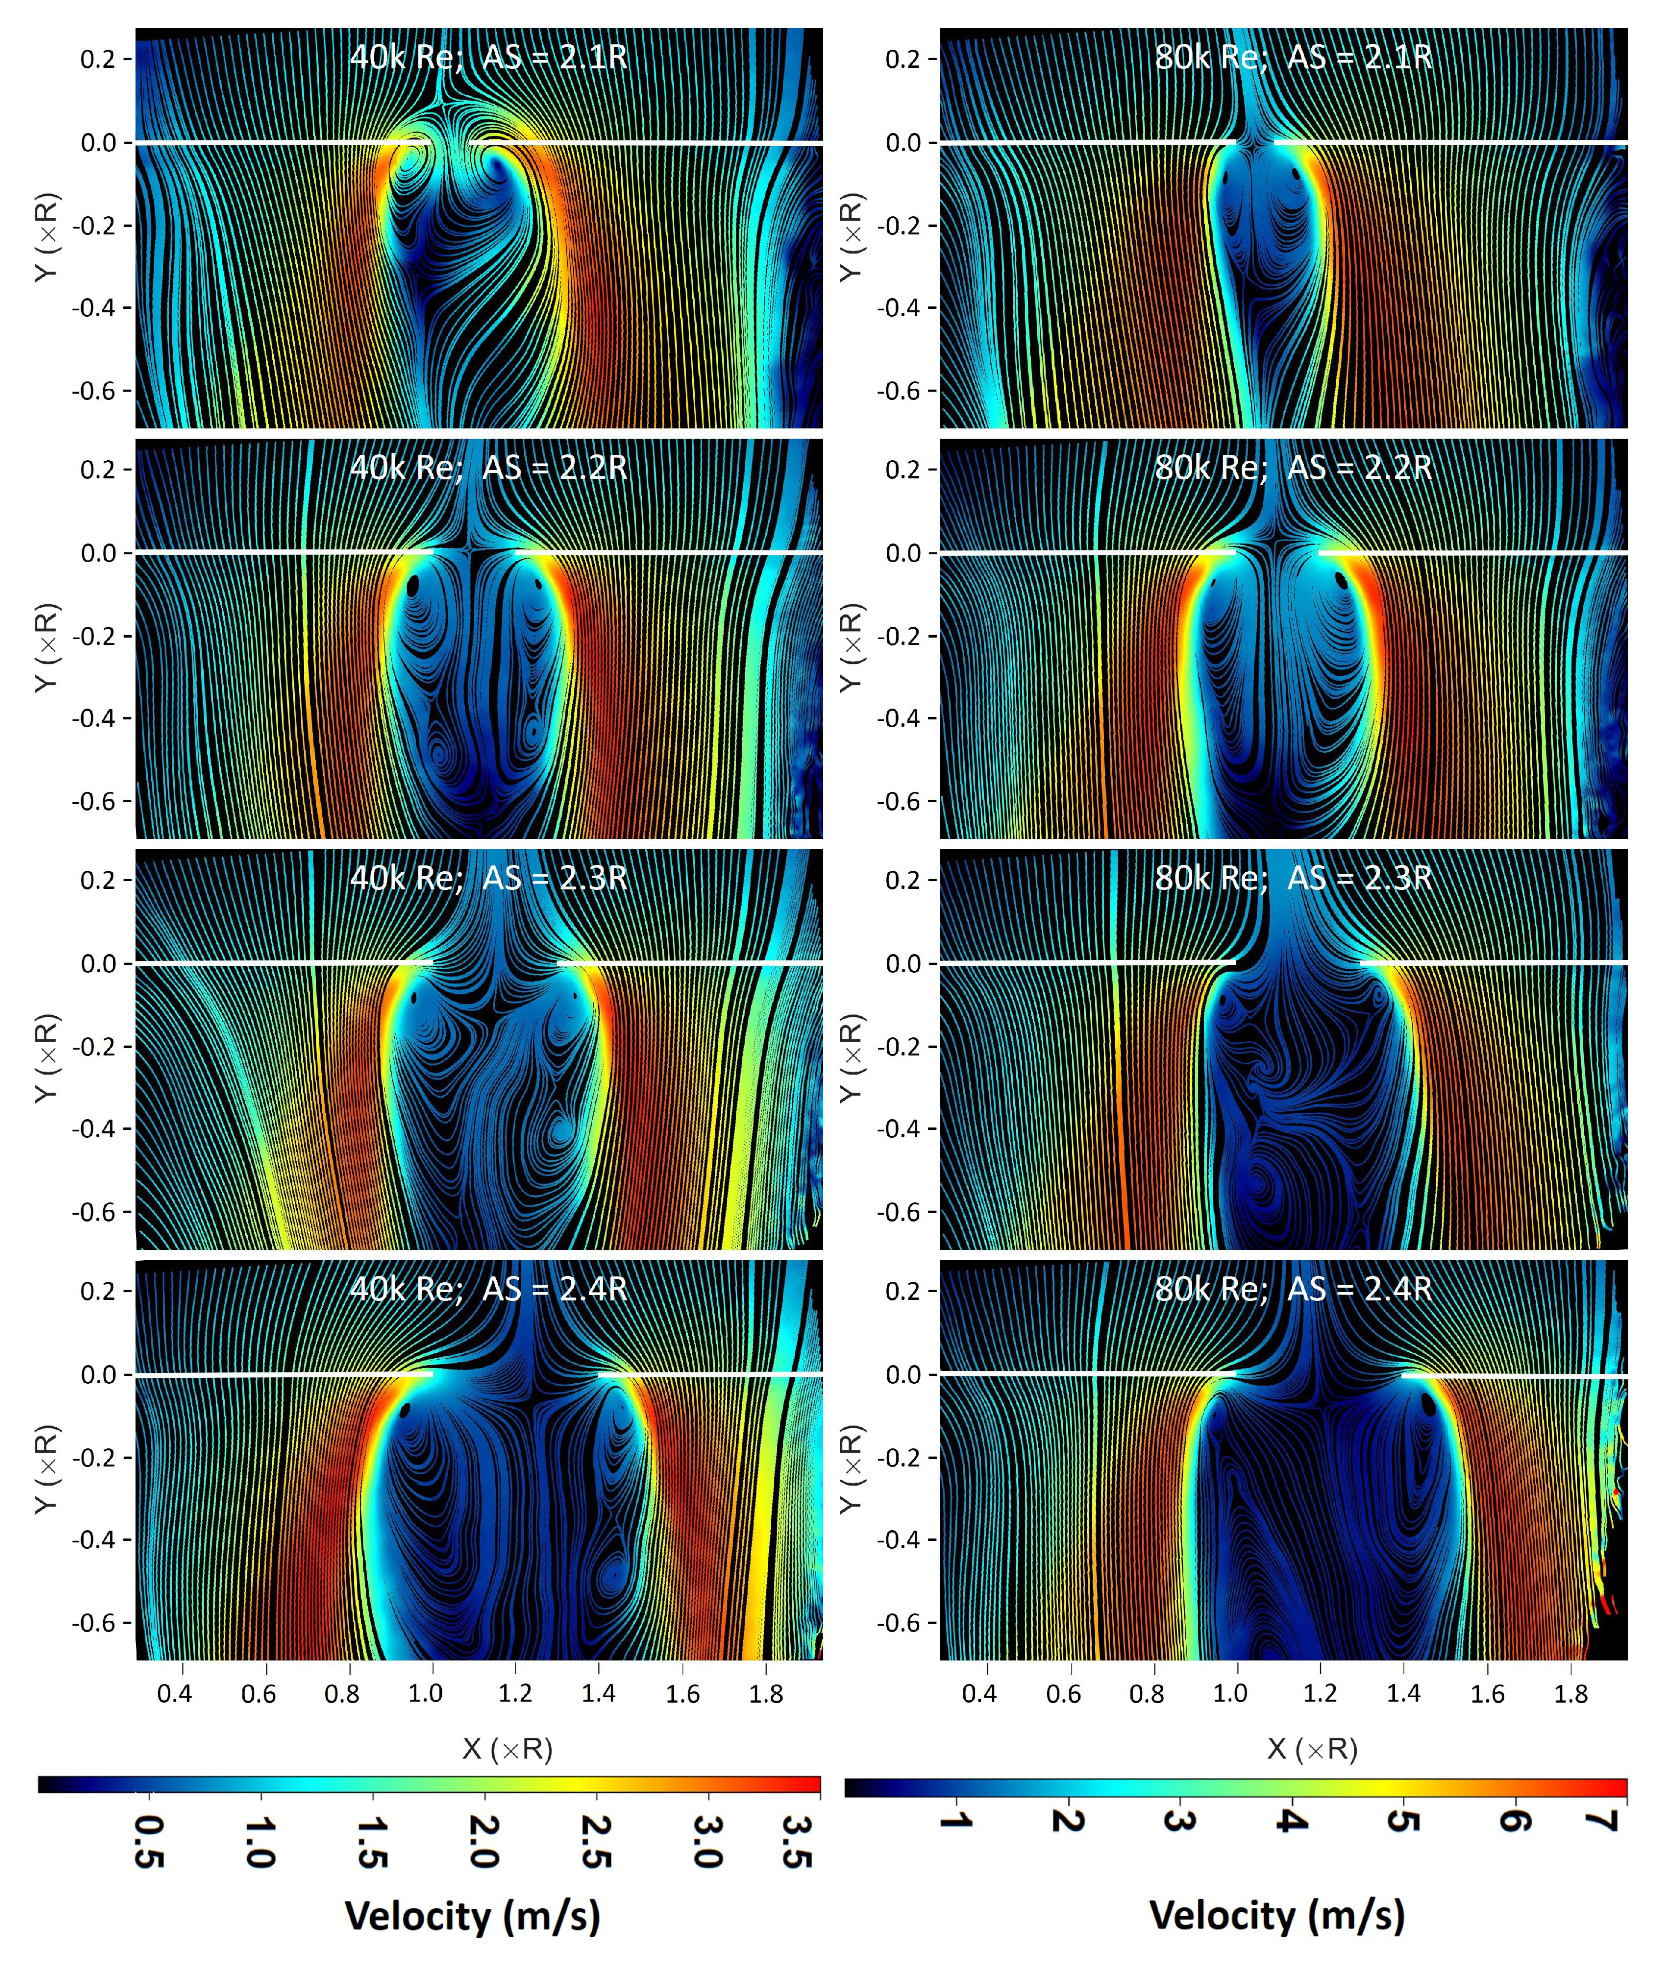
The mean velocity field presented here was obtained after time averaging 200 instantaneous velocity fields. The streamline plots for all cases in Figure 5 show how the overall flow develops around the rotors. The white lines in the plots represent the rotors.
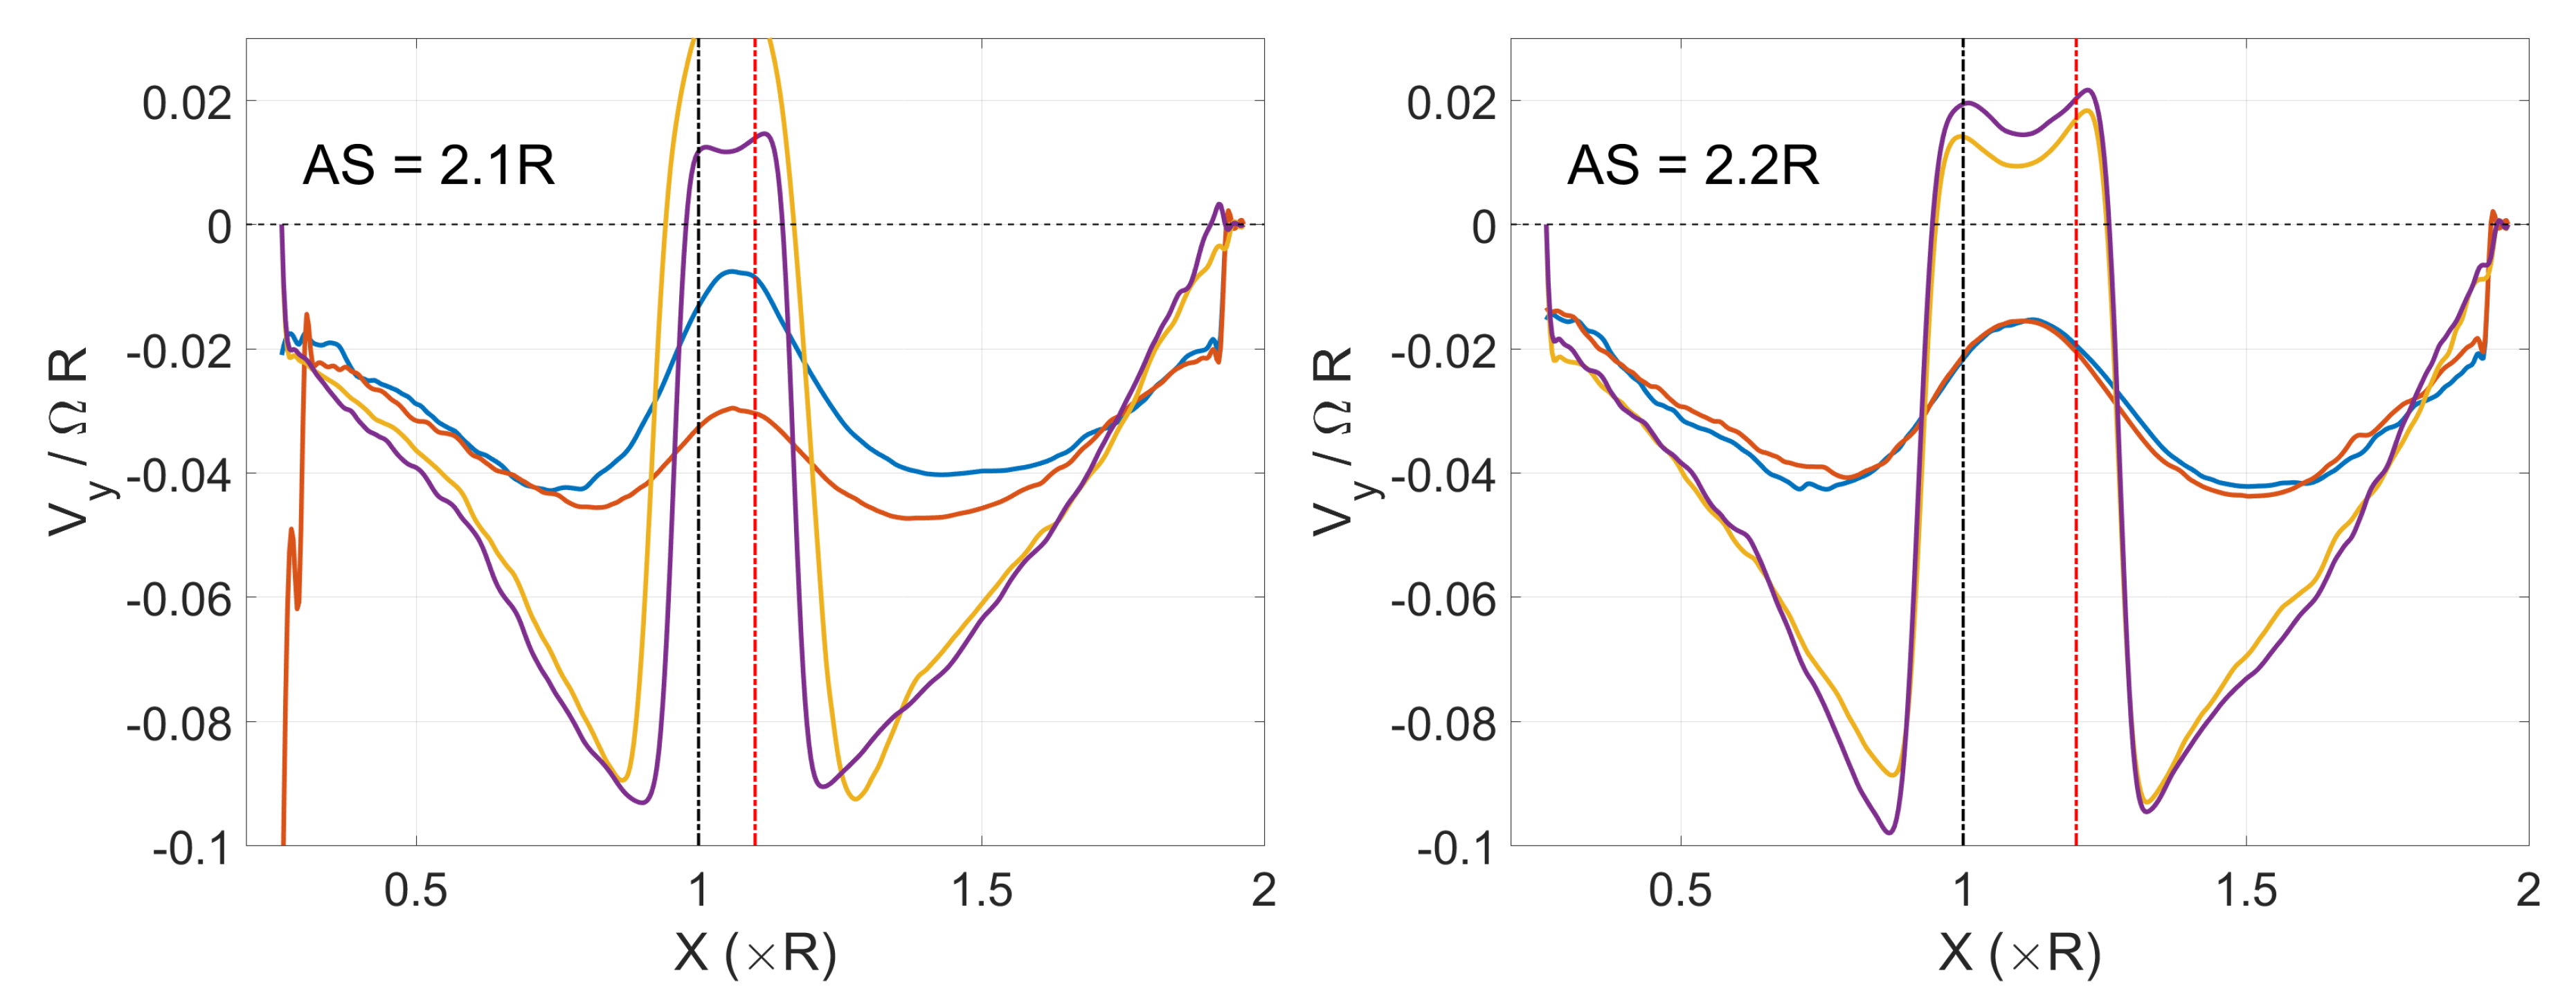
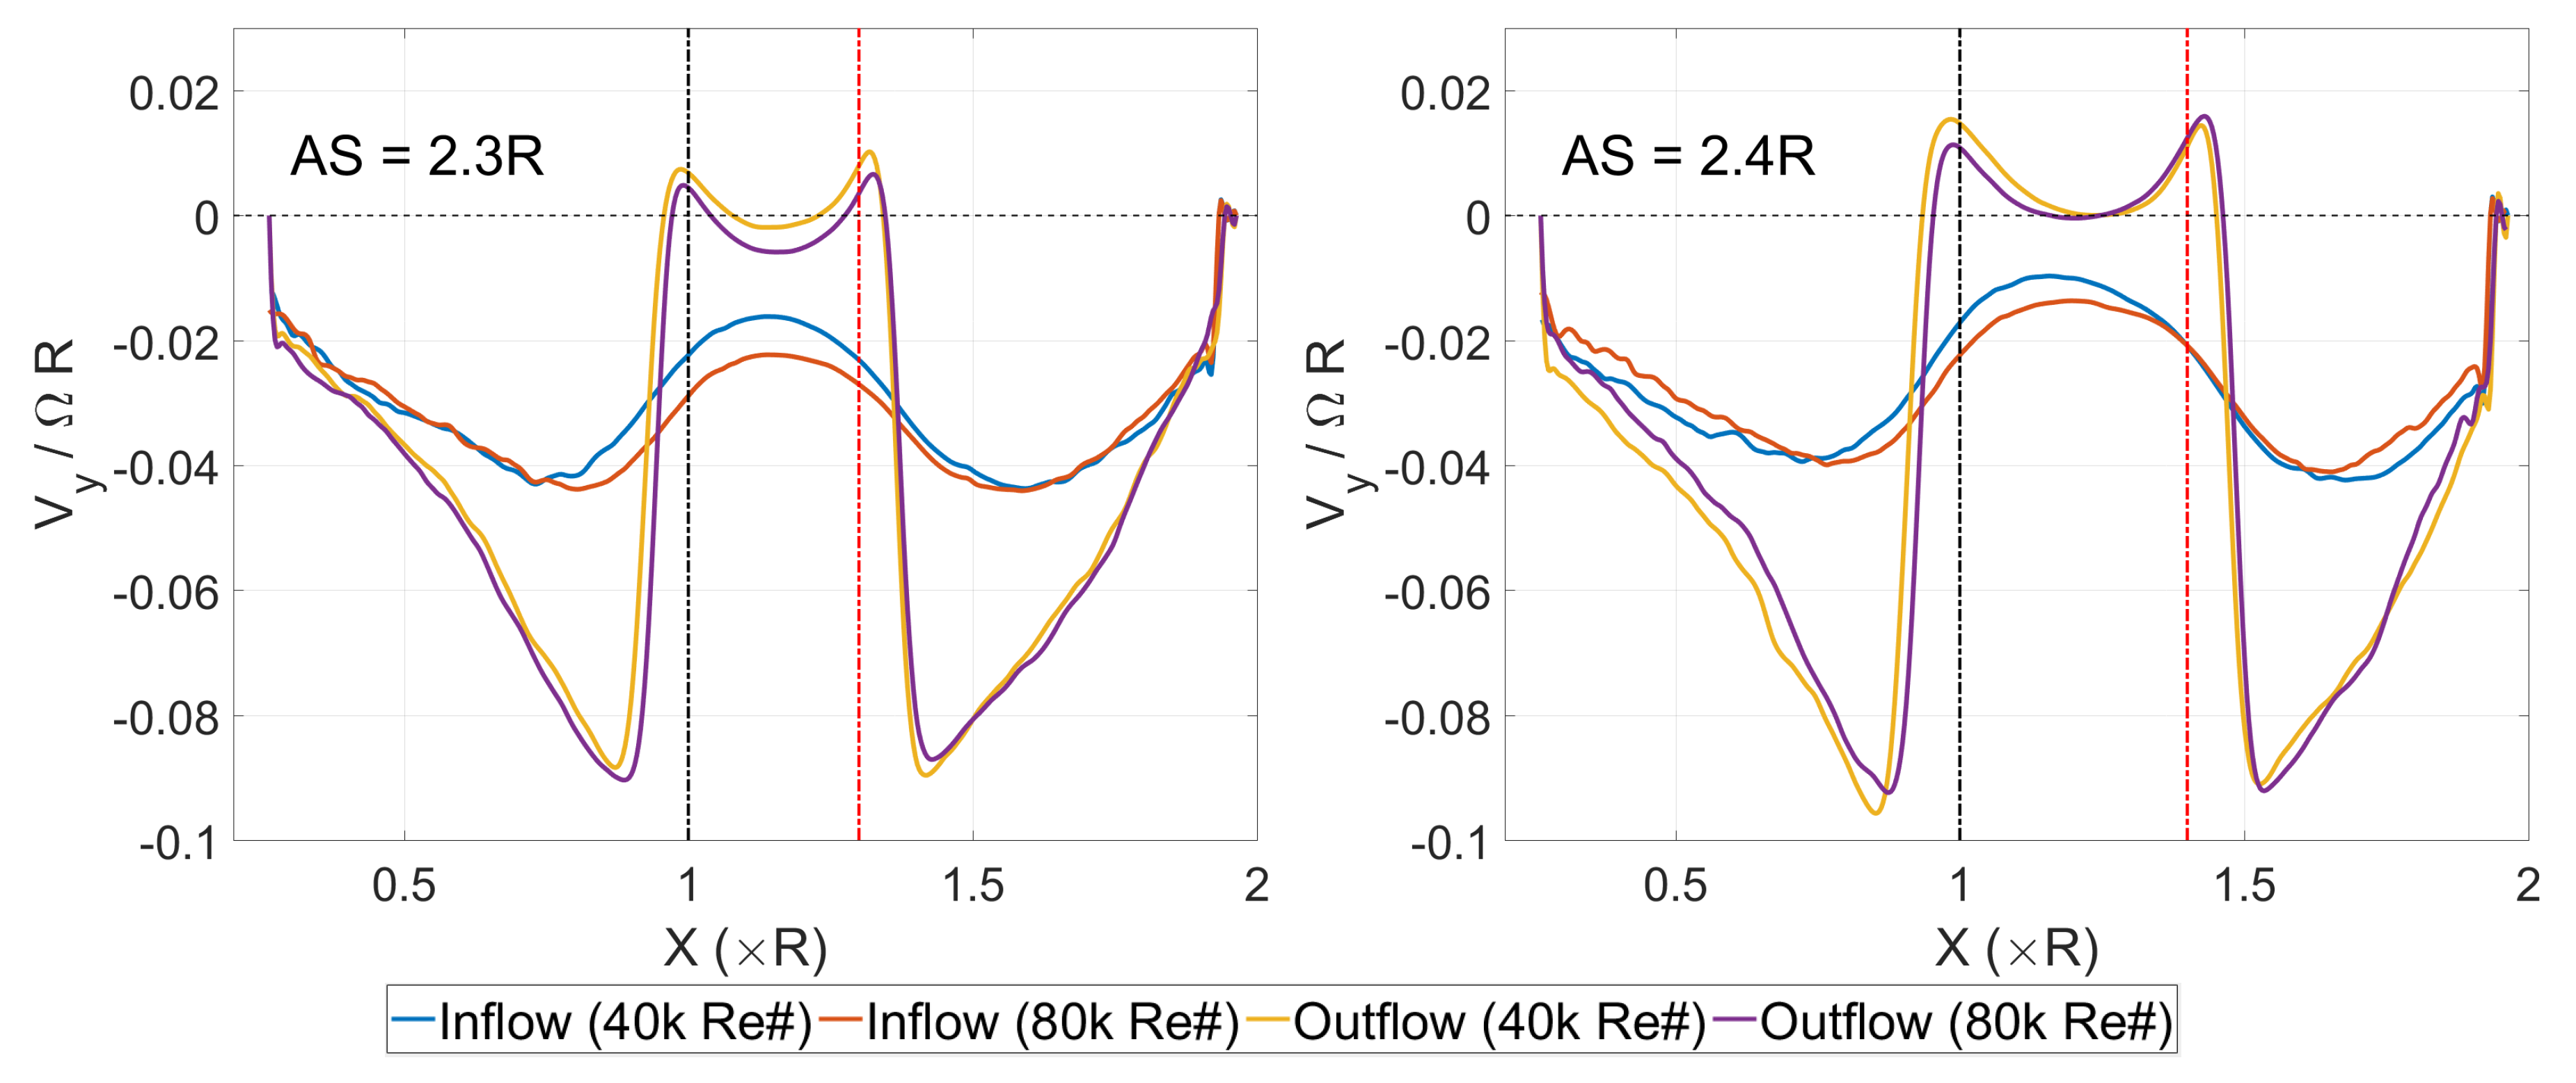
Figure 6 contains plots of non-dimensionalized inflow and outflow velocity profiles extracted at a distance of 0.1R from the rotor plane. Here, outflow velocity is being referred to the axial flow right below the rotors, indicating flow going out of the rotor plane. The three velocity field components from SPIV measurements were interpolated three folds before extracting the profile for obtaining smoother curves. The red and black vertical dotted lines mark location of the left and right rotor edges to help understand the velocity profiles w.r.t. location of the rotors. Inflow and outflow velocity profiles are useful in estimating contribution of different sections of rotor disk in imparting momentum to the flow, and hence in generating thrust.
4. Discussion
Starting with the figure of merit plot in Figure 3, it is seen than the 80k Re cases do not show any noticeable variation in FM over the range of axis shifts. However, the FM of 40k Re cases tends to increase slightly with increase in distance between the rotors. This slight increase for 40k Re cases too is significant only for AS ≤ 2.3R after which it is approximately similar to 80k Re cases.
Studying the instantaneous vorticity contour plots in Figure 4, it is observed that the rotor tip vortices due to the two adjacent rotors interact with each other for small axis shift values. The tip vortices are seen to deviate from the trajectories expected in a typical rotor wake. They lose their coherent structure in about a rotor rotation and get split into small spots of high vorticity in the region between the rotor wakes. Very often, consecutive tip vortices from the same rotor are seen to roll about each other after getting disturbed from their trajectory by velocity induced by vortices from the neighboring rotor. The direction of vortex roll-up is same as the direction of vorticity in the vortices. These pairs of vortices eventually merge and then split into spots of high vorticity soon after.
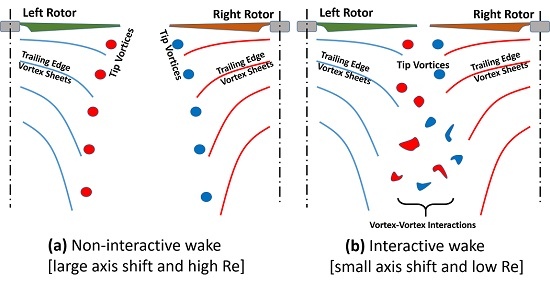
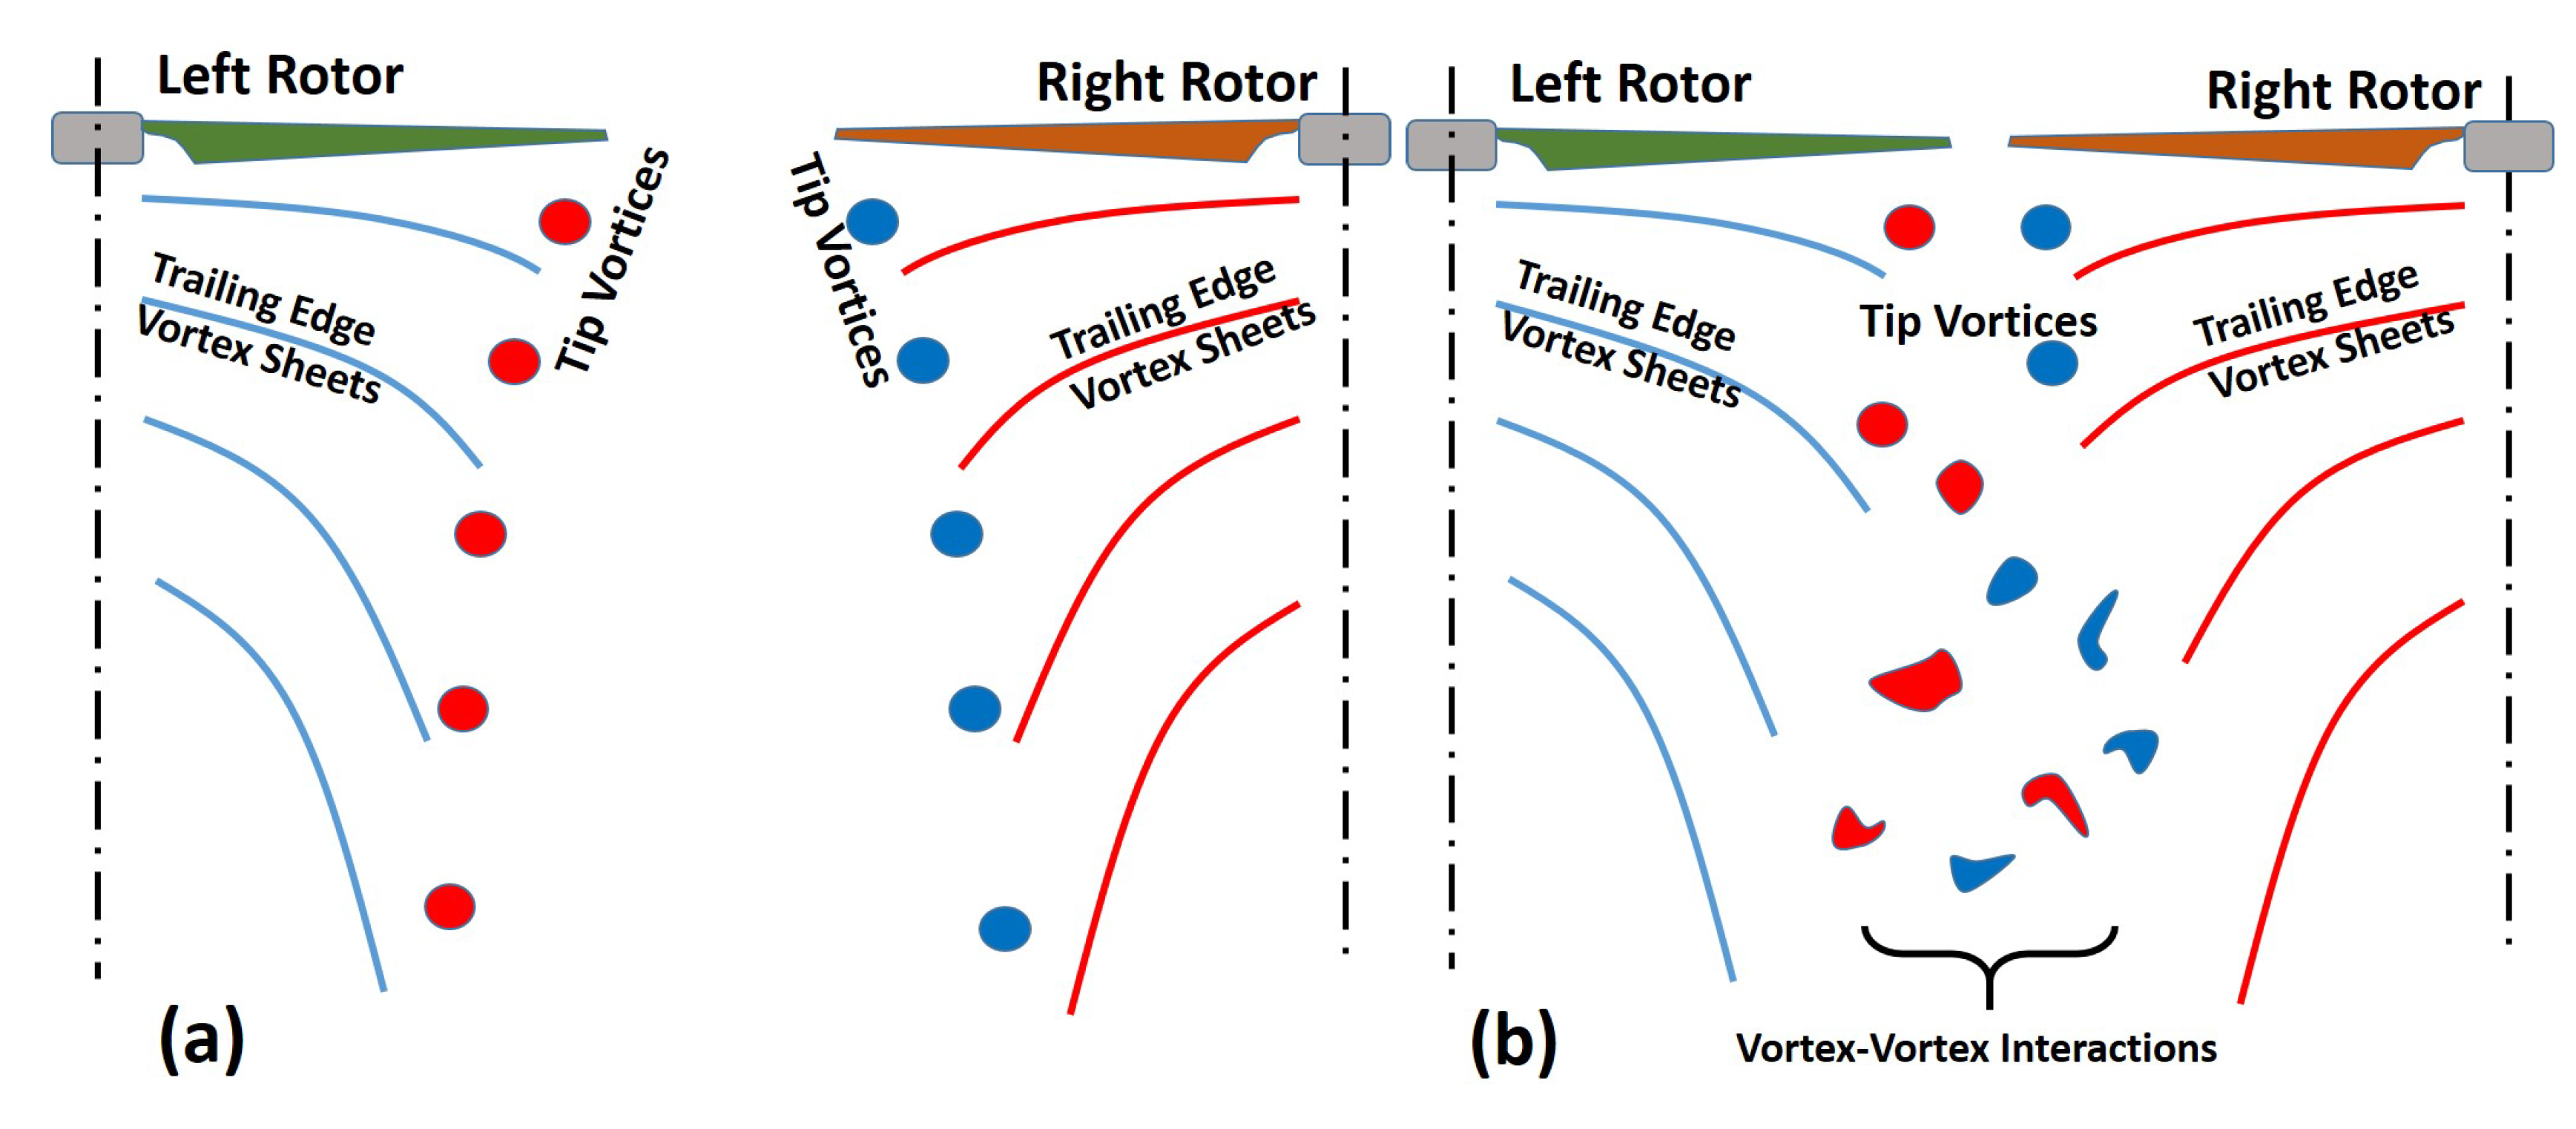
Such wake interactions are relatively higher for 40k Re cases compared to 80k Re cases. With increase in axis shift, the trajectories of tip vortices tend to get more predictable and the region between rotor wakes become free of sporadic flow. Lesser wake interactions at higher axis shifts is in a way obvious and expected as velocity induced by vortices decay by a factor of square of distance outside the solid body rotation core area. The wake should in principle become like that of a single isolated rotor as axis shift tends to infinity. Figure 7 contains explanatory sketches for the instantaneous vorticity contour plots in Figure 4, depicting behaviour of major wake features under a separate range of conditions.
The low Re cases see more wake interactions probably because the tip vortices are weaker in terms of circulation and the downwash convecting them downward is also low. These slow moving vortices with low circulation are more vulnerable to velocities induced by flow features in close proximity such as vortices from the neighboring rotor. At high Re (and hence higher thrust values), the vortices are stronger and they also get lesser time to get affected by other disturbances due to stronger downwash. The relative strength of vortices can be judged by comparing vorticity magnitudes in the instantaneous vorticity contour plots. The time-averaged rotor outflow velocity gradient near the rotor tip is apparent through the plots in Figure 6, which is also indirectly indicative of the vortex strengths in the two Re cases.
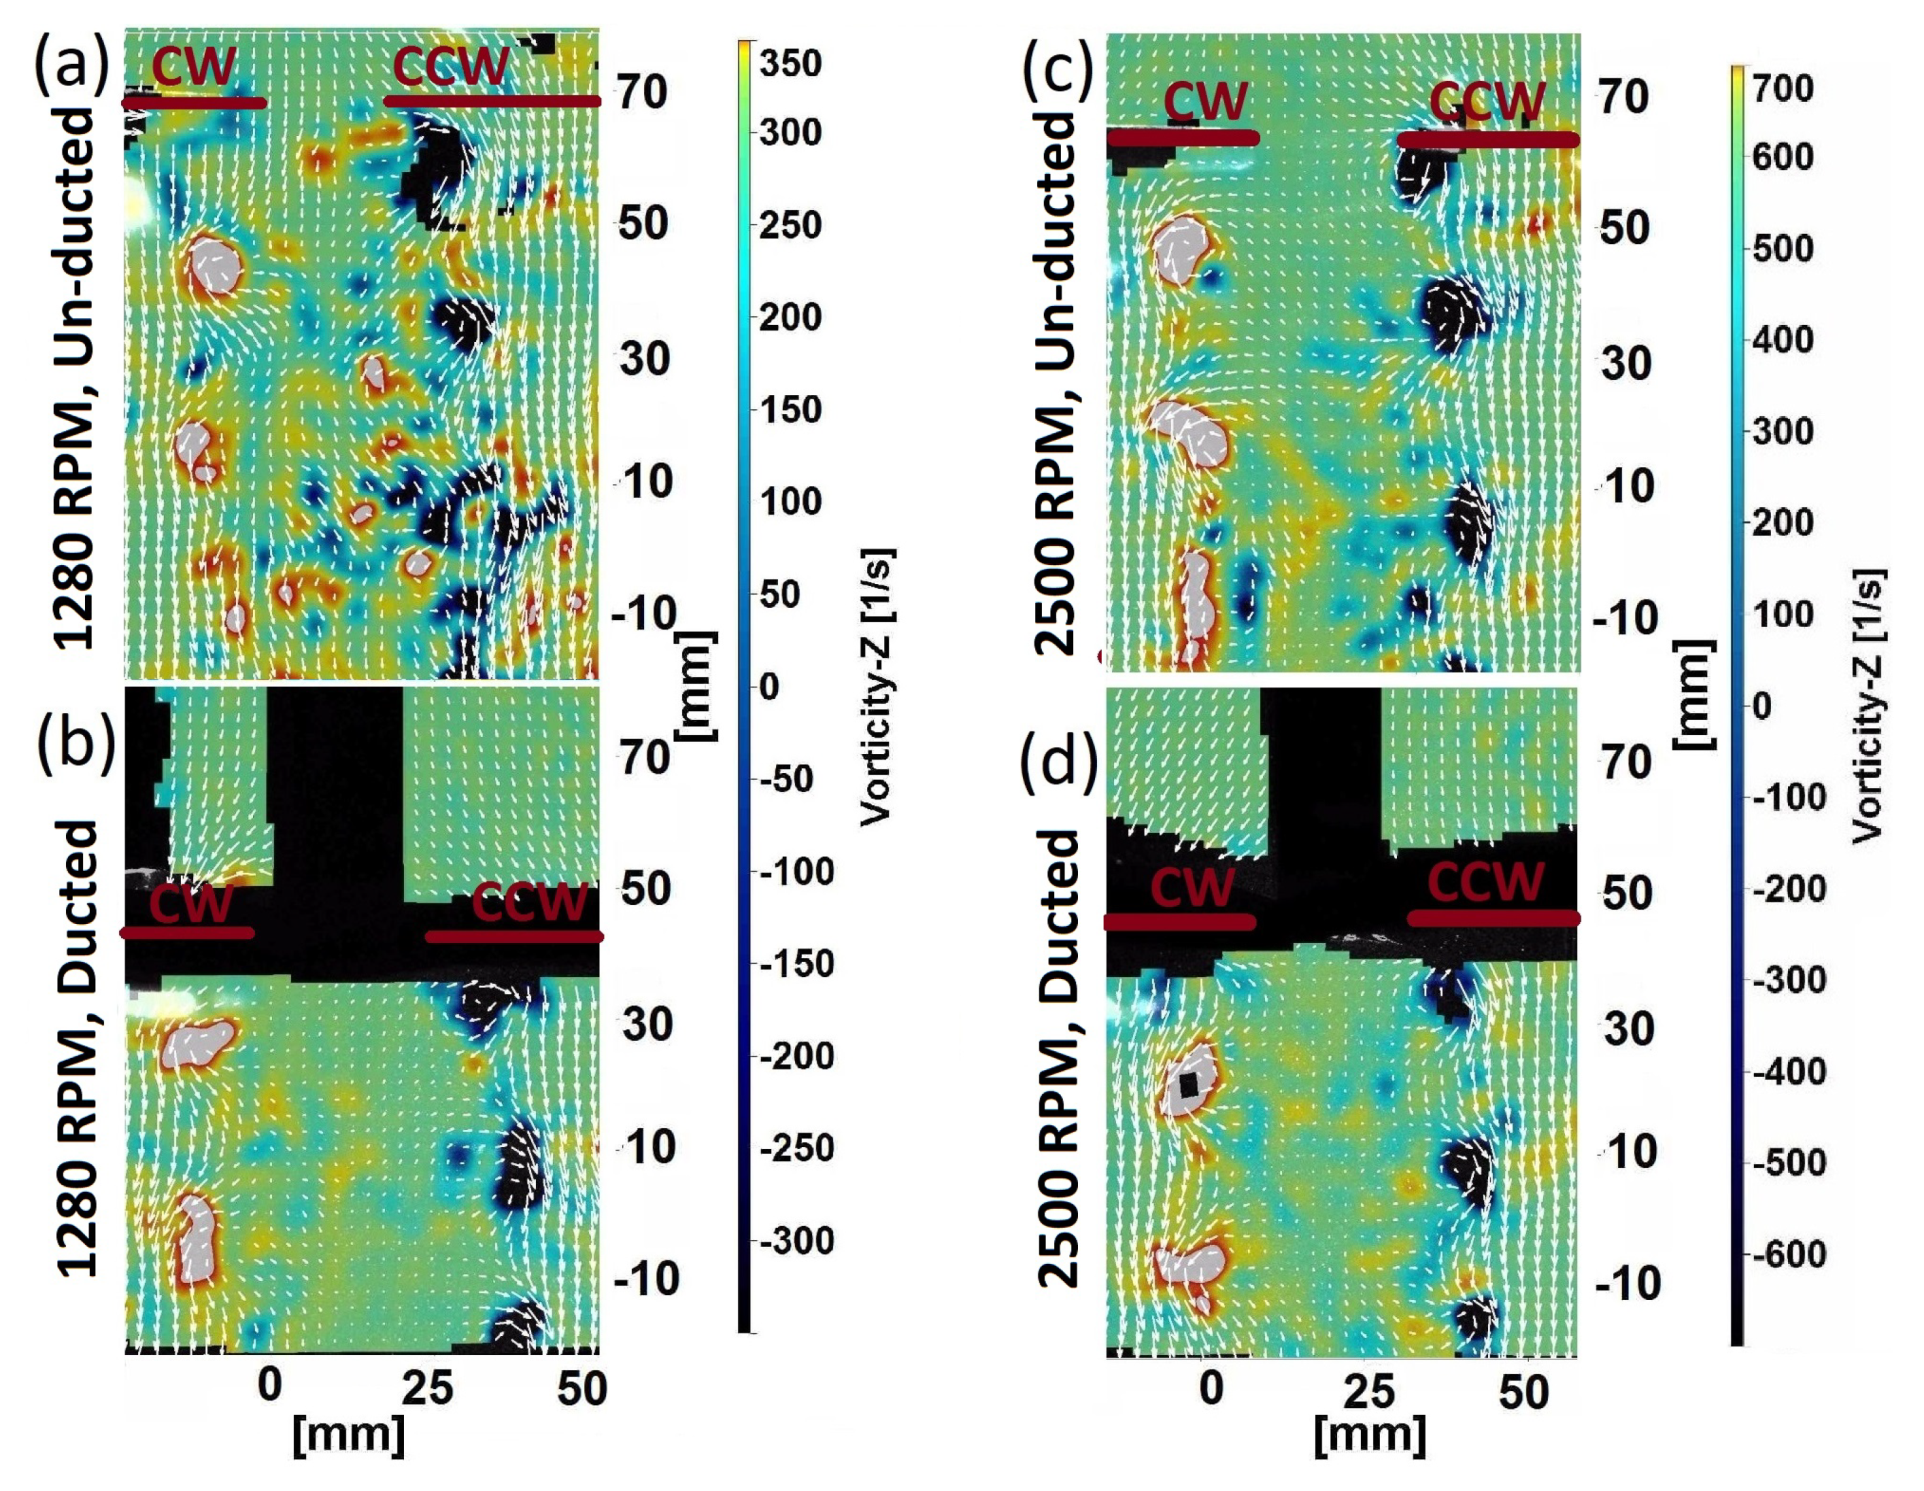
Similar observations were made regarding relatively higher wake interactions for low Re cases in the previous work on quadrotor [23] where the Re 8630 test case (1280 RPM) showed significantly higher wake interactions compared to Re 16,856 case (2500 RPM) as seen in the Figure 8. The FM for the lower Re case was also much lower than the other two higher Re cases (see Table 2) just like it is in the current study where the FM is lower for 40k Re cases at low AS. It is possible that the low rotor performance at small axis shifts at low Re is because of flow that is induced over the blades by interaction with tip vortex cores of the adjacent rotor. Tip vortex cores are known to be larger in size for low Re rotors [25]. If interactions of rotor blades with adjacent rotor tip vortices is a factor, then phase difference between the rotors should also play an important role in performance. Verifying that will need a setup where the rotors are mechanically linked to allow locking their phase with respect to each other.
Comparing FM data of the current bi-rotor tests in Figure 3 with those from the previous tests on quadrotor in Table 2, it can be noticed that rotors in the current tests perform worse than the quadrotor rotors despite being operated at a much higher Re. The biggest difference between the two setups (other than size) is blade geometry (which is described in the Table 3). The blades used in the current setup are symmetric and more like those for large scale helicopters whereas the quadrotor blades are highly cambered. Such highly cambered blades are ideal for low Reynolds number rotors only where the viscous skin friction drag is high enough to afford highly cambered airfoil designs which otherwise would have caused a much larger share of pressure drag.
It is noticed from the streamline plots in Figure 5 that the mean rotor wakes from the two rotors tend to stay farther away from each other for 80k Re cases hinting towards lower wake interactions at higher Re apparent from the instantaneous vorticity contour plots as well. As the Axis shift increases, the flow around the rotors slowly tend to be similar to that expected for an isolated rotor, with 80k Re cases leading the change. The streamline plot for Re 40k, AS = 2.1R is noticeably different from the rest. The first plot shows high velocity magnitudes in the region between the two rotor wakes due to inter-rotor wake interactions, and the streamlines in the last plot (Re 40k, AS = 2.4R) are as if results from two isolated rotors are put side-by-side. All other cases in between show how the interactive rotors evolve with axis shift and Re into two isolated rotors in terms of mean flow.
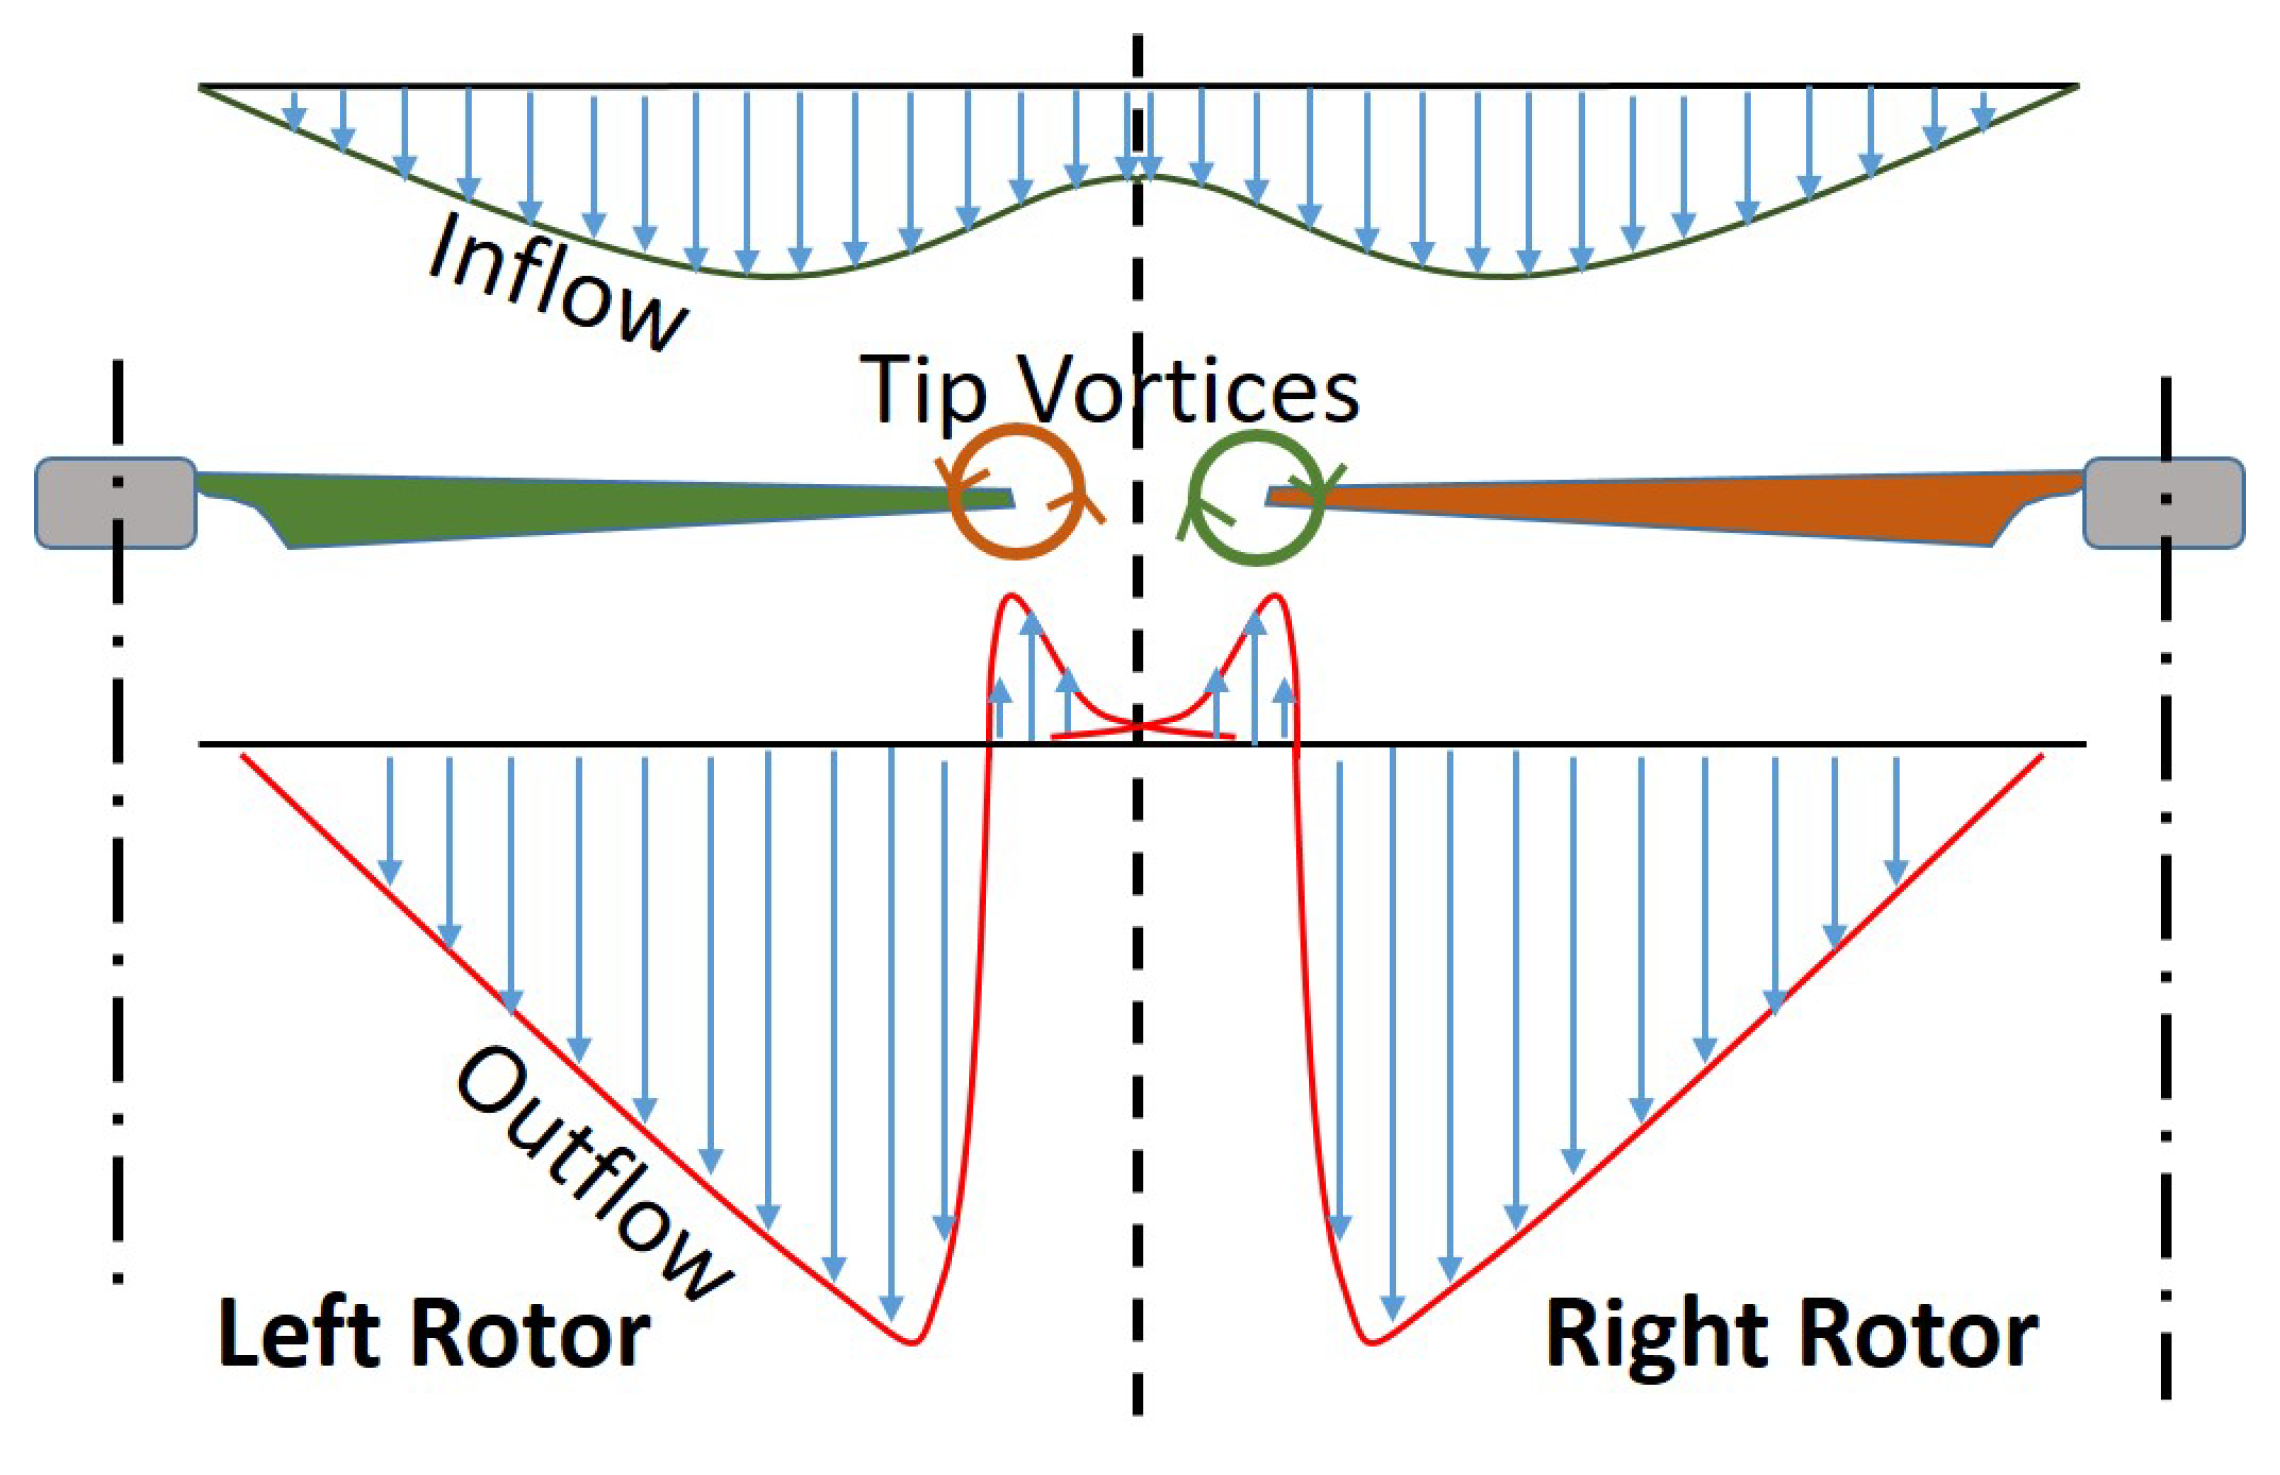
The inflow and outflow profile plots in Figure 6 contain some common features among cases. Outflow profiles under both rotors are wedge-shaped with velocity magnitude increasing while going from rotor hub to tip, and dropping back to zero steeply right before the tip. The peak in outflow velocity profile is consistently found close to r = 0.9R span-wise location for both rotors for all cases except Re 40k AS = 2.1R where it is seen to be slightly inboard (close to the hub). Such a wedge-shaped feature is common for most rotors, especially if the blades are simple rectangular blades like the ones in this study. As mentioned earlier, inflow and outflow profiles provide an estimate of thrust generated by different sections of rotor, and hence their shape is dependent on rotor blade geometry (taper and twist). Inflow velocity profiles peak around r = 0.75R (and slightly inboard for Re 40k AS = 2.1R case). The outflow velocity profile peaks are much sharper than the inflow velocity peak due to sudden thrust drop near blade tip and the resultant tip vortices.
It should be noted that the velocity profiles, which are non-dimensionalized using rotor tip speed, are almost exactly same for the two Re for AS = 2.2R, 2.3R, and 2.4R. This may mean that at least in this Re range, Re does not have any significant effect on the way inflow and and outflow velocities get induced when the rotors are farther than 2.2R. Out of the two cases on the AS = 2.1R plot, the 80k Re curves still look similar to the other axis shift cases but the 40k Re plots have higher upward directed inflow and outflow velocities between the rotors. But for all cases within the range, it should be possible to come up with a rough estimate of the velocity profiles, and hence span-wise thrust distribution on side-by-side rotors based on the presented results. Figure 9 is a sketch of a typical side-by-side rotor inflow and outflow velocity profiles based on the mean velocity profiles for the test cases presented in Figure 6.
The information on outflow or downwash velocity profiles is also instrumental in deciding on fuselage and payload placement under a UAV while designing it. The objective being to minimize download on the rest of the structure and payload from the rotor downwash to reduce rotor thrust lost in internal force.
5. Conclusions
The interactions between wakes of two side-by-side rotors as a function of distance between the rotors and their Re were looked at from instantaneous as well as mean flow field perspective in this study. A dip in performance was observed for cases with rotors very close to each other at low Re. It was hypothesized that the interaction of rotor blades with the tip vortex cores of the neighboring rotor blades at small axis shifts could be a reason for the effect on efficiency. However, more focused tests are needed to confirm this. The instantaneous flow field measurements indicated high inter-rotor wake interactions for small axis shifts causing rotor wake features to distort, lose coherent form and deviate from their typical trajectories.
The time-averaged streamline and inflow–outflow velocity profiles brought out commonality among the range of tests in this study. Prominent instantaneous flow features and mean velocity profile traits were identified for the test cases which are expected to guide rotor wake and performance estimates on a wider range of vehicle designs and flight conditions.
Briefly summarizing the key findings:
- Very close proximity of adjacent rotors adversely affects rotor performance
- Blade–vortex interaction hypothesized to be a reason behind the noticed effect on performance.
- High inter-rotor wake interaction observed for close proximity rotors at low Reynolds numbers.
- Similarities observed in instantaneous and mean flow fields for the range of tested conditions, useful in extending the understanding to a wider range of vehicle configurations.
Author Contributions
Conceptualization, D.S. and N.K.; Data curation, D.S.; Formal analysis, D.S.; Funding acquisition, N.K.; Investigation, D.S.; Methodology, D.S.; Project administration, D.S. and N.K.; Resources, N.K.; Software, D.S.; Supervision, N.K.; Validation, D.S.; Visualization, D.S.; Writing–original draft, D.S.; Writing–review and editing, D.S. and N.K.
Funding
This research was partially funded by the Government under Agreement No. W911W6-17-2-0002. The U.S. Government is authorized to reproduce and distribute reprints for Government purposes notwithstanding any copyright notation thereon. The U.S. Government technical monitor is Dr. Mahendra Bhagwat. The views and conclusions contained in this document are those of the authors and should not be interpreted as representing the official policies, either expressed or implied, of the Aviation Development Directorate or the U.S. Government.
Acknowledgments
We would like to thank the team of undergraduate researchers in the Experimental Aerodynamics lab at Georgia Tech for their assistance in conducting tests, and Georgia Tech A.E. Machine shop for their guidance in building the setup.
Conflicts of Interest
The authors declare no conflict of interest. The funders had no role in the design of the study; in the collection, analyses, or interpretation of data; in the writing of the manuscript, or in the decision to publish the results.
Abbreviations
| AS | Axis shift. |
| c | Blade chord. |
| R | Rotor radius. |
| r | Spanwise radial location. |
| Rotor angular velocity. | |
| Density of air. | |
| Dynamic viscosity of air. |
References
- González-Jorge, H.; Martínez-Sánchez, J.; Bueno, M. Unmanned aerial systems for civil applications: A review. Drones 2017, 1, 2. [Google Scholar] [CrossRef]
- Floreano, D.; Wood, R.J. Science, technology and the future of small autonomous drones. Nature 2015, 521, 460. [Google Scholar] [CrossRef] [PubMed]
- Hassanalian, M.; Abdelkefi, A. Classifications, applications, and design challenges of drones: A review. Prog. Aerospace Sci. 2017, 91, 99–131. [Google Scholar] [CrossRef]
- Bohorquez, F.; Pines, D. Hover Performance of Rotor Blades at Low Reynolds Numbers for Rotary Wing Micro Air Vehicles. An Experimental and CFD Study; AIAA Paper: Reston, VA, USA, 2003; Volume 3930, p. 2003. [Google Scholar]
- Bohorquez, F. Rotor Hover Performance and System Design of an Efficient Coaxial Rotary Wing Micro Air Vehicle. Ph.D. Thesis, University of Maryland, College Park, MD, USA, 2007. [Google Scholar]
- Hein, B.R.; Chopra, I. Hover performance of a Micro Air Vehicle: Rotors at low Reynolds number. J. Am. Helicopter Soc. 2007, 52, 254–262. [Google Scholar] [CrossRef]
- Kunz, P.J.; Strawn, R.C. Analysis and design of rotors at ultra-low Reynolds numbers. In Proceedings of the 40th AIAA Aerospace Sciences Meeting, Reno, NV, USA, 14–17 January 2002. [Google Scholar]
- Rubio, O.; Gutiérrez, F.; Zuñiga, J.C.; Funes-Gallanzi, M. Low-Re μUAV Rotor Design. In Fluid Dynamics in Physics, Engineering and Environmental Applications; Springer: Berlin, Germany, 2013; pp. 489–500. [Google Scholar]
- Lakshminarayan, V.K.; Bush, B.L.; Duraisamy, K.; Baeder, J.D. Computational investigation of micro hovering rotor aerodynamics. In Proceedings of the 24th AIAA Applied Aerodynamics Conference, San Francisco, CA, USA, 5–8 June 2006; pp. 5–8. [Google Scholar]
- Lakshminarayan, V.K.; Baeder, J.D. Computational investigation of micro hovering rotor aerodynamics. J. Am. Helicopter Soc. 2010, 55, 22001. [Google Scholar] [CrossRef]
- Schroeder, E.J.; Baeder, J.D. Using computational fluid dynamics for micro-Air vehicle airfoil validation and prediction. In Proceedings of the 23rd AIAA Applied Aerodynamics Conference, Toronto, ON, Canada, 7–8 June 2005. [Google Scholar]
- Schroeder, E.J. Low Reynolds Number Flow Validation Using Computational Fluid Dynamics with Application to Micro Air Vehicles; University of Maryland: College Park, MD, USA, 2005. [Google Scholar]
- Radhakrishnan, A.; Schmitz, F. An experimental investigation of a quad tilt rotor in low speed forward flight. In Proceedings of the 4th Decennial Specialists’ Conference on Aeromechanics, American Helicopter Society, San Francisco, CA, USA, 21–23 January 2004. [Google Scholar]
- Ramasamy, M. Measurements comparing hover performance of single, coaxial, tandem, and tilt-rotor configurations. In Proceedings of the 69th AHS Annual Forum, Phoenix, AZ, USA, 21–23 May 2013. [Google Scholar]
- Griffiths, D. A study of dual-rotor interference and ground effect using a free-vortex wake model. In Proceedings of the AHS International 58th Annual Forum, Montreal, QC, Canada, 11–13 June 2002; Volume 1, pp. 592–612. [Google Scholar]
- Gupta, V.; Baeder, J.D. Quad Tilt Rotor Aerodynamics in Helicopter Mode. In Annual Forum Proceedings; American Helicopter Society, Inc.: Fairfax, VA, USA, 2005; Volume 61, p. 416. [Google Scholar]
- Lee, J.; Yee, K.; Oh, S. Aerodynamic characteristic analysis of multi-rotors using a modified free-wake method. Trans. Jpn. Soc. Aeronaut. Space Sci. 2009, 52, 168–179. [Google Scholar] [CrossRef]
- Rajagopalan, R.G.; Baskaran, V.; Hollingsworth, A.; Lestari, A.; Garrick, D.; Solis, E.; Hagerty, B. RotCFD-A Tool for Aerodynamic Interference of Rotors: Validation and Capabilities. In Proceedings of the Future Vertical Lift Aircraft Design Conference, San Francisco, CA, USA, 18–20 January 2012. [Google Scholar]
- Yoon, S.; Lee, H.C.; Pulliam, T.H. Computational Analysis of Multi-Rotor Flows. In Proceedings of the 54th AIAA Aerospace Sciences Meeting, San Diego, CA, USA, 4–8 January 2016; p. 0812. [Google Scholar]
- Huang, H.; Hoffmann, G.M.; Waslander, S.L.; Tomlin, C.J. Aerodynamics and control of autonomous quadrotor helicopters in aggressive maneuvering. In Proceedings of the IEEE International Conference on Robotics and Automation (ICRA’09), Kobe, Japan, 12–17 May 2009; pp. 3277–3282. [Google Scholar]
- Carroll, T.; George, I.R.E.; Bramesfeld, G. Design Optimization of Small Rotors in Quad-Rotor Configuration. In Proceedings of the 54th AIAA Aerospace Sciences Meeting, San Diego, CA, USA, 4–8 January 2016; p. 1788. [Google Scholar]
- Shukla, D.; Hiremath, N.; Komerath, N. Aerodynamic Interactions Study on Low-Re Coaxial and Quad-Rotor Configurations. In Proceedings of the ASME International Mechanical Engineering Conference & Exposition IMECE2017, Tampa, FL, USA, 3–9 November 2017. [Google Scholar]
- Shukla, D.; Hiremath, N.; Komerath, N.M. Low Reynolds Number Aerodynamics Study on Coaxial and Quad-Rotor. In Proceedings of the 2018 Applied Aerodynamics, AIAA Aviation and Aeronautics Forum and Exposition, Atlanta, GA, USA, 25–29 June 2018; p. 4118. [Google Scholar]
- Sciacchitano, A.; Neal, D.R.; Smith, B.L.; Warner, S.O.; Vlachos, P.P.; Wieneke, B.; Scarano, F. Collaborative framework for PIV uncertainty quantification: Comparative assessment of methods. Meas. Sci. Technol. 2015, 26, 074004. [Google Scholar] [CrossRef]
- Ramasamy, M.; Leishman, J.G.; Lee, T.E. Flowfield of a rotating-wing micro air vehicle. J. Aircr. 2007, 44, 1236–1244. [Google Scholar] [CrossRef]
Figure 1.
A photograph of the bi-rotor setup.

Figure 2.
SPIV measurement plane location.

Figure 3.
Figure of Merit plot for all test cases.

Figure 4.
Instantaneous vorticity contour plots.


Figure 5.
Average flow field streamline plots.

Figure 6.
Average flow field inflow and outflow velocity profiles.


Figure 7.
Instantaneous flow field plot concept sketches for (a) High Re or large axis shifts (b) Low Re or small axis shifts.
Figure 7.
Instantaneous flow field plot concept sketches for (a) High Re or large axis shifts (b) Low Re or small axis shifts.


Figure 9.
Mean inflow and outflow concept sketches.


Table 1.
Setup and test conditions bi-rotor experiments.
| Rotor | |
| # of rotors | 2 |
| # of blades per rotor | 2 |
| Radius (R) | 0.136 m |
| Root cutout radius | 0.021 m |
| Airfoil | NACA 0010 |
| Blade planform | Constant chord, Untwisted |
| Chord length (c) | 0.019 m |
| Blade pitch angle () | Variable |
| Test Conditions | |
| Rotor tip Re # | 40,000, 80,000 |
| AS | 2.1, 2.2, 2.3, 2.4, |
| 2.5 (performance only) | |
| 0.004 (average per rotor) | |
Table 2.
FM for quadrotor tests taken from [23].
Table 2.
FM for quadrotor tests taken from [23].
| Case | FM | Case | FM |
|---|---|---|---|
| Un-ducted, 1280 RPM | 0.29 | Ducted, 1280 RPM | 0.43 |
| Un-ducted, 2500 RPM | 0.46 | Ducted, 2500 RPM | 0.50 |
| Un-ducted, 3500 RPM | 0.45 | Ducted, 3500 RPM | 0.47 |
Table 3.
Description of the quadrotor setup used in experiments in [23].
Table 3.
Description of the quadrotor setup used in experiments in [23].
| Parameter | Value | Parameter | Value |
|---|---|---|---|
| Radius (R) | 66 mm | Blade planform | Untwisted, Tapered |
| Camber | 14% | Chord length (c) | 19.5 mm @ r/R = 0.2 |
| 15.3 mm @ r/R = 1 | |||
| Blade thickness | 7% | Blade pitch angle () | |
| Adjacent rotor axis shift (AS) | 160 mm | Duct radius | 73 mm |
© 2018 by the authors. Licensee MDPI, Basel, Switzerland. This article is an open access article distributed under the terms and conditions of the Creative Commons Attribution (CC BY) license (http://creativecommons.org/licenses/by/4.0/).
Share and Cite
MDPI and ACS Style
Shukla, D.; Komerath, N. Multirotor Drone Aerodynamic Interaction Investigation. Drones 2018, 2, 43. https://doi.org/10.3390/drones2040043
AMA Style
Shukla D, Komerath N. Multirotor Drone Aerodynamic Interaction Investigation. Drones. 2018; 2(4):43. https://doi.org/10.3390/drones2040043
Chicago/Turabian StyleShukla, Dhwanil, and Narayanan Komerath. 2018. "Multirotor Drone Aerodynamic Interaction Investigation" Drones 2, no. 4: 43. https://doi.org/10.3390/drones2040043