Rapid Assessment of Ecological Integrity for LTER Wetland Sites by Using UAV Multispectral Mapping


1
Remote Sensing and GIS Laboratory (LAST-EBD), Estación Biologica de Doñana, CSIC, Avda. Américo Vespucio 26, 41092 Sevilla, Spain
2
Research Center for Systems Ecology and Sustainability, University of Bucharest, Spl. Independentei 91–95, 050095 Bucharest, Romania
*
Author to whom correspondence should be addressed.
Drones 2019, 3(1), 3; https://doi.org/10.3390/drones3010003
Submission received: 12 November 2018
/
Revised: 17 December 2018
/
Accepted: 19 December 2018
/
Published: 23 December 2018
(This article belongs to the Special Issue Drones for Biodiversity Conservation and Ecological Monitoring)
Abstract
:Long-term ecological research (LTER) sites need a periodic assessment of the state of their ecosystems and services in order to monitor trends and prevent irreversible changes. The ecological integrity (EI) framework opens the door to evaluate any ecosystem in a comparable way, by measuring indicators on ecosystem structure and processes. Such an approach also allows to gauge the sustainability of conservation management actions in the case of protected areas. Remote sensing (RS), provided by satellite, airborne, or drone-borne sensors becomes a very synoptic and valuable tool to quickly map isolated and inaccessible areas such as wetlands. However, few RS practical indicators have been proposed to relate to EI indicators for wetlands. In this work, we suggest several RS wetlands indicators to be used for EI assessment in wetlands and specially to be applied with unmanned aerial vehicles (UAVs). We also assess the applicability of multispectral images captured by UAVs over two long-term socio-ecological research (LTSER) wetland sites to provide detailed mapping of inundation levels, water turbidity and depth as well as aquatic plant cover. We followed an empirical approach to find linear relationships between UAVs spectral reflectance and the RS indicators over the Doñana LTSER platform in SW Spain. The method assessment was carried out using ground-truth data collected in transects. The resulting empirical models were implemented for Doñana marshes and can be applied for the Braila LTSER platform in Romania. The resulting maps are a very valuable input to assess habitat diversity, wetlands dynamics, and ecosystem productivity as frequently as desired by managers or scientists. Finally, we also examined the feasibility to upscale the information obtained from the collected ground-truth data to satellite images from Sentinel-2 MSI using segments from the UAV multispectral orthomosaic. We found a close multispectral relationship between Parrot Sequoia and Sentinel-2 bands which made it possible to extend ground-truth to map inundation in satellite images.
Keywords:
UAVs; ecological integrity; LTER; LTSER; multispectral mapping; ground-truth; Parrot Sequoia; Sentinel-2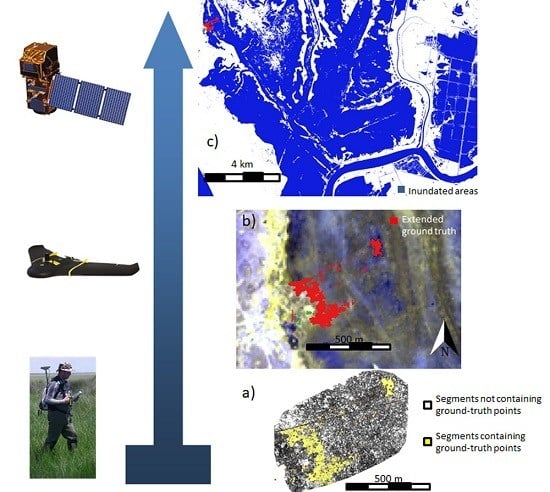
1. Introduction
Rapid assessment of ecosystem status, both functioning and structure, has become a major requirement for managers and conservationists in choosing response to disturbances or understanding global change effects at local scale [1]. Humanity is failing to make sufficient progress in confronting grand environmental challenges, and alarmingly, most of them are getting far worse [2]. One of the most informative ways to retrieve a quick conservation status picture of either habitats or species is based on survey and long-term monitoring programs [3,4]. Long-term ecological research (LTER) networks are informing about the factors driving changes in biodiversity, the self-organizing capacity of ecosystems, the effects of rare events and disturbances, the impacts of stressors on ecosystem function, and the interactions between short- and long-term trends [5]. These LTER networks rely on site-based monitoring and research by providing data and detecting trends identifying drivers and pressures. However, there is a need for methods and parameters harmonization in order to enhance sites comparisons and identify global patterns. The regional European LTER network, named LTER-Europe (www.lter-europe.net), has developed and adopted a new framework to easily derive ecosystems state from selected indicators: the ecological integrity (EI) framework. The idea of EI is based on the principle for precaution against ecological risks in the framework of sustainable development. The EI framework combines biotic and abiotic aspects of ecosystems with ecosystem structures and processes [6,7]. Its aim is to safeguard relevant ecosystem services and preserve the capability to continue self-organized development of systems and services, by becoming more complex systems or adapting to change. The ecological integrity framework has enabled indicator selection and enhanced data integration and upscaling for individual LTER sites. In addition, in 2007, the LTER-Europe network introduced the concept of long-term socio-ecological research (LTSER). This approach extends LTER concept to coupled socio-ecological (or human-environment) systems. LTSER aims to provide a knowledge base that helps to reorient socioeconomic trajectories towards more sustainable pathways [8]. LTSER platforms, inside LTER-Europe network (Figure 1a), are extensive landscapes characterized by manifold interactions between society and nature, ranging from strict conservation areas to intensively used ones [9].
While seeking fast assessment of large and inaccessible areas such as LTSER wetlands, synoptic tools become essential to provide the required integrative view. For this purpose, managers turn usually either to the use of in situ measurements or estimates from automatic or handheld sensors and probes or to ad-hoc sampling procedures [10]. In such cases, data collected by these means can point out local changes or trends but it will seldom inform on spatial gradients or reveal under-sampled locations. At this point, remote sensing imagery becomes the major contributor to spatially visualize and locate any kind of environmental threat or disturbance such as wildfires, eutrophication processes, flooding, etc. Optical images captured from Earth observation mid-resolution satellites (tens of meters) are widely available for free, such as the ones captured by Landsat or Sentinel missions. However, high- and very-high-resolution images (from centimeters to few meters) are costly and have to be pre-ordered and programmed to be acquired over the study area. In the former case, scenes are periodically acquired enabling to build a time series of images to address temporal changes and trends at the landscape scale. In the latter, finer resolution allows for detailed habitat mapping for instance, while dramatically increasing costs. The same is also true for airborne photogrammetric campaigns either with photogrammetrical, multispectral, or hyperspectral sensors on board of planes. Conversely, UAVs can be flown over the same area as frequently as required, only constrained by weather conditions or legislation, becoming a suitable monitoring tool for any target. As a major trait, UAVs provide the opportunity to define spatial resolution as detailed as requested according to the mission objectives [11] constraining the total area covered per unit of time. Yet it is not the only role played by UAVs as they can play the role of ground-truth for other sensors either airborne or onboard of satellites, while overflying large and remote or inaccessible areas. Rapid growth of commercial UAVs and affordable prices together with the increase on the innovative offer of miniaturized multispectral sensors and cameras is widely spreading their use across the globe. Just a few years ago, dealing with mission planning and post-processing was also a challenge. Nowadays, integrated solutions such as the one provided by SenseFly© are offering accurate and endurable platforms such as the Sensefly eBee able to carry different airborne cameras. Thermal, visible or multispectral cameras can be mounted alone in its single pod. The company also provides a very integrative post-processing solution with Pix4D© software, enabling to carry out complete missions in very short time for many applications on protected areas. Actually, UAVs are mainly used to monitor crop health and status by upscaling physiological variables applying model inversion methods [12]. Very few studies have addressed similar topic for other environments such as rangelands but none for natural wetlands [13,14].
In this paper, we assess the applicability of UAV borne multispectral cameras for fast mapping of the ecological state of two LTER wetlands following the ecological integrity framework. We evaluate several indices proposed to retrieve the necessary information to assess the inundation level, the plant and open water cover, plant height, and water turbidity and depth. We confirm that the derived maps can contribute to enhance and enlarge the area to be used as ground-truth data for satellite remote sensing images (in this case, we used Sentinel-2 images). The easiness and high performance of multispectral cameras on board of fixed wing UAV is demonstrated while offering fast EI assessment and ground-truth for satellite remote sensing images.
2. Study Sites and Conservation Issues
2.1. The Doñana LTSER Platform
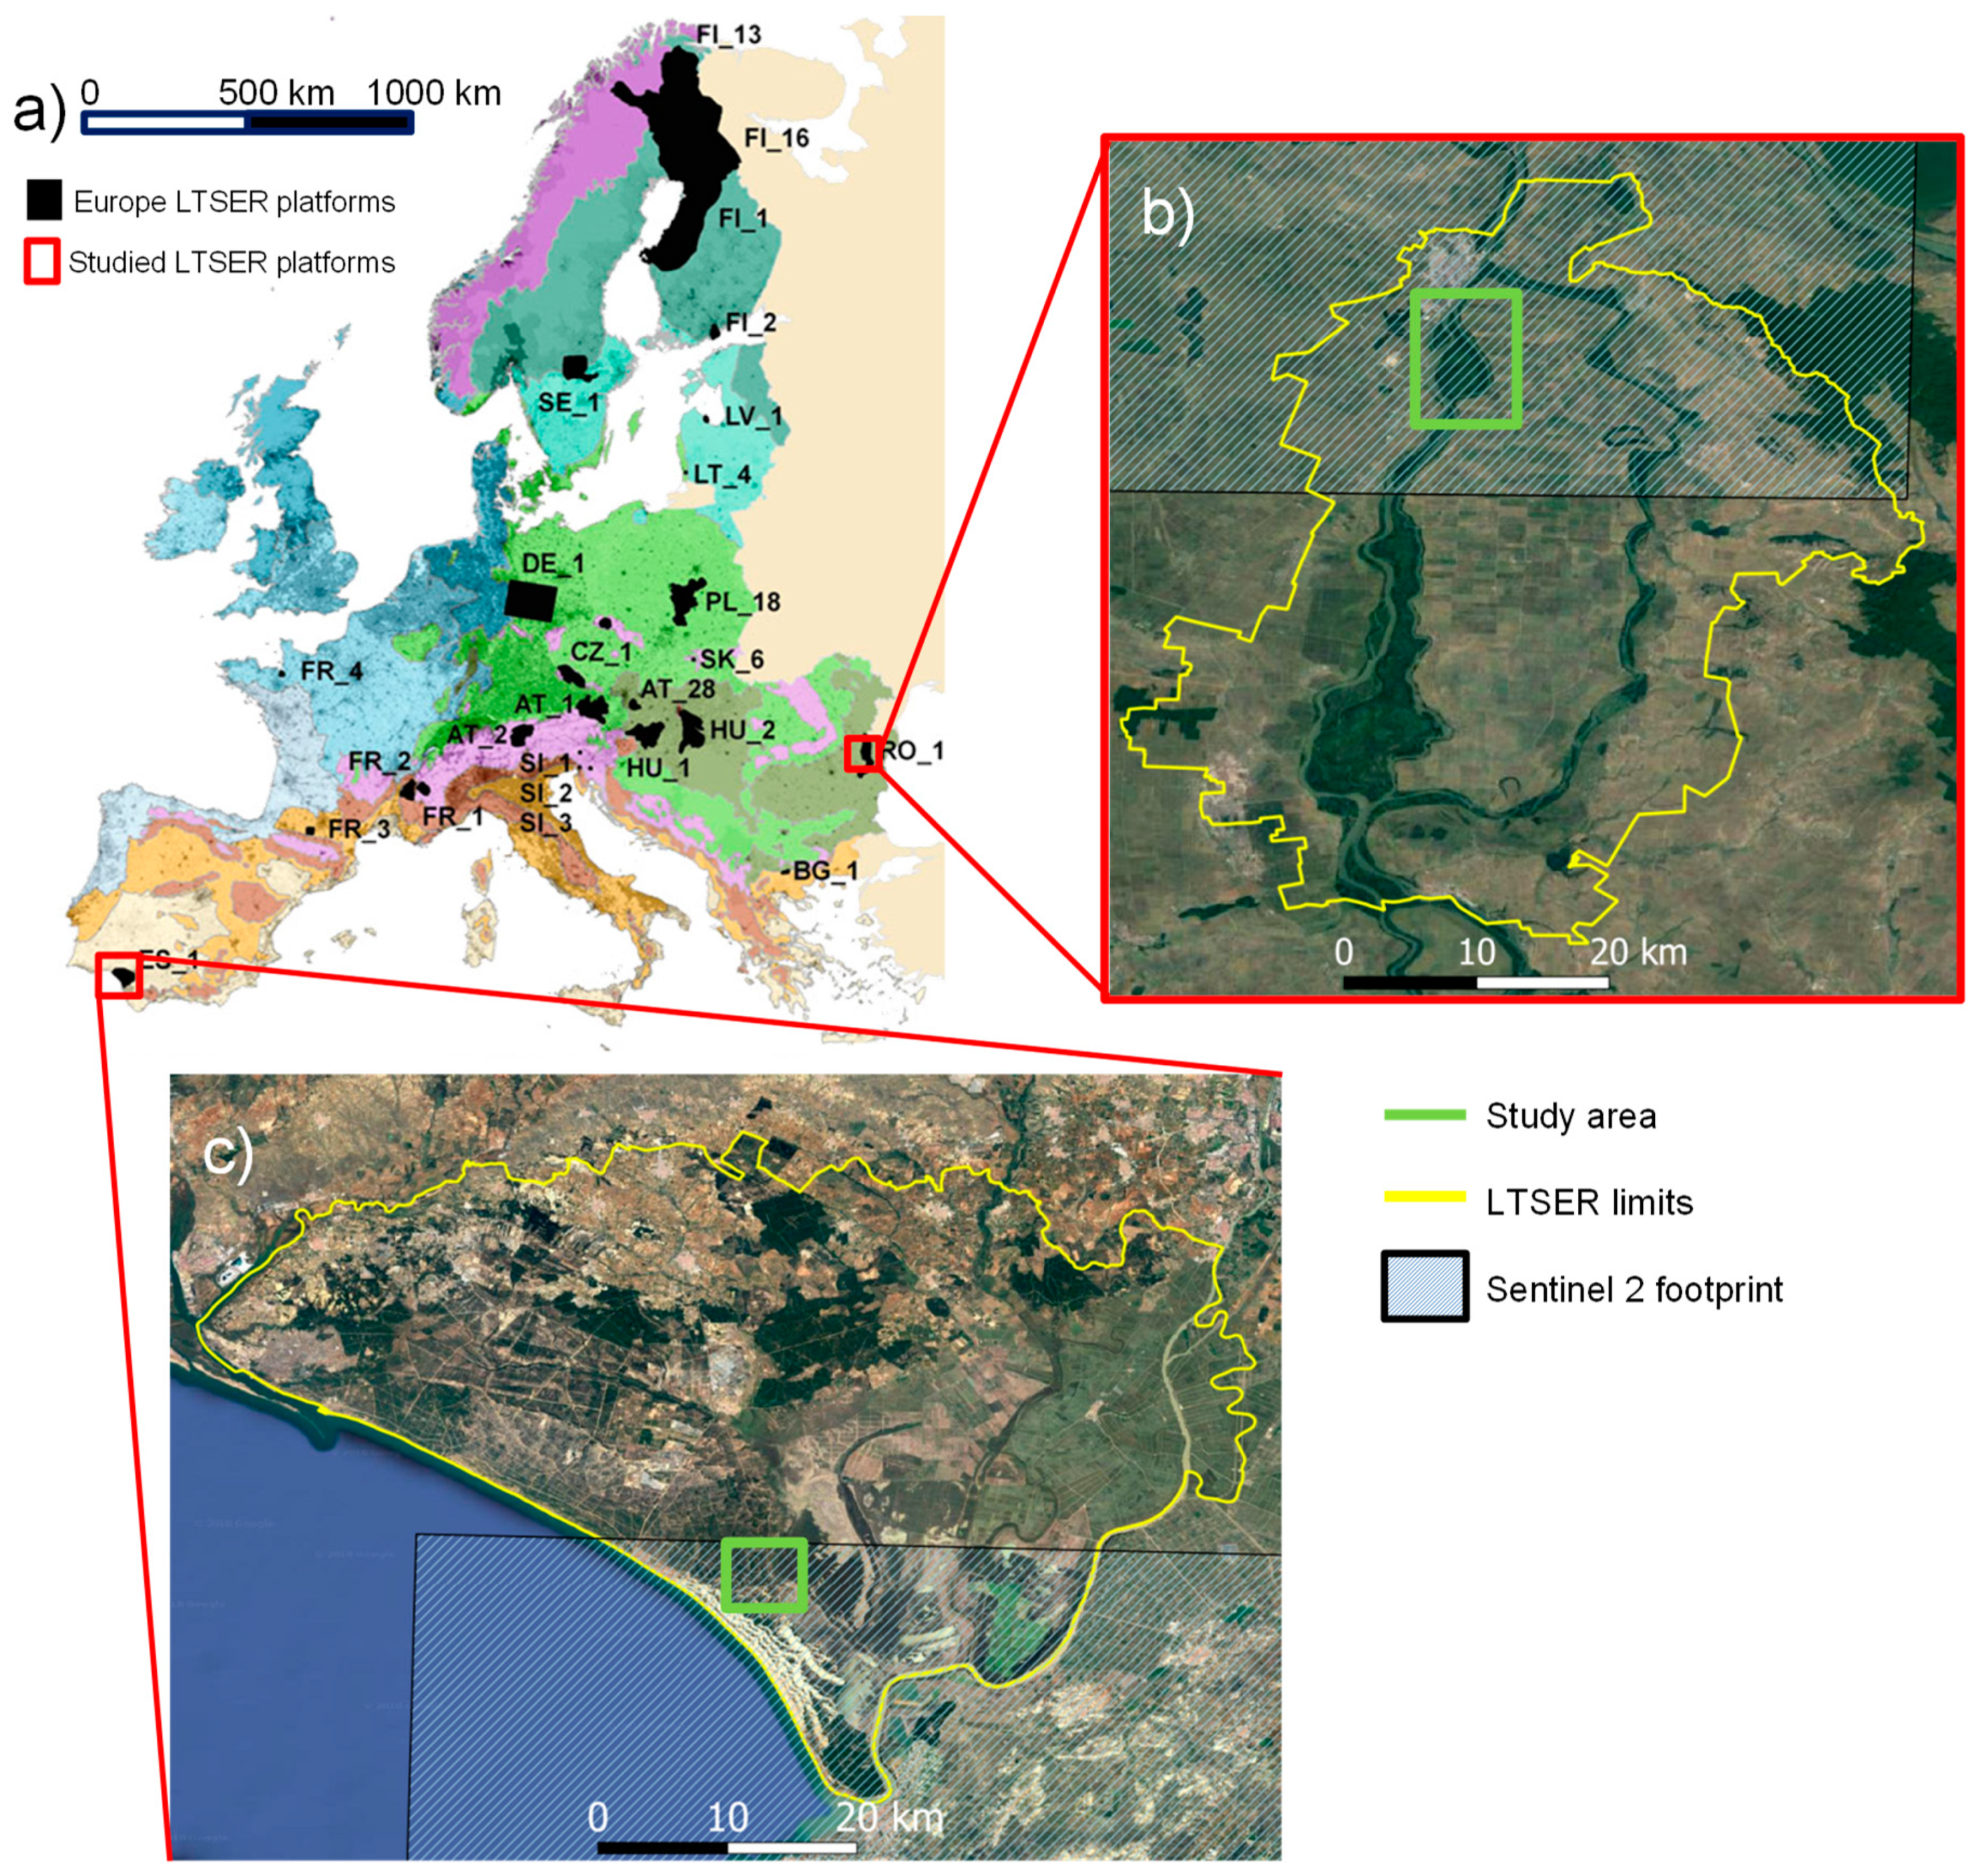
The Doñana LTSER Platform is located SW of Spain (Figure 1c). It is a UNESCO Biosphere Reserve, a Ramsar Site, and a Natural World Heritage Site. It includes the largest wetland in Western Europe and a large dune ecosystem with its respective shoreline and representative terrestrial plant communities. The area is home to many species, including the Iberian lynx and the imperial eagle. The Doñana marshes play a critical role as a stopover, breeding and wintering point for thousands of European, Iberian and African birds. The long-term ecological monitoring program focuses on threatened species and habitats and uses a multi-scale approach [15]. Conservation objectives include the preservation of critically endangered species, the abundance of waterfowl, and the protection of Mediterranean wetlands and terrestrial ecosystems. Data are systematically collected on vegetation, threatened flora, limnology, mammals, birds, amphibians, and reptiles in an integrative way [4]. Doñana marshes, which cover an extent of 260 km2, provide important ecosystem services such as aesthetic, spiritual, scientific, and eco-tourism provided by waterbirds under the cultural domain or grazing for cattle under the provisioning domain and nutrient cycling and water purification as regulating or supporting services. [16,17]. So, mapping inundation levels, hydroperiod, water turbidity and depth, together with aquatic plant cover becomes essential to characterize ‘within-habitat structure’, ‘habitat cover’, or ‘water quality’.
2.2. The Braila Island LTSER Platform
The Braila Island LTSER platform is located in the small island of Braila in the Danube River, southeast Romania (Figure 1b). The Small Island of Braila is especially rich in bird species. Together with the coastal Danube Delta, the wetland system is an important stepping stone for bird migration routes in southeastern Europe. This socio-ecological system is inhabited by near 300,000 people and comprises heavily modified ecosystems (e.g., Big Island of Braila) but also systems under a natural functional regime (e.g., Small Island of Braila), being of a crucial natural and socio-economical value. Most of the area has been drained for agricultural purposes. As a consequence, connectivity between the Danube and the floodplains is very limited [18]. The Danube river in the Braila Islands section has been ranked as a heavily modified water body according to criteria 2.1 (embankment works) due to the hydro-technical works on 79% of the river stretch sector and a candidate to “heavily modified” according with the WFD criteria 2.2 (regulation works) as a result of dredging of 21% of the river bed for intensive navigation. The main remnant of the natural floodplains consists in the wetlands from the Small Island of Braila Natural Park with a total surface of 210 km2 and the floodplains between the riverbanks and dikes of almost 93 km2 [19]. Water quality in this stretch of the Danube River is also rated as moderate. The main pollution sources are agriculture, industry, navigation, and domestic households. Also in Braila Island, periodic mapping of inundation levels, water turbidity and aquatic plant cover as well as floodplain tree cover are crucial to identify sudden changes in management affecting flooding.
3. Materials and Methods
3.1. Practical Remote Sensing Indicators for Rapid Ecological Integrity (EI) Assessment of Wetlands
Structural EI components are based on biotic diversity and abiotic heterogeneity. The components of processes (input, output, storage) are related to energy, matter and water balances. Structural and process components are interrelated and may be used to reflect states, changes and pressures enabling fast assessment of the protected area. However, although the recent work by Haase et al. [5] conveys the links between EI indicators and the essential biodiversity variables (EBV) [21], there is still much work to do in order to retrieve such valuable information using remote sensing tools [22,23].
In our case, we are dealing with rapid assessment of wetlands sharing similar pressures and drivers. As water is the main agent defining states, the most significant indicator is water presence or inundation level. Water presence or absence in the wetlands is essentially informative to water input at the water budget component of processes in the EI framework (Table 1). While revisiting the same place, hydroperiod can be easily retrieved as a function of inundation residence through time, informing on water storage for the wetland. Table 1 shows some examples of remote sensing indicators, which can be easily mapped and directly related to EI indicators in wetlands (rivers, lakes or coastal shallow wetlands). Some references are also provided, although mostly based on satellite remote sensing we include many of them using UAVs borne sensors. Many more references on every indicator are available in the literature.
3.2. Multispectral Camera, UAV Mission Planning, and Image Processing
Among the wide offer of drones and cameras, we selected the eBee solution consisting of a Parrot Sequoia multispectral camera integrated in the eBee fixed wing UAV [69]. The choice was based both on the spectral bands (b1 green -550@40nm-, b2 red -660@40nm-, b3 red edge -735@10nm- and b4 near infrared -790@40nm-) provided by Parrot Sequoia and the large flying extent provided by the eBee plane (up to 40 ha in one single flight of 25′, with flight height 120 m and pixel size 11 cm). Additionally, sequoia camera brings a sensor of irradiance in the upper side of the sensor which is concurrently capturing irradiance while taking pictures [70] and a RGB sensor of higher resolution. A calibration panel is provided with every unit to be pictured before flight allowing for bands reflectance calculation after flight [71].
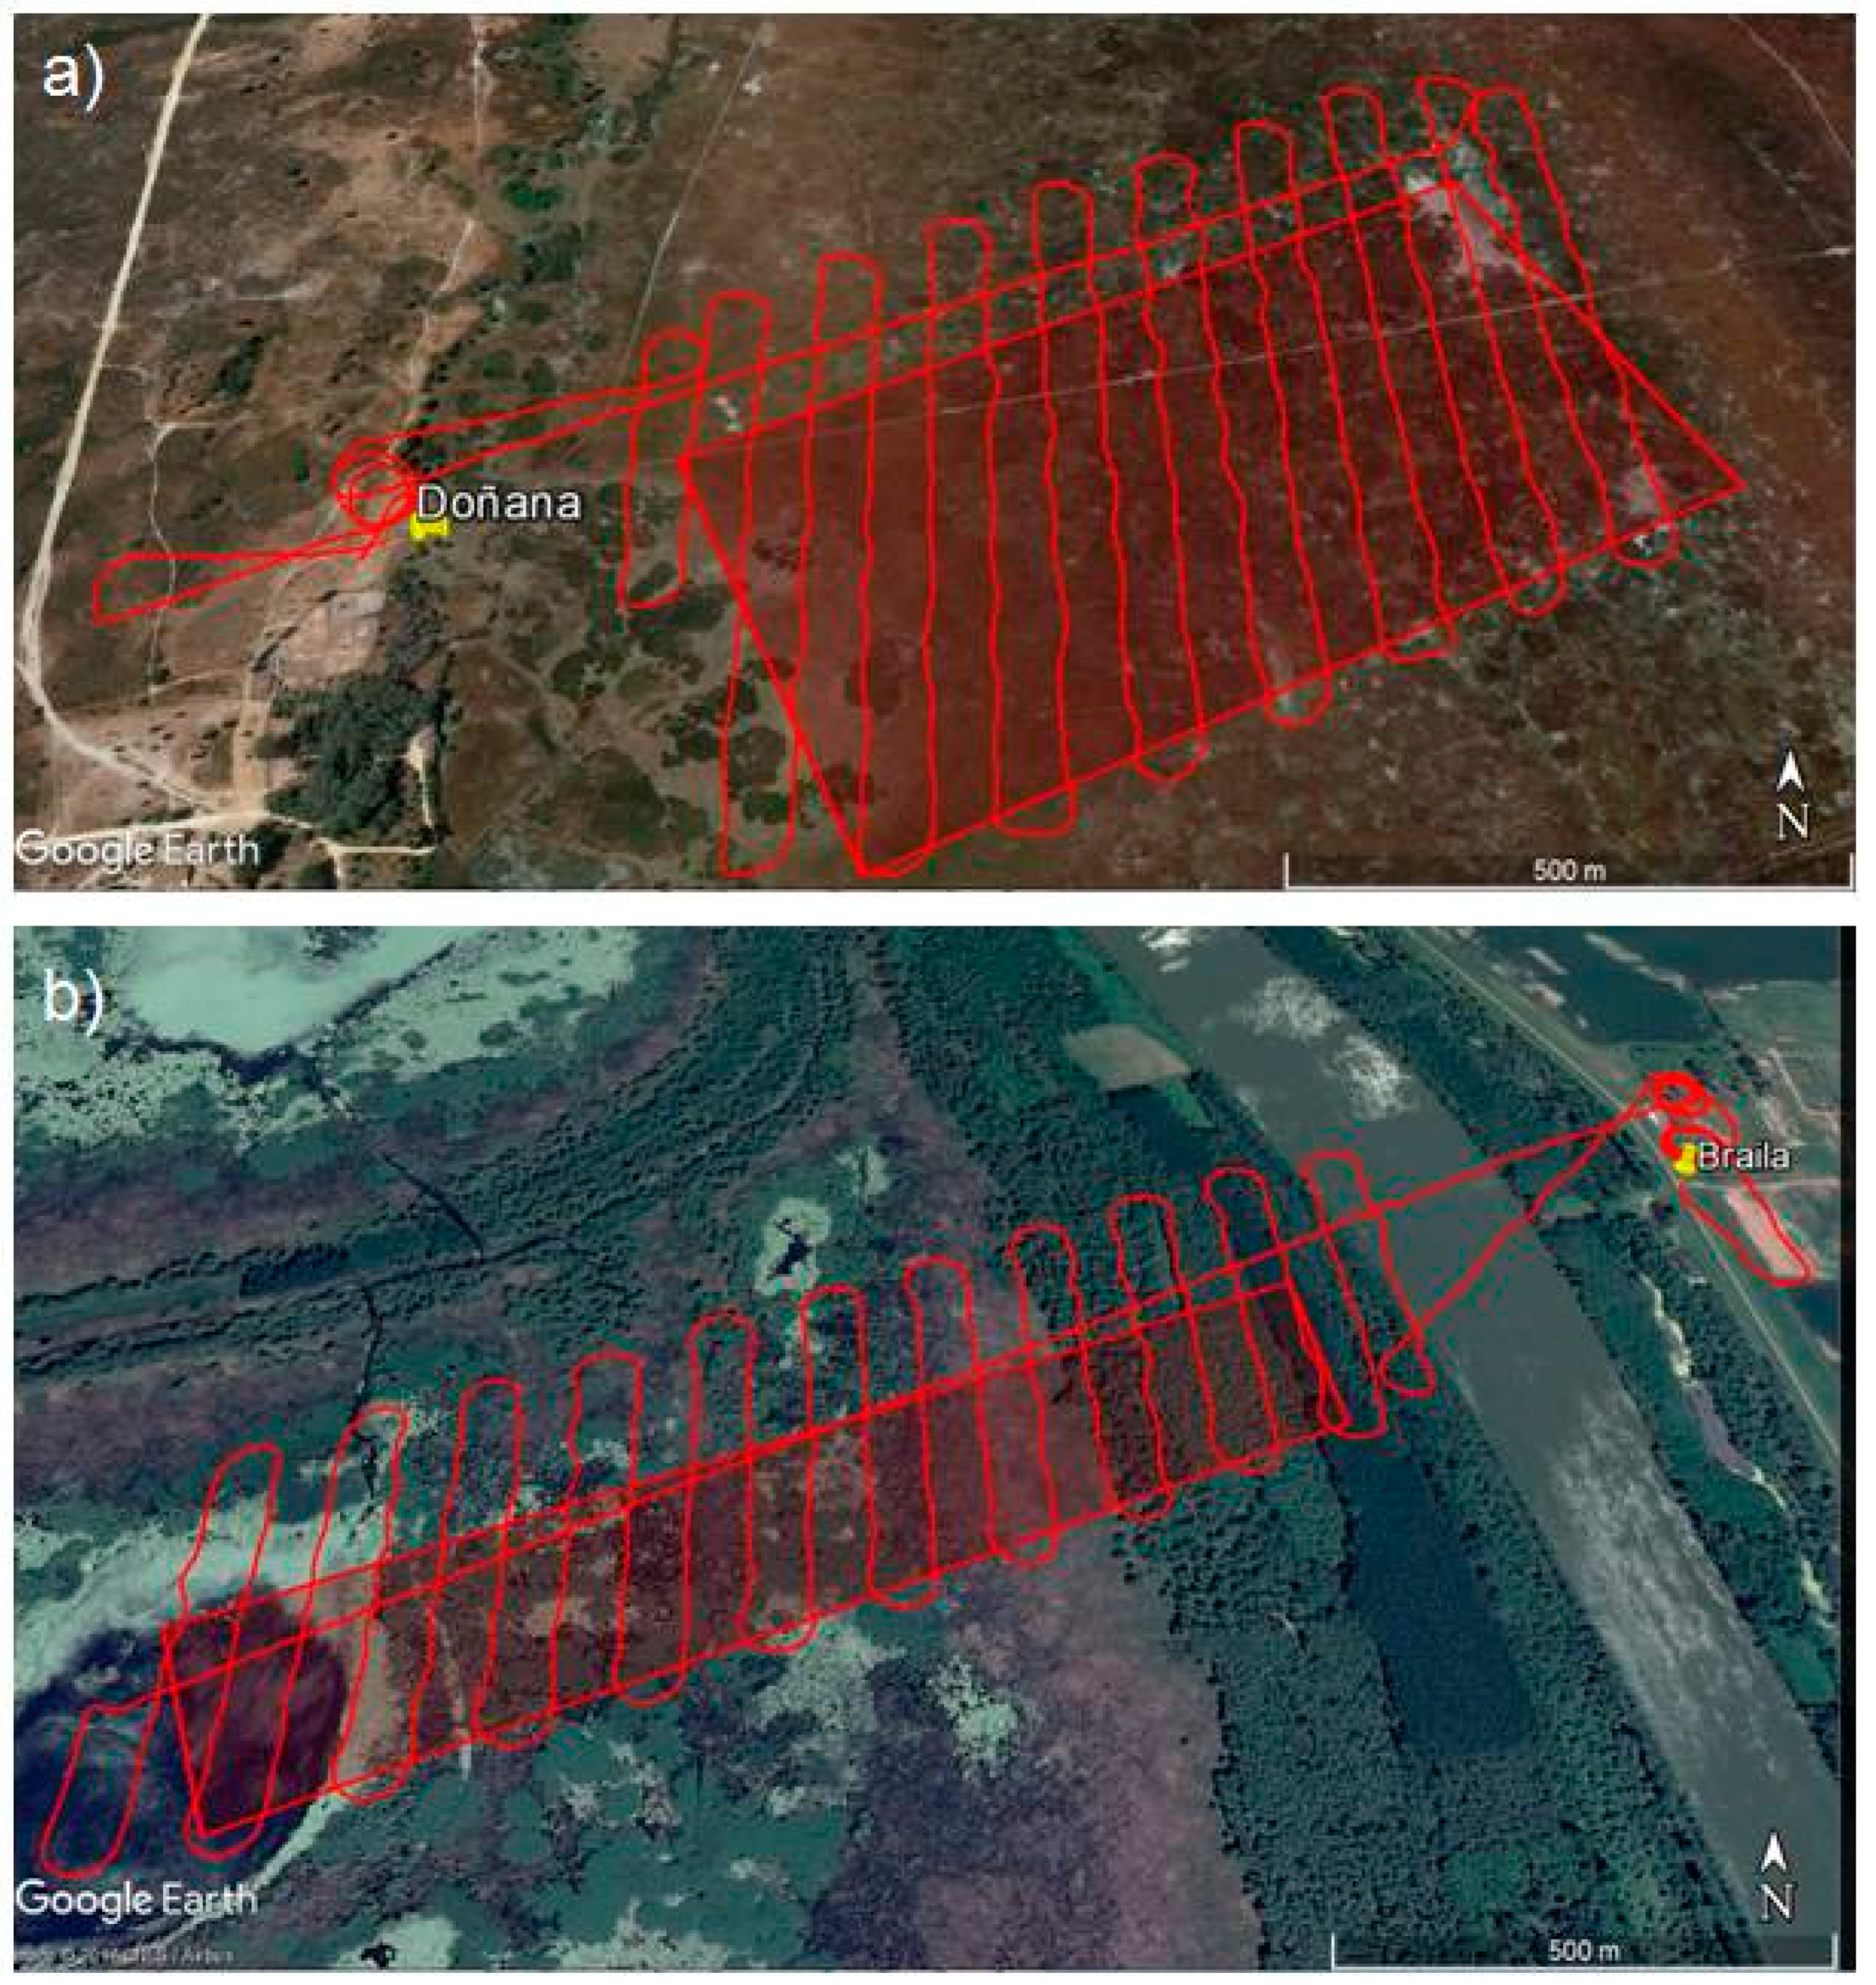
Missions over Doñana marshes in Doñana LTSER platform and Braila LTSER platform were designed to cover an inundation gradient (Figure 2). Both sites were flown with clear sky conditions around 12 UTC at the maximum legal altitude (120 m above the terrain), perpendicular to the dominant wind direction and beyond-visual-line-of-sight (BVLOS). In the case of Doñana marshes, the flight covered the ecotone area between the sandy substrates and the marsh with variable inundation levels and aquatic plant cover (Figure 2a). In order to guarantee safe and dry operation we took-off and landed on the sandy substrates of the surrounding area. As the Small Island of Braila can only be accessed by boat and is covered by dense floodplain forests, flight mission was designed according to such constraints. Therefore, take-off and landing operations were carried out from the opposite river bank (Figure 2b). Doñana flight was accomplished on 22 April 2017 and lasted for 25 minutes. Braila flight took 27 minutes and was acquired on 1 August 2017.
Radiometric calibration was simply achieved by reflectance calculation according to radiance coefficients and irradiance measured at every picture center [72]. Pictures are geotagged with the SenseFly eMotion software using the UAV flight logs and the set of pictures were introduced into Pix4D© software to be stitched and generate a multispectral orthomosaic together with digital surface model [73]. Figure 3 shows the general workflow of the study. Ground control points (GCP) for geometric correction could not be established because inside the marshes we could not find any valid lineal or conspicuous element to be used as reference in the flight area and we realized that the use of artificial targets (made of canvas fabric) once placed over water were easily displaced by wind. Visual geometric validation was carried out with the available high resolution images for every site (Google satellite or Bing satellite) with recognizable features such as tree/shrub canopies, paths and fences at the edge of the marsh. Absolute root-mean-square error (RMSE) was calculated using seven visually recognizable points in both layers.
3.3. Ground-Truth Sampling, Accuracy Assessment, and Remote Sensing Wetland Indicators Mapping
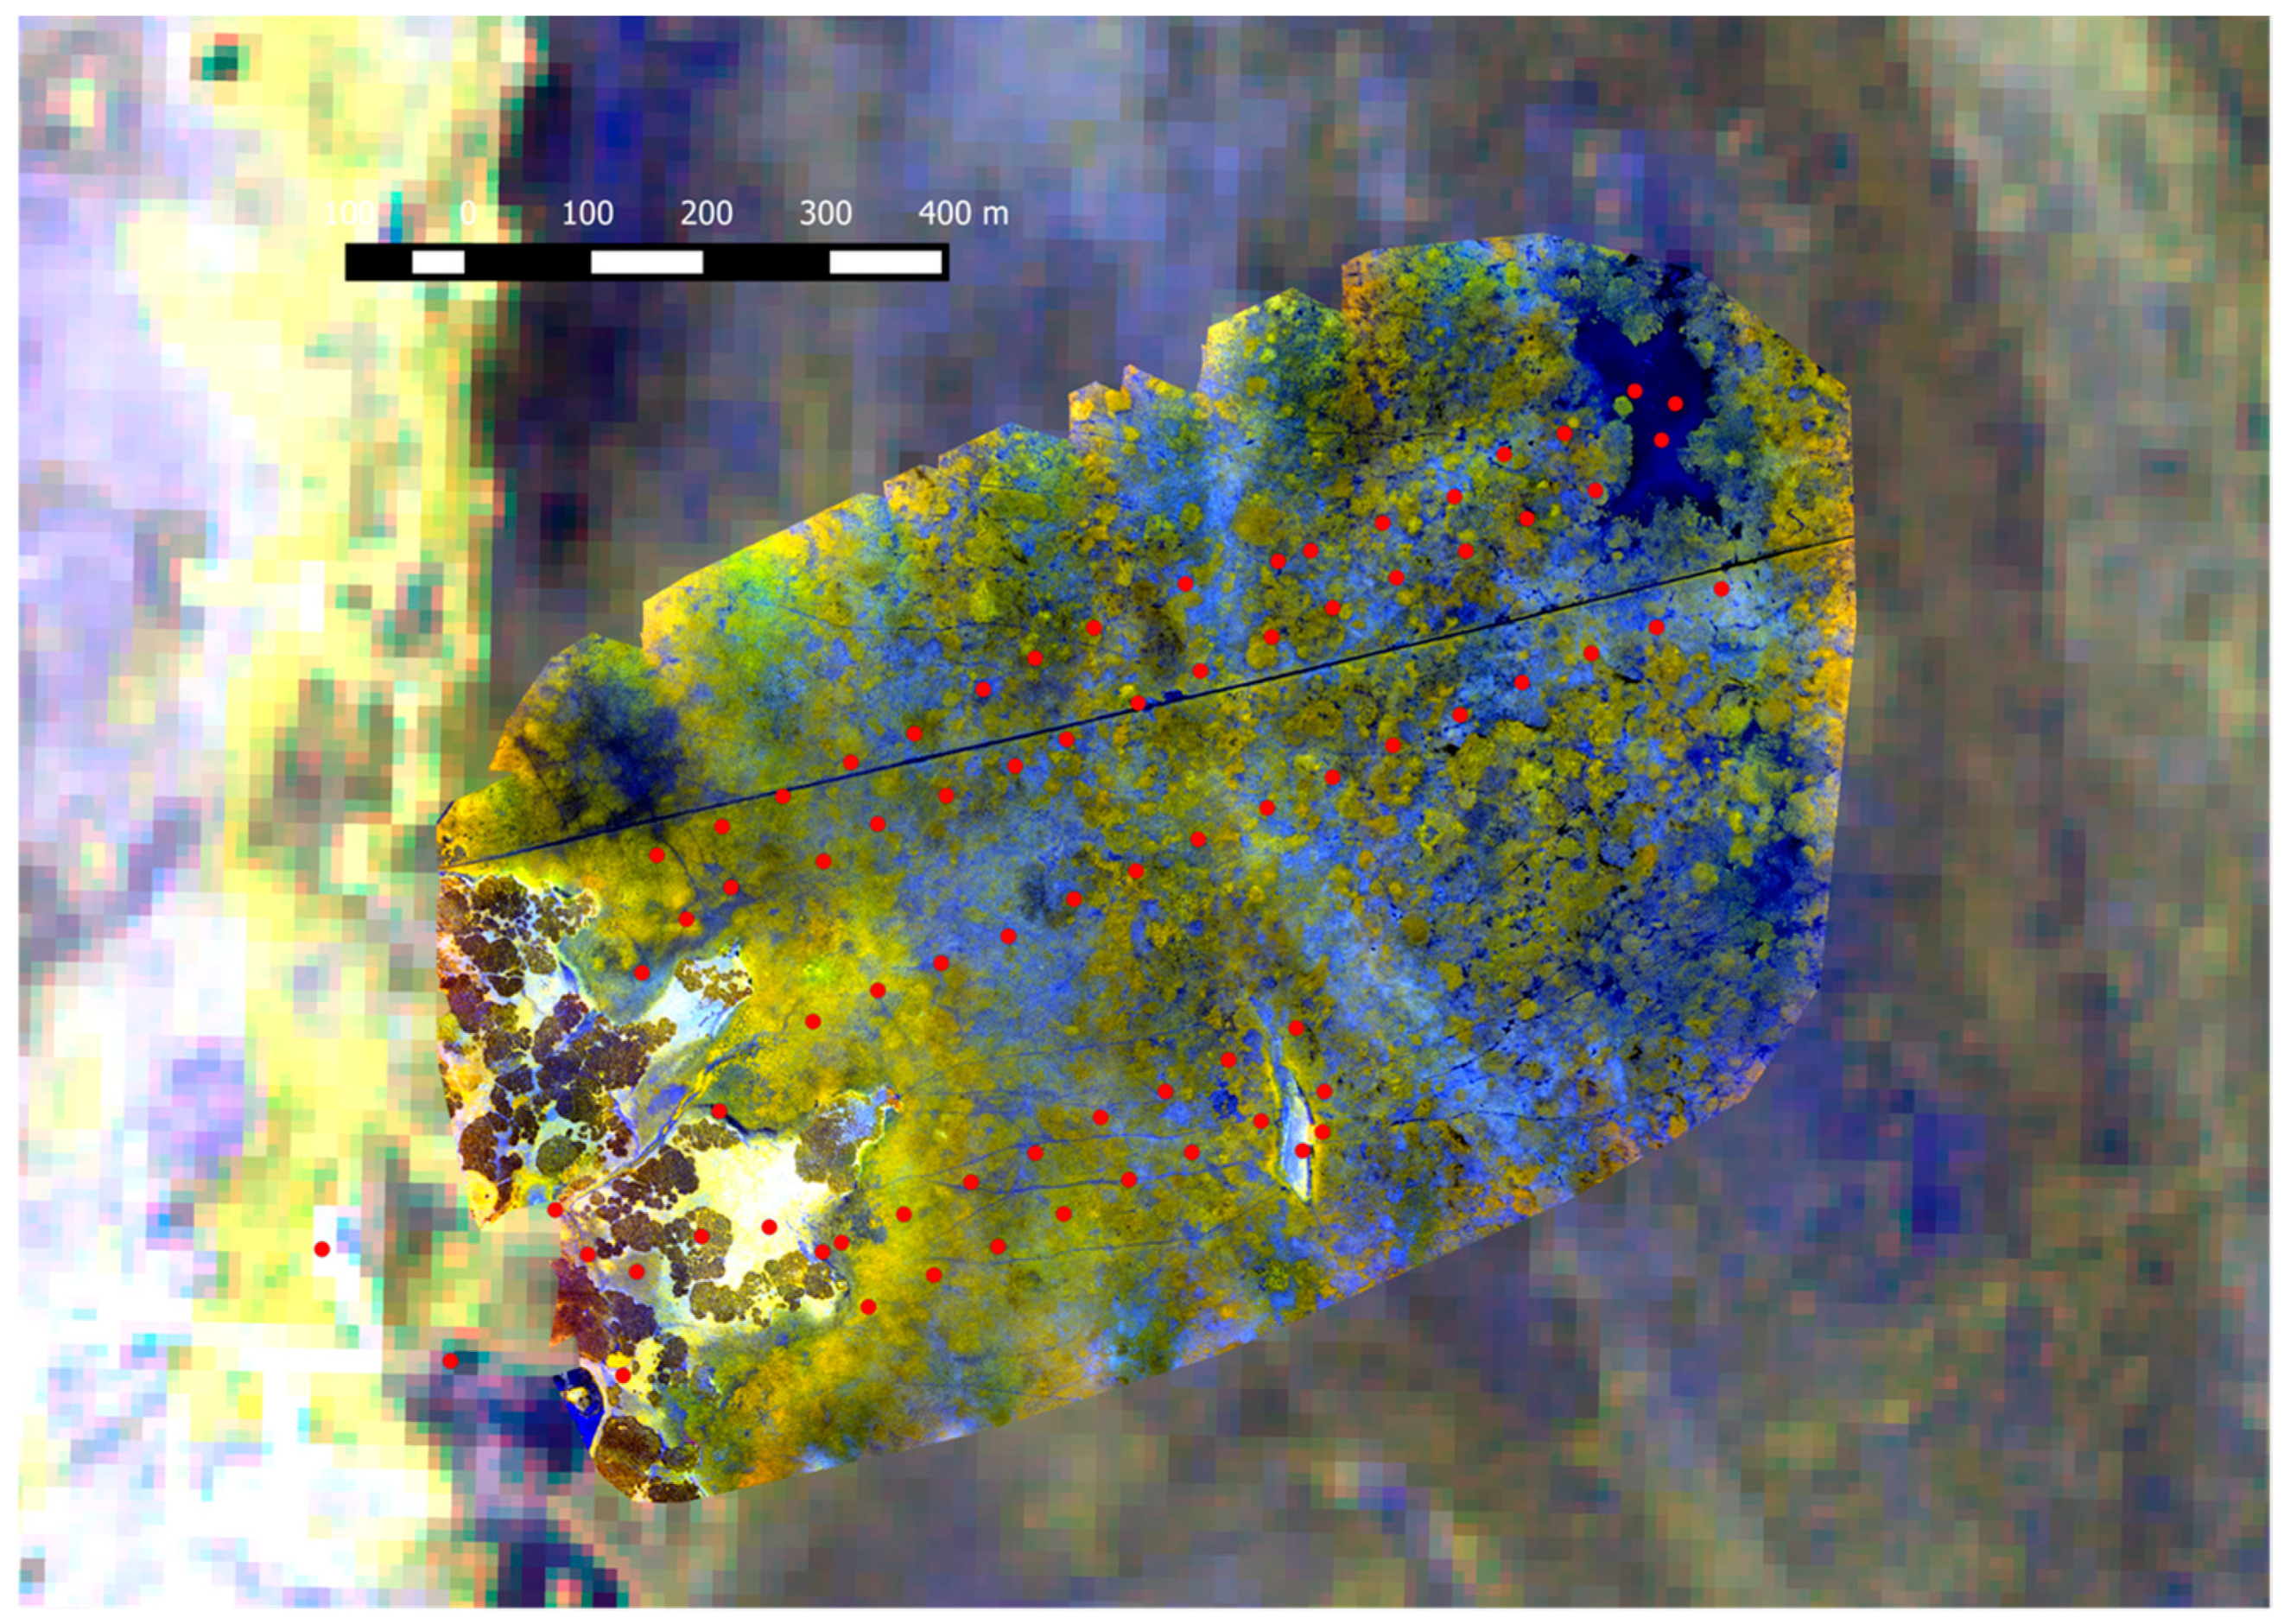
In order to assess UAV mapping accuracy we carried out field sampling over the Doñana marsh study area immediately after the flight and Sentinel-2 image acquisition of the day. Ground-truth was collected by walking the marshes following predesigned regular transects to maximize the total area sampled across different inundated areas (Figure 4). Sampling points were located every 60 m in visually homogeneous sites at least for a radius of 15 m. Different wetland indicators were collected at every sampling point being originally representative of the 30 × 30 m Landsat TM and ETM+ pixel size according to Díaz-Delgado et al. [67] methodology being also valid for Sentinel-2 10 × 10 m pixel size. We recorded data contributing to EI indicators such as water turbidity, water depth, percentage of bare ground, aquatic plant and open water cover, and plant species abundance and dominance (Table 2). Geolocation of every point was recorded by means of PDA-GPS units with less than 3.3 m horizontal position error on average.
Field data was used to analyze statistical relationships between Sequoia spectral bands and different spectral indices (Table 2) applicable to retrieve wetlands EI indicators.
A random selection of 70% of ground data were used to explore linear modeling and a set of 30% to independently test accuracy of every model. The assessment was based on the values of coefficient of determination, R2 and RMSE. Accordingly, we used the best lineal fit to map the tested wetland indicators. For inundation mapping we applied regression tree technique to discriminate between inundated and non-inundated classes based on Sequoia NIR band reflectance values [67]. In this case, classification accuracy was assessed with overall agreement (OA) and Kappa index. For plant height we also explored the relationship with vegetation height model (VHM) obtained from the subtraction of digital surface model (DSM) and digital terrain model (DTM) as applied by Bendig et al. [76]. DSM and DTM are generated from the point cloud by Pix4D software using the photograms of the RGB camera [77].
Finally, we assessed the discriminative ability of Sequoia multispectral bands to separate spectral signatures of the most common dominant aquatic vegetation species including emergent, floating, and submerged plants. We performed a separability analysis to assess the best band to discriminate among the different pairs of aquatic plant species. For this purpose, we used the normalized distance Z [78] which provides high values for the most different compared species.
3.4. Reflectance Comparison with Satellite Images
Both drone missions were set to be coincident with Sentinel-2 (S2) MSI acquisitions over the study sites. Thus, S2 images were available for the same dates such as 22 April for Doñana and 1 August for Small Island of Braila. S2 images were downloaded by using the semi-automatic classification (SAC) plug-in implemented in QGIS [79]. An atmospheric correction is carried out in the pre-processing of the S2 images based on the basic dark-object-subtract (DOS) technique, inspired in Chavez [80] and Moran et al. [81]. DOS method approximates the path radiance value of a given band from the minimum value of the histogram (dark object), assuming an intrinsic reflectance of the darkest object (1%). The rest of the radiance received by the satellite sensor proceeds from the atmospheric path, and must be then subtracted from every pixel before dividing the at-sensor spectral radiance by the irradiance. The model assumes that the transmittance is 1. The SAC-QGIS method is quick and simple, fully image-based, avoiding the need for atmospheric auxiliary data to perform the correction. It does not account for topographic effects, a characteristic that is not relevant in the present study due to the flat morphology of the study area.
Ground-truth points were used to compare Doñana Sequoia and S2 multispectral bands (Figure 3). The S2 bands selected for comparison with Sequoia bands were the most similar in terms of spectral resolution: B3 (560@45 nm), B4 (665@38 nm), B6 (740@18 nm), and B7 (783@28 nm). Bands 6 and 7 with original pixel size of 20 m were resampled to the B3 and B4 spatial resolution (10 m). Assessment was carried out by comparing R2 and RMSE values for band reflectance relationships (Figure 3). Reflectance for Sequoia bands was obtained calculating the average of the pixels contained in one S2 pixel.
3.5. Upscaling of Ground-Truth Data
An upscaling essay was carried out to extend the information collected from ground-truth data to the whole S2 image. We applied a segmentation on Sequoia multispectral orthomosaic. Sequoia multispectral image was segmented using the four spectral bands using ‘segment mean shift’ available in ArcGIS with the following specs: spectral detail 15.5, spatial detail 15, minimum segment size 20 pixels (2.60 m). Then we made a spatial assignation of ground point data to the whole extension of the resulting spatially and spectrally homogeneous segments. Therefore, we used the labeled segments to build regression tree for inundation mapping but this time using S2 spectral data from the pixels inside the segments. The optimal threshold value was used to map inundation for the full S2 scene. Overall agreement and kappa index were used as indicators for accuracy assessment.
4. Results
4.1. Geometric Accuracy of UAV Multispectral Orthomosaics
Table 3 shows the geometric characteristics of every mission. Despite the fact we could not set up GCPs, the absolute root-mean-square errors (RMSE) of the orthomosaics were below 40 cm. Such values are still useful to assess the RS wetlands indicators as a function of ground-truth data collected to be homogeneous in 15 m around the point [67].
Figure 5 shows a visual assessment of geometric accuracy for the Doñana flight. Several distance measurements between both layers in recognizable objects revealed geometric matching below 0.40 m.
The eBee plane travelled a total distance of 15.5 km over the Doñana study area and 12.5 km across the Small Island of Braila.
4.2. Spectral Modeling of Remote Sensing Wetlands Indicators
A total of 73 ground-truth points out of 75 collected in the field, were finally used to analyze linear relationships between Parrot Sequoia bands and different spectral indices with the wetlands RS indicators. Figure 6 shows some of the resulting maps by implementing the most significant relationships found for several RS indicators.
While Sequoia NDRE (Table 2) showed a significant and positive linear relationship with percent cover of emergent aquatic plants (R2 = 0.67; Figure 6a), plant height of these helophytes showed a significant but very low negative correlation with the Sequoia green band. Vegetation height from the subtraction of digital surface and terrain models did not show a significant relationship (R2 = 0.01, p > 0.1). The best predictor for percentage of open water was found to be the NIR band (Sequoia band 4) showing a significant linear relationship (R2 = 0.46, Figure 6b) as expected according to the extinction of this wavelength in water bodies (Figure 6). However, water depth variation was significantly explained by NDRE but in a very weak manner (R2 = 0.36; RMSE = 13 cm) so we did not applied it.
Water turbidity variability was explored with visible bands and indices showing a significant and positive relationship only for open water areas (>50% open water) with NDWI better than the one with WTI. Accordingly, we applied the mapping model by using the classes >50% with percentage of open water (Figure 6c).
Regression tree optimally converged to 0.23 as the optimal NIR (Sequoia band 4) reflectance threshold to discriminate inundated from non-inundated areas (Figure 6).
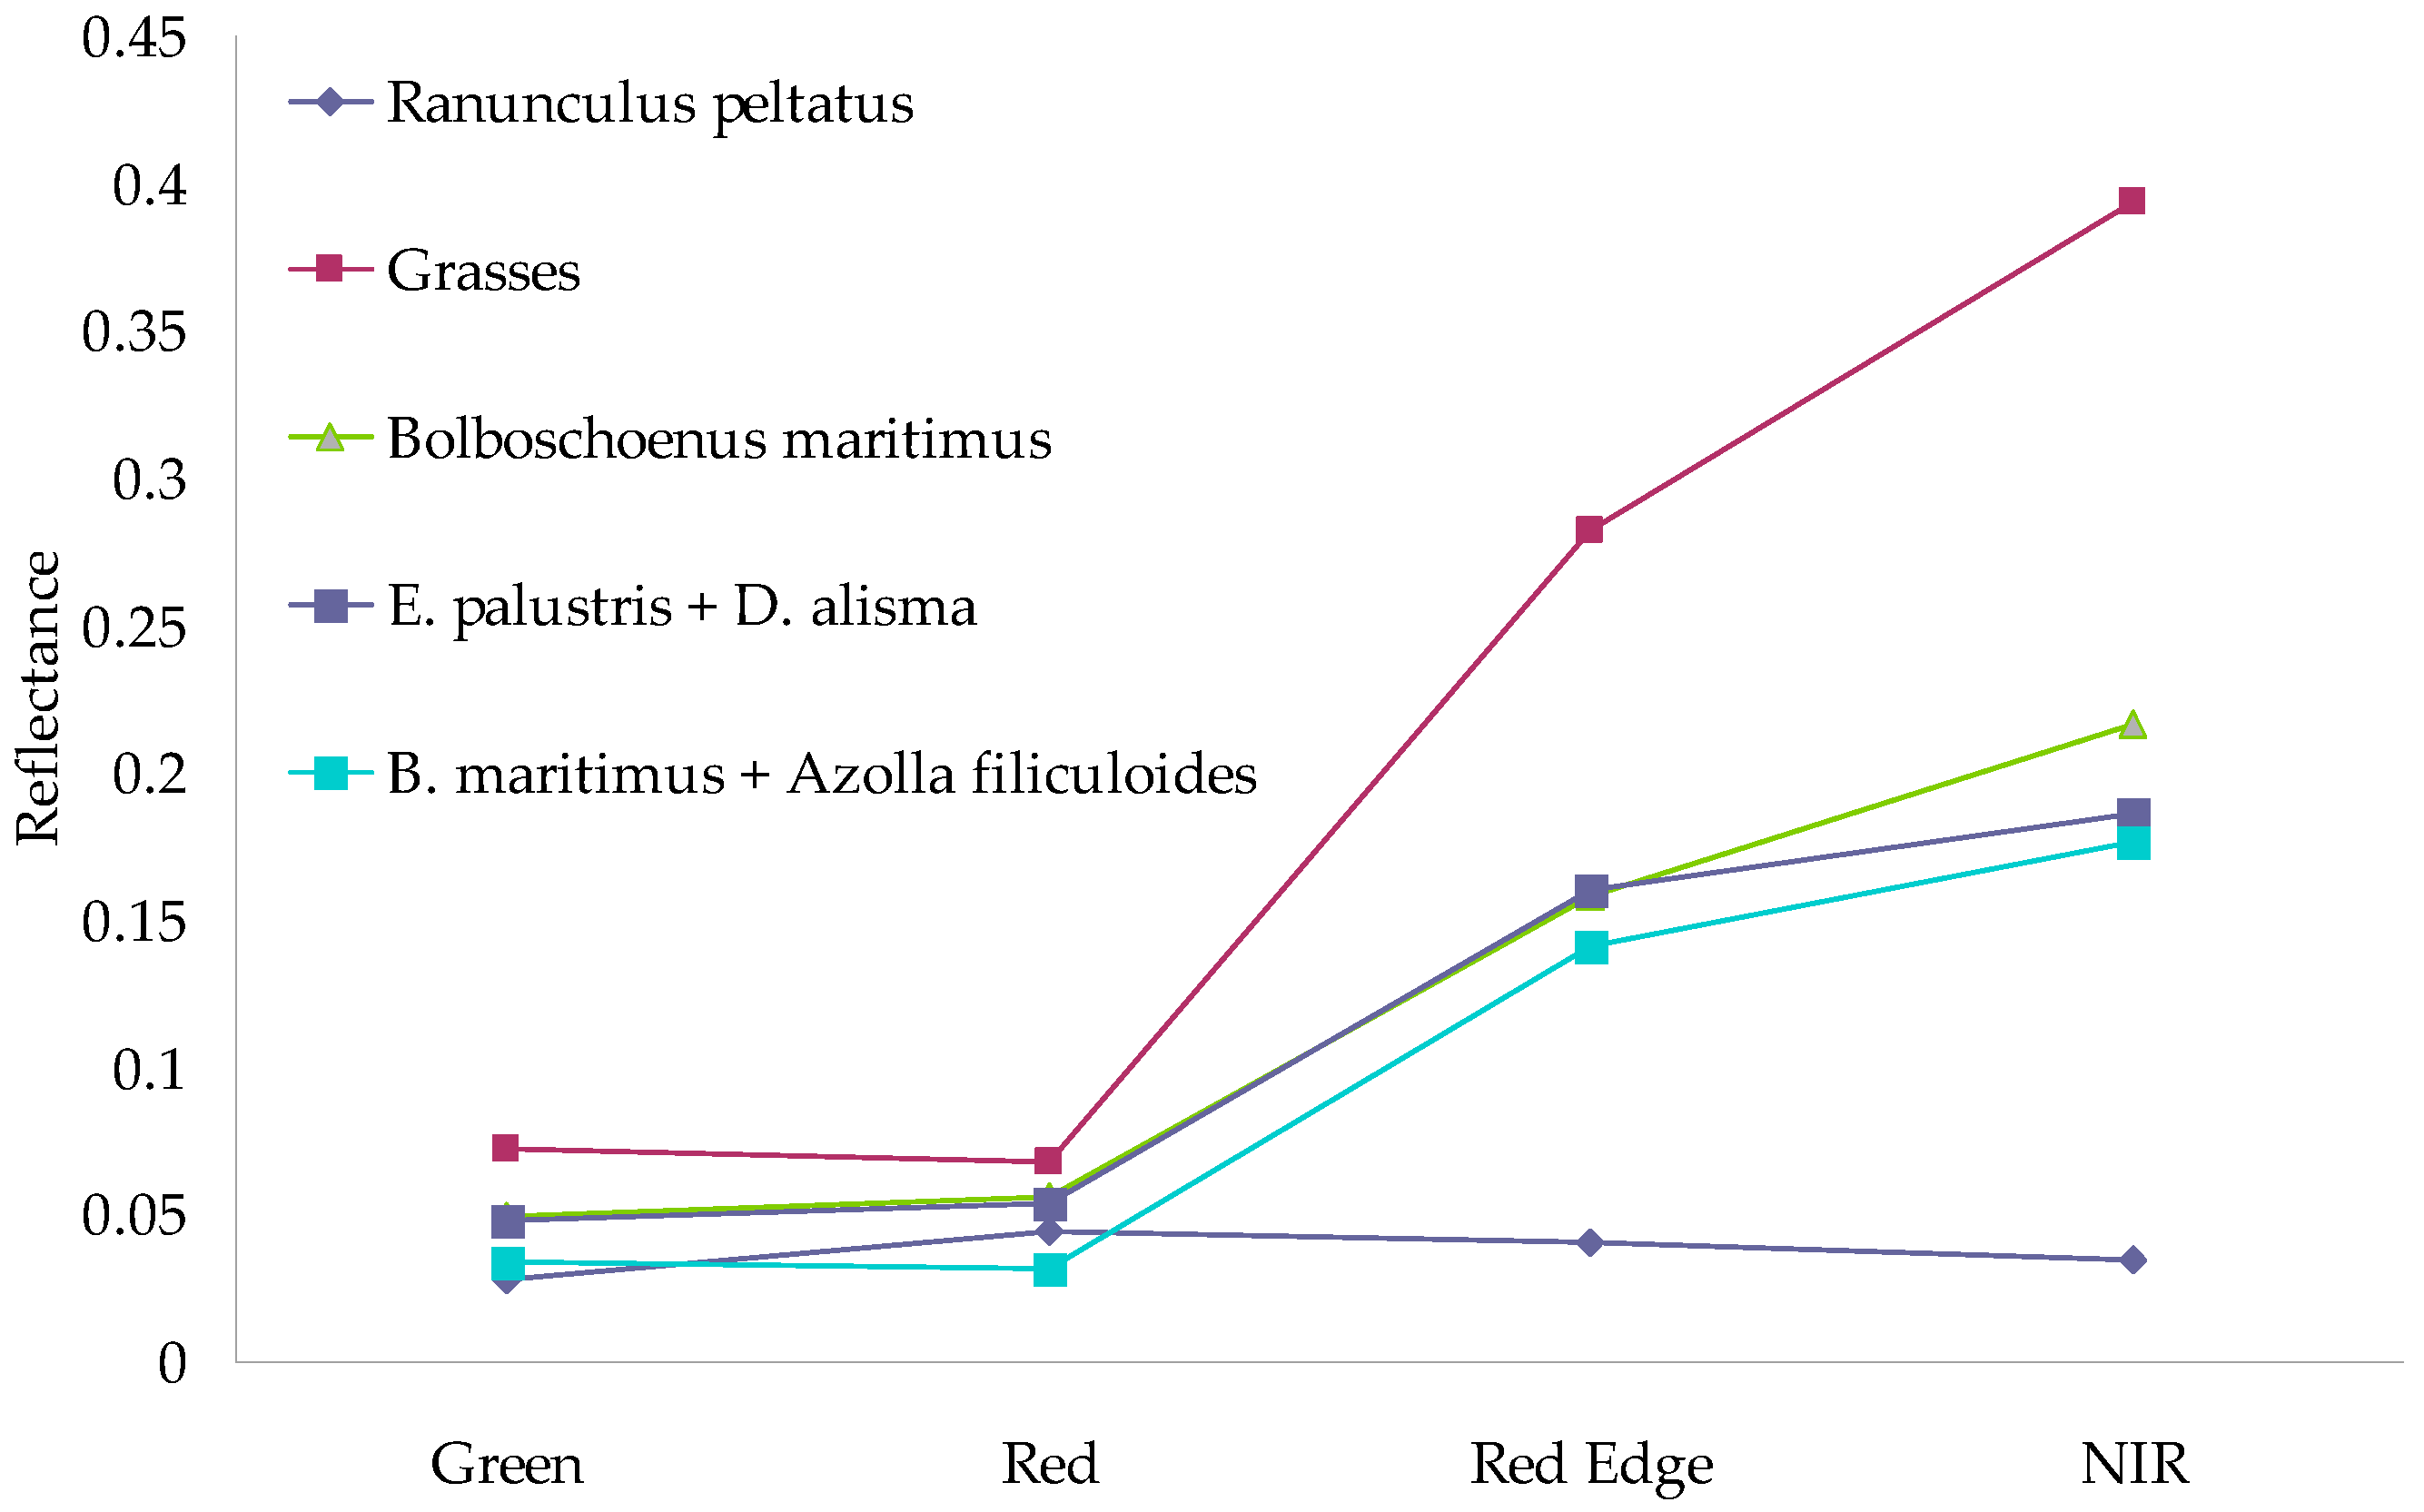
While assessing spectral signatures of the most common aquatic plant species, most of them may easily be separated (Figure 7), specifically emergent aquatic plants such as grasses or saltmarsh bulrush (Bolboschoenus maritimus) versus floating aquatic species as Ranunculus peltatus. However, the less abundant species such as Eleocharis palustris and Damasonium alisma show spectral confusion with saltmarsh bulrush. The presence of the alien species Azolla filiculoides under saltmarsh bulrush canopy did not change the average reflectance of the helophyte alone.
According to separability analysis the best bands to discriminate among all the different pairs of species comparisons were the red edge band (Average Z = 3.03) and NIR band (Average Z = 2.27). The best discrimination was found between Ranunculus and grasses and between Ranunculus and the bulrush (average Z = 3.99 and average Z = 3.16). The less informative band was found to be the red band (average Z = 1.06) and the most difficult pair of species to be discriminated among each other were bulrush and bulrush with Azolla, and bulrush with Azolla and Ranunculus.
4.3. Reflectance Comparison with S2 Images
Visual assessment of overlay between S2 images and Sequoia spectral orthomosaics showed good color agreement both for Doñana and Braila study areas (Figure 4). Some linear elements, such as fences and buildings, were used to assess geometric matching which was always below one S2 pixel size.
Table 4 shows the values of the coefficient of determination (R2) calculated band to band between Sequoia and the corresponding S2 spectral bands. RMSE are also provided for comparisons purposes.
Although most of the bands show very high and positive correlation, there are still some discrepancies between both sensors. Consistently RMSE values are low, so that reflectances from both sensors can be compared despite having different spectral resolution.
4.4. Upscaling of Ground-Truth Information from Inundation to S2 Images
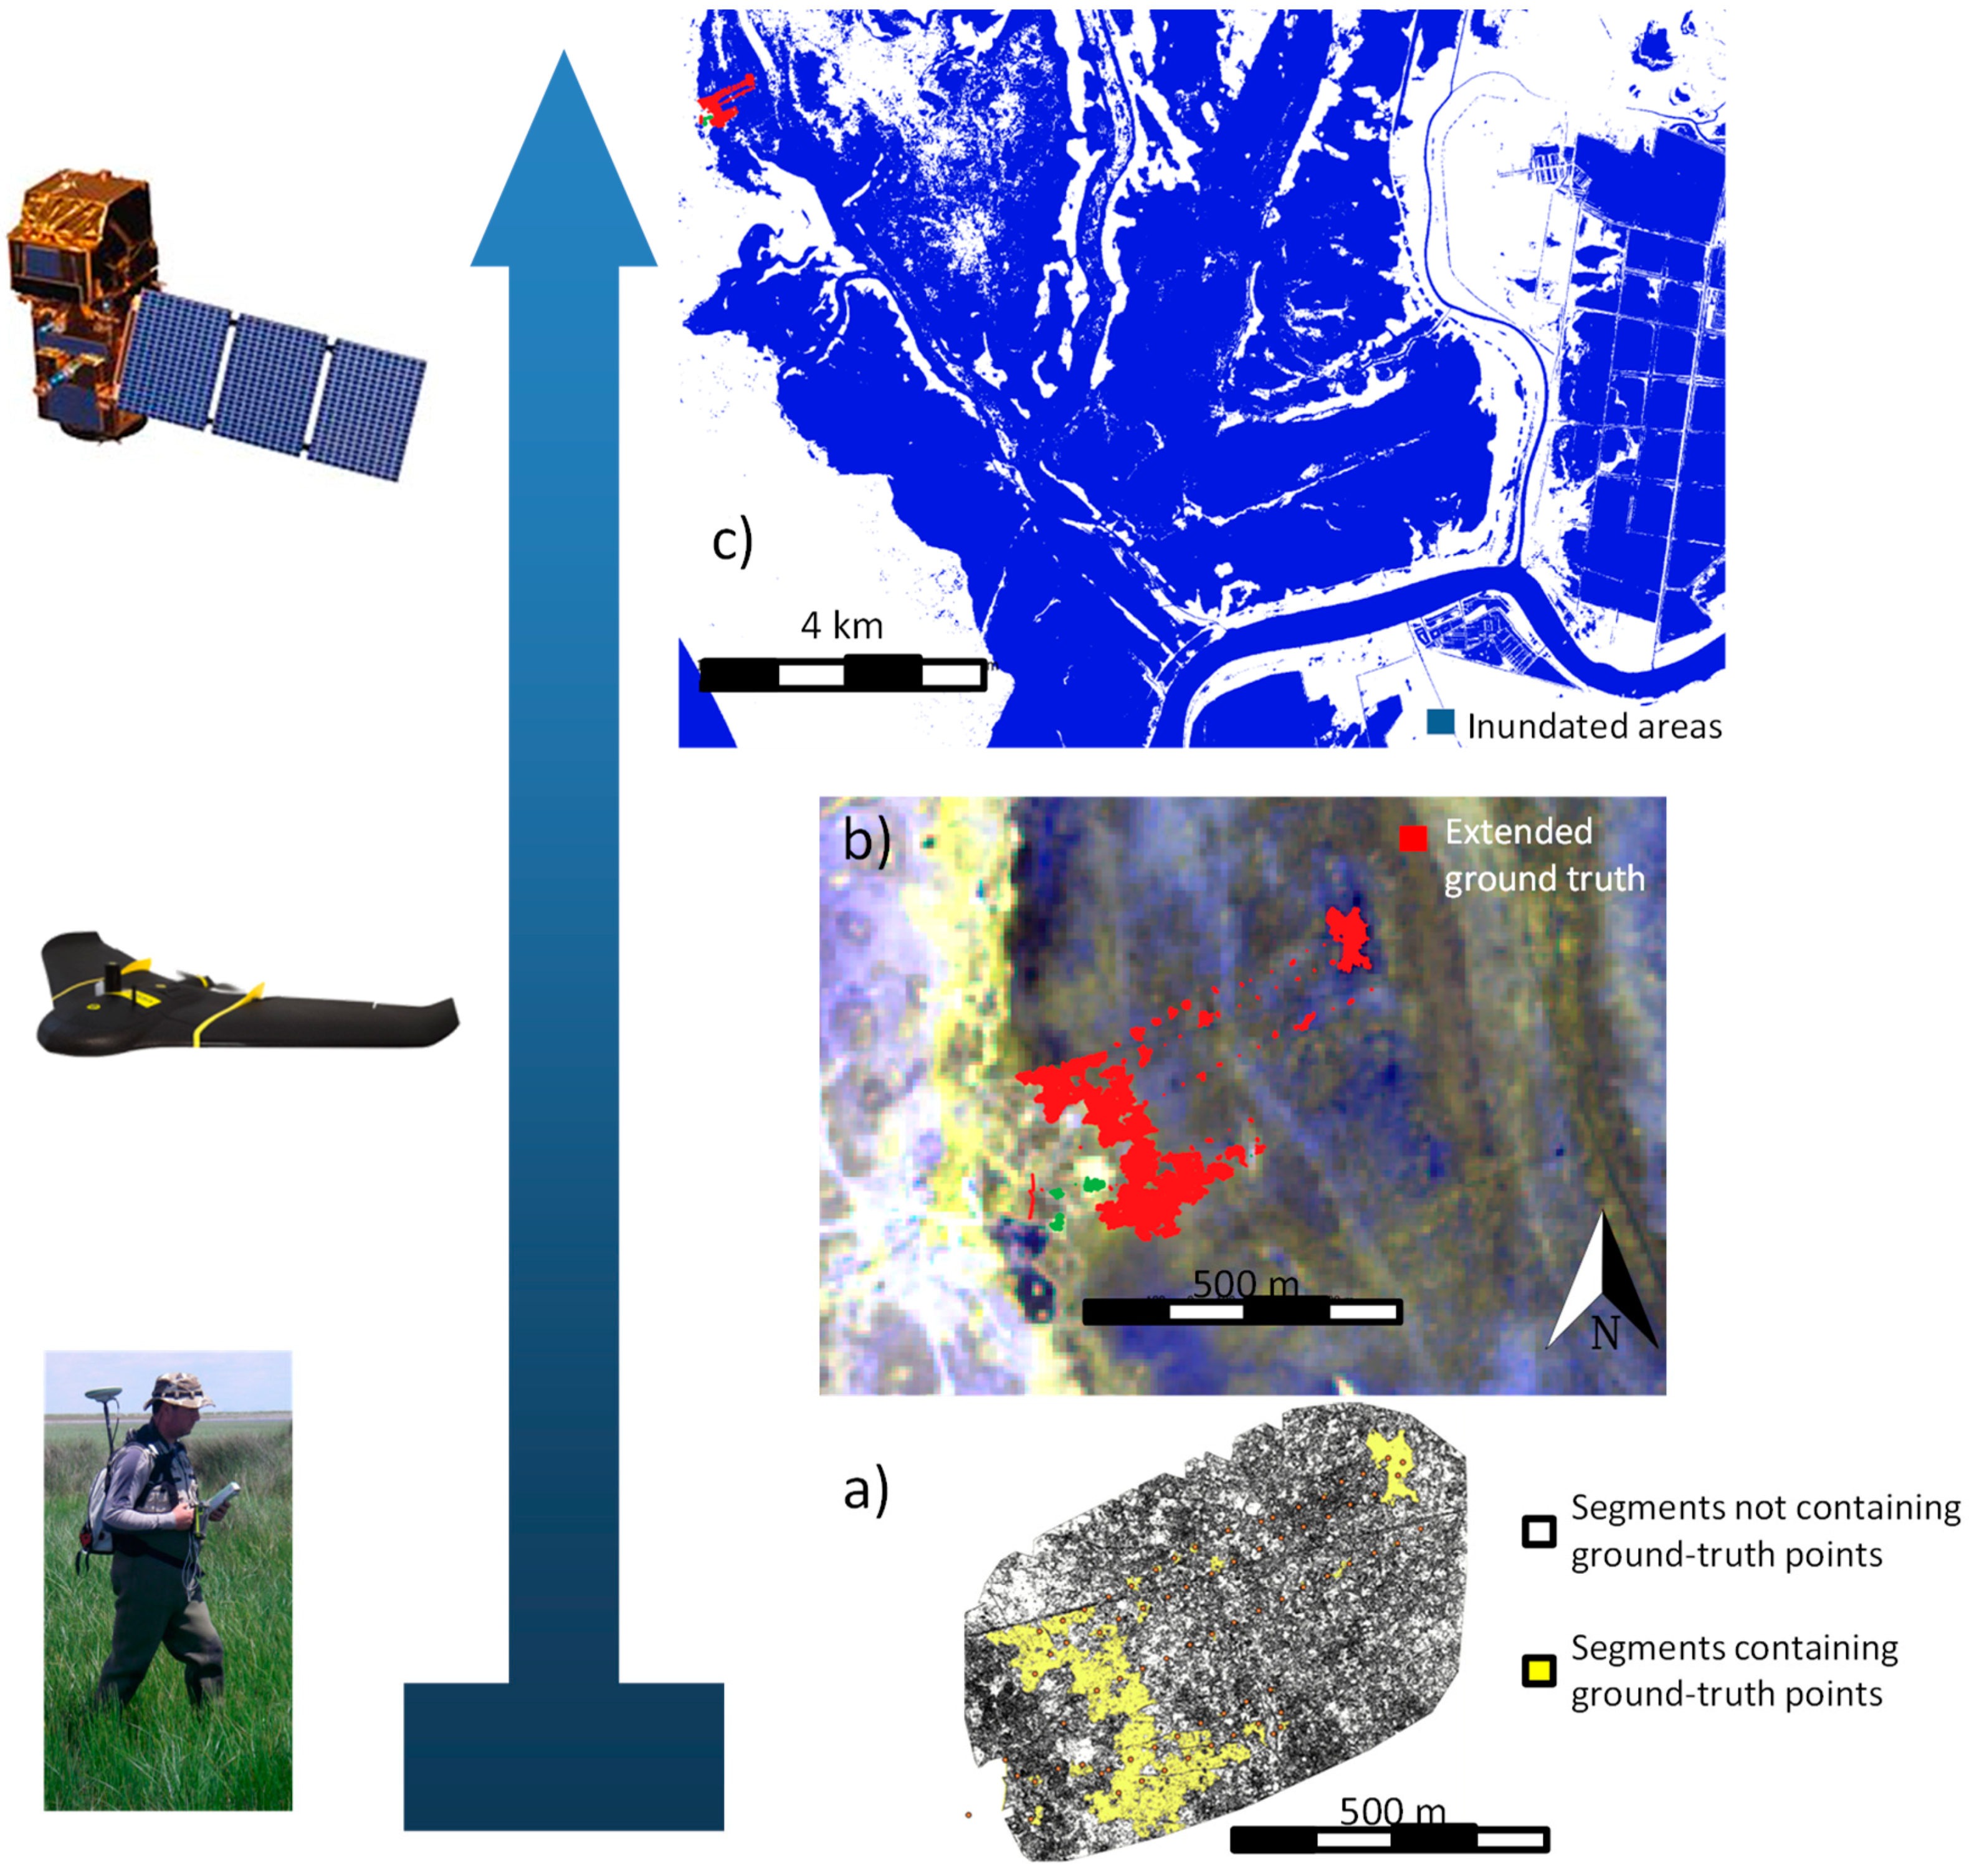
After the application of segmentation to the multispectral Sequoia orthomosaic we extended the ground-truth point information to the segments containing such points. This procedure enlarged the sampling area from 0.51 ha (51 points assigned by location to 51 S2 pixels used for modeling) up to 14.47 ha. We tested the classification of inundated areas by estimating the optimal threshold using the regression tree method, this time with the equivalent NIR band for S2, i.e., band 7. Reflectance values lower than 0.1964 were classified as inundated for the Doñana marsh area in the S2 scene (Figure 8). Overall agreement was 74% and kappa index value was 0.48.
5. Discussion
Our work has demonstrated the applicability of multispectral mapping by UAVs in retrieving interesting remote sensing (RS) indicators relevant to assess ecological integrity (EI) in wetlands. Although a detailed set of EI indicators have been proposed to be used in LTER sites, here we suggest a set of practical remote sensing indicators and variables that can be used to evaluate wetlands condition by means of UAVs. The two studied wetlands are subject to similar drivers and pressures leading to changes in inundation level, hydroperiod or water quality [82]. Linked to these variables, percent plant cover of aquatic plants or floodplain trees is also a good EI indicator informing on both biotic diversity and within habitat diversity. In our case, the rapid assessment of inundation, water turbidity, percent plant cover and percentage of open water was very useful for managers in decision making in relation to Azolla filiculoides distribution which needs to be periodically assessed [29,83].
Aside from the good performance of UAV mapping, the study also demonstrates the rapid operation provided by this type of integrated solutions such as SenseFly eBee equipped with Parrot Sequoia multispectral camera. Mission planning can be designed just the same day of the flight and modified according to weather conditions, specifically wind direction and speed. The only constraint being the necessity of open and clear areas for landing which became evident while flying in the Small Island of Braila. Its low weight and manageability make of it very easy equipment to be transported even from one country to another. In addition, geometric correction can be satisfactory in the cases where no ground control points can be set, such as wetlands. The use of ground control points representative of large homogeneous areas reduces the effect of geometric error on thematic accuracy [67].
Through the many empirical modeling we found significant linear relationships between Sequoia spectral bands and indices and several RS wetlands indicators. The most informative band was band 4 in the NIR region. In general, Red and Green Sequoia bands were not informative for any of the analyses what might be linked to the saturation issues found for these bands by González-Piqueras et al. [84]. NIR was successfully related to percent open water and water depth while the spectral index NDRE was highly correlated with percentage of aquatic emergent plant cover, as reported in few other studies [85,86] but very weakly with water depth. Aquatic emergent plant height did only show low significant fits with the green band and not with the vegetation height model (VHM). Although VHM has been shown to work for crops [76], further investigation is required to enhance the application on aquatic vegetation. Aquatic emergent plants can be found with different plant densities and percent cover what might affect plant height retrieval from image matching [77]. Water turbidity was also significantly modeled through a linear relationship with the spectral index NDWI as already suggested by McFeeters [47] when it was proposed. However, only accurate results were found while applied on inundated areas with percentage open water higher than 50%. We used these models to generate the mapping for the remote sensing wetland indicators over the whole overflown areas (Figure 6).
Few aquatic plant species showed high spectral separability mainly using Red Edge and NIR bands [56]. The spectral signature of floating macrophytes was clearly separable from helophytes and grasses. However, the mapping of Azolla filiculoides, the alien invasive species in the understorey of bulrush was not noticeable for Sequoia bands. Previous studies have shown the difficulty of mapping aquatic ferns under a canopy of bulrush but the capability of identifying them while floating on open waters [15,29]. Although our research shows a high spectral separability between emergent and floating species, further investigation has to be done in examining the relationship of these practical RS wetlands indicators with the Essential Biodiversity Variables and Ecosystem Services [87].
Another relevant role played by UAV multispectral mapping evidenced in our work is the feasibility of enlarging the set of ground-truth data in such inaccessible or remote areas. By overflying areas where few ground points are sampled, based on spectral relationships as shown here, we can easily expand the ground-truth area to the whole flown area. Thus, we may easily increase sampling size for empirical modeling with satellite remote sensing imagery. In this study, we used the segmentation of multispectral orthomosaic from the UAV flight to enlarge ground-truth from the sampling points to the segments containing them. We only applied this upscaling for inundation mapping with Sentinel-2 images according to management request, although other RS wetland indicators might be upscaled too. The procedure allowed to accurately mapping inundation occurrence in Doñana marshes. While many upscaling studies have been carried out for crops [12,88] only few have been tested for natural vegetation [14,89,90] and none for aquatic vegetation. A different approach might be applied as well by directly using pixel values from the mapped wetland EI indicators as ground-truth data for the S2 scene. However, an estimation of the propagation error would be desirable for such an option as well as and assessment of the optimal resampling method from Sequoia to S2 pixels.
While scaling up ground-truth information, attention should be paid in the choice of the atmospheric correction model to be applied on satellite images. For instance, here we selected QGIS-SAC model based on DOS which may result in reflectance bias in comparison to other methods such as physical modeling or pseudo-invariant areas [91]. Here we found a close band-to-band relationship between Sequoia and S2 reflectances, but still a 40% unexplained variance that might be due to such biases or to the differences in spectral resolution [92]. These findings have necessarily to be refined by using handheld spectroradiometers in coincidence with the flight campaigns and satellite image acquisition.
We also want to emphasize the possibility to add temporal dimension to this kind of rapid assessments. Any mission might be repeated with the same planning during the inundation period or after sudden changes. These frequent missions will clearly enhance the data to model other relevant RS wetlands indicators such as hydroperiod [67]. In addition, recovery processes after disturbances can also be evidenced using a time series of UAV multispectral images [93,94].
6. Conclusions
In this paper, we confirmed the valuable and fast applicability of multispectral images captured by UAVs over two LTSER wetland sites in providing detailed mapping of inundation levels, water turbidity, and depth as well as aquatic plant cover. The resulting maps can play as detailed inputs to assess habitat diversity, wetlands dynamics, and ecosystem productivity and updated as frequently requested by managers or scientists. UAVs can easily reach remote areas with short-time flights resulting in an enlargement of the surveyed area (while allowed by local authorities). This advantage can definitely contribute to increase the area for ground-truth purposes when used for upscaling to satellite images. We tested the coherence between Sentinel-2 MSI bands and Parrot Sequoia showing the close multispectral relationship what makes possible the transference of UAV-scale to satellite-scale models.
Author Contributions
Conceptualization, R.D.-D. and M.A.; Formal analysis, R.D.-D.; Funding acquisition, R.D.-D. and M.A.; Investigation, R.D.-D. and M.A.; Methodology, R.D.-D.; Project administration, R.D.-D. and M.A.; Resources, C.C. and M.A.; Software, R.D.-D.; Supervision, M.A.; Validation, R.D.-D. and C.C.; Writing—original draft, R.D.-D.; Writing—review & editing, R.D.-D., C.C. and M.A.
Funding
The authors have received funding from the European Union’s Horizon 2020 research and innovation program under grant agreements no. 654359 (eLTER Horizon 2020 project) and no. 641762 (ECOPOTENTIAL Horizon 2020 project). The authors have also received funding from the Romanian Space Agency under grant agreement 145/20.07.2017 “Integrated platform for monitoring of aquatic and terrestrial ecosystems based on in situ and satellite measurements” (RISE).
Acknowledgments
We are grateful to Espacio Natural de Doñana and Braila Island managers who provided permits for fieldwork in the protected areas with restricted access and to David Aragonés and Marco Antonio Espinosa who carried out the field sampling.
Conflicts of Interest
The authors declare no conflict of interest. The founding sponsors had no role in the design of the study; in the collection, analyses, or interpretation of data; in the writing of the manuscript, or in the decision to publish the results.
References
- Díaz-Delgado, R.; Hurford, C.; Lucas, R. Introducing the Book “The Roles of Remote Sensing in Nature Conservation.” In The Roles of Remote Sensing in Nature Conservation; Springer: Cham, Switzerland, 2017; pp. 3–10. ISBN 978-3-319-64330-4. [Google Scholar]
- Ripple, W.J.; Wolf, C.; Newsome, T.M.; Galetti, M.; Alamgir, M.; Crist, E.; Mahmoud, M.I.; Laurance, W.F. World Scientists’ Warning to Humanity: A Second Notice. BioScience 2017, 67, 1026–1028. [Google Scholar] [CrossRef] [Green Version]
- Vaughan, H.; Brydges, T.; Fenech, A.; Lumb, A. Monitoring long-term ecological changes through the ecological monitoring and assessment network: Science-based and policy relevant. Environ. Monit. Assess. 2001, 67, 3–28. [Google Scholar] [CrossRef] [PubMed]
- Díaz-Delgado, R. An Integrated Monitoring Programme for Doñana Natural Space: The Set-Up and Implementation. In Conservation Monitoring in Freshwater Habitats; Springer: Dordrecht, The Netherlands; Heidelberg, Germany; London, UK; New York, NY, USA, 2010; pp. 325–337. ISBN 978-1-4020-9278-7. [Google Scholar]
- Haase, P.; Tonkin, J.D.; Stoll, S.; Burkhard, B.; Frenzel, M.; Geijzendorffer, I.R.; Häuser, C.; Klotz, S.; Kühn, I.; McDowell, W.H.; et al. The next generation of site-based long-term ecological monitoring: Linking essential biodiversity variables and ecosystem integrity. Sci. Total Environ. 2018, 613–614, 1376–1384. [Google Scholar] [CrossRef] [PubMed]
- Müller, F.; Hoffmann-Kroll, R.; Wiggering, H. Indicating ecosystem integrity—Theoretical concepts and environmental requirements. Ecol. Model. 2000, 130, 13–23. [Google Scholar] [CrossRef]
- Müller, F.; Gnauck, A.; Wenkel, K.-O.; Schubert, H.; Bredemeier, M. Theoretical Demands for Long-Term Ecological Research and the Management of Long-Term Data Sets. In Long-Term Ecological Research; Springer: Dordrecht, The Netherlands, 2010; pp. 11–25. ISBN 978-90-481-8781-2. [Google Scholar]
- Singh, S.J.; Haberl, H.; Chertow, M.; Mirtl, M.; Schmid, M. Long Term Socio-Ecological Research: Studies in Society-Nature Interactions Across Spatial and Temporal Scales; Springer Science & Business Media: Dordrecht, The Netherlands, 2012; ISBN 978-94-007-1177-8. [Google Scholar]
- Mirtl, M.; Orenstein, D.E.; Wildenberg, M.; Peterseil, J.; Frenzel, M. Development of LTSER Platforms in LTER-Europe: Challenges and Experiences in Implementing Place-Based Long-Term Socio-ecological Research in Selected Regions; Springer: Dordrecht, The Netherlands, 2013; ISBN 978-94-007-1176-1. [Google Scholar]
- De Groot, R.S.; Alkemade, R.; Braat, L.; Hein, L.; Willemen, L. Challenges in integrating the concept of ecosystem services and values in landscape planning, management and decision making. Ecol. Complex. 2010, 7, 260–272. [Google Scholar] [CrossRef]
- Lucas, R.; Díaz-Delgado, R.; Hurford, C. Expected Advances in a Rapidly Developing Work Area. In The Roles of Remote Sensing in Nature Conservation; Springer: Cham, Switzerland, 2017; pp. 309–318. ISBN 978-3-319-64330-4. [Google Scholar]
- Zarco-Tejada, P.J.; Miller, J.R.; Noland, T.L.; Mohammed, G.H.; Sampson, P.H. Scaling-up and model inversion methods with narrowband optical indices for chlorophyll content estimation in closed forest canopies with hyperspectral data. IEEE Trans. Geosci. Remote Sens. 2001, 39, 1491–1507. [Google Scholar] [CrossRef] [Green Version]
- Manfreda, S.; McCabe, M.; Miller, P.; Lucas, R.; Pajuelo Madrigal, V.; Mallinis, G.; Ben Dor, E.; Helman, D.; Estes, L.; Ciraolo, G.; et al. On the Use of Unmanned Aerial Systems for Environmental Monitoring. Remote Sens. 2018, 10, 641. [Google Scholar] [CrossRef]
- Laliberte, A.S.; Goforth, M.A.; Steele, C.M.; Rango, A. Multispectral Remote Sensing from Unmanned Aircraft: Image Processing Workflows and Applications for Rangeland Environments. Remote Sens. 2011, 3, 2529–2551. [Google Scholar] [CrossRef] [Green Version]
- Díaz-Delgado, R. Long-Term Ecological Monitoring at the Landscape Scale for Nature Conservation: The Example of Doñana Protected Area. In The Roles of Remote Sensing in Nature Conservation; Springer: Cham, Switzerland, 2017; pp. 65–76. ISBN 978-3-319-64330-4. [Google Scholar]
- Lumbierres, M.; Méndez, P.F.; Bustamante, J.; Soriguer, R.; Santamaría, L. Modeling Biomass Production in Seasonal Wetlands Using MODIS NDVI Land Surface Phenology. Remote Sens. 2017, 9, 392. [Google Scholar] [CrossRef]
- Green, A.J.; Alcorlo, P.; Peeters, E.T.; Morris, E.P.; Espinar, J.L.; Bravo-Utrera, M.A.; Bustamante, J.; Díaz-Delgado, R.; Koelmans, A.A.; Mateo, R.; et al. Creating a safe operating space for wetlands in a changing climate. Front. Ecol. Environ. 2017, 15, 99–107. [Google Scholar] [CrossRef] [Green Version]
- Brouwer, R.; Bliem, M.; Getzner, M.; Kerekes, S.; Milton, S.; Palarie, T.; Szerényi, Z.; Vadineanu, A.; Wagtendonk, A. Valuation and transferability of the non-market benefits of river restoration in the Danube river basin using a choice experiment. Ecol. Eng. 2016, 87, 20–29. [Google Scholar] [CrossRef]
- Schwarz, U. Hydromorphology of the Danube. In The Danube River Basin; The Handbook of Environmental Chemistry; Springer: Berlin/Heidelberg, Germany, 2014; pp. 469–479. ISBN 978-3-662-47738-0. [Google Scholar]
- Dick, J.; Orenstein, D.E.; Holzer, J.; Wohner, C.; Achard, A.-L.; Andrews, C.; Avriel-Avni, N.; Beja, P.; Blond, N.; Cabello, J.; et al. What is socio-ecological research delivering? A literature survey across 25 international LTSER platforms. Sci. Total Environ. 2018, 622–623, 1225–1240. [Google Scholar] [CrossRef] [PubMed]
- Pereira, H.M.; Ferrier, S.; Walters, M.; Geller, G.N.; Jongman, R.H.G.; Scholes, R.J.; Bruford, M.W.; Brummitt, N.; Butchart, S.H.M.; Cardoso, A.C.; et al. Essential Biodiversity Variables. Science 2013, 339, 277–278. [Google Scholar] [CrossRef] [PubMed] [Green Version]
- Pettorelli, N.; Wegmann, M.; Skidmore, A.; Mücher, S.; Dawson, T.P.; Fernandez, M.; Lucas, R.; Schaepman, M.E.; Wang, T.; O’Connor, B.; et al. Framing the concept of satellite remote sensing essential biodiversity variables: Challenges and future directions. Remote Sens. Ecol. Conserv. 2016, 2, 122–131. [Google Scholar] [CrossRef]
- Vihervaara, P.; Auvinen, A.-P.; Mononen, L.; Törmä, M.; Ahlroth, P.; Anttila, S.; Böttcher, K.; Forsius, M.; Heino, J.; Heliölä, J.; et al. How Essential Biodiversity Variables and remote sensing can help national biodiversity monitoring. Glob. Ecol. Conserv. 2017, 10, 43–59. [Google Scholar] [CrossRef]
- Fritz, C.; Dörnhöfer, K.; Schneider, T.; Geist, J.; Oppelt, N. Mapping Submerged Aquatic Vegetation Using RapidEye Satellite Data: The Example of Lake Kummerow (Germany). Water 2017, 9, 510. [Google Scholar] [CrossRef]
- Belluco, E.; Camuffo, M.; Ferrari, S.; Modenese, L.; Silvestri, S.; Marani, A.; Marani, M. Mapping salt-marsh vegetation by multispectral and hyperspectral remote sensing. Remote Sens. Environ. 2006, 105, 54–67. [Google Scholar] [CrossRef]
- Hirano, A.; Madden, M.; Welch, R. Hyperspectral image data for mapping wetland vegetation. Wetlands 2003, 23, 436–448. [Google Scholar] [CrossRef]
- Rodríguez-González, P.M.; Albuquerque, A.; Martínez-Almarza, M.; Díaz-Delgado, R. Long-term monitoring for conservation management: Lessons from a case study integrating remote sensing and field approaches in floodplain forests. J. Environ. Manage. 2017. [Google Scholar] [CrossRef] [PubMed]
- Townsend, P.A.; Walsh, S.J. Remote sensing of forested wetlands: Application of multitemporal and multispectral satellite imagery to determine plant community composition and structure in southeastern USA. Plant Ecol. 2001, 157, 129–149. [Google Scholar] [CrossRef]
- Espinar, J.L.; Diaz-Delgado, R.; Bravo-Utrera, M.Á.; Vilà, M. Linking Azolla filiculoides invasion to increased winter temperatures in the Doñana marshland (SW Spain). Aquat. Invasions 2015, 10, 17–24. [Google Scholar] [CrossRef] [Green Version]
- Díaz-Delgado, R.; Aragonés, D.; Ameztoy, I.; Bustamante, J. Monitoring marsh dynamics through remote sensing. In Conservation Monitoring in Freshwater Habitats; Hurford, C., Scheneider, M., Cowx, I., Eds.; Springer: Dordrecht, The Netherlands; Heidelberg, Germany; London, UK; New York, NY, USA, 2010; pp. 375–386. [Google Scholar]
- Bustamante, J.; Aragonés, D.; Afán, I.; Luque, C.J.; Pérez-Vázquez, A.; Castellanos, E.M.; Díaz-Delgado, R. Hyperspectral Sensors as a Management Tool to Prevent the Invasion of the Exotic Cordgrass Spartina densiflora in the Doñana Wetlands. Remote Sens. 2016, 8, 1001. [Google Scholar] [CrossRef]
- Hestir, E.L.; Khanna, S.; Andrew, M.E.; Santos, M.J.; Viers, J.H.; Greenberg, J.A.; Rajapakse, S.S.; Ustin, S.L. Identification of invasive vegetation using hyperspectral remote sensing in the California Delta ecosystem. Remote Sens. Environ. 2008, 112, 4034–4047. [Google Scholar] [CrossRef]
- Díaz-Delgado, R.; Mañez, M.; Martínez, A.; Canal, D.; Ferrer, M.; Aragonés, D. Using UAVs to Map Aquatic Bird Colonies. In The Roles of Remote Sensing in Nature Conservation; Springer: Cham, Switzerland, 2017; pp. 277–291. ISBN 978-3-319-64330-4. [Google Scholar]
- Sardà-Palomera, F.; Bota, G.; Padilla, N.; Brotons, L.; Sardà, F. Unmanned aircraft systems to unravel spatial and temporal factors affecting dynamics of colony formation and nesting success in birds. J. Avian Biol. 2017, 48, 1273–1280. [Google Scholar] [CrossRef]
- Anderson, K.; Gaston, K.J. Lightweight unmanned aerial vehicles will revolutionize spatial ecology. Front. Ecol. Environ. 2013, 11, 138–146. [Google Scholar] [CrossRef] [Green Version]
- Hodgson, A.; Kelly, N.; Peel, D. Unmanned Aerial Vehicles (UAVs) for Surveying Marine Fauna: A Dugong Case Study. PLOS ONE 2013, 8, e79556. [Google Scholar] [CrossRef] [PubMed]
- Hodgson, J.C.; Baylis, S.M.; Mott, R.; Herrod, A.; Clarke, R.H. Precision wildlife monitoring using unmanned aerial vehicles. Sci. Rep. 2016, 6, 22574. [Google Scholar] [CrossRef] [Green Version]
- Kerr, J.T.; Ostrovsky, M. From space to species: Ecological applications for remote sensing. Trends Ecol. Evol. 2003, 18, 299–305. [Google Scholar] [CrossRef]
- Seoane, J.; Bustamante, J.; Díaz-Delgado, R. Are existing vegetation maps adequate to predict bird distributions? Ecol. Model. 2004, 175, 137–149. [Google Scholar] [CrossRef]
- Seoane, J.; Bustamante, J.; Díaz-Delgado, R. Competing roles for landscape, vegetation, topography and climate in predictive models of bird distribution. Ecol. Model. 2004, 171, 209–222. [Google Scholar] [CrossRef] [Green Version]
- Silva, T.S.F.; Costa, M.P.F.; Melack, J.M.; Novo, E.M.L.M. Remote sensing of aquatic vegetation: Theory and applications. Environ. Monit. Assess. 2008, 140, 131–145. [Google Scholar] [CrossRef] [PubMed]
- Lopez-Sanchez, J.M.; Vicente-Guijalba, F.; Erten, E.; Campos-Taberner, M.; Garcia-Haro, F.J. Retrieval of vegetation height in rice fields using polarimetric SAR interferometry with TanDEM-X data. Remote Sens. Environ. 2017, 192, 30–44. [Google Scholar] [CrossRef] [Green Version]
- DeFries, R.; Eshleman, K.N. Land-use change and hydrologic processes: A major focus for the future. Hydrol. Process. 2004, 18, 2183–2186. [Google Scholar] [CrossRef]
- Long, C.M.; Pavelsky, T.M. Remote sensing of suspended sediment concentration and hydrologic connectivity in a complex wetland environment. Remote Sens. Environ. 2013, 129, 197–209. [Google Scholar] [CrossRef]
- Bustamante, J.; Pacios, F.; Díaz-Delgado, R.; Aragonés, D. Predictive models of turbidity and water depth in the Doñana marshes using Landsat TM and ETM+ images. J. Environ. Manage. 2009, 90, 2219–2225. [Google Scholar] [CrossRef] [PubMed]
- Yamagata, Y.; Wiegand, C.; Akiyama, T.; Shibayama, M. Water turbidity and perpendicular vegetation indices for paddy rice flood damage analyses. Remote Sens. Environ. 1988, 26, 241–251. [Google Scholar] [CrossRef]
- McFeeters, S.K. The use of the Normalized Difference Water Index (NDWI) in the delineation of open water features. Int. J. Remote Sens. 1996, 17, 1425–1432. [Google Scholar] [CrossRef]
- Ritchie, J.C.; Zimba, P.V.; Everitt, J.H. Remote Sensing Techniques to Assess Water Quality. Photogramm. Eng. Remote Sens. 2003, 69, 695–704. [Google Scholar] [CrossRef]
- Torgersen, C.E.; Faux, R.N.; McIntosh, B.A.; Poage, N.J.; Norton, D.J. Airborne thermal remote sensing for water temperature assessment in rivers and streams. Remote Sens. Environ. 2001, 76, 386–398. [Google Scholar] [CrossRef]
- Jiménez-Muñoz, J.C.; Sobrino, J.A. A generalized single-channel method for retrieving land surface temperature from remote sensing data. J. Geophys. Res. Atmospheres 2003, 108, 4688. [Google Scholar] [CrossRef]
- Bisht, G.; Venturini, V.; Islam, S.; Jiang, L. Estimation of the net radiation using MODIS (Moderate Resolution Imaging Spectroradiometer) data for clear sky days. Remote Sens. Environ. 2005, 97, 52–67. [Google Scholar] [CrossRef]
- Ozesmi, S.L.; Bauer, M.E. Satellite remote sensing of wetlands. Wetl. Ecol. Manag. 2002, 10, 381–402. [Google Scholar] [CrossRef]
- Lu, B.; He, Y.; Liu, H.H.T. Mapping vegetation biophysical and biochemical properties using unmanned aerial vehicles-acquired imagery. Int. J. Remote Sens. 2018, 39, 5265–5287. [Google Scholar] [CrossRef]
- Peñuelas, J.; Gamon, J.A.; Griffin, K.L.; Field, C.B. Assessing community type, plant biomass, pigment composition, and photosynthetic efficiency of aquatic vegetation from spectral reflectance. Remote Sens. Environ. 1993, 46, 110–118. [Google Scholar] [CrossRef]
- Ma, J.; Song, K.; Wen, Z.; Zhao, Y.; Shang, Y.; Fang, C.; Du, J. Spatial Distribution of Diffuse Attenuation of Photosynthetic Active Radiation and Its Main Regulating Factors in Inland Waters of Northeast China. Remote Sens. 2016, 8, 964. [Google Scholar] [CrossRef]
- Adam, E.; Mutanga, O.; Rugege, D. Multispectral and hyperspectral remote sensing for identification and mapping of wetland vegetation: A review. Wetl. Ecol. Manag. 2010, 18, 281–296. [Google Scholar] [CrossRef]
- Giardino, C.; Pepe, M.; Brivio, P.A.; Ghezzi, P.; Zilioli, E. Detecting chlorophyll, Secchi disk depth and surface temperature in a sub-alpine lake using Landsat imagery. Sci. Total Environ. 2001, 268, 19–29. [Google Scholar] [CrossRef]
- Hestir, E.L.; Brando, V.E.; Bresciani, M.; Giardino, C.; Matta, E.; Villa, P.; Dekker, A.G. Measuring freshwater aquatic ecosystems: The need for a hyperspectral global mapping satellite mission. Remote Sens. Environ. 2015, 167, 181–195. [Google Scholar] [CrossRef]
- Knox, S.H.; Dronova, I.; Sturtevant, C.; Oikawa, P.Y.; Matthes, J.H.; Verfaillie, J.; Baldocchi, D. Using digital camera and Landsat imagery with eddy covariance data to model gross primary production in restored wetlands. Agric. For. Meteorol. 2017, 237–238, 233–245. [Google Scholar] [CrossRef]
- Kang, X.; Hao, Y.; Cui, X.; Chen, H.; Huang, S.; Du, Y.; Li, W.; Kardol, P.; Xiao, X.; Cui, L. Variability and Changes in Climate, Phenology, and Gross Primary Production of an Alpine Wetland Ecosystem. Remote Sens. 2016, 8, 391. [Google Scholar] [CrossRef]
- He, T.; Liang, S.; Wang, D.; Chen, X.; Song, D.-X.; Jiang, B. Land Surface Albedo Estimation from Chinese HJ Satellite Data Based on the Direct Estimation Approach. Remote Sens. 2015, 7, 5495–5510. [Google Scholar] [CrossRef] [Green Version]
- Zhang, K.; Kimball, J.S.; Running, S.W. A review of remote sensing based actual evapotranspiration estimation. Wiley Interdiscip. Rev. Water 2016, 3, 834–853. [Google Scholar] [CrossRef]
- Kutser, T.; Paavel, B.; Verpoorter, C.; Ligi, M.; Soomets, T.; Toming, K.; Casal, G. Remote Sensing of Black Lakes and Using 810 nm Reflectance Peak for Retrieving Water Quality Parameters of Optically Complex Waters. Remote Sens. 2016, 8, 497. [Google Scholar] [CrossRef]
- Oyama, Y.; Matsushita, B.; Fukushima, T. Distinguishing surface cyanobacterial blooms and aquatic macrophytes using Landsat/TM and ETM+ shortwave infrared bands. Remote Sens. Environ. 2015, 157, 35–47. [Google Scholar] [CrossRef]
- Zhang, M.; Ustin, S.L.; Rejmankova, E.; Sanderson, E.W. Monitoring Pacific coast salt marshes using remote sensing. Ecol. Appl. 1997, 7, 1039–1053. [Google Scholar] [CrossRef]
- DeVries, B.; Huang, C.; Lang, M.W.; Jones, J.W.; Huang, W.; Creed, I.F.; Carroll, M.L. Automated Quantification of Surface Water Inundation in Wetlands Using Optical Satellite Imagery. Remote Sens. 2017, 9, 807. [Google Scholar] [CrossRef]
- Díaz-Delgado, R.; Aragonés, D.; Afán, I.; Bustamante, J. Long-Term Monitoring of the Flooding Regime and Hydroperiod of Doñana Marshes with Landsat Time Series (1974–2014). Remote Sens. 2016, 8, 775. [Google Scholar] [Green Version]
- Jung, M.; Reichstein, M.; Ciais, P.; Seneviratne, S.I.; Sheffield, J.; Goulden, M.L.; Bonan, G.; Cescatti, A.; Chen, J.; de Jeu, R.; et al. Recent decline in the global land evapotranspiration trend due to limited moisture supply. Nature 2010, 467, 951. [Google Scholar] [CrossRef]
- Pádua, L.; Vanko, J.; Hruška, J.; Adão, T.; Sousa, J.J.; Peres, E.; Morais, R. UAS, sensors, and data processing in agroforestry: A review towards practical applications. Int. J. Remote Sens. 2017, 38, 2349–2391. [Google Scholar] [CrossRef]
- Franklin, S.E.; Ahmed, O.S.; Williams, G. Northern Conifer Forest Species Classification Using Multispectral Data Acquired from an Unmanned Aerial Vehicle. Photogramm. Eng. Remote Sens. 2017, 83, 501–507. [Google Scholar] [CrossRef]
- Shen, Y.-Y.; Cattau, M.; Borenstein, S.; Weibel, D.; Frew, E.W. Toward an Architecture for Subalpine Forest Health Monitoring Using Commercial Off-the-Shelf Unmanned Aircraft Systems and Sensors. In Proceedings of the 17th AIAA Aviation Technology, Integration, and Operations Conference, Denver, CO, USA, 5 June 2017. [Google Scholar]
- Ahmed, O.S.; Shemrock, A.; Chabot, D.; Dillon, C.; Williams, G.; Wasson, R.; Franklin, S.E. Hierarchical land cover and vegetation classification using multispectral data acquired from an unmanned aerial vehicle. Int. J. Remote Sens. 2017, 38, 2037–2052. [Google Scholar] [CrossRef]
- Unger, J.; Reich, M.; Heipke, C. UAV-based photogrammetry: Monitoring of a building zone. Int. Arch. Photogramm. Remote Sens.Spat. Inf. Sci. 2014, XL, 601–606. [Google Scholar] [CrossRef]
- Tilling, A.K.; O’Leary, G.J.; Ferwerda, J.G.; Jones, S.D.; Fitzgerald, G.J.; Rodriguez, D.; Belford, R. Remote sensing of nitrogen and water stress in wheat. Field Crops Res. 2007, 104, 77–85. [Google Scholar] [CrossRef]
- Rouse, J.W. Monitoring the Vernal Advancement and Retrogradation (Green Wave Effect) of Natural Vegetation; Technical report; Texas A&M Univ.; Remote Sensing Center: College Station, TX, USA, 1974. [Google Scholar]
- Bendig, J.; Yu, K.; Aasen, H.; Bolten, A.; Bennertz, S.; Broscheit, J.; Gnyp, M.L.; Bareth, G. Combining UAV-based plant height from crop surface models, visible, and near infrared vegetation indices for biomass monitoring in barley. Int. J. Appl. Earth Obs. Geoinformation 2015, 39, 79–87. [Google Scholar] [CrossRef]
- Ruzgienė, B.; Berteška, T.; Gečyte, S.; Jakubauskienė, E.; Aksamitauskas, V.Č. The surface modeling based on UAV Photogrammetry and qualitative estimation. Measurement 2015, 73, 619–627. [Google Scholar] [CrossRef]
- Davis, S.M.; Landgrebe, D.A.; Phillips, T.L.; Swain, P.H.; Hoffer, R.M.; Lindenlaub, J.C.; Silva, L.F. Remote Sensing: The Quantitative Approach; McGraw-Hill International Book Co: New York, NY, USA, 1978; p. 405. [Google Scholar]
- Congedo, L. Semi-Automatic Classification Plugin Documentation. Release 5.3.6.1. 2016. Available online: https://media.readthedocs.org/pdf/semiautomaticclassificationmanual-v5/latest/semiautomaticclassificationmanual-v5.pdf (accessed on 20 December 2018).
- Chavez, P.S. Image-based atmospheric corrections-revisited and improved. Photogramm. Eng. Remote Sens. 1996, 62, 1025–1035. [Google Scholar]
- Moran, M.S.; Jackson, R.D.; Slater, P.N.; Teillet, P.M. Evaluation of simplified procedures for retrieval of land surface reflectance factors from satellite sensor output. Remote Sens. Environ. 1992, 41, 169–184. [Google Scholar] [CrossRef]
- Haberl, H.; Gaube, V.; Díaz-Delgado, R.; Krauze, K.; Neuner, A.; Peterseil, J.; Plutzar, C.; Singh, S.J.; Vadineanu, A. Towards an integrated model of socioeconomic biodiversity drivers, pressures and impacts. A feasibility study based on three European long-term socio-ecological research platforms. Ecol. Econ. 2009, 68, 1797–1812. [Google Scholar] [CrossRef] [Green Version]
- Díaz-Delgado, R. Caso 5. La teledetección como herramienta en la cartografía de especies invasoras: Azolla filiculoides en Doñana. In Invasiones Biológicas; Vila, M., Valladares, F., Traveset, A., Santamaría, L., Castro, P., Eds.; Consejo Superior de Investigaciones Científicas: Madrid, Spain, 2008; pp. 159–163. [Google Scholar]
- González-Piqueras, J.; Sánchez, S.; Villodre, J.; López, H.; Calera, A.; Hernández-López, D.; Sánchez, J.M. Radiometric Performance of Multispectral Camera Applied to Operational Precision Agriculture. In Proceedings of the IGARSS 2018—2018 IEEE International Geoscience and Remote Sensing Symposium, Valencia, Spain, 22–27 July 2018; 2018; pp. 3393–3396. [Google Scholar]
- Cho, H.J.; Kirui, P.; Natarajan, H. Test of Multi-spectral Vegetation Index for Floating and Canopy-forming Submerged Vegetation. Int. J. Environ. Res. Public. Health 2008, 5, 477–483. [Google Scholar] [CrossRef] [Green Version]
- Jakubauskas, M.; Kindscher, K.; Fraser, A.; Debinski, D.; Price, K.P. Close-range remote sensing of aquatic macrophyte vegetation cover. Int. J. Remote Sens. 2000, 21, 3533–3538. [Google Scholar] [CrossRef] [Green Version]
- Alcaraz-Segura, D.; Bella, C.M.D.; Straschnoy, J.V. Earth Observation of Ecosystem Services, 1st ed.; CRC Press: Boca Raton, FL, USA, 2013; ISBN 978-1-4665-0588-9. [Google Scholar]
- Jay, S.; Baret, F.; Dutartre, D.; Malatesta, G.; Héno, S.; Comar, A.; Weiss, M.; Maupas, F. Exploiting the centimeter resolution of UAV multispectral imagery to improve remote-sensing estimates of canopy structure and biochemistry in sugar beet crops. Remote Sens. Environ. 2018. [Google Scholar] [CrossRef]
- Fraser, R.H.; Olthof, I.; Lantz, T.C.; Schmitt, C. UAV photogrammetry for mapping vegetation in the low-Arctic. Arct. Sci. 2016, 2, 79–102. [Google Scholar] [CrossRef] [Green Version]
- Nelson, P.; Paradis, D.P. Evaluating rapid ground sampling and scaling estimated plant cover using UAV imagery up to Landsat for mapping arctic vegetation. AGU Fall Meet. Abstr. 2017, 21. abstract #B21F-2016. [Google Scholar]
- Padró, J.-C.; Pons, X.; Aragonés, D.; Díaz-Delgado, R.; García, D.; Bustamante, J.; Pesquer, L.; Domingo-Marimon, C.; González-Guerrero, Ó.; Cristóbal, J.; et al. Radiometric correction of simultaneously acquired Landsat-7/Landsat-8 and Sentinel-2A imagery using Pseudoinvariant Areas (PIA): Contributing to the Landsat time series legacy. Remote Sens. 2017, 9, 1319. [Google Scholar] [CrossRef]
- Padró, J.-C.; Muñoz, F.-J.; Ávila, L.Á.; Pesquer, L.; Pons, X. Radiometric Correction of Landsat-8 and Sentinel-2A Scenes Using Drone Imagery in Synergy with Field Spectroradiometry. Remote Sens. 2018, 10, 1687. [Google Scholar] [CrossRef]
- Turner, D.; Lucieer, A.; de Jong, S.M. Time Series Analysis of Landslide Dynamics Using an Unmanned Aerial Vehicle (UAV). Remote Sens. 2015, 7, 1736–1757. [Google Scholar] [CrossRef] [Green Version]
- Suárez, L.; Zarco-Tejada, P.J.; González-Dugo, V.; Berni, J.A.J.; Sagardoy, R.; Morales, F.; Fereres, E. Detecting water stress effects on fruit quality in orchards with time-series PRI airborne imagery. Remote Sens. Environ. 2010, 114, 286–298. [Google Scholar] [CrossRef] [Green Version]
Figure 1.
(a) Location of the 28 LTSER platforms in Europe on top of biogeographical regions (modified from Mirtl et al. [9]). Many more have been created in other LTER regional networks [20]. (b) Zoom in at Braila Island LTSER platform limits (yellow line) and the study area where we carried out the UAV flight (green square). (c) Zoom in at Doñana LTSER platform limits (yellow line) and the study area (red line).

Figure 2.
UAV flight missions at (a) Doñana marshes and (b) Small Island of Braila. Image courtesy of 2018 Google©.
Figure 2.
UAV flight missions at (a) Doñana marshes and (b) Small Island of Braila. Image courtesy of 2018 Google©.

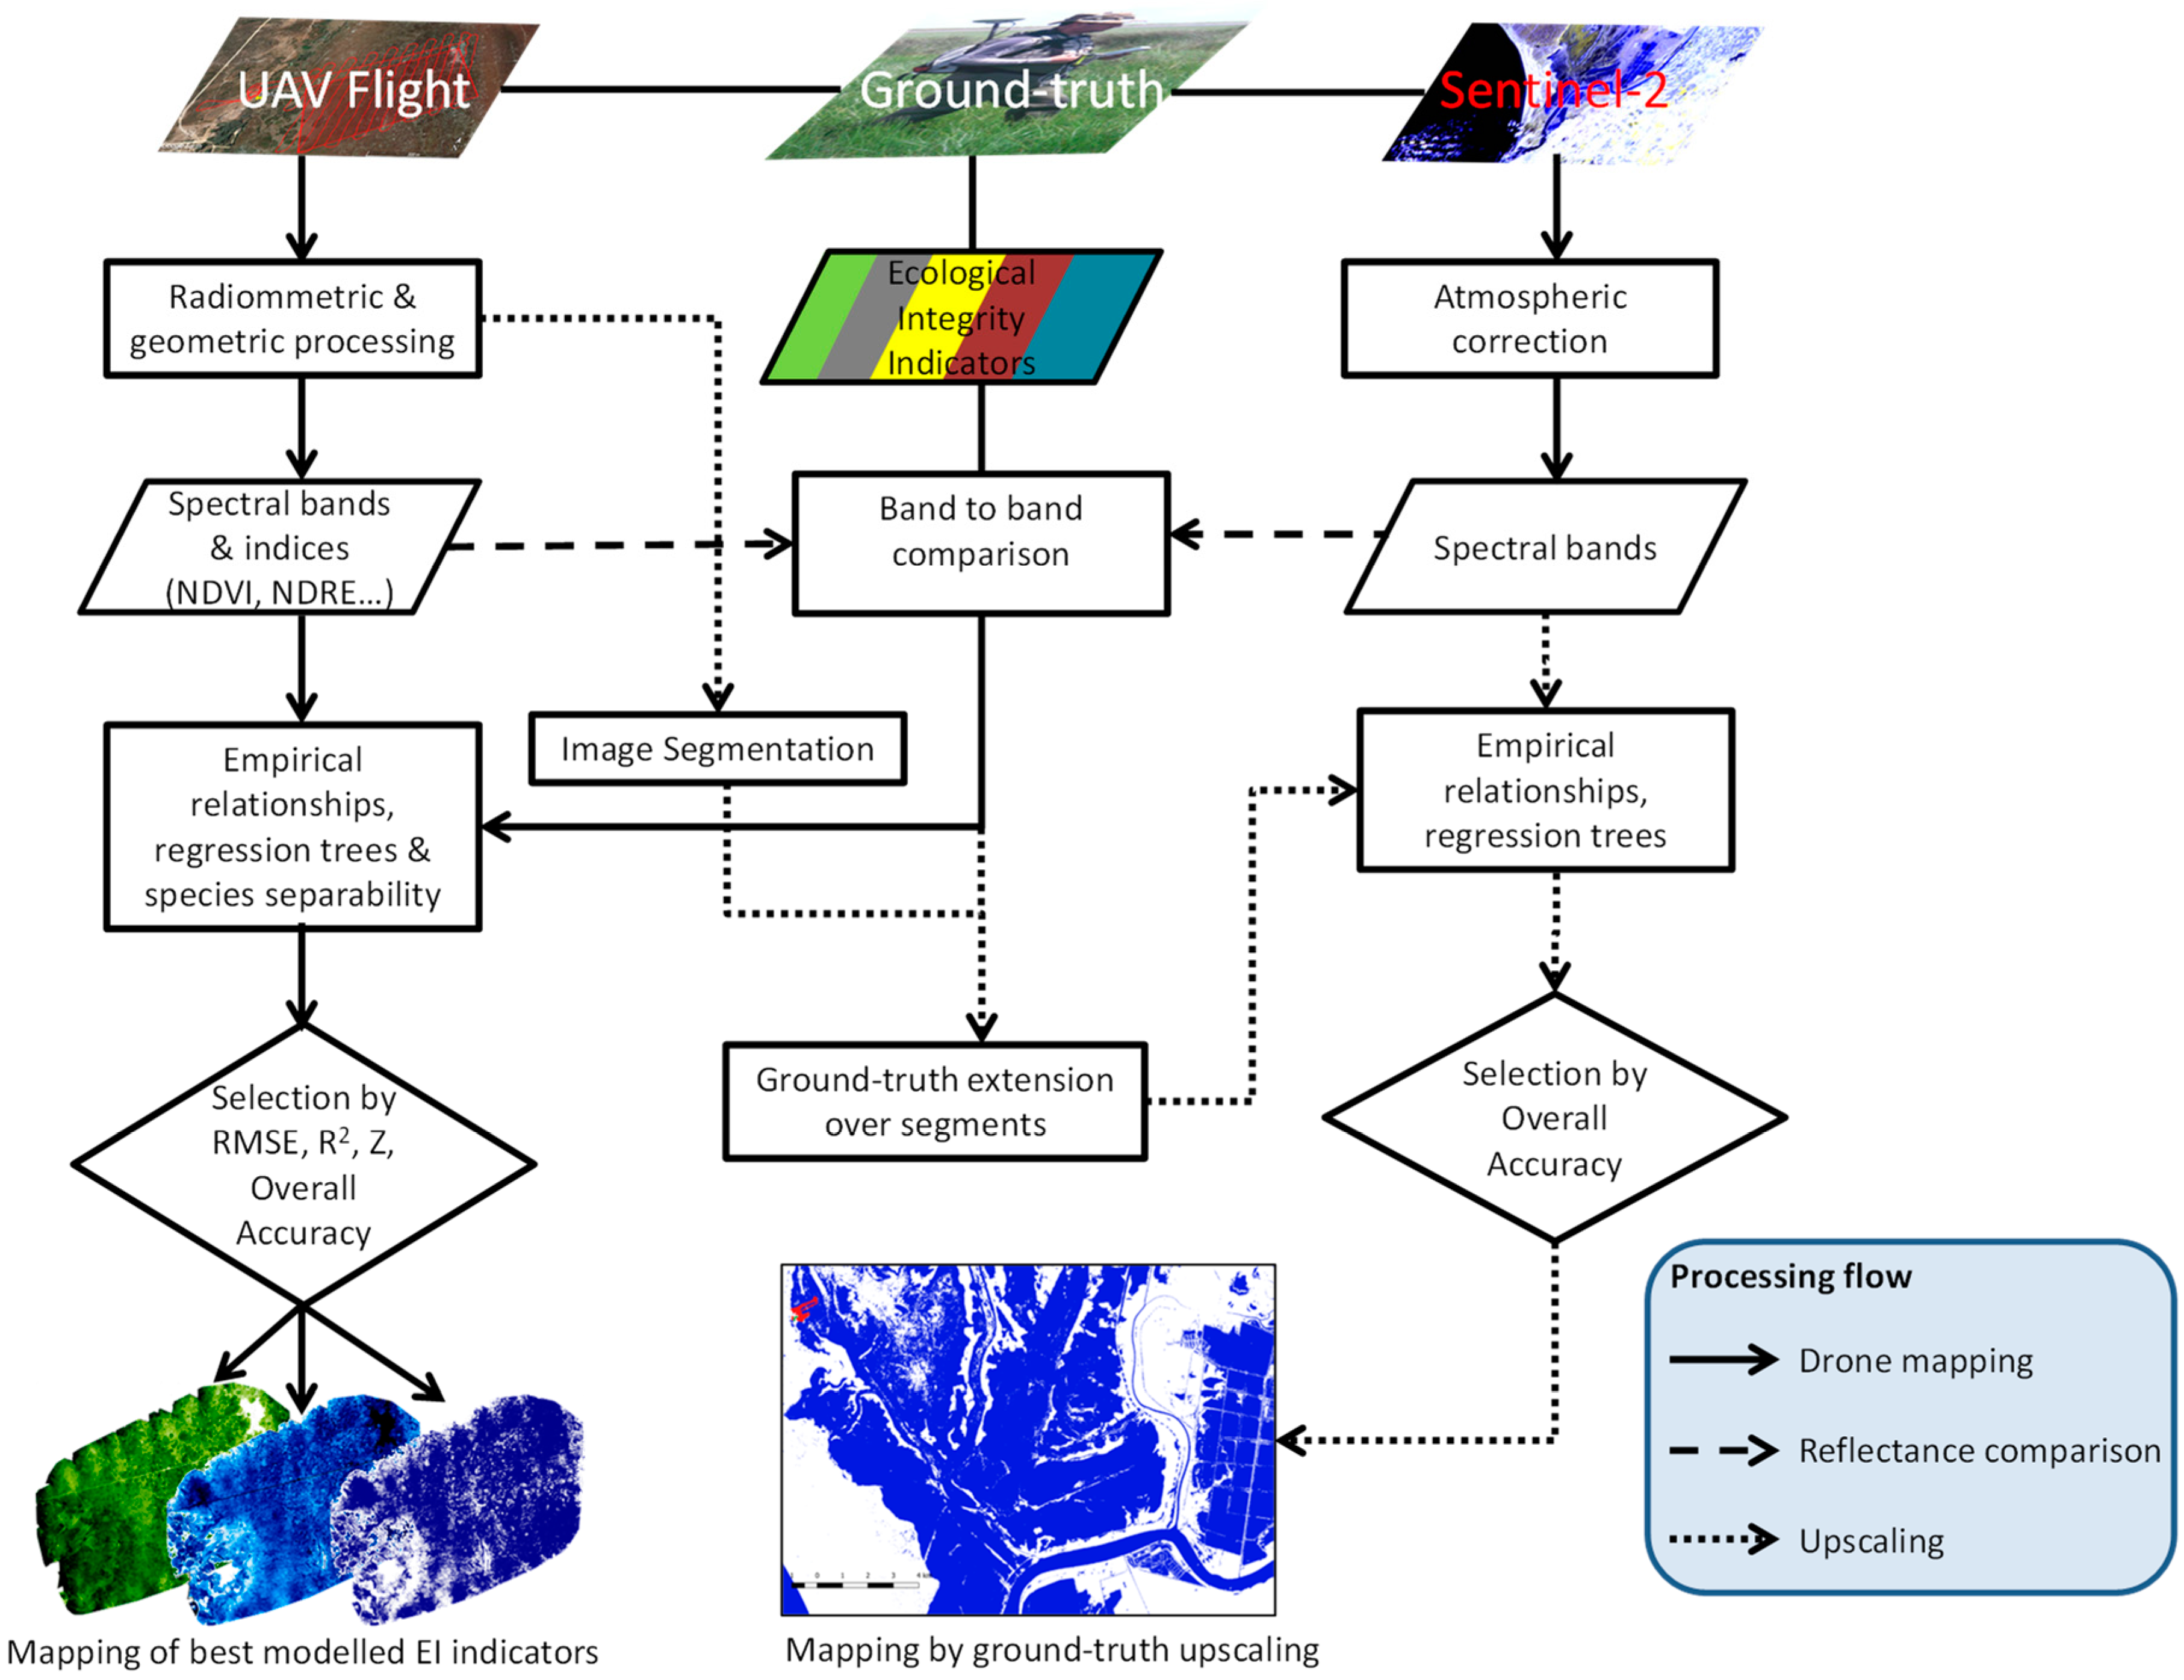
Figure 3.
Methodological workflow followed in this study.

Figure 4.
Location of ground-truth sampling points (red dots) in the Doñana study area. Background is composed by Sequoia multispectral orthomosaic on top of Sentinel-2 image equivalent wavelength composites (4-3-2 and 7-6-4).
Figure 4.
Location of ground-truth sampling points (red dots) in the Doñana study area. Background is composed by Sequoia multispectral orthomosaic on top of Sentinel-2 image equivalent wavelength composites (4-3-2 and 7-6-4).

Figure 5.
Overlay showing the edge of Sequoia multispectral orthomosaic on top of Bing Satellite in an area where two tracks and plant canopies were used to visually check geometric accuracy.
Figure 5.
Overlay showing the edge of Sequoia multispectral orthomosaic on top of Bing Satellite in an area where two tracks and plant canopies were used to visually check geometric accuracy.
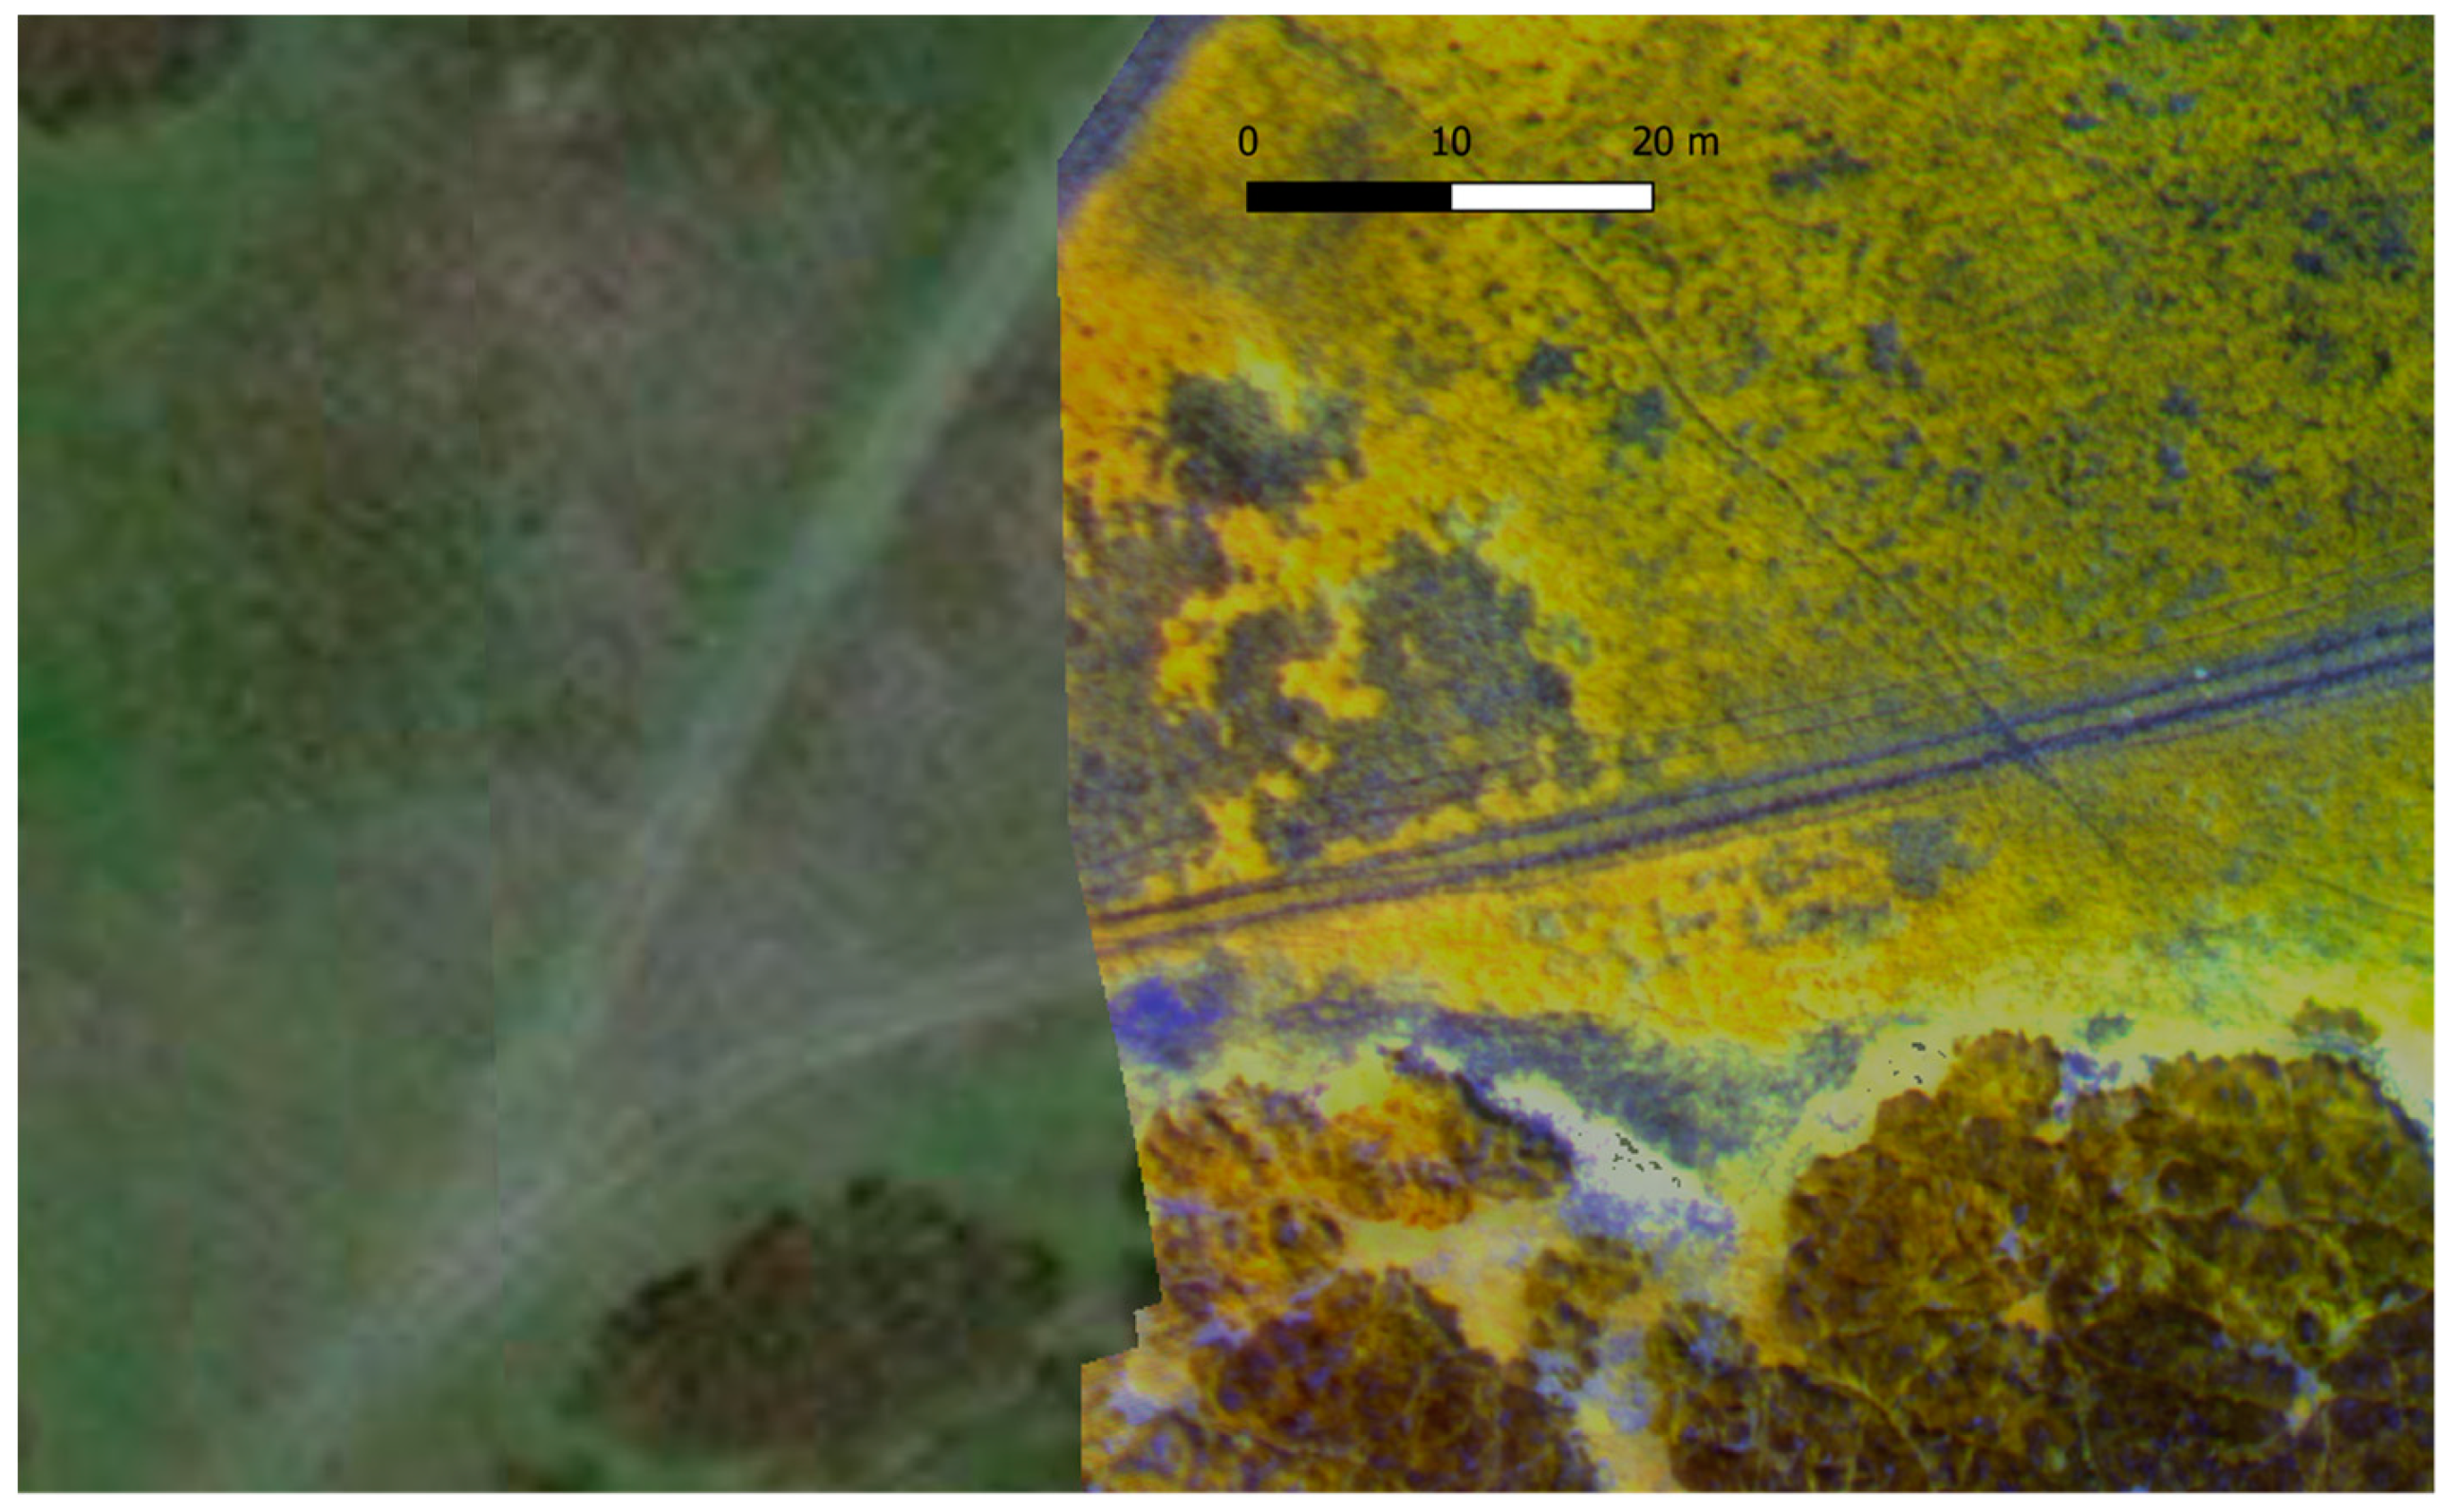
Figure 6.
Resulting maps of (a) percent cover of emergent vegetation, (b) percentage of open water (c) water turbidity for the open water area found inside the red square and (d) inundation for the overflown area in Doñana marshes.
Figure 6.
Resulting maps of (a) percent cover of emergent vegetation, (b) percentage of open water (c) water turbidity for the open water area found inside the red square and (d) inundation for the overflown area in Doñana marshes.
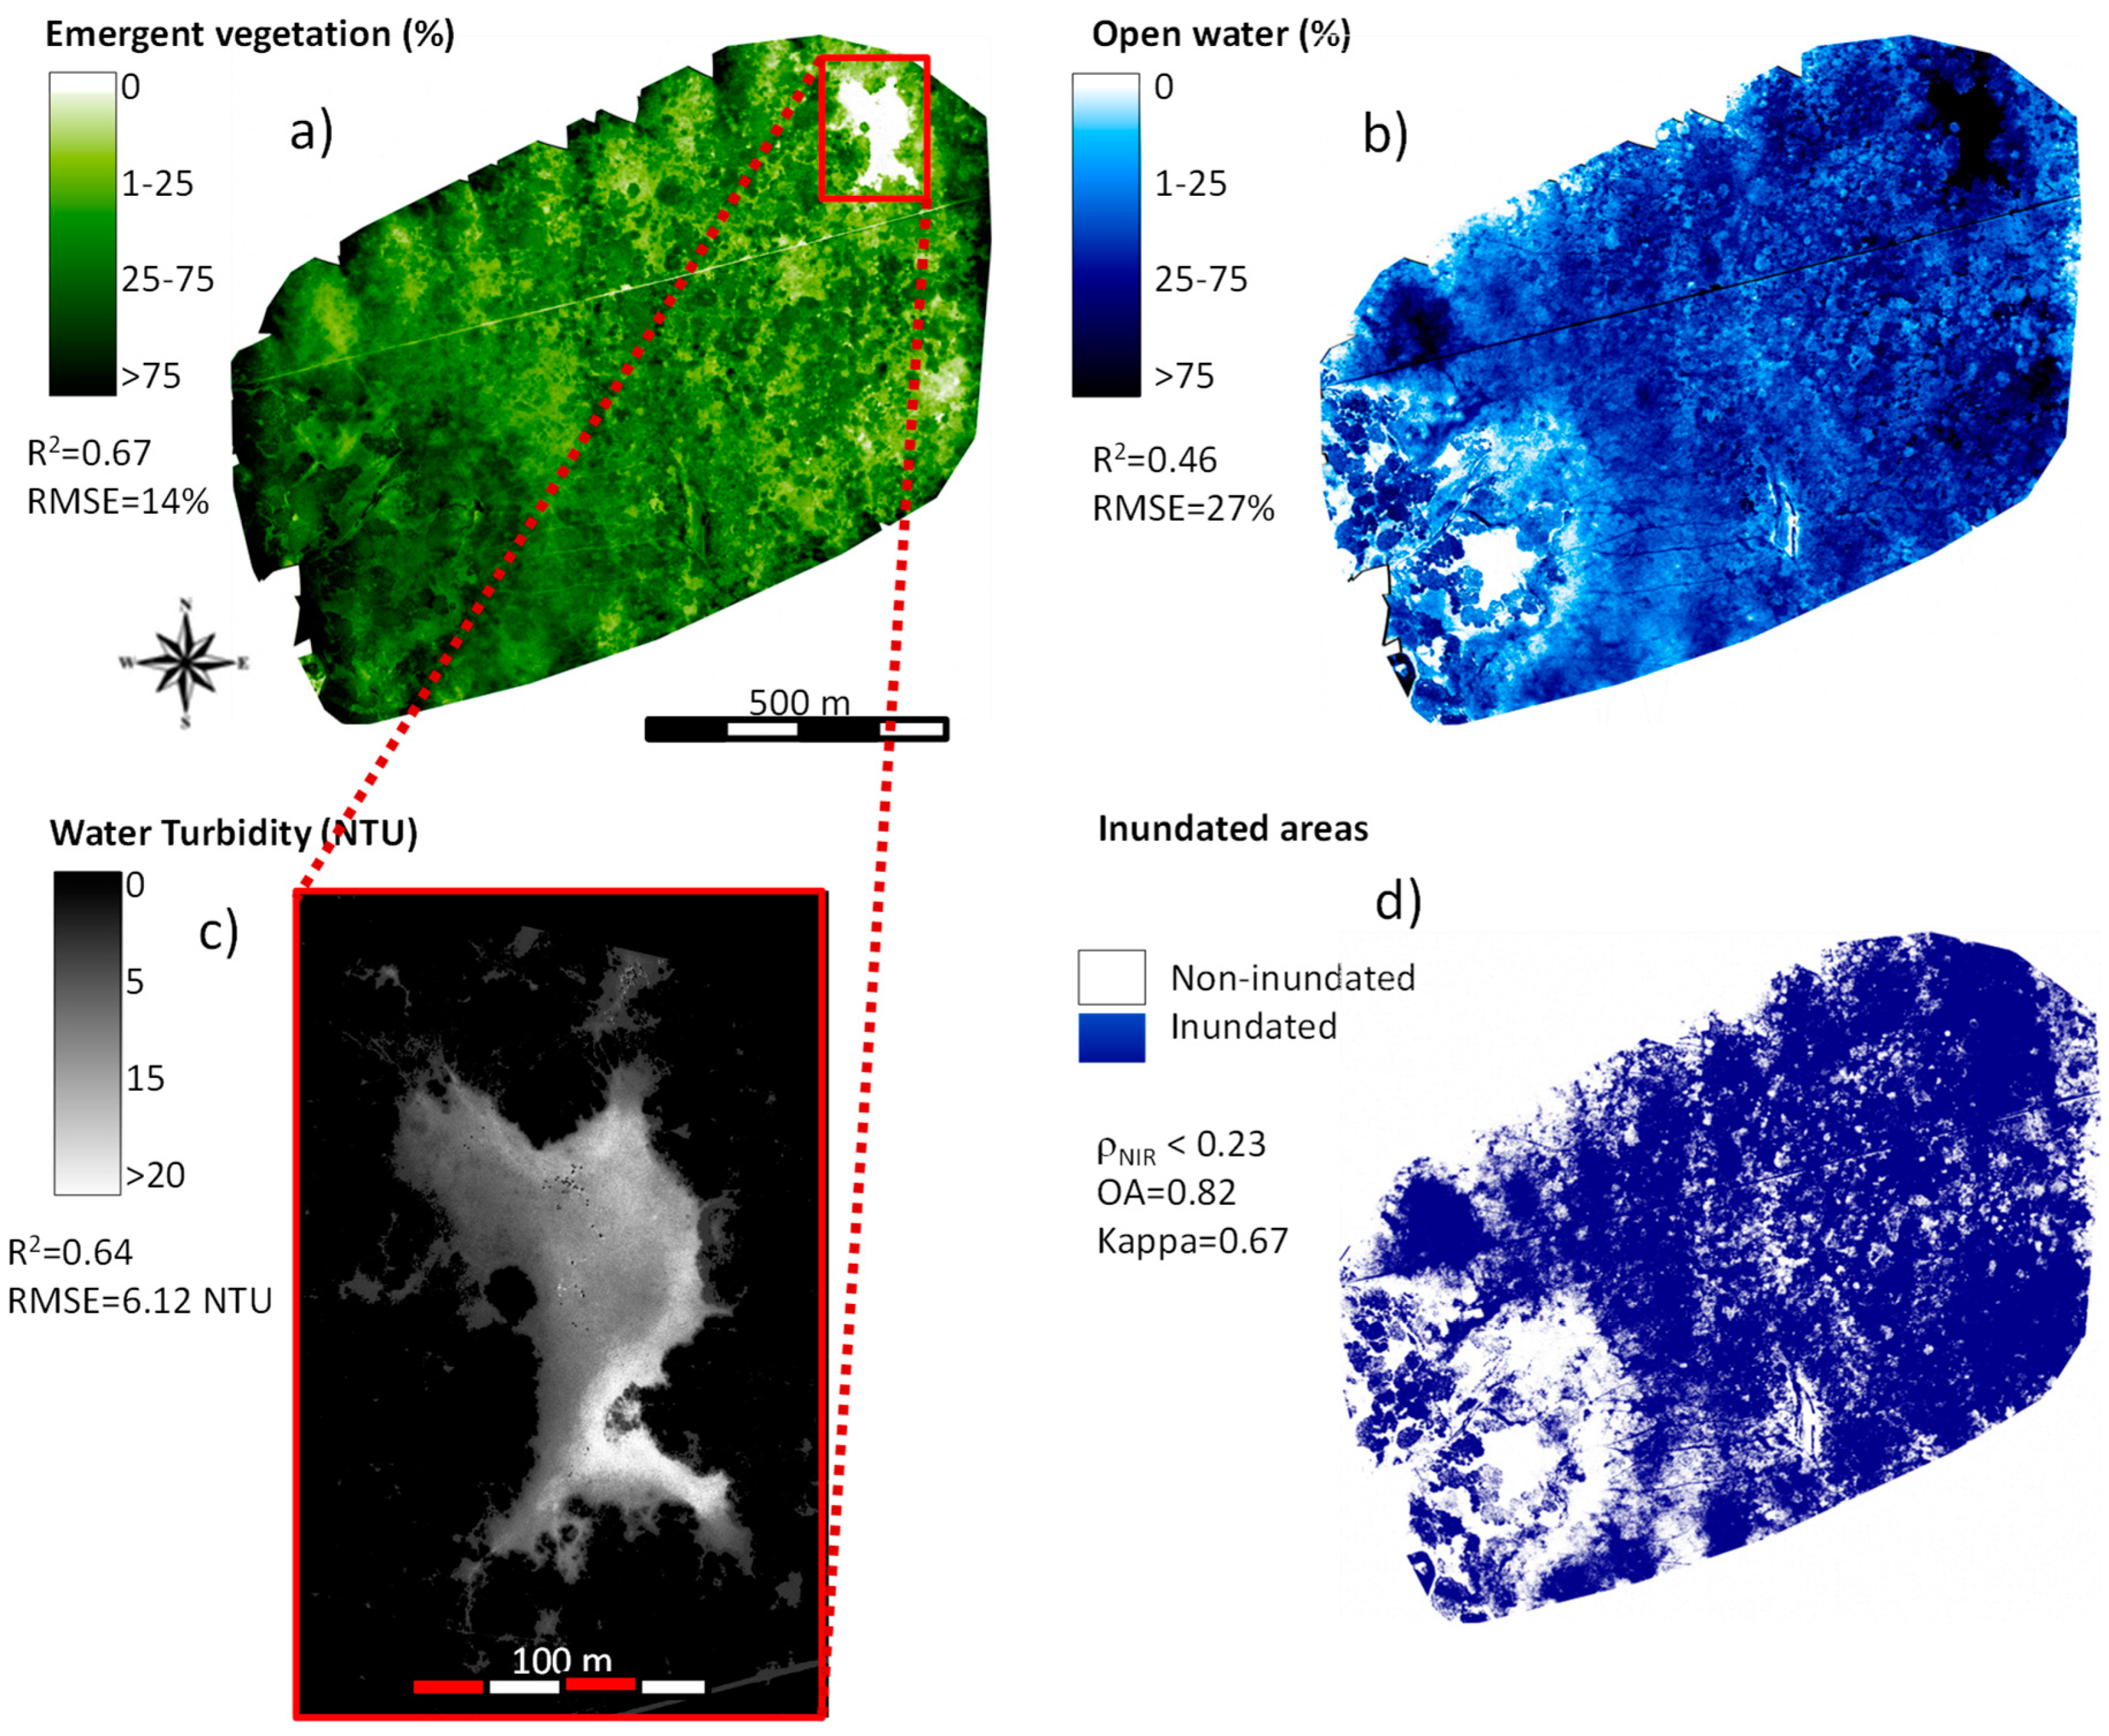
Figure 7.
Mean spectral signatures of the different aquatic plant species found in the Doñana study area.
Figure 7.
Mean spectral signatures of the different aquatic plant species found in the Doñana study area.

Figure 8.
Upscaling process followed for the inundation mapping in Doñana LTSER wetlands. (a) Segments map resulting from multispectral Sequoia image showing those intercepted by ground-truth points (yellow polygons). (b) Location of selected segments (red extrapolated as inundated and green as non-inundated from ground-truth points) on top of RGB composite from S2 bands 7, 6, and 4. (c) Resulting inundation map for Doñana marshes in the S2 scene. eBee picture courtesy of Sensefly from Parrot Group®. Sentinel-2 image downloaded from Wikimedia Commons.


Table 1.
Examples and references of remote sensing applications related to EI indicators in wetlands. Those in red were used in this study. Modified from Haase et al. [5].
Table 1.
Examples and references of remote sensing applications related to EI indicators in wetlands. Those in red were used in this study. Modified from Haase et al. [5].
| Elements of Ecological Integrity | Indicators of Ecological integrity | Examples for Remote Sensing Indicators | References | |
|---|---|---|---|---|
| Structures | Biotic Diversity | Flora Diversity | Aquatic plant cover mapping (emergent, floating, submerged) | [24,25,26] |
| Floodplain forest species mapping | [27,28] | |||
| Alien species mapping | [29,30,31,32] | |||
| Fauna Diversity | Productivity estimates in birds colonies | [33,34] | ||
| Animals abundance estimates with thermal mapping | [35,36,37] | |||
| Input for Species Distribution | [38,39,40] | |||
| Within Habitat Structure | Aquatic plant height | [41,42] | ||
| Land use mapping in catchment | [43] | |||
| Landscape indicators (connectivity, fragmentation) | [44] | |||
| Abiotic Heterogeneity | Water | Water turbidity | [45,46] | |
| Water delineation, water depth | [45,47,48] | |||
| Water temperature | [49] | |||
| Atmosphere | Water vapour content | [50] | ||
| Net radiation | [51] | |||
| Habitat | Digital terrain models | [52,53] | ||
| Processes | Energy Budget | Input | Fraction absorbed of Photoshynthetic Active Radiation (FaPAR) | [54,55] |
| Storage | Chlorophyll concentration in open water bodies | [56,57] | ||
| Net Primary Production | [58,59] | |||
| Phenology | [60] | |||
| Output | Albedo | [61] | ||
| Heat Flux (SEB models) | [62] | |||
| Matter Budget | Input | Water colour as a proxy for nutrients availability | [63] | |
| Algal blooms | [64] | |||
| Sedimentation processes | ||||
| Storage | Aquatic plants biomass | [16,65] | ||
| Output | Mapping of Grazing intensity | |||
| Water Budget | Input | Inundation mapping | [66] | |
| Storage | Hydroperiod | [67] | ||
| Water level estimated from water depth | ||||
| Output | Evapotranspiration | [68] |
Table 2.
RS wetland indicators collected as ground-truth with their categories and the spectral bands and indices used in this study.
Table 2.
RS wetland indicators collected as ground-truth with their categories and the spectral bands and indices used in this study.
| RS Wetland Indicator | Categories/Range | Spectral Bands/Indices |
|---|---|---|
| Water turbidity | Continuous (1.41–471) | Water turbidity index (WTI [46]) Normalized difference water index (NDWI [47]) |
| Water depth | Continuous (0–57) | Normalized difference red edge (NDRE [74]) |
| Plant cover per plant type (emergent) | 0%, 1–5%, 5–25%, 25–75%, >75% | Normalized difference vegetation index (NDVI [75]) Normalized difference red edge (NDRE) |
| Plant height | Continuous (3-150) | Green band, vegetation height model (VHM) |
| Percentage of open water | 0%, 1–5%, 5–25%, 25–75%, >75% | NIR band |
| Inundation | Non-inundated and Inundated | NIR band |
| Dry bare-ground cover | 0%, 1–5%, 5–25%, 25–75%, >75% | Not tested |
| Plant type | Emergent, floating, submerged, algae | Not tested |
Table 3.
Geometric characteristics of the UAV missions carried out over Doñana and Braila.
| Flight Characteristics | Doñana | Braila |
|---|---|---|
| Ground sampling distance (cm) | 12.85 | 14.03 |
| Area covered (ha) | 88.75 | 91.71 |
| Number of images | 1712 | 1380 |
| Lateral overlap (%) | 60 | 60 |
| Longitudinal overlap (%) | 80 | 80 |
| Absolute RMS error (cm) | 34 | 35.5 |
Table 4.
Overall band-by-band R2 and RMSE values (% reflectance units) between the spectrally similar Sequoia and S2 bands.
Table 4.
Overall band-by-band R2 and RMSE values (% reflectance units) between the spectrally similar Sequoia and S2 bands.
| GREEN | RED | RED EDGE | NIR | |
|---|---|---|---|---|
| R2 | 0.68 | 0.61 | 0.65 | 0.70 |
| RMSE | 0.06 | 0.04 | 0.03 | 0.05 |
© 2018 by the authors. Licensee MDPI, Basel, Switzerland. This article is an open access article distributed under the terms and conditions of the Creative Commons Attribution (CC BY) license (http://creativecommons.org/licenses/by/4.0/).
Share and Cite
MDPI and ACS Style
Díaz-Delgado, R.; Cazacu, C.; Adamescu, M. Rapid Assessment of Ecological Integrity for LTER Wetland Sites by Using UAV Multispectral Mapping. Drones 2019, 3, 3. https://doi.org/10.3390/drones3010003
AMA Style
Díaz-Delgado R, Cazacu C, Adamescu M. Rapid Assessment of Ecological Integrity for LTER Wetland Sites by Using UAV Multispectral Mapping. Drones. 2019; 3(1):3. https://doi.org/10.3390/drones3010003
Chicago/Turabian StyleDíaz-Delgado, Ricardo, Constantin Cazacu, and Mihai Adamescu. 2019. "Rapid Assessment of Ecological Integrity for LTER Wetland Sites by Using UAV Multispectral Mapping" Drones 3, no. 1: 3. https://doi.org/10.3390/drones3010003