Using Multispectral Drone Imagery for Spatially Explicit Modeling of Wave Attenuation through a Salt Marsh Meadow
by
 , , and
Antoine Mury
1,*, 
Antoine Collin
1,2,
Thomas Houet
3,
Emilien Alvarez-Vanhard
3 and
Dorothée James
1 1
EPHE, PSL Université Paris, CNRS LETG, 35800 Dinard, France
2
Laboratoire d’Excellence CORAIL, Moorea 98728, French Polynesia
3
CNRS LETG 6554, 35000 Rennes, France
*
Author to whom correspondence should be addressed.
Drones 2020, 4(2), 25; https://doi.org/10.3390/drones4020025
Submission received: 28 May 2020
/
Revised: 20 June 2020
/
Accepted: 21 June 2020
/
Published: 24 June 2020
Abstract
:Offering remarkable biodiversity, coastal salt marshes also provide a wide variety of ecosystem services: cultural services (leisure, tourist amenities), supply services (crop production, pastoralism) and regulation services including carbon sequestration and natural protection against coastal erosion and inundation. The consideration of this coastal protection ecosystem service takes part in a renewed vision of coastal risk management and especially marine flooding, with an emerging focus on “nature-based solutions.” Through this work, using remote-sensing methods, we propose a novel drone-based spatial modeling methodology of the salt marsh hydrodynamic attenuation at very high spatial resolution (VHSR). This indirect modeling is based on in situ measurements of significant wave heights (Hm0) that constitute the ground truth, as well as spectral and topographical predictors from VHSR multispectral drone imagery. By using simple and multiple linear regressions, we identify the contribution of predictors, taken individually, and jointly. The best individual drone-based predictor is the green waveband. Dealing with the addition of individual predictors to the red-green-blue (RGB) model, the highest gain is observed with the red edge waveband, followed by the near-infrared, then the digital surface model. The best full combination is the RGB enhanced by the red edge and the normalized difference vegetation index (coefficient of determination (R2): 0.85, root mean square error (RMSE): 0.20%/m).

1. Introduction
Worldwide, many studies have clearly highlighted the ability of the coastal ecosystems, like salt marshes [1,2,3,4,5,6,7,8,9,10,11], shelly ridges [9,11] or seagrasses [11], to reduce the wave height, Hm0. Nevertheless, this ability to reduce Hm0 exhibits a large variability, ranging from more than 7%/m [4] to less than 0.3%/m [8], depending on the plant species.
Due to the complexity of salt marsh meadows, which are rarely mono-specifics along European coastlines but more similar to a patchwork of species, the calculation of attenuation values specifically for each species remains limited for the global understanding of the attenuation dynamics. Furthermore, unlike studies in the literature that report attenuation values calculated only along one or more cross-shore transects distributed on the study site [11], a methodology based on remote sensing could bring an overview to evaluate the attenuation induced by a whole meadow. Considering the high reflectance of vegetation in the red edge (RE) and near-infrared (NIR) electromagnetic spectrum, the use of sensors provided with such wavebands and related index is well-suited to the need of an overview of the wave attenuation induced by a meadow. The use of these infrared wavebands makes it possible to discriminate plant functional traits, density [12,13,14], and species identification at very high spatial resolution (VHSR) using remote-sensing methods [8].
The use of drone technology for the imagery acquisition and for the generation of digital surface models (DSMs), using structure from motion (SfM) photogrammetry [15], is of many interests, especially for the coastal monitoring [16]. It allows for creating orthophotomosaics and DSMs at VHSR and very high temporal resolution (VHTR) [17]. This is highly relevant to monitoring the changes in plant communities depending on the seasonality or after a punctual event [8,18]. The monitoring of these changes is crucial owing to the temporal impact in the services that can be furnished by the ecosystems. The modeling method of wave attenuation presented in this paper is an indirect modeling methodology based on the spectral signatures of the vegetation which are a proxy of the vegetation volume that governs the water movement.
The aim of this paper is to quantify the contribution of the drone spectral bands, derived spectral index, and DSM for the indirect spatial modeling of wave attenuation. The working hypothesis was that adding infrared information (namely, RE, NIR, and normalized difference vegetation index, NDVI) to the basic red-green-blue (RGB) information can significantly improve the modeling performance. The paper is structured as follows: (1) data acquisition and processing (wave measurements and unmanned aerial system (UAS) multispectral imagery); (2) modeling the contribution of the salt marsh to wave attenuation; (3) quantify and discuss the contribution of each spectro-spatial band and band combination to the modeling.
2. Materials and Methods
2.1. Study Site
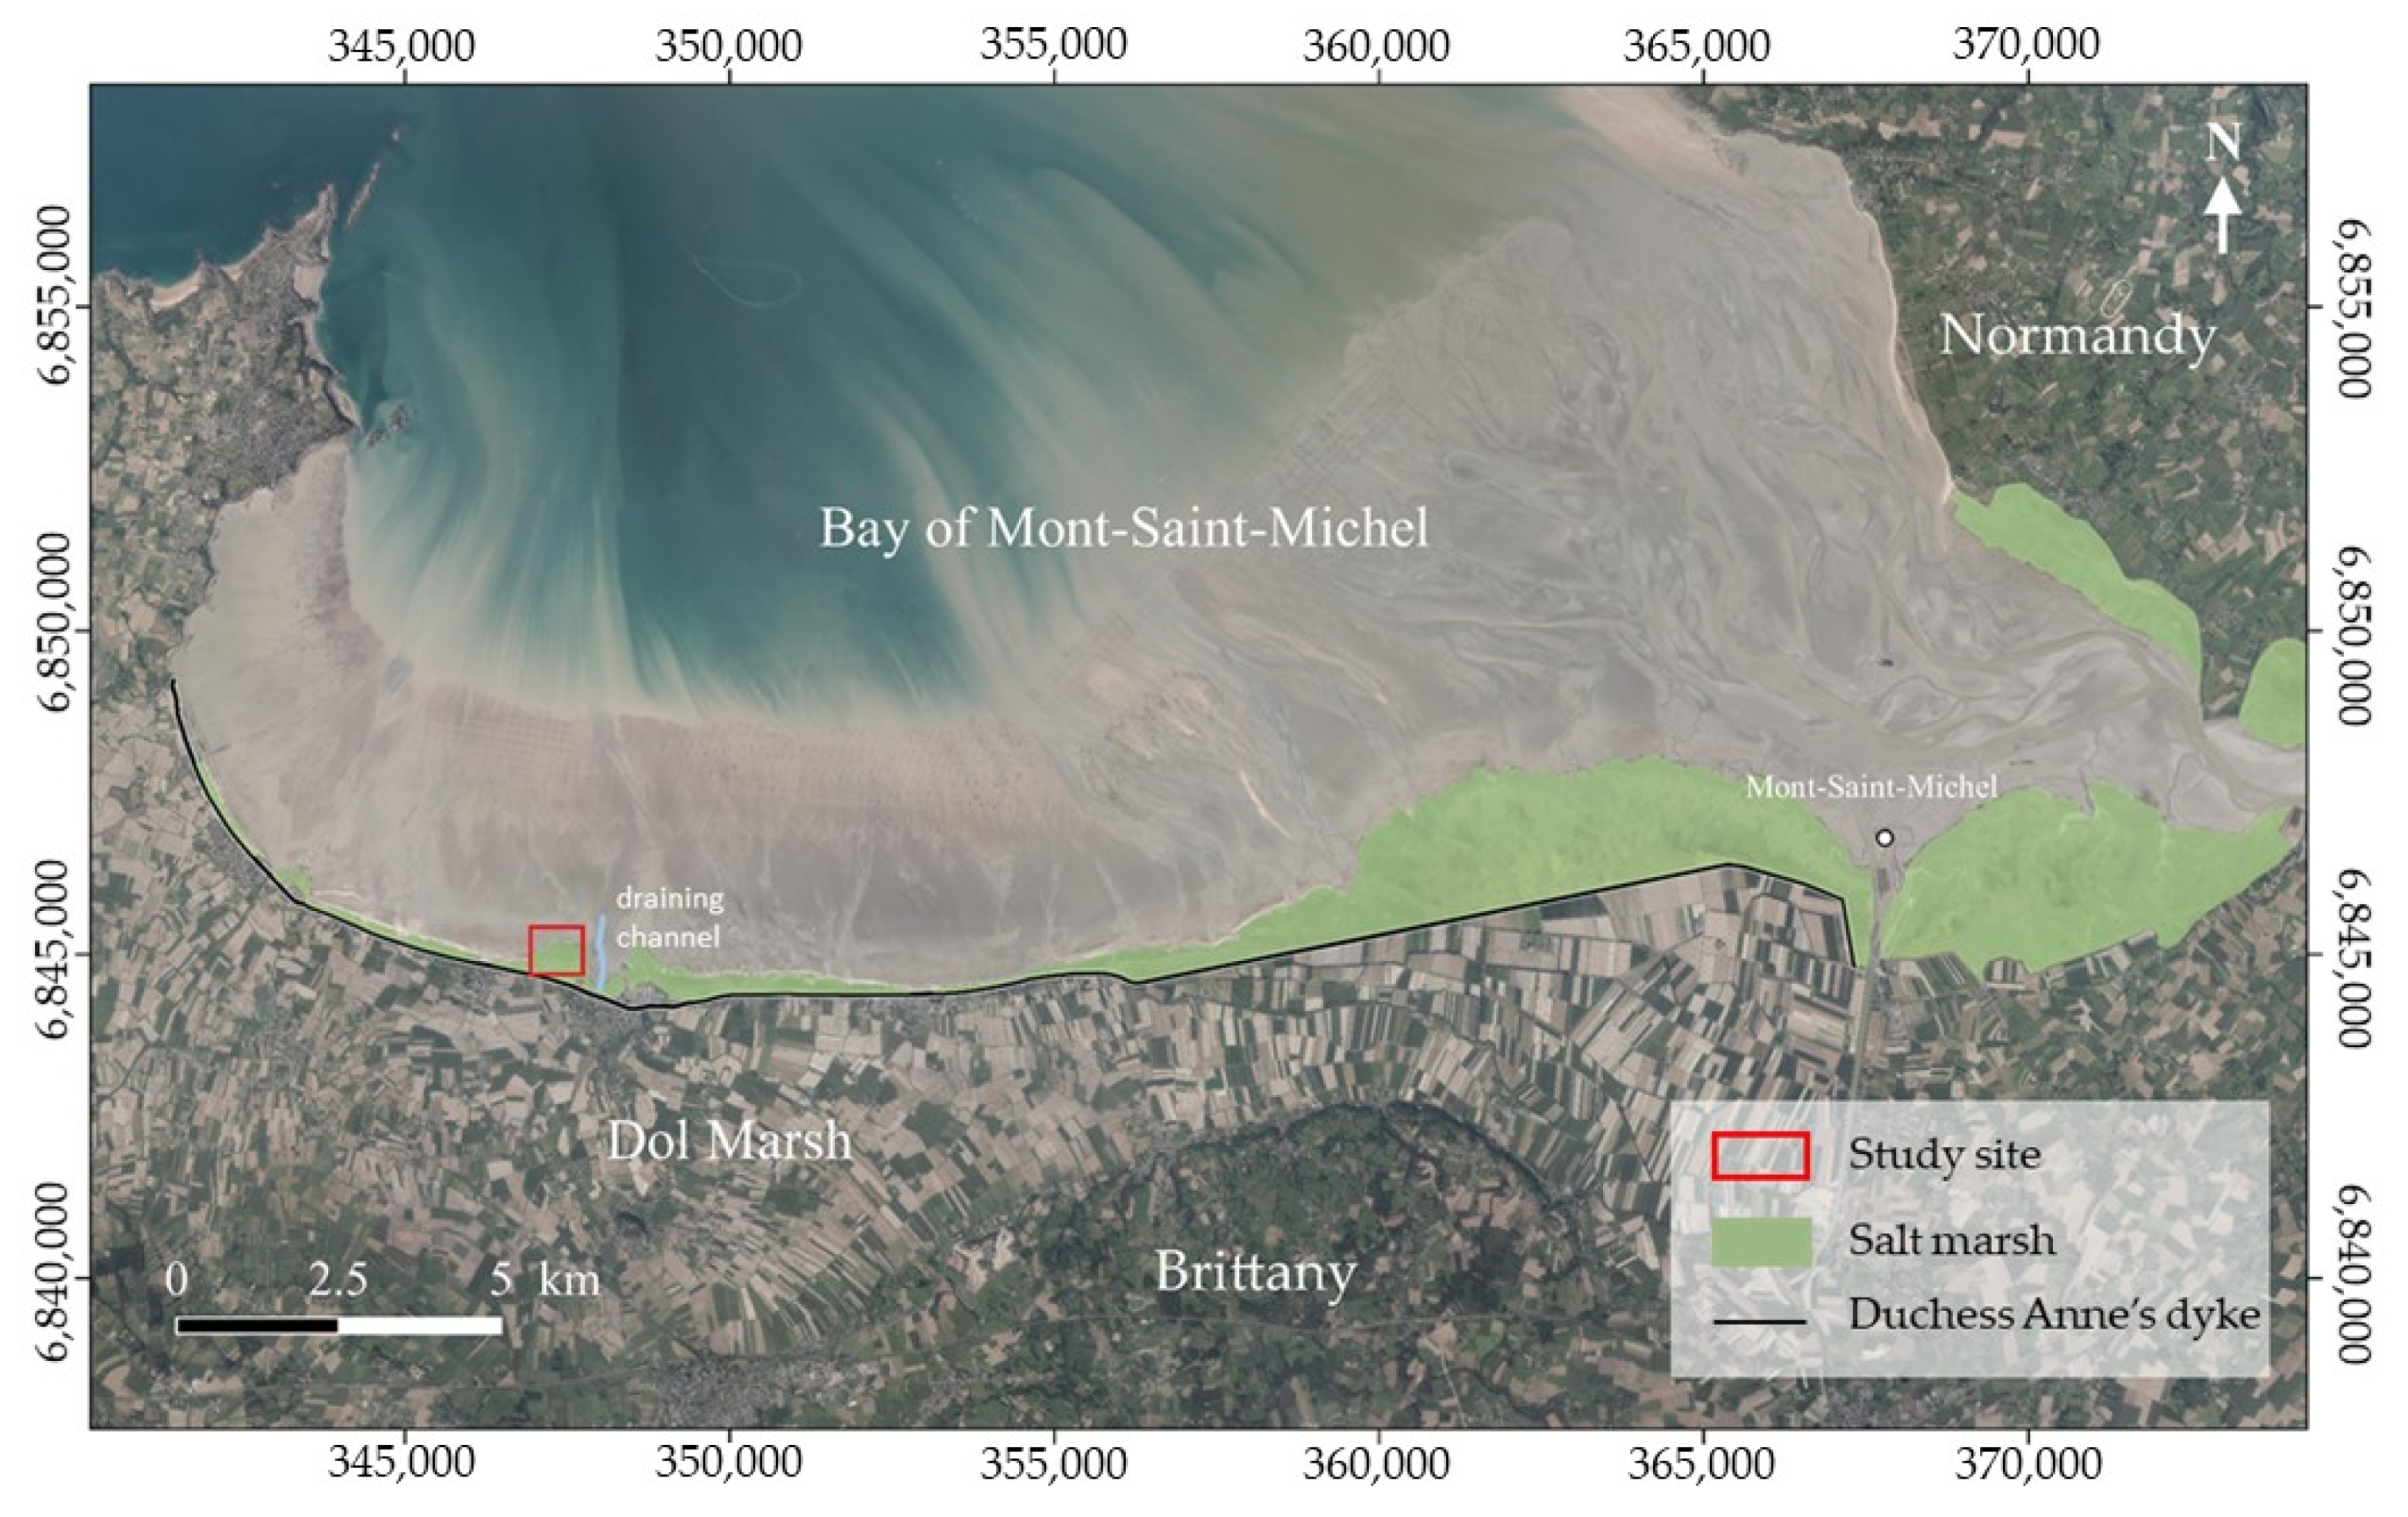
The bay of Mont-Saint-Michel (France) is enshrined in the Brittany-Normandy Gulf between the Cotentin Peninsula and the northern coast of Brittany called the “Emerald Coast”. This bay, subjected to a strong tidal regime, belongs to the top six areas hosting the world’s highest tide [19]. The bay is delimited in the south from the lowland of the Dol Marsh polder by the Duchess Anne’s dike, at the foot of which thrive important salt marsh surfaces contributing to coastal protection as natural barriers against waves. These extended salt marsh meadows cover an area of approximately 40 km2 in the bay [20]. This study is focusing on a well-vegetated 1 km2 meadow of the western part of the bay, where hydrodynamic conditions are calmer than on the estuarine domain of the eastern part. This area forms an outgrowth compared to its direct vicinity, because of the sediment supplies carried by one of the draining channels of the Dol Marsh, just on its eastern side (Figure 1). The study area is composed of four principal plant communities, from north to south, (1) pioneer vegetation of Spartina townsendii/Sueda maritima/Salicornia europea; (2) a short lawn of Puccinellia maritima with some Halimione portulacoides bush and Aster tripolium; (3) a semi-woody formation of Halimione portulacoides; and (4) a dense meadow dominated by Festuca rubra [21] (Table 1).
2.2. Significant Wave Height Measurement (Hm0) as the Model Response
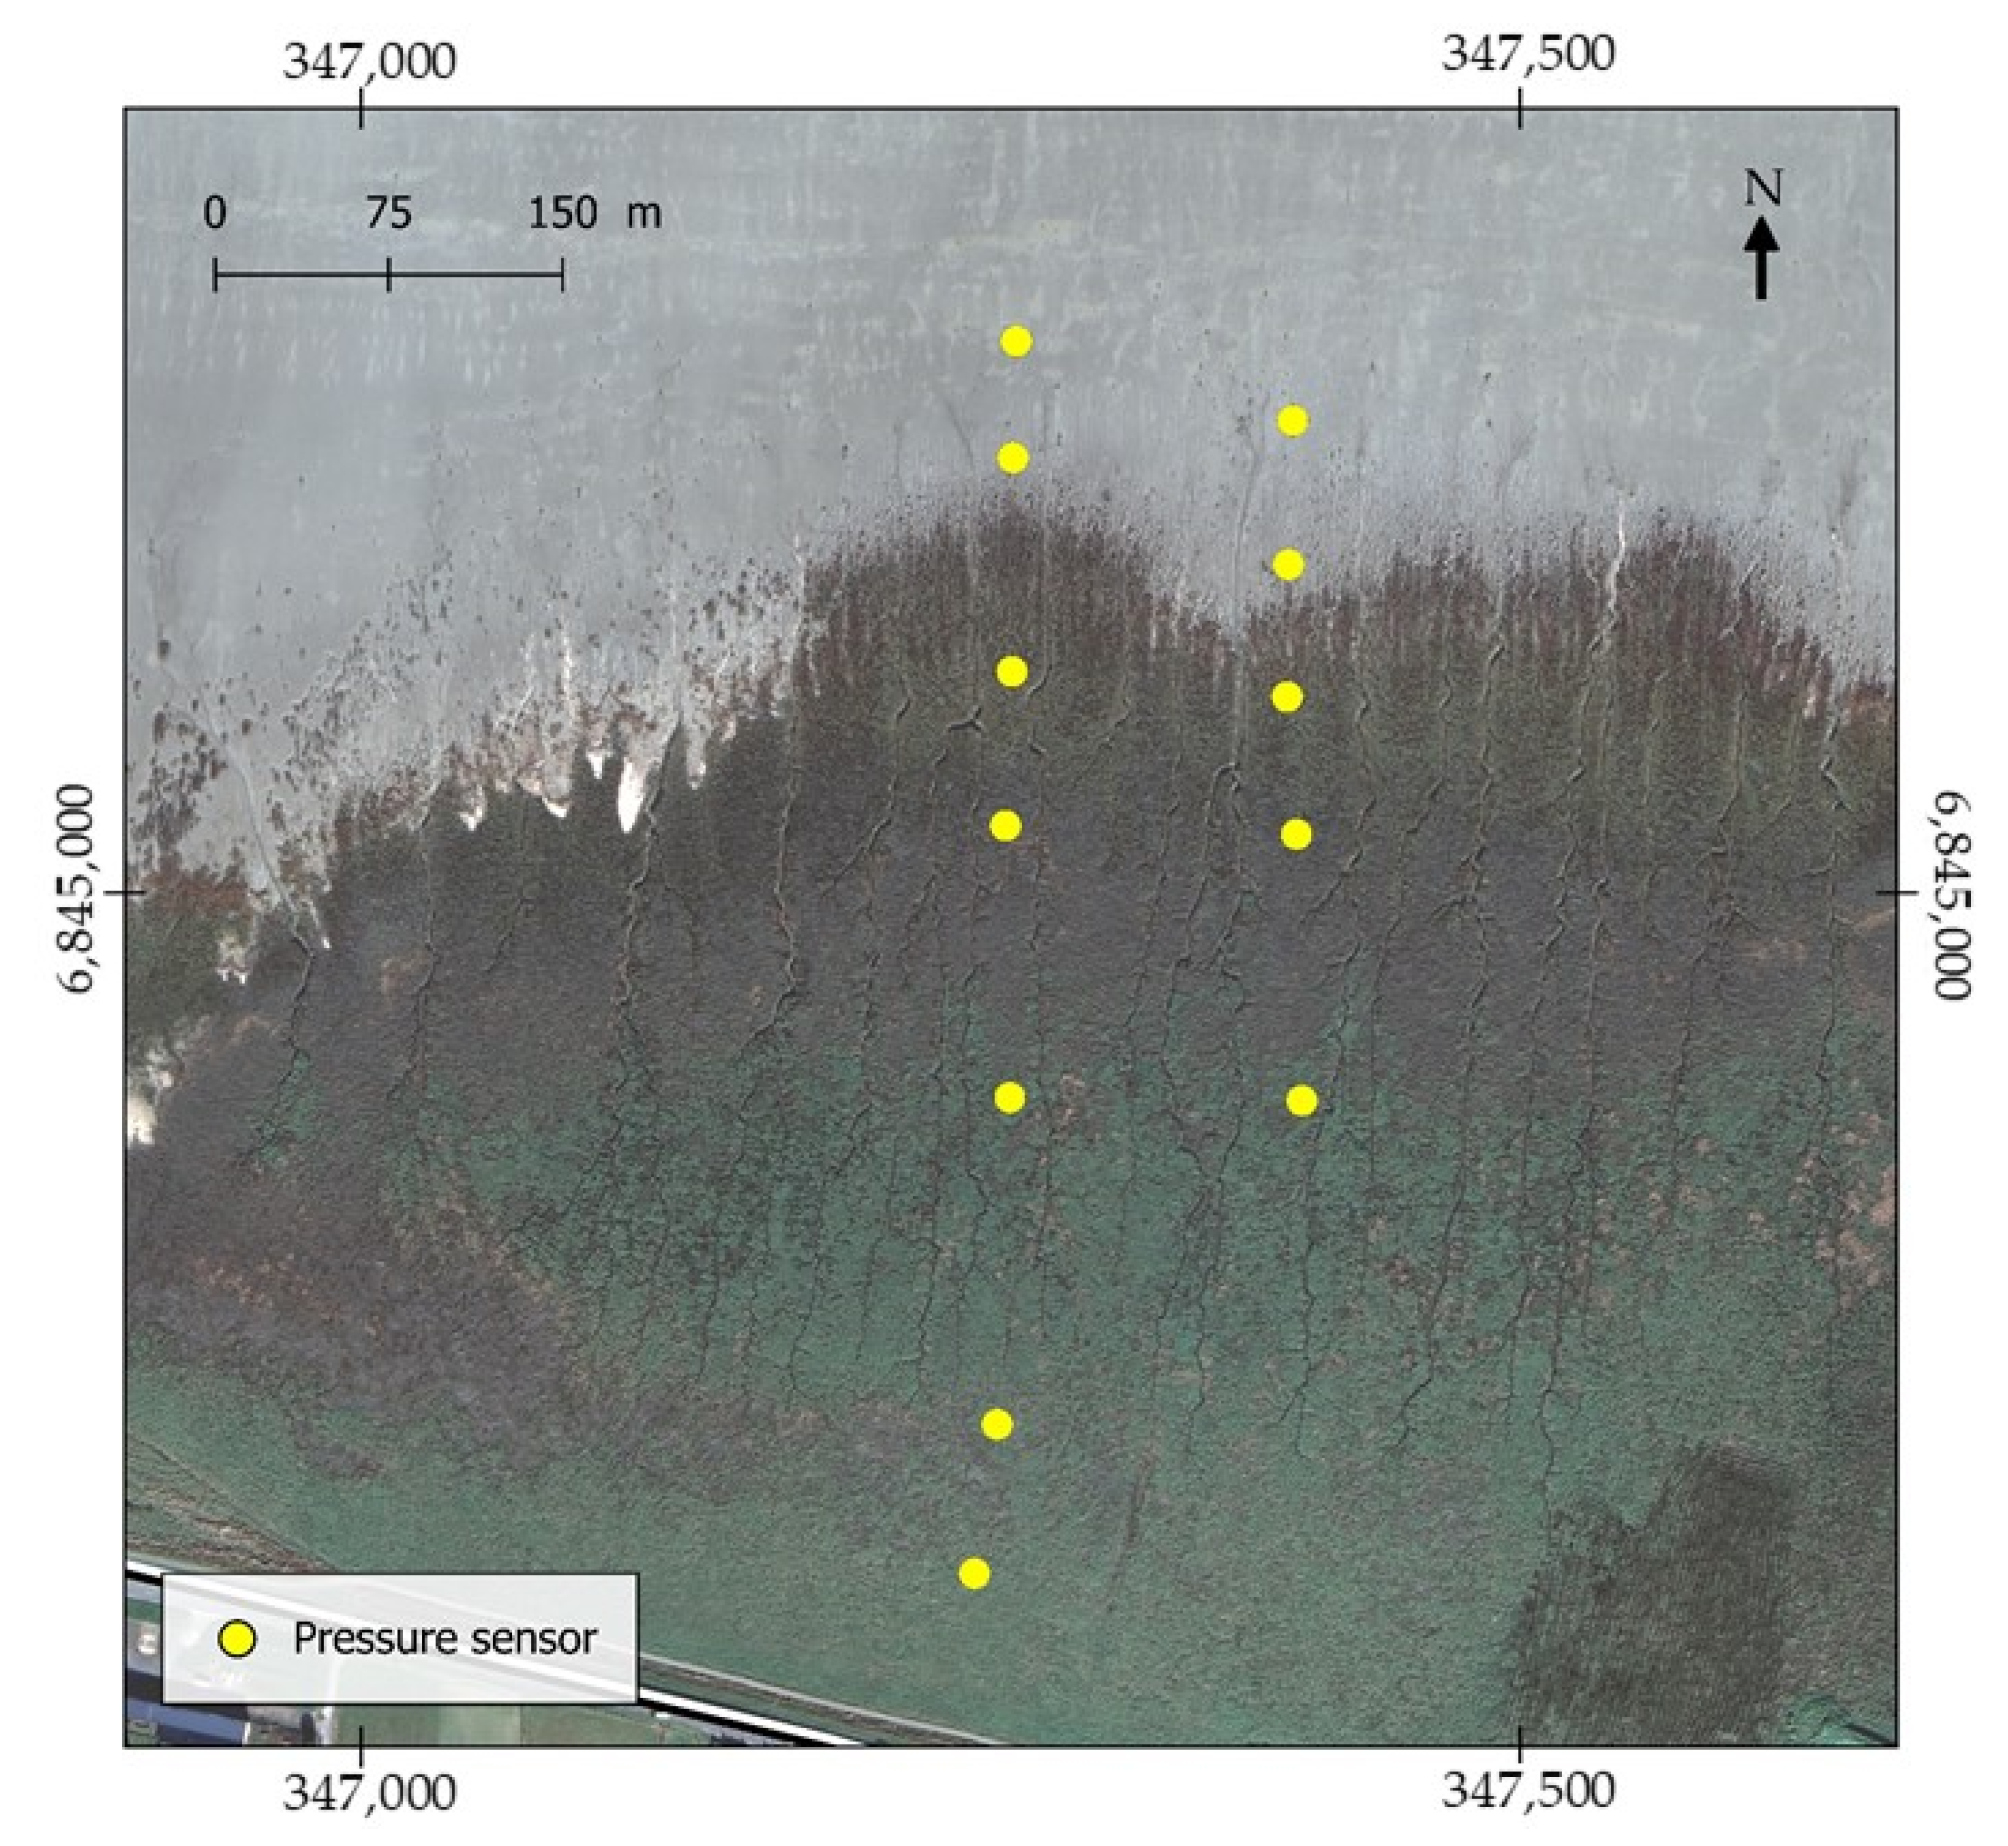
Measurements of significant wave heights were made from 22 to 23 January 2019, during four successive tides, using 12 mini-pressure sensors (NKE SP2T10) positioned along two transects at the study site (Figure 2). They were fixed to an iron rod driven into the intertidal substrate. The instruments recorded tide- and wave-induced pressure with a burst duration of 9 min every 15 min, at a frequency of acquisition of 2 Hz. The 9-min sampling frequency was chosen as a compromise between a spectrum large enough to be representative, but sufficiently short, to assure a good degree of stationarity in the megatidal environment. Wave characteristics were obtained from the measured time series by spectral analysis using fast Fourier transforms. The Fourier coefficients of the free surface elevation fluctuations were obtained from corresponding coefficients computed from the pressure time series using the frequency-dependent transfer function inferred from linear theory.
These Hm0 values are enabled to calculate 40 attenuation values (N = 40), which embodied the response within the various statistical models further tested for hydrodynamic attenuation modeling.
2.3. Multispectral Drone Imagery Acquisition and Processing
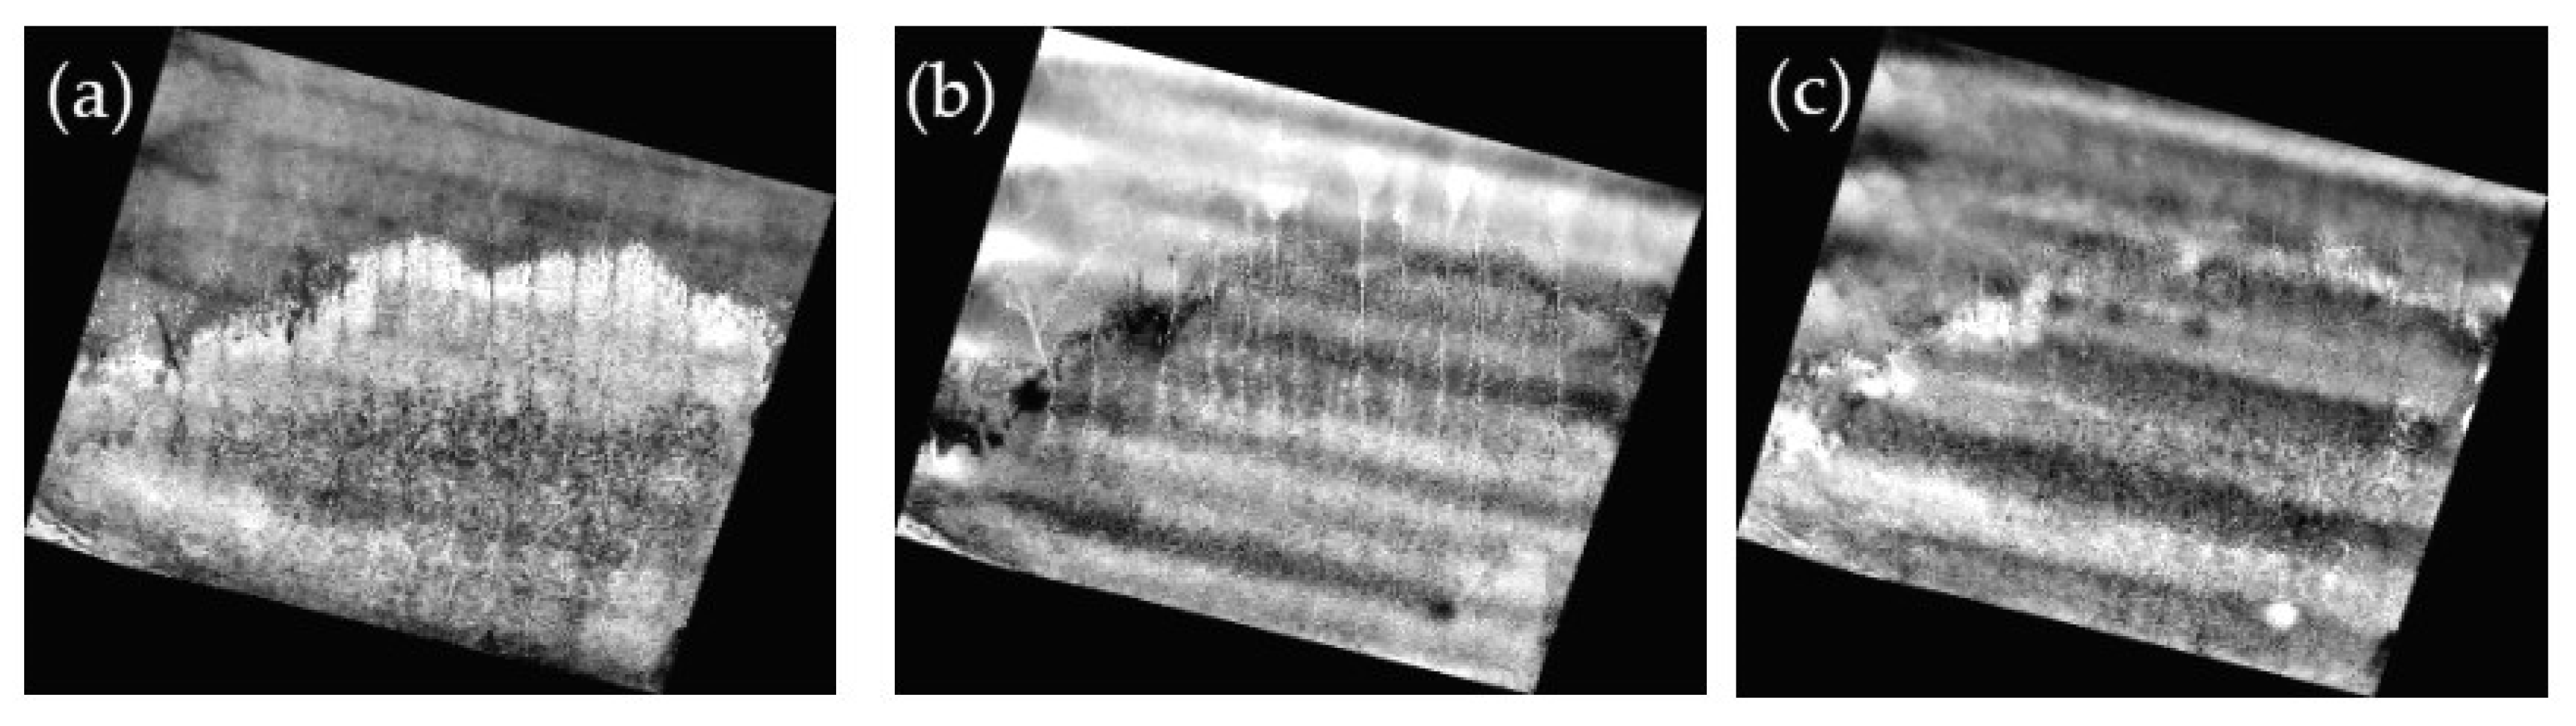
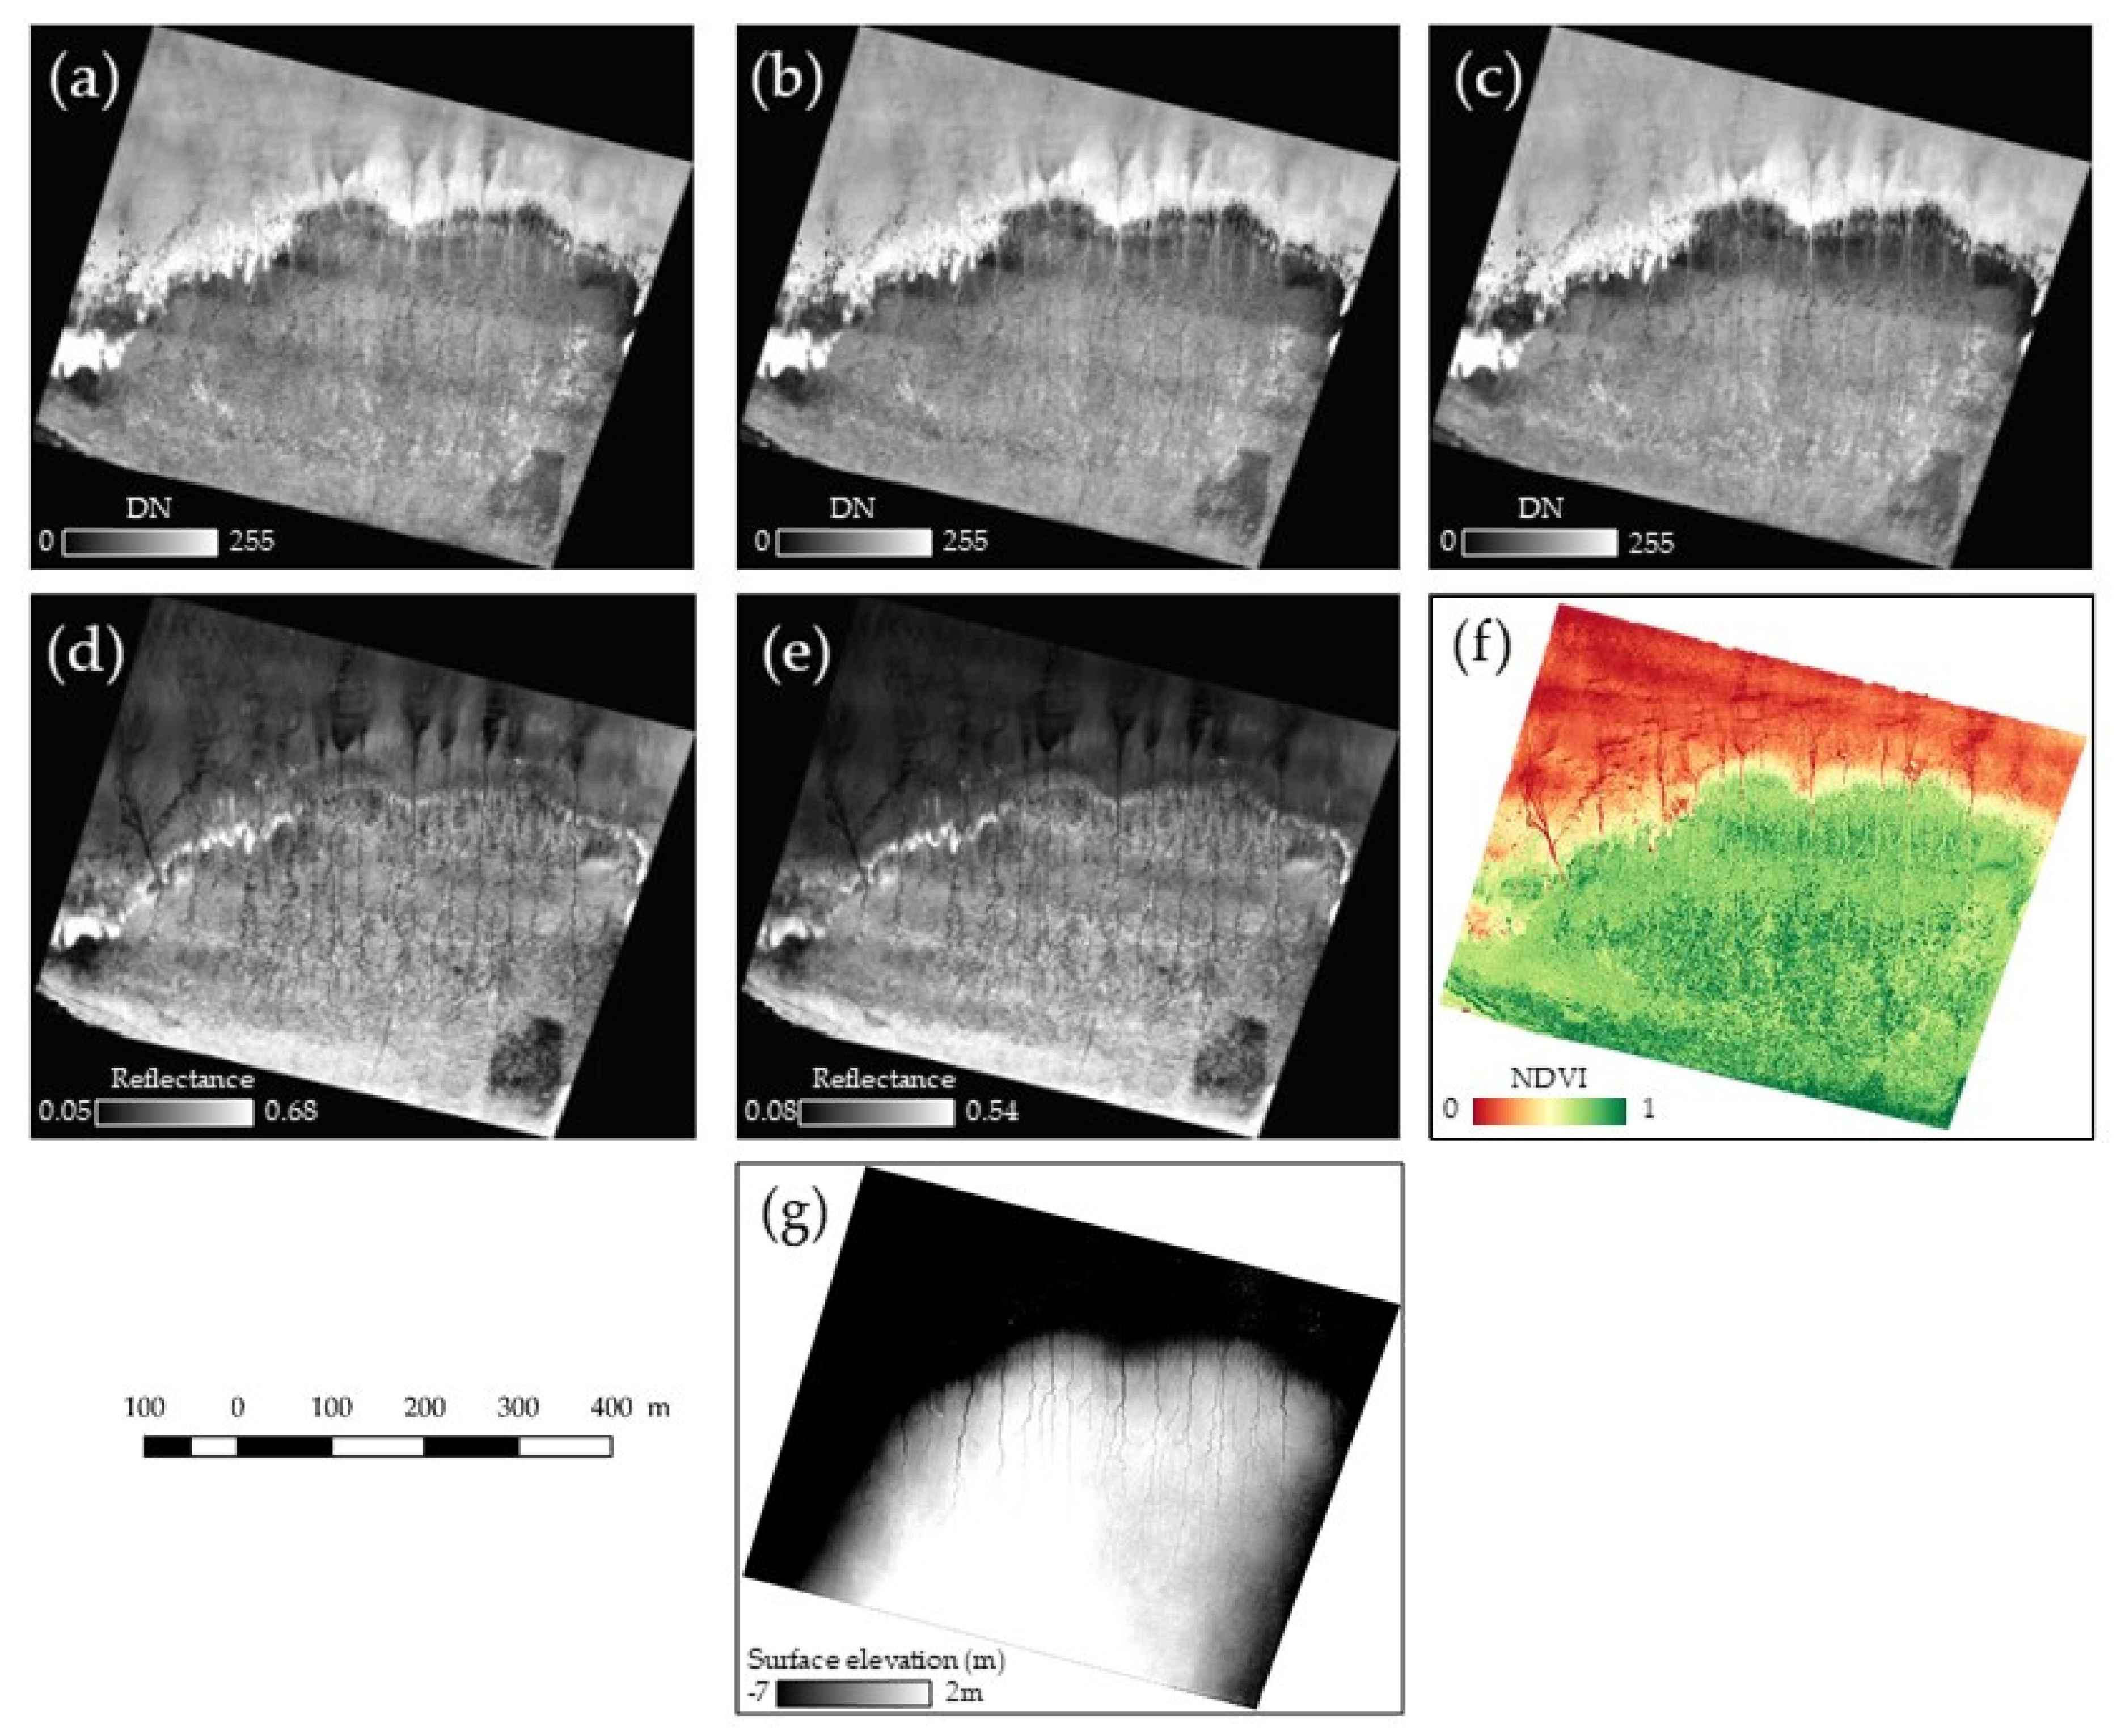
A drone imagery campaign was undertaken on 22 March 2019, using a Sensefly eBee+® fixed-wing equipped with two optical sensors: a classical RGB sensor and a Parrot Sequoia®, exhibiting an RGB (R: 660 nm; G: 520 nm; B: 450 nm, Figure 3a–c), RE (730–740 nm, Figure 3d) and NIR (770–810 nm, Figure 3e) sensors (Table 2). The imagery collection followed a flight plan whose parameters are provided in Table 3. Leveraging global navigation satellite system (GNSS) coordinates, the images were further georeferenced to 9 ground control points (XYZ) acquired through Differential-GNSS (D-GNSS) equipment (Topcon HiPer V) with horizontal and vertical accuracy of 0.02 m. An orthophotomosaic and a DSM were then derived using the SfM photogrammetry procedure with the Pix4Dmapper® software. The accuracy reached 0.05 m, 0.04 m and 0.12 m for X, Y and Z coordinates, respectively.
Radiometric corrections were also applied accounting for the optical instrument factors (vignetting, spectral response, etc.), the variation in solar irradiance and angle, using a radiometric target to provide top of canopy reflectance [22].
2.4. Modeling the Contribution of the Salt Marsh to Wave Attenuation
Data extracted from the drone imagery were considered as descriptors of the salt marsh composition and 3D configuration, thus predictors for the statistical modeling. Using the 1D Hm0 in situ values and the 2D seven predictors (R, G, B, RE, NIR, NDVI, DSM), an array of linear regression models were achieved to spatially predict the hydrodynamic attenuation (Y) induced by the salt marsh meadow. The contribution of each predictor (βi) was therefore independently tested through single regressions (Table 4):
Y = β0 + β1X1
Different combinations (Table 3) of predictors were then tested using multiple regressions:
Y = β0 + β1X1 + β2X2 +…+ βnXn
The coefficient of determination R2 and the root mean square error value (RMSE) were used to assess the relevance of each model tested.
3. Results
The 23 linear regression models, both 7 simple and 16 multiple, allowed to quantify the predictors’ contribution to the hydrodynamic attenuation modeling (Table 5).
The simple linear regressions results showed the relevance of each predictor to explain the wave attenuation, via its coefficient of determination, ranked in ascendant order as follows: RE (R2: 0.24), DSM (R2: 0.29), NIR (R2: 0.32), R (R2: 0.33), NDVI (R2: 0.41), B (R2: 0.50) and G (R2: 0.51).
Dealing with multiple linear regressions, each predictor was added to the classic RGB combination to quantify how much each one could improve the coefficient of determination of the RGB model (R2: 0.54). In so doing, the combinations with the three highest R2 were RGB + RE (R2: 0.73), RGB + NIR (R2: 0.71), RGB + DSM (R2: 0.64).
Finally, multiple linear regressions using the RGB and combinations of predictors resulted in models with R2 closing to 1. Thus, the most efficient combination was RGB + RE + NDVI (R2: 0.85), followed by RGB + RE + DSM (R2: 0.84), RGB + RE + NIR + NDVI (R2: 0.81), RGB + NIR + DSM (R2: 0.80) and RGB + RE + NIR + DSM (R2: 0.80).
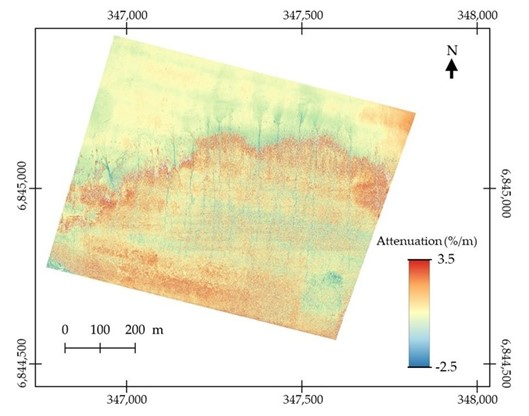
For this reason, the spatially explicit model was achieved using the RGB + RE + NDVI combination (Figure 4).
The spatially explicit-model drew attenuation on values displaying important variations, from an increase of Hm0 of 2.5%/m to a decrease of 3.5%/m on the study site. The mean Hm0 attenuation value on the study site approximated 0.25%/m.
4. Discussion
This experiment highlighted interest in the use of infrared wavebands (RE, NIR and derived data NDVI) and topographic (DSM) data in addition to RGB channels for the spatial modeling of the wave attenuation through a salt marsh meadow.
Results showed that the individual most effective predictors (Table 4), to explain the attenuation values calculated from Hm0, in descending order, correspond to the reflectance (G and NIR) and absorbance (R and B) peaks of chlorophyll pigments [23], their NDVI combination (vegetation density), the surface changes (DSM) and the RE.
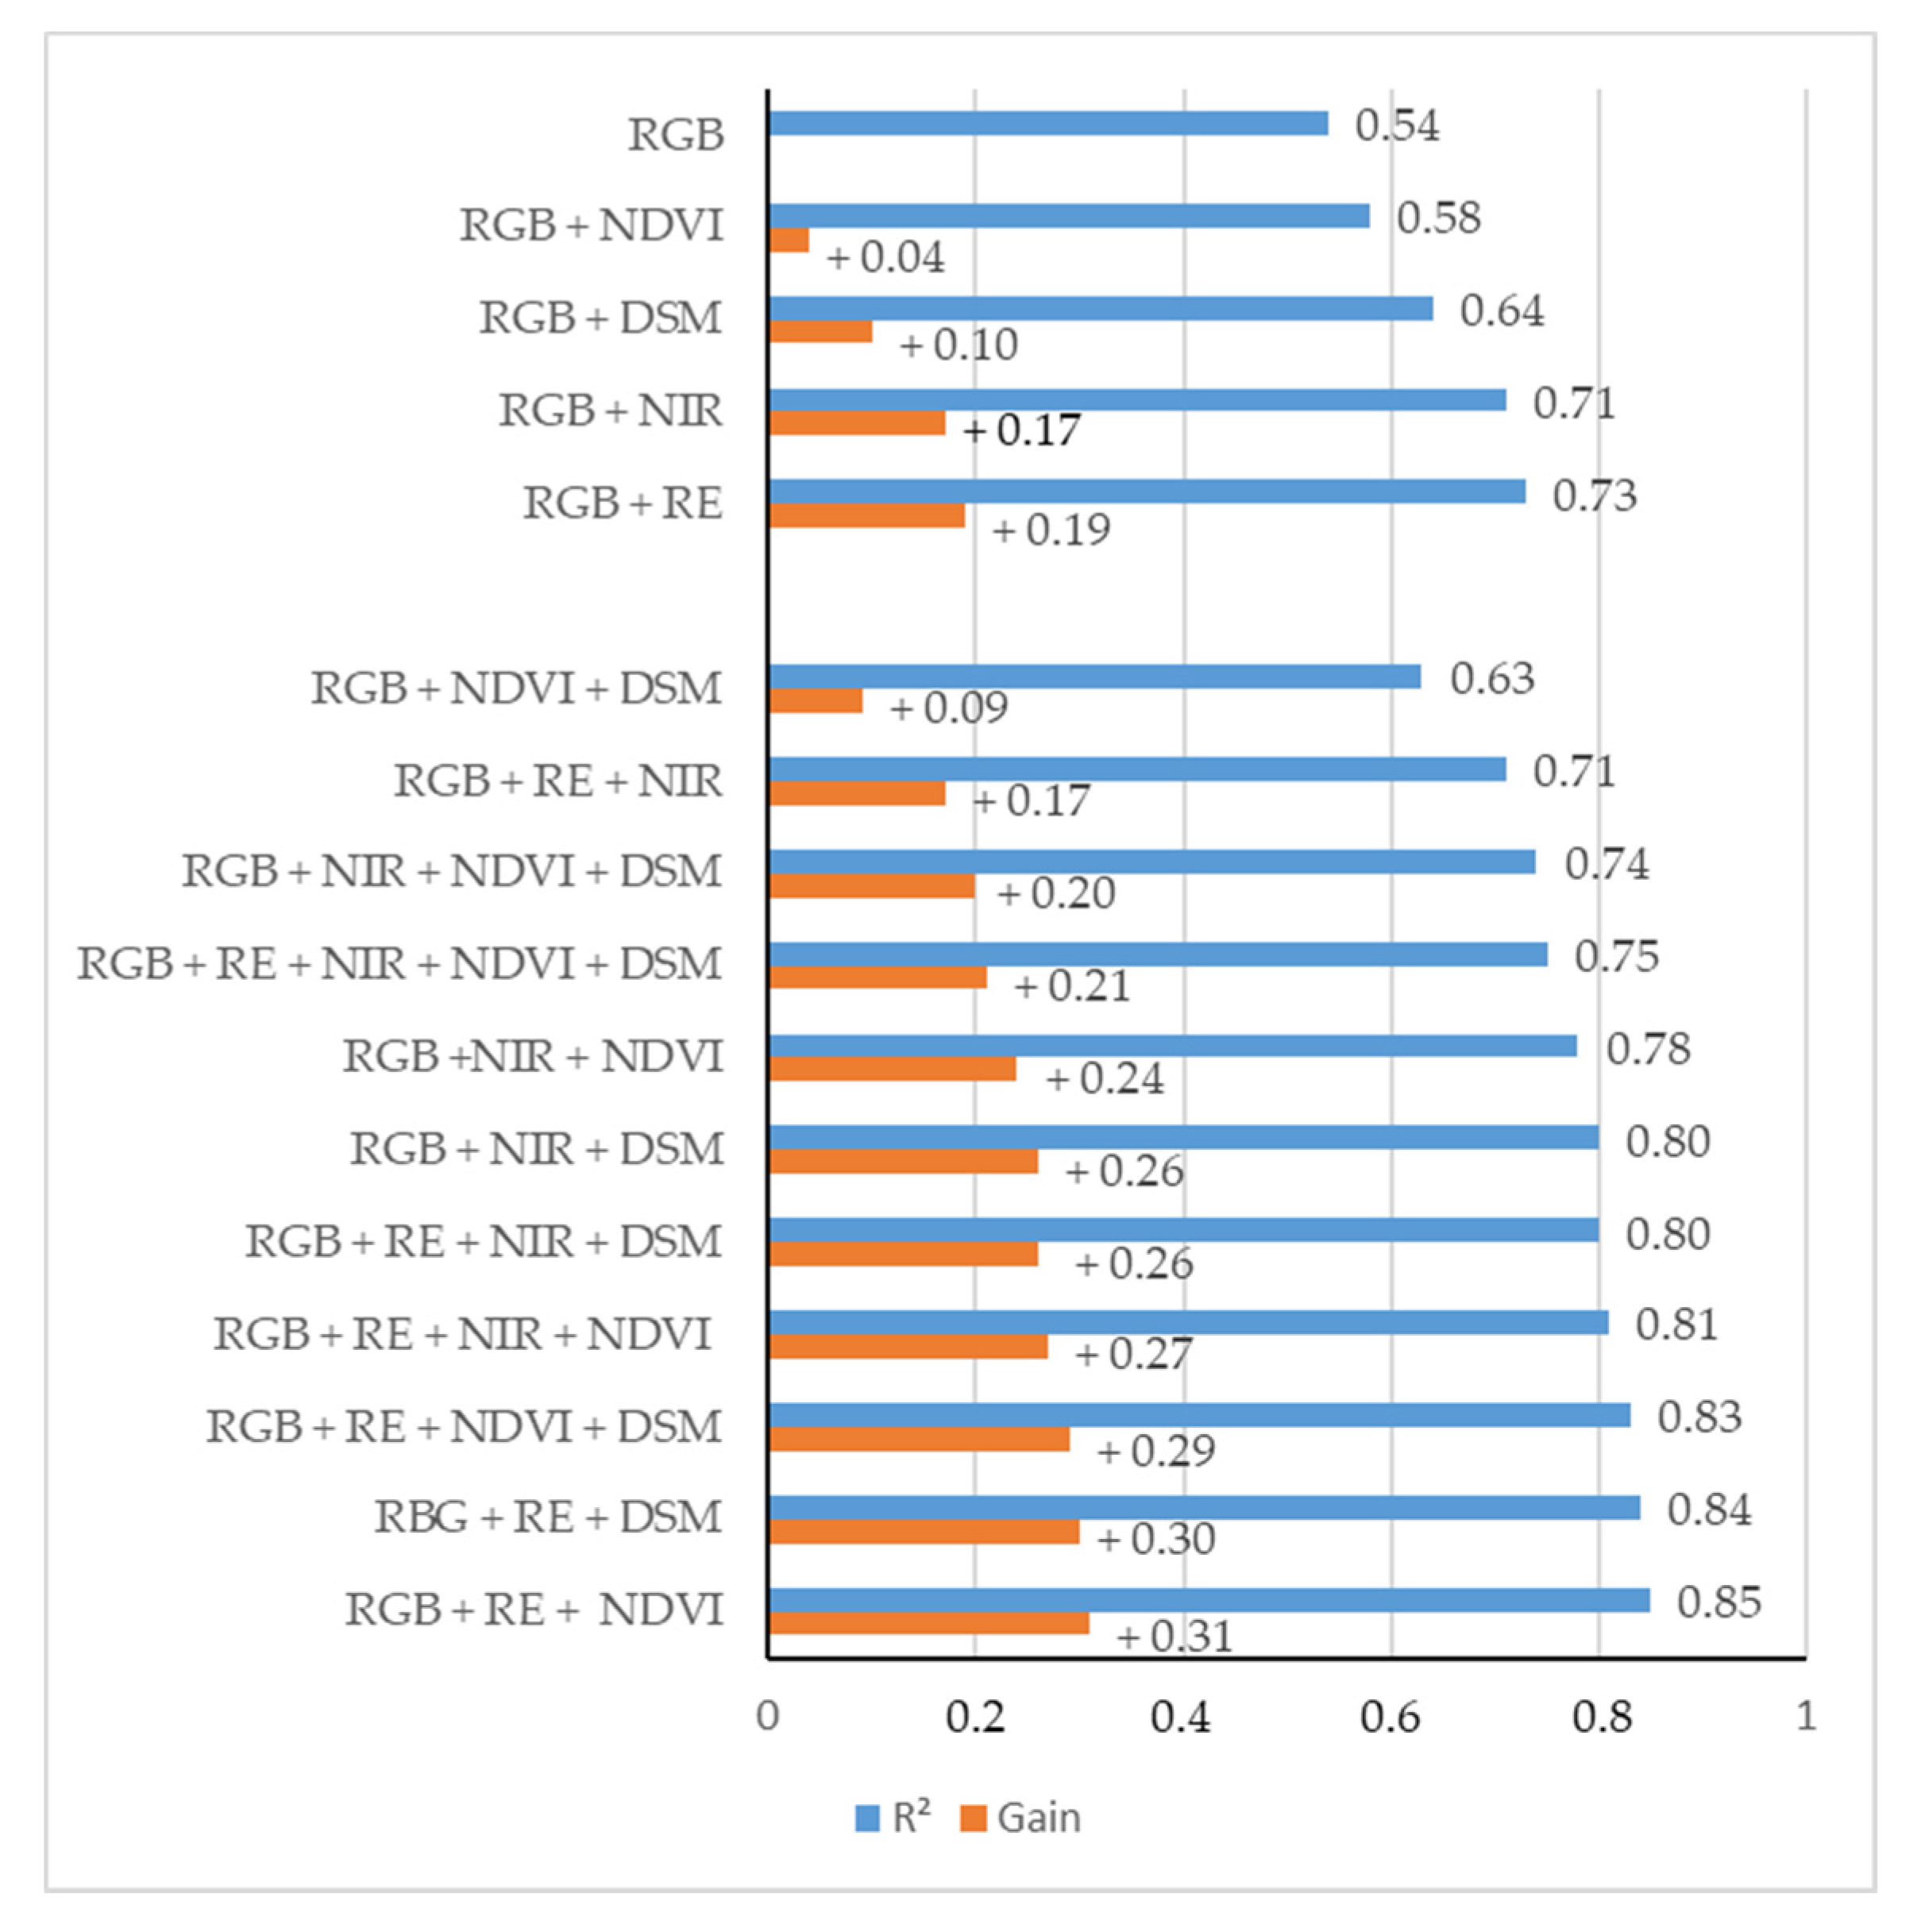
The addition of individual predictors to the RGB combination allowed us to observe some interesting gains concerning the coefficient of determination (Figure 5), especially the addition of RE and NIR predictors that improved by +0.19 and +0.17, respectively, the R2 of the multiple linear regression of the RGB model. Thus, from the predictor with the highest gain to the predictor with the lowest gain, there was: RE (+0.19), NIR (+0.17), DSM (+0.10) and NDVI (+0.04).
These results can be explained by the fact that these predictors highlighted the natural vegetation elements that increase the roughness or represent topographical changes able to mitigate waves. The best performance of the RE and NIR predictors, witnessing the vegetation, indicate that the structural complexity of vegetation seems more effective to model the attenuation than the topographical change, highlighted by the DSM. The contribution of the NDVI appeared lower, perhaps due to the R integration into it, generating an information redundancy with the RGB combination.
With regard to the models based on the RGB dataset combined with multiple predictors, the best gains were observed with the addition of the RE + NDVI (+0.31), RE + DSM (+0.30), RE + NDVI + DSM (+0.29), RE + NIR + NDVI (+0.27), RE + NIR + DSM (+0.26) predictors (Figure 5). These results highlighted the ubiquity of the RE predictor into the most efficient combination predictors for the spatially-explicit modeling of the Hm0 attenuation, because of its high sensitivity to a medium to high level of chlorophyll content, complementary to the RGB spectral signatures of the salt marsh vegetation [24].
Results of the combinations RGB + RE + NDVI (R2: 0.85), RGB + RE + DSM (R2: 0.84) and RGB + RE + NDVI + DSM (R2: 0.83) (Figure 5) were strongly comparable. It implies that the NDVI and the DSM bring the same quantity of complementary information to the modeling. Once the RE intermediate reflectance is integrated, the vegetation density (NDVI) and the topographic features are almost identical for the attenuation prediction.
The highest attenuation values (between 1.5 and 3.5%/m) were mainly located in two areas of the study site: (1) on the marsh edge, probably due the abrupt topographical change of the slope, which induced a wave overwash, and (2) on the high marsh where the vegetation was the tallest on the study site. By contrast, the lowest attenuation values (between −2.5 and 0.5%/m) were observed where the vegetation density was lower or quasi absent (i.e., mudflat), and in the channels in front of the marsh where the bathymetry was higher (Figure 6).
The results indicate also that vegetation is (through its standing biomass) a better proxy than DSM. It can be explained by the dense standing biomass (with a specific spectral signature), which translates into greater roughness than the DSM information, probably underestimating the structural complexity of the biomass because of the dense canopy closure of this low vegetation.
The mean Hm0 attenuation value on the study site is comparable to the values obtained through north-west European mixed salt marshes (0.34%/m [3], 0.25–0.30%/m [25]). The slightly lower results can be explained by the study area that presents a long mudflat, reducing the mean attenuation value on the whole site.
Some artefacts due to a vignetting effect following the flight lines appeared on the spatially explicit model. This noise can be nevertheless retrieved from the original B, G, R, RE and NIR data sources using a principal component analysis (PCA), for further investigation (Figure 6). This vignetting effect could be imputed to the sensors and especially the Sequoia® sensor which exhibits some troubles into the radiometric correction, and to the lateral overlap ratio.
Concerning the future improvements of this modeling methodology, the Hm0 data acquisition could be enhanced by increasing the number of measurement stations and by widening their distribution on the study site. Augmentation of the side overlap ratio, from 65% to 80%, and the use of the second-generation sensor (e.g., Parrot Sequoia+®, leveraging an automatic radiometric calibration system with a shorter shutter interval) is advised, to reduce the vignetting effect. These corrections hold great potential to ameliorate the prediction of the built regression models.
Complementary topographical predictors could also be added to the models such as the roughness index or slope index sourced from the photogrammetry methods, or from other sensors like airborne light detection and ranging system (LiDAR), bringing information about the vegetation topographical but also spectral (intensity) signatures [26,27]. The spatially explicit modeling could also be enhanced using artificial or convolutional neural networks instead of linear regressions.
5. Conclusions
The prediction of multispectral drone imagery was very efficient and accurate in achieving spatially explicit modeling of the wave attenuation in a salt marsh meadow, in addition to in situ wave measurements. Individual G, B, NDVI, R, NIR, DSM and finally RE bands decreasingly brought insights into the attenuation simple linear modeling, emphasizing the relevance of the reflectance and absorbance peaks, the density of the vegetation communities, and then the induced surface changes. Combined with the RGB standard dataset (R2: 0.54), the highest gain by individual predictors was reached by the RE (+0.19), followed by the NIR (+0.17), then the DSM (+0.10). The joint full-combinations highlighted the presence of the RE into the 5 best datasets, with the highest one composed of the RGB + RE + NDVI (R2: 0.85), closely followed by the RGB + RE + DSM (R2: 0.84) and RGB + RE + NDVI + DSM (R2: 0.83). These last results indicated a relative redundancy in the information drawn from the NDVI and the DSM.
In this experimental model, significant wave height values ranged from an increase of 2.5%/m to a decline of 3.5%/m. The modeling allowed us to identify what and where are the most effective areas to attenuate the waves, providing strong advice for future wetland restoration programs.
Author Contributions
Conceptualization, A.M.; methodology, A.M.; software, A.M., T.H., E.A.-V.; validation, A.C., T.H., D.J.; formal analysis, A.M.; investigation, A.M.; data curation, A.M., T.H., E.A.-V.; writing—original draft preparation, A.M.; writing—review and editing, A.M., A.C., T.H., D.J., E.A.-V.; All authors have read and agreed to the published version of the manuscript.
Funding
This research received no external funding
Conflicts of Interest
The authors declare no conflict of interest.
References
- Wayne, C.J. The effects of sea and marsh grass on wave energy. Coast. Res. Notes 1976, 14, 6–8. [Google Scholar]
- Knutson, T.R.; McBride, J.L.; Chan, J.; Emanuel, K.; Holland, G.; Landsea, C.; Held, I.; Kossin, J.P.; Srivastava, A.K.; Sugi, M. Tropical cyclones and climate change. Nat. Geosci. 2010, 3, 157–163. [Google Scholar] [CrossRef] [Green Version]
- Moller, I.; Spencer, T.; French, J.R.; Leggett, D.J.; Dixon, M. Wave transformation over salt marshes: A field and numerical modeling study from North Norfolk, England. Estuar. Coast. Shelf Sci. 1999, 49, 411–426. [Google Scholar] [CrossRef]
- Morgan, P.A.; Burdick, D.M.; Short, F.T. The functions and values of fringing salt marshes in Northern New England, USA. Estuaries Coasts 2009, 32, 483–495. [Google Scholar] [CrossRef]
- Yang, S.L.; Shi, B.W.; Bouma, T.J.; Ysebaert, T. Wave attenuation at a salt marsh margin: A case study of an exposed coast on the Yangtze Estuary. Estuaries Coasts 2012, 35, 169–182. [Google Scholar] [CrossRef]
- Temmerman, S.; Meire, P.; Bouma, T.J.; Herman, P.M.J.; Ysebaert, T.; De Vriend, H.J. Ecosystem-based coastal defence in the face of global change. Nature 2013, 504, 79–83. [Google Scholar] [CrossRef] [PubMed]
- Moller, I.; Kudella, M.; Rupprecht, F.; Spencer, T.; Paul, M.; van Wesenbeeck, B.K.; Wolters, G.; Jensen, K.; Bouma, T.J.; Miranda-Lange, M.; et al. Wave attenuation over coastal salt marshes under storm surge conditions. Nat. Geosci. 2014, 7, 727–731. [Google Scholar] [CrossRef] [Green Version]
- Collin, A.; Lambert, N.; Etienne, S. Satellite-based salt-marsh elevation, vegetation height, and species composition mapping using the superspectral WorldView-3 imagery. Int. J. Remote Sens. 2018, 39, 5619–5637. [Google Scholar] [CrossRef]
- Mury, A.; Collin, A.; Etienne, S. Wave attenuation service of salt marshes and shelly cheniers: A spatio-temporal study in Mont-Saint-Michel Bay, France. In Proceedings of the EGU General Assembly Conference, Vienna, Austria, 8–13 April 2018. [Google Scholar]
- Mury, A.; Collin, A.; James, D.; Pastol, Y.; Etienne, S. Spatially-explicit modeling of the salt marsh wave attenuation using pressure measurements, UAV imagery and LiDAR data. In Proceedings of the EGU General Assembly Conference, Vienna, Austria, 7–12 April 2019. [Google Scholar]
- Mury, A.; Collin, A.; Jeanson, M.; Etienne, S. Wave attenuation service by intertidal coastal ecogeosystems in the Bay of Mont-Saint-Michel, France: Review and meta-analysis. In Estuaries and Coastal Zones in Times of Global Change: Proceeding of ICEC-2018; Nguyen, K.D., Guillou, S., Gourbesville, P., Thiébot, J., Eds.; Springer: Berlin, Germany, 2020. [Google Scholar]
- Lorenzen, B.; Jensen, A. Reflectance of blue, green, red and near infrared radiation from wetland vegetation used in a model discriminating live and dead above ground biomass. New Phytol. 1988, 108, 345–355. [Google Scholar] [CrossRef]
- Elvidge, C.D. Visible and near infrared reflectance characteristics of dry plant material. Int. J. Remote Sens. 1989, 11, 1775–1795. [Google Scholar] [CrossRef]
- Peñuelas, J.; Filella, I. Visible and near infrared reflectance techniques for diagnosing plant physiological status. Trends Plant Sci. 1998, 3, 151–156. [Google Scholar] [CrossRef]
- Collin, A.; Dubois, S.; James, D.; Houet, T. Improving Intertidal Reef Mapping Using UAV Surface, Red Edge, and Near-Infrared Data. Drones 2019, 3, 67. [Google Scholar] [CrossRef] [Green Version]
- Mury, A.; Collin, A.; James, D. Morpho–Sedimentary Monitoring in a Coastal Area, from 1D to 2.5 D, Using Airborne Drone Imagery. Drones 2019, 3, 62. [Google Scholar] [CrossRef] [Green Version]
- James, D.; Collin, A.; Mury, A.; Gloria, H.; Le Poulain, N. Étude spatio-temporelle de la géomorphologie et de l’écologie d’un système dunaire par drone aérien. In Proceedings of the 3ème Colloque Merigéo, Nantes, France, 24–26 November 2020. [Google Scholar]
- Alvarez-Vanhard, E.G.; Houet, T.; Mony, C.; Lecoq, L.; Corpetti, T. Can UAVs fill the gap between in situ surveys and satellites for habitat mapping? Remote Sens. Environ. 2020, 243, 12. [Google Scholar] [CrossRef]
- Archer, A.W. World’s highest tides: Hypertidal coastal systems in North America, South America and Europe. Sediment. Geol. 2013, 1–25, 284–285. [Google Scholar] [CrossRef]
- Détriché, S.; Susperregui, A.S.; Feunteun, E.; Lefeuvre, J.C.; Jigorel, A. Interannual (1999–2005) morphodynamic evolution of macro-tidal salt marshes in Mont-Saint-Michel Bay (France). Cont. Shelf Res. 2011, 31, 611–630. [Google Scholar] [CrossRef]
- Radureau, A.; Lechapt, J.P.; Valery, L. Cartographie de la Végétation et des Gîtes Larvaires Potentiels d’Ochlerotatus des Marais Salés de la Baie du Mont-Saint-Michel; Université de Rennes: Rennes, France, 2011; Volume 1, p. 4. [Google Scholar]
- Fawcett, D.; Panigada, C.; Tagliabue, G.; Boschetti, M.; Celesti, M.; Evdokimov, A.; Biriukova, K.; Colombo, R.; Miglietta, F.; Rascher, U.; et al. Multi-scale evaluation of drone-based multispectral surface reflectance and vegetation indices in operational conditions. Remote Sens. 2020, 12, 514. [Google Scholar] [CrossRef] [Green Version]
- Carter, G.A.; Knapp, A.K. Leaf optical properties in higher plants: Linking spectral characteristics to stress and chlorophyll concentration. Am. J. Bot. 2001, 88, 677–684. [Google Scholar] [CrossRef] [PubMed] [Green Version]
- Horler, D.N.H.; Dockray, M.; Barber, J. The red edge of plant leaf reflectance. Int. J. Remote Sens. 1983, 4, 273–288. [Google Scholar] [CrossRef]
- Cooper, N.J. Wave dissipation across Intertidal surfaces in the wash tidal inlet, Eastern England. J. Coast. Res. 2005, 21, 28–40. [Google Scholar] [CrossRef]
- Bork, E.W.; Su, J.G. Integrating LIDAR data and multispectral imagery for enhanced classification of rangeland vegetation: A meta analysis. Remote Sens. Environ. 2007, 111, 11–24. [Google Scholar] [CrossRef]
- Bertoldi, W.; Gurnell, A.M.; Drake, N.A. The topographic signature of vegetation development along a braided river: Results of a combined analysis of airborne lidar, color air photographs, and ground measurements. Water Resour. Res. 2011, 47, 13. [Google Scholar] [CrossRef]
Figure 1.
Overview of the study site in the bay of Mont-Saint-Michel.

Figure 2.
Hm0 measurement points location within the study site.

Figure 3.
UAS derived data: (a) red (660 nm), (b) green (520 nm), (c) blue (450 nm), (d) red edge (730–740 nm), (e) near infrared (770–810 nm), (f) normalized difference vegetation index and (g) digital surface model. RGB spectral bands values unit is digital number (DN).
Figure 3.
UAS derived data: (a) red (660 nm), (b) green (520 nm), (c) blue (450 nm), (d) red edge (730–740 nm), (e) near infrared (770–810 nm), (f) normalized difference vegetation index and (g) digital surface model. RGB spectral bands values unit is digital number (DN).

Figure 4.
Spatially explicit model of wave attenuation induced by a salt marsh meadow in the bay of Mont-Saint-Michel (France) based on a combination of 5 spectral predictors (R, G, B, RE, NDVI), identified as the best combination with a coefficient of determination of 0.85.
Figure 4.
Spatially explicit model of wave attenuation induced by a salt marsh meadow in the bay of Mont-Saint-Michel (France) based on a combination of 5 spectral predictors (R, G, B, RE, NDVI), identified as the best combination with a coefficient of determination of 0.85.

Figure 5.
Comparative barplot of the coefficients of determination and the gains induced by additional predictors to the RGB combination.
Figure 5.
Comparative barplot of the coefficients of determination and the gains induced by additional predictors to the RGB combination.

Figure 6.
Artefacts visible on the three principal components extracted from the RGB imagery highlighting the flight lines: (a) third (last) component of the RGB-derived principal component analysis (PCA), (b) third (penultimate) and (c) fourth (last) components of the Green-Red-Red Edge-Near Infrared-derived PCA.

Table 1.
Study site’s vegetation species.
| Pioneer vegetation | Spartina townsendii |  |
| Sueda maritima |  | |
| Salicornia europea | 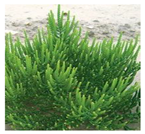 | |
| Short lawn | Puccinellia maritima | 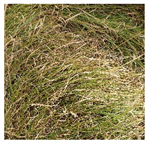 |
| Halimione portulacoides | 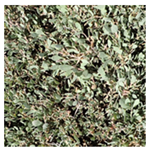 | |
| Aster tripolium | 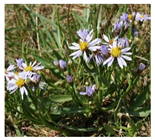 | |
| Semi-woody formation | Halimione portulacoides |  |
| Dense meadow | Festuca rubra |  |
Table 2.
Specifications of the fixed-wing (eBee+®) unmanned aerial system (UAS).
| UAS platform | Sensefly eBee+® |
| MultiSensor device | Parrot Sequoia® |
| No. of pixels (RGB sensor) | 5472 × 3648 pixels |
| No. of pixels (Green, Red, Red Edge and Near Infrared sensors) | 1280 × 960 pixels |
| Lens | F/2.3 |
| Flight control software | eMotion 3.5 |
Table 3.
Specifications of the flight plan.
| Flight planning software | eMotion 3.5 |
| Front overlap ratio | 90% |
| Side overlap ratio | 65% |
| Altitude | 150 m |
| Gimbal pitch angle | –90° |
| Shutter interval | 2.6 s |
| Flying time | 25 mn |
Table 4.
Experienced predictors and predictor combinations for the drone spatial modeling of hydrodynamic attenuation.
Table 4.
Experienced predictors and predictor combinations for the drone spatial modeling of hydrodynamic attenuation.
| Simple linear regressions | Red; Green; Blue; Red Edge; Near Infrared; Normalize Difference Vegetation Index; Digital Surface Model | |
| Multiple linear regressions | Predictors from visible spectrum | RGB |
| Visible + IR | RGB + RE RGB + NIR RGB + RE + NIR RGB + NDVI RGB + RE + NDVI RGB + NIR + NDVI RGB + RE + NIR + NDVI | |
| Visible + DSM | RGB + DSM | |
| Visible + IR + DSM | RGB + RE + DSM RGB + NIR + DSM RGB + RE + NIR + DSM RGB + NDVI + DSM RGB + RE + NDVI + DSM RGB + NIR + NDVI + DSM RGB + RE + NIR + NDVI + DSM | |
Table 5.
Results of the predictors’ contribution.
| Predictors | R2 | RMSE | ||
|---|---|---|---|---|
| Simple linear regressions | R | 0.33 | 0.42 | |
| G | 0.51 | 0.36 | ||
| B | 0.50 | 0.36 | ||
| RE | 0.24 | 0.45 | ||
| NIR | 0.32 | 0.42 | ||
| NDVI | 0.41 | 0.39 | ||
| DSM | 0.29 | 0.43 | ||
| Multiple linear regressions | Predictors from visible spectrum | RGB | 0.54 | 0.35 |
| Visible + IR | RGB + RE | 0.73 | 0.26 | |
| RGB + NIR | 0.71 | 0.27 | ||
| RGB + RE + NIR | 0.71 | 0.28 | ||
| RGB + NDVI | 0.58 | 0.33 | ||
| RGB + RE + NDVI | 0.85 | 0.20 | ||
| RGB + NIR + NDVI | 0.78 | 0.24 | ||
| RGB + RE + NIR + NDVI | 0.81 | 0.22 | ||
| Visible + DSM | RGB + DSM | 0.64 | 0.30 | |
| Visible + IR + DSM | RGB + RE + DSM | 0.84 | 0.20 | |
| RGB + NIR + DSM | 0.80 | 0.23 | ||
| RGB + RE + NIR + DSM | 0.80 | 0.23 | ||
| RGB + NDVI + DSM | 0.63 | 0.31 | ||
| RGB + RE + NDVI + DSM | 0.83 | 0.21 | ||
| RGB + NIR + NDVI + DSM | 0.74 | 0.26 | ||
| RGB + RE + NIR + NDVI + DSM | 0.75 | 0.26 | ||
© 2020 by the authors. Licensee MDPI, Basel, Switzerland. This article is an open access article distributed under the terms and conditions of the Creative Commons Attribution (CC BY) license (http://creativecommons.org/licenses/by/4.0/).
Share and Cite
MDPI and ACS Style
Mury, A.; Collin, A.; Houet, T.; Alvarez-Vanhard, E.; James, D. Using Multispectral Drone Imagery for Spatially Explicit Modeling of Wave Attenuation through a Salt Marsh Meadow. Drones 2020, 4, 25. https://doi.org/10.3390/drones4020025
AMA Style
Mury A, Collin A, Houet T, Alvarez-Vanhard E, James D. Using Multispectral Drone Imagery for Spatially Explicit Modeling of Wave Attenuation through a Salt Marsh Meadow. Drones. 2020; 4(2):25. https://doi.org/10.3390/drones4020025
Chicago/Turabian StyleMury, Antoine, Antoine Collin, Thomas Houet, Emilien Alvarez-Vanhard, and Dorothée James. 2020. "Using Multispectral Drone Imagery for Spatially Explicit Modeling of Wave Attenuation through a Salt Marsh Meadow" Drones 4, no. 2: 25. https://doi.org/10.3390/drones4020025