

Impact of Wind on eVTOL Operations and Implications for Vertiport Airside Traffic Flows: A Case Study of Hamburg and Munich

1
Department Unmanned Aircraft Systems, Institute of Flight Guidance, German Aerospace Center (DLR), Lilienthalplatz 7, 38108 Braunschweig, Germany
2
Department Pilot Assistance, Institute of Flight Guidance, German Aerospace Center (DLR), Lilienthalplatz 7, 38108 Braunschweig, Germany
*
Author to whom correspondence should be addressed.
Drones 2023, 7(7), 464; https://doi.org/10.3390/drones7070464
Submission received: 31 May 2023
/
Revised: 29 June 2023
/
Accepted: 1 July 2023
/
Published: 11 July 2023
(This article belongs to the Special Issue Weather Impacts on Uncrewed Aircraft)
Abstract
:This study examines the impact of wind/gust speed conditions on airside traffic flows at vertiports in the context of on-demand urban air mobility based on the Vertidrome Airside Level of Service Framework. A wind-dependent operational concept introducing four wind speed categories with corresponding wind-dependent separation values is developed and applied in simulation. A decade (2011–2020) of historical METAR wind/gust speed reports are analyzed for a potential vertiport location at Hamburg and Munich airport, and a representative year of wind speed data is selected for each location as simulation input. Both locations experience performance degradation during the first quarter of the simulated year, which contains over 50% of the annual flight cancellations, and exceed wind-operating conditions, especially during midday and early afternoon hours. This study discusses the importance of wind-dependent coordination of flight schedules and analyzes the challenge of determining appropriate wind speed category thresholds. Lower thresholds result in an increased frequency of operationally unfavorable wind/gust conditions. Additional sensitivity analyses are performed to study the effects of wind-dependent separation deltas and wind-(in)dependent scheduling approaches. In conclusion, the presented approach enables planners and operators to make informed decisions about vertiport traffic flow characteristics and performance, vertiport location, and business cases.
1. Motivation and Objective
“Wind was the most common cause or contributing factor in part 91 weather-related accidents. […] The highest number of wind accident citations were for crosswind and gusts, followed by tailwind” [1].
According to the Federal Aviation Administration (FAA) weather incident report of 2010, the general aviation sector suffers from wind as the most common cause of weather-related accidents [1]. General aviation flights, typically involving small, single engine aircraft and rotorcraft, operating in lower altitude airspace and addressing, among others, recreational, business, and aerial work flights, may fly in similar airspace as intended for Urban Air Mobility (UAM) flights. A study published in 2022 states that, for general aviation flights, “wind and overcast conditions were not as dominant a weather-related factor […] as previous studies suggested” [2]. The fact that vertical take-off and landing (VTOL) aircraft are lighter, typically involve electric propulsion systems providing limited range, and are operating as urban and sub-urban transportation services facing densely populated and built-up areas will indeed ask for increased safety requirements due to increased weather-related uncertainties. Since (e)VTOL flights and UAM application are still in their infancy, the current literature basis of how weather will be impacting future UAM flights is still in early stages. The complexity of this subject is increased by the variety of (e)VTOL aircraft configurations and designs which may vary in weather-resistance. However, there is growing recognition of the need to study and test the impact of weather on UAM operations in order to ensure efficiency and first and foremost safety at all times.
This manuscript contributes to this development by investigating the impact of wind/gust speed on vertiport operations as one of the important weather parameters of interest. We are focusing on how wind might influence the airside operation of a vertiport from a scheduling and processing perspective. For this purpose, we analyze historical Meteorological Aviation RoutineWeather Report (METAR) data of two vertiports potentially located at Hamburg Airport (EDDH) and Munich Airport (EDDM), define a weather-dependent vertiport Concept of Operations (ConOps), and use the Vertidrome Airside Level of Service (VALoS) as metric to evaluate the performance of the developed ConOps and the selected vertiport layout under wind constraints. For this purpose, we built upon and, therefore, refer to previous publications where we introduced the Linear Independent Expandable Drive-Through (LIEDT) vertiport layout and the corresponding ConOps [3], as well as the vertiport airside performance assessment framework VALoS [4].
To achieve this objective, in Section 2, we provide a summary of historical and current wind-related studies for UAM applications. Based on this state of the art, we develop a wind/gust-dependent vertiport ConOps that manages incoming UAM requests depending on the occurring wind conditions. In Section 3, we introduce the reader to the overall fast-time simulation setup depicting a vertiport’s airside operation which includes the selection of electrical vertical take-off and landing (eVTOL) aircraft performance data, vertiport location and layout, selection of METAR data, and the concluding wind-dependent vertiport ConOps. Section 4 informs about the used performance metric VALoS, highlights the most important results, and discusses how wind speed is evolving over several years for the two locations of interest and how this affects the attained VALoS of each vertiport. The paper concludes with Section 5, where simulation results and limitations are discussed critically, and which discusses future activities to advance in the field of wind/weather and UAM.
2. Literature Review: Weather and Urban Air Mobility
Investigating the potential of future transportation modes requires the identification of operational constraints and challenges. Especially in aviation, meteorological conditions play a key role in the certification and operation of aircraft. In the second half of the 20th century, researchers already investigated the potential of civil helicopters serving as an early version of UAM. Additionally, commercial tiltrotor applications have been considered due to longer endurance, lower operating costs, and better community acceptance and passenger ride comfort compared to multi-engine helicopters [5]. In addition, tiltrotor aircraft are able to utilize both heliports and conventional runway infrastructure like helicopters. At the time, a notable challenge hindering helicopter transportation to become reality was described by the lack of public-use heliports [6]. This also affected tiltrotor aircraft applications. As a consequence, thorough research and a comprehensive assessment of current heliports and future potential ground infrastructure, named vertiports, were conducted in order to enable the implementation of intra-urban and inter-city air mobility.
The need for “all-weather flying capability” was stated in 1981 [6] in order to develop a new transportation system of success and scalability, and was again emphasized in 1994 by [7] for “achieving the schedule reliability needed for a successful passenger transportation system”. “The value of the helicopter is directly related to the extent to which it can fly the same routes and patterns in bad weather that it can in good weather” [6]. To achieve this goal, “[…] full Instrument Flight Rules (IFR) precision approach all-weather facilities are necessary” [8].
Several studies such as [9,10,11] started to investigate air flow conditions and wind effects during en-route flight phases and at heliports located in intra-urban and densely built-up environments. Ref. [9] determined, among others, that helicopter operations should be limited to gust speeds of less than 20 kts due to passenger comfort. Furthermore, the steeper the approach path to a helipad, the more severe is the impact of wind on helicopter operations, depending on the direction of the shear wind. An early investigation of urban canyons was conducted, e.g., by [10], who identified that the “most critical wind velocity conditions occur for buildings of different heights and at a point near the passage entrance for a wind direction skewed by 30° from the passage centre line”. Therefore, optimized heliport and vertiport placement is of great interest. Based on the operating environment, detached buildings provide a different wind characteristic than a conglomerate of buildings with different heights and shapes. By prevailing wind directions, it was recommended to position an elevated heliport on the leeward edge, whereas ground level heliports should be placed on the windward side of the building [9]. Testing Visual Flight Rules (VFR) heliports in an obstacle-rich environment, Ref. [12] interviewed helicopter operators and pilots about their achievable operating envelope under Visual Meteorological Conditions (VMC). This resulted in a limited and minimum set of VMC requirements, including, but not limited to, calm wind velocities of 15 kts (28 km/h) with up to 25 kts (47 km/h) of gusts. In 1991, further research was still required to evaluate the impact of crosswinds, tailwinds, and turbulence during steep and low-speed approaches [13].
Although the 1991-issued advisory circular on vertiports was cancelled in 2010 [14], UBER Elevate published its first whitepaper on on-demand urban air transportation in 2016 [15]. Again, weather aspects such as density altitude, ice, visibility, wind, and gusts, as well as the need for real-time local weather monitoring and forecasting, were identified as crucial for trip reliability and overall electrical vertical take-off and landing (eVTOL) aircraft network safety. Currently, different (e)VTOL aircraft designs, such as tiltwing, tiltrotor, multicopter, and lift and cruise configurations, are under development that might operate at different flight envelopes resisting varying weather conditions. Having all those (e)VTOL aircraft operating in the same low-level airspace and all utilizing the same vertiport network, detailed knowledge of the individual VTOL and especially eVTOL aircraft performance and its operational reliability is required.
Looking into operational constraints of eVTOL aircraft, especially being interested in weather-dependent performance characteristics, no real flight data are currently publicly available. Furthermore, European regulations such as SC-VTOL-01 [16], the special condition for small-category VTOL aircraft, does refer vaguely “ […] to a wind limit appropriate for the aircraft type”.
According to the complementary set of Means of Compliance (MOC), severe weather conditions might be avoided and VTOL flights are assumed to follow special VFR rules when operating in snow conditions which requests VTOL operation at 0.5 mile visibility and down to −4 °C [17]. In the previous proposed MOC, for the initial take-off phase as well as for the final approach phase, a minimum “of 17 kts [31.5 km/h] of relative steady wind” was proposed to be taken into account [18]. The PTS-VPT-DSN [19], the prototype technical specifications handbook for vertiport design published by European Union Aviation Safety Agency (EASA), focuses on VTOL operations under VFR. Other than the suggestion that vertiport locations should avoid downwind conditions and reduce crosswind impact to a minimum, no more details specifically for (e)VTOL operations were provided.
In contrast to currently lacking details in regulation, several research groups are investigating the impact of weather on UAM and (e)VTOL operations, most often without specifying the (e)VTOL aircraft configuration. One exception is a study conducted by [20]. Comparing fixed wing and multirotor small unmanned aircraft system (sUAS) designs in terms of wind resistance and compared to the Beaufort wind scale, ref. [20] found that multirotor designs provide slower maximum speeds, which increases the difficulty to withstand wind characteristics above strong, equivalent to 22 to 27 kts [21] (11.3 to 13.9 m/s), and near gale winds, equivalent to 28 to 33 kts [21] (14.4 to 17 m/s). This impacts an aircraft’s controllability, endurance, and overall operational safety.
For the area of Upper Bavaria (Germany) and targeting a 99% operational viability, the UAM network needs to operate at 20 m/s headwind and at ICAO Standard Atmosphere (ISA)+30 conditions [22]. Instead, in the U.S., according to [23], UAM operations are required to operate at 20 kts (10.3 m/s) of wind speed and up to 35 kts (18 m/s) of wind gust speed in order to operate 95% of the time in most of the metropolitan areas. Here, a headwind of 10 kts (5.1 m/s) was assumed. Ref. [24] emphasized the importance of wind speed, wind direction, and its relation to approach and departure slope directions. It is recommended that VTOL aircraft should not take-off and land under tailwind conditions due to possible interference with their own downwash, as well as not under crosswinds above 15 kts (7.7 m/s).
A significant contribution to the assessment of weather barriers for UAM operations was provided by [25] (initial technical report: [26]). Refs. [25,26] discussed that vertical wind shear will most likely be critical for UAM operations, but cannot be depicted by surface observations as provided by METAR. For helicopter operations, ref. [6] already highlighted that “wind effect problems increase with steeper approaches depending on the direction of the shear (horizontal and vertical). Vertical shear is worse for shallower approach angles”. Furthermore, refs. [25,26] evaluated the impact of different weather conditions on UAM operations and divided wind in four categories: 0–15 kts, 15–20 kts, 20–25 kts, and ≥25 kts, in which the last three categories have an increasing negative impact, leading to a reduction of operational hours depending on the operational location, respectively.
Additionally, NASA together with AvMet Applications Inc. proposed weather thresholds for UAM operations, this time referring to the classes green, yellow, and red [27]. In addition, a detailed categorization of wind has been provided, which has not been addressed in this detail for UAM so far. Horizontal wind speed was divided into <15 ± 5 kts (green), <20 ± 10 kts (yellow), >25 kts, or gusts >35 kts (red). Vertical wind gusts were classified into <4 m/s (green), 4–6 m/s (yellow), and >6 m/s (red).
Ref. [28] also researched weather conditions under which large passenger-carrying unmanned aircraft system (UAS) might be able to operate. For a Volocopter multirotor, this resulted into the estimation of 8.6 m/s (16.7 kts) mean wind limits and 13.74 m/s (26.7 kts) wind gust limits. In the following analysis, which focused on how weather appearance influences operational safety, and in contrast to [24], ref. [28] assumes that wind direction “is not considered a significant risk to operational safety”. Same applied for cloud coverage since UAS operations leveraging from onboard detect and avoid solutions “primarily focus on information shared between aircrafts and via UAS traffic management UTM.”
As listed above, several studies started to discuss weather constraints in relation to operational restrictions for all kinds of aviation. Especially for a new transportation mode such as UAM, which operates in densely populated and built-up areas with lightweight eVTOL aircraft, it is important to understand operational opportunities, challenges, and overall resulting service reliability. Therefore, linking environmental constraints to service availability and reliability is key to a successful and sustainable development.
In 2018, ref. [26] evaluated how different weather conditions, e.g., wind, rain, hail, and temperature, are impacting UAM operational hours by assigning a specific Impact Score (IS) from 1 (“minimally impactful, little reduction in operations”) to 10 (“significantly impactful, potential cessation”) to each hour. For a selection of different urban areas across the U.S., weather data were evaluated and resulted in 6.1, 7.3, 2.9, and 2.2 impacted hours per day during the winter, spring, summer, and fall season, respectively. New York reached the most negative score by displaying 12, 12, 0, and 8 impacted hours per day, respectively. This results into eight impacted hours on annual average per day.
Additionally, ref. [29] investigated the global UAM service availability by using hourly historical weather data from different weather models covering the years 2018–2020. Next to defining mean wind speed classes of <15 kts (nominal), 15–20 kts (moderate), and >20 kts (severe), several other weather conditions, e.g., temperature, precipitation, and icing, were considered. Germany ranked as second-last of the top 18 UAM countries by providing nominal conditions for only 55% of the annual hours. Munich, as the only German city represented in the top 20 cities, achieves only 57%, which is 19 percentage points below the top 20 city average. Severe conditions sum up to 22.9%, which is predominantly caused by occurring gusts and icing conditions (see [30] for detailed icing report including Munich and other cities).
Other studies such as [22,23] derive certain aircraft performance characteristics based on historical weather data under the objective to operate a certain percentage of the day and year. All have in common that no detailed advice, recommendation, or protocol was yet elaborated, and how this will change strategic and tactical operational processes, not only enroute, but also at vertiports during arrival, departure, and on ground.
Summarizing the relevant literature in Table 1, it can be seen that we have not reached a common basis and not gathered enough flight data yet to define an eVTOL aircraft’s performance capability facing changing wind conditions, gusts, and turbulence. Further, it is not clear to what extent and what level of detail, resolution, and accuracy (micro-) weather data is needed to guarantee a sufficient level of safety while operating in urban environment. Several proposals of how weather awareness can be increased on local scopes are amongst others summarized in [31]. Smart urban sensing [32] and real-time crowdsourcing weather data [33] might be possible approaches. “It is time for interdisciplinary research and development partnering the aviation industry and the weather community in operational UAM scenarios” [34].
In conclusion, environmental constraints and changing weather conditions on local level are still a major uncertainty across several research groups and studies. This is reinforced by the lack of corresponding performance requirements from a regulatory and standardization perspective, as well as the lack of actual eVTOL performance data. Therefore, vertiport research still misses essential developments on how vertiports need to be placed and operated under changing weather constraints and how this affects a vertiport’s individual capability and the overall UAM service availability and reliability. In addition, the consequences of weather changes to air traffic management procedures and performance parameters are mostly not defined or not even proposed yet. Only operational shutdowns are mentioned as soon as indicator limits are exceeded.
3. Vertiport Concept of Operations under Wind Constraints
Based on what is currently available in the scientific literature and VTOL regulation, very limited recommendations have been provided on how vertiports should operate under changing weather, specifically, how different wind conditions are impacting strategic and tactical processes at vertiports. Vertiports should avoid downwind operations and should reduce crosswind impact to a minimum [19]. VTOL aircraft should not take-off and land under tailwind conditions and are sensitive to crosswind impact [24]. Severe weather conditions, including hail, lightening, tornadoes, and hurricanes, should be avoided at all times for small UAS [20], which most likely will apply to UAS and VTOL aircraft as well. In addition, passenger comfort needs to be considered, which may lead to operational thresholds below the maximum capability of the VTOL aircraft. Since those recommendations are either based on helicopter pilot experiences, educated guesses, or subjective assumptions, rather than being harmonized, nor following explicit regulations and standards for (e)VTOL aircraft performance, we are targeting a high-level approach of how wind in general might impact vertiport operations and corresponding airside traffic flows.
In order to develop a weather-dependent vertiport ConOps, we first need to define our specific system boundaries, including the selection of the VTOL aircraft design, vertiport layout, and considered source of weather data.
3.1. Vertiport Selection: Location, Layout and Demand
As a potential vertiport location of interest, we select two German airports, Hamburg Airport (EDDH—53 feet MSL) and Munich Airport (EDDM—1487 feet MSL), which may function as early adopters of UAM by offering airport shuttle services. Both cities have a historical affinity for aviation and display the necessary socio-economic status required for an early adoption of UAM. For this study, we are not investigating the optimal location of the vertiport at the respective airports. It is assumed that a trade-off between passenger convenience and operational feasibility was considered and that the vertiport can operate independently without negatively impacting airport operations. The reader is pointed to [38,39,40] if more details are desired on how vertiports might be placed and operated in German airport environment.
Both cities can experience quite challenging weather conditions for UAM, exacerbated by seasonal variations. Munich is located in the alpine foothills in the south of Germany, which can cause complex and varied wind patterns; turbulence; and rapid weather changes, including heavy rains. Moreover, Munich sometimes experiences Foehn winds, warm and dry winds that descend from the alps and can cause rapid and unpredictable temperature changes and gusty winds [41,42]. In contrast to Munich, Hamburg is located in proximity to the North Sea in northern Germany. With its maritime climate, Hamburg experiences mild winters and cool summers. However, Hamburg experiences frequent rain, fog, and overcast skies, as well as strong westerly winds [43,44]. Both cities can experience adverse weather conditions that may significantly impact the operation of UAM flights.
As vertiport design, we use the operational concept of the LIEDT layout. As introduced in [3] and displayed in Figure 1a, we separate arrival (Arr) and departure (Dep) traffic streams in the air and on the ground, create one directional traffic flow characteristics, and separate airside and landside operations by leveraging a two-story concept in order to increase both operational safety and throughput. We follow the approach presented in [28] and do not take specific wind directions into account when operating the vertiport. Due to the configuration of the selected LIEDT layout, changing wind directions can be compensated by changing the operating direction from left to right and vice versa. Furthermore, offering an omnidirectional obstacle free volume of 180° span width for each final approach and take-off area (FATO) and with a prohibited sector above the gate parking position, it allows the VTOL aircraft to orientate itself preferably to the occurring wind according to its specific vehicle performance and, therefore, can adjust tactically its final approach and take-off path.
We utilize the demand forecast published by Bauhaus Luftfahrt and Co. during the project “OBUAM” which represents an estimation of the potential UAM demand distribution across a vertiport network in Upper Bavaria (Germany) [22]. Referring to the low demand scenario A, we select the following demand distribution depicted in Figure 1b, which serves as an exemplary demand forecast for both vertiports in both locations and which approximately fits the hourly peak capacity constraints of the LIEDT layout with eight gates (see Equation (1)).
ICAO’s Airport Masterplanning document provides the following Equation (1) to estimate the required number of gate parking positions [45]:
where S equals the required number of stands, describes the gate occupancy time in minutes for each aircraft group i, equals the number of arriving aircraft per group and peak hour, and represents additional spare stands. We assume due to operating a homogeneous aircraft fleet, min, eVTOL per hour (h) since this is the critical capacity of the FATO, and because we assume no further stands attached to the terminal. Thus, we conclude with eight required gate parking positions.
In Table 2, the following service times for a vertiport with LIEDT layout have been assumed. For detailed description and derivation, see [3,4].
Following the recommendations of [19], we target a 95% usability factor for each vertiport. Assuming a year-round operation, this would lead to an acceptable 18 days of operational shutdown in total. It needs to be highlighted that this will only be considered in terms of wind limitations. If other weather parameters such as temperature, snow, and icing are additionally taken into account, the usability and the resulting utilization of the vertiport would be further reduced.
3.2. eVTOL Aircraft Selection: Design, Performance and Separation
In terms of aircraft design and performance, we are assuming an electric multicopter aircraft design such as the Volocopter aircraft models 2X and VoloCity. For this analysis, the vertiport is sized exemplarily according to Volocopter’s 2X D-value (assumed D-value: 9.15 m). Operating a homogeneous eVTOL fleet of the same aircraft neglects the fact that different dimensions and performance characteristics must be taken into account when sizing the vertiport and defining operational separation and scheduling values.
Since multicopters have no lift-generating airframe, the rotary system and its propulsive means are predominantly responsible for lift and forward flight. The aircraft gains its stability by adjusting the thrust of each rotor. According to [46], therefore, the multicopter’s propulsion system, actuators, and controllers define how well a multirotor is behaving under wind and gust influences and what operation thresholds are defined.
In the absence of publicly available flight performance data for passenger-carrying multirotor aircraft design concepts, in this analysis, we assume that the aircraft can withstand wind and gust speeds to a predefined extent. Wind direction is of secondary interest, as we request that in addition to the tactical adjustment of the vertiport’s operating direction, as described in Section 3.1, the aircraft is capable of successfully compensating for wind direction with its distributed electric propulsion system.
3.3. Weather Data Selection: METAR and Wind
One possible source of current weather information at airports is METAR. The format of METAR is standardized by ICAO and is reported in combination with forecast values in the form of Terminal Aerodrome Forecast (TAF). This is complemented by SPECI, an unscheduled special weather report, released when one or more weather elements meet specified criteria. Although METAR and SPECI are used worldwide, there are code differences among countries. Current and historical METAR and TAF data are available on several publicly accessible websites such as https://www.ogimet.com (accessed on 21 April 2023)}. For further details, the reader is pointed to [47].
At German airports, a METAR report is issued twice an hour: 20 and 50 min after each hour. At small airports such as Ingolstadt-Manching (ETSI), a METAR report is published once an hour. The standardized METAR data set contains information about meteorological elements, such as wind, visibility, precipitation, clouding, temperature, and pressure, that are relevant for air traffic operations at airports (see Table 3).
However, according to [48], the use of raw METAR records is not intended for detailed data analysis purposes since data integrity is not guaranteed. The (partial) lack of important information, such as variable units of measure, or simply incomplete data sets are not uncommon. In order to properly analyze weather phenomena such as wind or temperature, the METAR data set must be parsed, filtered, and transformed into a usable measure.
In the second chapter of the ICAO Annex 14 Aerodrome Design Manual, “Configuration Considerations”, ICAO recommends requirements for the quality of wind data used in the planning of airport sites with regard to their wind-dependent usability. Accordingly, the selection of wind data should cover a period as long as possible, but should not be less than five years [49].
As stated in [50], the METAR component wind is usually measured at approximately 10 m above ground, which represents ground level measurement for conventional aviation. The measurements are representative for the altitude range of six to ten meters above the runway; therefore, METAR does not provide information about high winds. Both wind direction and wind speed are averaged over a 10 min period immediately preceding the time of the report. If the wind is inconsistent and its direction deviates more than 10° from the mean prevailing direction, the indicator letter “V” is displayed. The sequence “VRB” in place of the direction indicates that a clear wind direction cannot be determined. For example, wind speed may be less than four knots. Wind speed outliers are only listed if they exceed the mean by at least 10 knots during the 10 min period preceding the observation. To indicate the maximum gust speed, the indicator “G” is added together with a two-digit. For example, “20006G18KT” means that the actual wind speed is six knots with gusts up to 18 knots. A summary is provided in Table 4.
The occurrence of special wind-related weather phenomena such as squalls, funnel clouds/ tornadoes, dust/sand eddies, and sand- or dust storms is also indicated in the METAR record. Additional information may also be reported such as wind shear [51]. Here, for further data analysis, only wind and gust speed information is considered, since the proximity of the wind measurement devices to the ground covers only the immediate take-off and final landing process of the eVTOL aircraft at the FATO.
For this wind-related vertiport analysis, METAR wind speed data from the two German airports of Hamburg and Munich are considered and evaluated over a 10-year period starting from 2011 to 2020. To compare and classify the empirical wind conditions for both locations, additional METAR datasets will be used from Stuttgart Airport (EDDS), whose location is known for less impactful wind conditions (see Section 4.1). It should be noted that wind/gust conditions are only one of several possible weather classes (visibility, icing, thunderstorms, etc.) that can potentially disrupt UAM traffic and vertiport operations.
3.4. Definition of a Wind-Dependent Vertiport ConOps
With the definition and explanation of the system boundaries and data sources used for this analysis, we are now able to define a wind-dependent vertiport ConOps, focusing on the introduction of wind-dependent separation values. For this purpose, we use the wind speed classifications proposed by [25,26] and [27] as a basis for categorizing the vertiport operation under wind aspects (see Table 1). Following EASA’s “17 kts wind statement” [18], which is the only recommendation on wind conditions related to VTOL performance, we adjust the lower operational limit in which eVTOL aircraft can operate without restrictions from 15 kts to 17 kts. This results into the following proposed categorization which is displayed in Table 5.
We define the nominal Wind-Operational (WO) category for wind/gust speeds up to (including) 17 kts. It represents the condition where acceptable wind speeds are measured; therefore, the vertiport operates under normal conditions with a nominal separation required. If the wind speed increases up to (including) 20 kts and the Wind-Advisory (WA) category is active, it is assumed that operational constraints are still within an acceptable range for normal operation under which all eVTOL aircraft are certified. However, separation values will be increased in order to account for flight deviations due to higher wind and gusts speeds. The Wind-Warning (WW) category represents the condition where we assume wind/gust speeds to reach the maximum limit of 25 kts for certified operations. The vertiport will implement additional safety precautions to ensure safe operations, which, in this case, demands an additional increase in separation. If wind/gust speeds are equal or even exceed 25 kts, it is assumed that it is above the maximum limit for safe operations; therefore, the Wind-Shutdown (WS) category will be activated. The vertiport will need to suspend vertiport operations temporarily by declining incoming arrival and departure requests until wind conditions improve. This may contradict [25,26], which assigns an IS of 8 to wind conditions ≥25 kts. However, since “thunderstorms” are already listed with an IS of 9, and we assume that there will be no operation under these conditions, we set the upper operational limit for eVTOLs to 25 kts and, thus, temporarily close the vertiport at an IS of 8.
eVTOL separation values are calculated using the Equation (2) relating the IS for each wind category to the nominal separation value required to operate in the WO-category. Since no eVTOL vehicle separation values are currently available or prescribed, we assume a 10 s increase in separation time for each increase in IS. Of course, as more knowledge and flight test data on flight and navigation performance become available, this value will need to be adjusted. The defined separation values are now considered during strategic scheduling of arrival and departure requests. Furthermore, this set of values represents the tactical adjustments of FATO service times due to longer landing and take-off times under wind impact. It also determines when a subsequent flight is cleared for final approach or take-off.
In addition, we are assuming an “ideal wind-dependent” scheduling approach. This means that for each incoming on-demand request, the booking system has an ideal knowledge of the wind forecast. Especially for arrivals, this means that at arrival request, 20.8 min, on average, prior to landing at our vertiport of interest, an accurate wind/gust speed forecast for the destination vertiport is available. Due to EASA’s continuous safe flight and landing requirements for certified VTOL operations [19], alternate vertiports need to be part of the flight plan. If WS-conditions occur, requests will be already cancelled during booking procedures or will be ultimately re-routed to an alternate vertiport if WS-conditions only appear locally at the destination vertiport.
4. Wind Analysis and Airside Traffic Simulation for Selected Vertiport Locations
We now apply the developed wind-dependent ConOps to the UAM traffic processed at two exemplary vertiports located at EDDH (depicted in blue) and EDDM (depicted in black) considering long-term variations of wind conditions. In the first step, we use METAR wind/gust speed data for the ten-year period 2011 to 2020 for both vertiport locations, analyze and compare them with respect to the wind speed categories introduced in Section 3.4, and select a representative year for the airside traffic flow study through fast-time traffic simulation (see Section 4.1). Of course, for even more precise evaluation, the time range can be expanded to also account for annual weather variations and, lastly, climate change impact. The main objective of the fast-time simulation experiment is to simulate one representative day of traffic demand under the influence of a whole year of wind data. This approach covers a wide range of wind conditions impacted amongst others by daily fluctuations and seasonal differences and allows a level of service and performance comparison between them due to the use of identical demand days. The fast-time simulation calculates delay-based performance indicators which are used to assess the vertiport’s airside traffic flow according to the VALoS evaluation concept (see Section 4.3). A detailed follow-up manuscript on the discrete event-based (DES) fast-time simulation called “V-Lab” is currently under development and is expected to be submitted in 2023.
Lastly, two sensitivity analyses are performed. Part I deals with an empirical analysis of the METAR data and the sensitivity of wind-category occurrence due to variations of the wind category thresholds (see Section 4.2). Part II addresses VALoS sensitivity analyses due to changes of the separation delta increase value and varying between “wind-dependent” and “wind-independent” vertiport scheduling approaches (see Section 4.4).
4.1. Wind Data, Statistics, and Analysis
The study period from 2011 to 2020 covers a time window of 3653 days. This equates to a total of 175,344 measured METAR values per location (EDDH, EDDM) for the 10-year interval and from a 24-h perspective providing two measurements per hour. In this dataset, 106 measured values were missing at both locations in total, which corresponds to a share of only 0.03%. The annual values vary between 0.01% (2015, 2017) for both locations and 0.05% or 0.09% for EDDM (2013) and EDDH (2013), respectively. For the fast-time simulation, if a time window is missing data points, we consider the wind/gust report from the previous time window.
For this section, we first distinguish between wind and combined wind/gust evaluations. When considering wind, only the standard wind speed information in the METAR dataset is taken into account. For the combined wind/gust evaluation, if gust values are issued in the METAR report, wind speed values will be replaced by gust speed for the affected time windows. By definition, gust information is issued in a METAR report if the average wind speed is exceeded by at least 10 kts for a defined period of time in 10 min before a report is submitted.
Figure 2a shows the frequency of the different wind speed classes at three airport locations, EDDS, EDDM, and EDDH, for the period from 2011 to 2020. For each location, the measured wind speeds are assigned to one of the four wind categories introduced in Section 3.4. The results show that the percentage of wind speeds >17 kts is less than 5% at each of the three locations. The values vary in range from 0.6% to 2.6% for pure wind measurements, but increase to 2.0% to 4.8% when gusts are included. The greatest restriction applies to a vertiport located at EDDH, whereas values for EDDS are comparatively moderate.
When selecting a representative year as meteorological input for the UAM vertiport traffic simulation, large fluctuations in wind speeds among different years can occur. Therefore, a range of 10 years is sighted here. The evaluation of the wind speed data for individual years within the decade 2011 to 2020 shows a range of variation in the annual results regarding the probability of occurrence of unfavorable wind speed conditions (>WO). For an EDDM vertiport location, the range of annual variation is between 2.1 and 4.4%, for an EDDH location between 3.8 and 6.7%. Finally, in order to exclude annual outliers, a representative value for an average annual wind strength activity is selected for each of the two locations. This leads to the selection of the year 2012 for EDDM and 2019 for EDDH (see Figure 2b).
In addition to location-related differences between Hamburg and Munich, there are also seasonal differences between the summer period (April to October) and winter months (see Figure 3). In Figure 3a, the cumulative probabilities of the occurrence of individual wind/gust strength values are calculated for summer and winter seasons. Next to seasonal and location-related differences, introducing dedicated wind-dependent vertiport operation categories shows how gusts in particular are impacting wind conditions and how wind categories above operational limits are, therefore, occurring. The results show that a vertiport located specifically at EDDH would be affected by gusts in both summer and winter (see Figure 3b).
Another correlation of gusts impacting significantly current wind conditions is defined by the time of day. As displayed in Figure 4, during noon/early afternoon hours, an increase in wind strength was observed. Thus, the probability of the occurrence of critical wind/gust strengths increases significantly. At EDDH, the wind-operational category was exceeded in about 8% of the measurements between 12:00 and 14:00 local time (EDDM 5%). At night, the corresponding values for both locations drop well below 3%.
Figure 2, Figure 3 and Figure 4 display a significant variation in wind/gust values over year, season, and hour. Therefore, a combined evaluation of wind/gust data based on main traffic hours (e.g., 06:00 to 22:00 local time) three months over a year would lead to different results than the overall consideration of 24 h per day over a complete year. For subsequent analysis of the airside traffic flow on vertiports, we focus on the combined METAR wind/gust dataset for the years 2012 (EDDM) and 2019 (EDDH). If additional detailed analysis is required, we switch to a 24-h evaluation of wind/gust-relevant days of the corresponding years.
4.2. Wind Sensitivity Part I
Sensitivity analyses were performed to evaluate how changes of wind category thresholds impact the wind-related availability of the vertiport (see Figure 5).
For this purpose, the previously defined wind thresholds for each wind category in Table 5 have been collectively and stepwise varied from −2 kts to +2 kts. For example, varying the thresholds by −2 kts results in the following: WO: ≤15 kts, WA: 16 kts to ≤18 kts, WW: 19 to <23, WS: ≥23. Therefore, WO varies from ≤15 kts to ≤19 kts. Afterwards, the frequency of each wind category was determined for the decade 2011–2020. As expected and depicted in Figure 5a, low threshold values lead to an increase in occurence frequencies for wind/gust classes greater than WO. These increases are most pronounced for the conditions WA and WS in EDDH. For a vertiport location at EDDH, low thresholds of 16 kts or 17 kts result in percentage frequencies of over 5% for stronger wind conditions.
Further sensitivity analyses were performed to determine the possible variation within the decade for both locations (see Figure 5b). It can be seen that with lower threshold values, the range of the individual annual variability also increases. A comparison of the lowest and highest threshold conditions shows that the annual values for a vertiport location at EDDM vary by 1.9% (“≥20 kts”) and 3.2% (“≥16 kts”) and for a EDDH location by 2.2% (“≥20 kts”) to 4.3% (“≥16 kts”). Depending on the vertiport location, uncertainties are expected due to annual variations of wind speeds and the selected wind speed thresholds.
4.3. Vertidrome Airside Level of Service Statistics
As a performance metric, we utilize the VALoS concept for UAM vertiport operations, already introduced in [4], which is based on traditional level of service methods used for ground transportation capacity and airport terminal planning. VALoS uses aggregated individual airside flight delays to compute three specific performance indicators. Depending on predefined threshold values, the processed traffic processed, within a time interval of, e.g., 15 min or one day, will be classified into two VALoS categories: Acceptable and Non-Acceptable. We are evaluating the requirements of three key stakeholders: the passenger “PAX”, the eVTOL aircraft operator “eVTOL”, and the vertiport operator “Vertiport”. All three stakeholders demand specific performance capabilities for certain performance metrics such as delay (PAX, eVTOL) and punctuality (Vertiport). Evaluating the airside traffic flow in 15 min time-windows, the VALoS is acceptable if the average PAX-delay is ≤2 min, each eVTOL airborne delay is ≤5 min, and ≥95% of the total flight delays display ≤2.5 min. The VALoS is non-acceptable if an individual delay threshold is exceeded or if less than 95% of the flights are punctual. To represent the impact of the WS category, we will add the number of cancellations to our performance metric. The vertiport usability factor of 95% introduced earlier imposes an additional critical operational threshold which limits the amount of cancelled flights. We introduce a limit to the number of cancellations that can be made by the UAM operator in order to maintain an acceptable VALoS. Since we are not focusing on optimizing the cancellation strategy to achieve the best usability rating, we are considering this performance metric only during post-processing analyses of the daily and yearly-VALoS distribution.
The developed Matlab/SimEvents DES simulation introduced in [4,52] was extended to fit the new system boundaries of this wind analysis.
With this updated set of performance metrics, we are now evaluating if, how, and to what extent wind/gusts are impacting vertiport airside traffic flow characteristics, if this can be depicted in a VALoS framework and a corresponding dashboard, and how each stakeholder performance changes over the course of up to one year for each vertiport potentially located at EDDH or EDDM.
In the first quarter, 25,187/25,470 (2019/2012) arrival requests in total (283 per day) were received at vertiports at EDDH and EDDM, respectively. In general, incoming and outgoing flights of each vertiport take about 20:30 min on average (total flight time) under WO-conditions. Starting from a 365-day/1-year perspective, both locations suffer differently from changing wind/gust conditions (see Figure 6). In the first quarter of 2019 (see Figure 6a), the vertiport operation at EDDH was especially significantly impacted by exceeding WO-conditions. A total of 1886 arrival requests had to be cancelled, which represent a share of 58% of all cancellations in 2019. In the same period, the operation at EDDM resulted in 1207 cancellations, 57% of the overall arrival request cancellations in 2012 (see Figure 6b). In total, a vertiport at EDDH had to cancel 3249 arrival and 3031 departure requests in 2019. At EDDM, 2116 arrival and 2063 departure requests had to be turned down. Even though arrival request cancellations added up to a maximum of 206 per day at EDDH (225 at EDDM), Figure 6 shows that the daily punctuality of the arrival traffic flow was always in acceptable VALoS ranges throughout the year, except January 8th, where only 94.4% was achieved. At EDDM, a punctuality rating of min 95.5% was achieved. This rather positive result is caused by the definition of punctuality which takes into account the delay between scheduled and actual times of accepted and therefore processed flights. Requests which will be cancelled immediately due to un-safe wind constraints are not part of the schedule and, therefore, are neglected in the subsequent VALoS statistics.
A more precise VALoS performance indicator is the average PAX delay, which consists of the actual scheduling, airborne, and ground delay and represents the total flight delay for each eVTOL flight. During WO-days, the average passenger delay per day equals 56 s for departures and 55 s for arrivals. Since changing wind conditions require changing separation values and service times for both traffic streams, the subsequent interaction of arrival and departure streams within and between them may change the airside flow characteristic strategically and tactically at a vertiport. This can lead to different PAX delays, which is depicted exemplarily in Figure 7 for both vertiport locations. Following the “ideal wind-dependent” scheduling approach, which assumes a perfect wind speed forecast for every flight, passengers using UAM services at EDDH experience a maximum of 02:14 min average PAX delay on arrivals (1 January 2019, see Figure 7a) and at EDDM, 02:16 min in 2012 (15 February 2012, see Figure 7b). Instead, passengers departing from EDDH experience 01:47 min of max delay and 02:05 min from EDDM.
Evaluating the VALoS performance objectives on an annual basis gives a global impression of the airside traffic flow performance of a single vertiport. It can be seen that both location- and season-related differences shape the individual performance outcome of each vertiport. Even though arrival punctuality, as well as PAX delay, reached an acceptable VALoS most of the time, they do only represent daily average values. This may change if we focus on a 24-h evaluation perspective, where we specifically investigate the processed airside traffic on a 15 min flow basis. To do so, we select a one-week scenario for both locations in which wind/gust values are changing throughout the day and week.
Starting with vertiport operations at EDDH, the week during 4–10 March 2019 was selected. A similar example at EDDM is provided in Appendix A Figure A1, representing a one-week scenario starting from 15–21 January 2012.
Figure 6a already reflects the intensity of changing wind/gust conditions during this period of 2019. Figure 8 provides an exemplary extract out of the 2019 VALoS dashboard for a vertiport operated at EDDH. In Figure 8a, it can be seen that only during March 6th, the daily wind conditions remained in the WO-category, resulting in a 24-h day of nominal separation. Six out of seven days resulted in flight cancellations with an extreme extent on the 4th, 8th, and 9th of March (206/170, 117/124, 147/155 cancelled arrivals/departures, respectively). Depending on when WS-categories occur, more flight requests need to be cancelled during traffic peak hours than during off-peak hours. Time windows in which the VALoS is depicted in darker green or red represent the situation in which time slots contain conducted and cancelled flights. Due to the fact that we evaluate a flow of 15 min propagating through the day in five minute increments, flow evaluations of two different wind categories can occur in one time interval. Both Figure 8a,b clearly show the impact of wind/gusts on the airside traffic flow and its performance compared to WO-days. During WO-days, only a single violation of the PAX delay occurred during noon hours. During the rest of the week, either high numbers of flights had to be cancelled or strategic and tactical operational procedures such as scheduling and ground movement were impacted negatively, causing a VALoS violation of the vertiport and PAX requirements. Due to the “ideal” scheduling approach and the structural harmonization of the FATO capacity, gate capacity, and demand, the airborne delay remained in acceptable boundaries for this week.
Zooming into day 4 (7 March 2019), Figure 9 breaks down the total flight delay for each arrival entity processed at the EDDH vertiport location. Total flight delay, which consists of scheduling, ground, and airborne delay, impacts all three VALoS stakeholders and is significantly responsible for the attained VALoS. Variations in ground delay occur in both directions due to the fact that gate and taxiway are allocated tactically after landing and boarding for both arrivals and departures, respectively. During strategic scheduling phases, only average taxiway times are considered. Due to the LIEDT layout, different taxiway lengths exist which either increase or decrease actual ground service times. Furthermore, ground delay can also occur when all gate parking positions are temporarily occupied or the departure pad is blocked by a previous flight. For this day, this was not the case for any arrival flight.
However, 49 departure flights had to wait for departure FATO clearance lasting up to 87 s of ground delay. Figure A2 displays the outcome for the departure traffic flow. It needs to be highlighted that the x-axis depicts each single flight entity; the same entity ID for an arrival and departure flight does not mean they are processed at the same time. The daily distribution of arrival and departure requests are displayed in Figure 1b.
Figure 9 also displays the operational impact of different wind conditions by showing several cancelled arrival entities and the additional occurring flight time during final approach (blue) relative to the nominal processing time in the WO-category. One extreme change in wind/gust strengths started at 09:20:00 (time interval including arrival entity 35) with a METAR report of 24 kts. For the subsequent five consecutive 30-min time windows, speed values of 14 kts, 15 kts, 17 kts, 45 kts, and 40 kts were reported. This does not only mean that flights are cancelled, but also separation values and landing times change drastically, leading to additional airborne delay. This occurred for arrival entity 35 to 43, displayed in Figure 9.
4.4. Wind Sensitivity Part II
As a second part of the wind sensitivity analysis, we evaluate two assumptions made in this manuscript: the selection of = 10 s and the “ideal wind-dependent” forecast for each flight. To do so, we will exemplarily focus on a potential vertiport located at EDDH in 2019. To evaluate the potential impact of changing separation deltas for higher wind speed categories on the overall VALoS performance, we first vary in five second increments starting from five seconds up to 20 s. Second, we change the scheduling approach from “ideal wind-dependent”, which presumes a perfect weather forecast for the actual operation time window for each flight, to a “wind-independent” scheduling approach. It schedules the flight per default under wind-operational constraints, which, therefore, does not consider any increased separation values from a strategic scheduling perspective. This may result in the need for additional tactical actions, including, in the worst case, requesting increased separation distances to a preceding flight during flight execution.
Starting with the variation of , we see in Figure 10 that with increasing separation delta between different wind categories, the resulting arrival punctuality decreases from a daily minimum of 99.3% to 94.4%, 89.7%, and 84.7% for a step-wise increase of , respectively. Due to the fact that landing slots are strategically adjusted and that operational processes take longer than during nominal conditions, the operational delay increases; therefore, the punctuality decreases. Strategically expanding flight slots also results in flights being delayed into ws-impacted time windows from a scheduling perspective. Subsequently, the amount of cancelled flights also increases from 3211 to 3249, 3279, and 3325 over the course of the increasing -variations, respectively. For the = 20 s scenario, this results theoretically into 11.7 days of cumulative annual operational shutdown with already 6.8 days of them appearing in the first quarter.
A decline in average passenger delay performance is also recorded, predominantly caused by the increase in individual airborne delay (see Figure A3). The maximum waiting time in air of 14:59 min was recorded two times in 2019 (8 January 2019 and 24 May 2019) for the 20-s scenario. In general, annual maximum average airborne delay differences of 00:17, 00:35, 00:59, and 01:27 min were calculated for each scenario respectively. Therefore, if strategic and tactical separation values increase, the VALoS performance parameters decrease. The available vertiport structural capacity is often “under-provided”, which causes extreme delays, especially inside and outside the terminal airspace of the vertiport, therefore, impacting airborne delay. Since dynamic increase of vertiport capacity according to Equation (1) is only possible to a certain extent (e.g., activating additional gates, or more difficult, adding another FATO to the operation), demand should be coordinated better tactically and incoming requests should be declined more often.
In addition to a sensitivity evaluation, we also investigated how incorporating wind forecasts into the planning phase may have an impact on the overall VALoS performance. We compared the generated airside traffic flow of a “wind-independent” and “wind-dependent” schedule for the nominal case of = 10 s.
Figure 11 shows that additional airborne delay was necessary in order to manage the same demand distribution at the same vertiport compared to Figure 9. Not accounting for wind-influenced operations already during planning phases requires much more tactical adjustments in comparison to wind-dependent scheduling. Focusing on the arrival stream during 7 March 2019, individual airborne eVTOL delay values increase up to a maximum of 03:59 min compared to 02:39 (+49.4%) for the wind-dependent scheduling approach used in Figure 9, whereas the maximum ground delay increased by 122.4% from 01:16 to 02:50 min, respectively. The daily mean eVTOL delay increased by 70.6% from 00:00:17 to 00:00:29. Significant changes of the departure stream have also been recorded and are displayed in Figure A4. Especially the individual ground delay experienced an increase, in contrast to the scheduling delay, which shows a significant decrease. Now, each capacity-related bottleneck is solved tactically, which caused a shift from strategic scheduling delay to tactical airborne delay. However, it needs to be highlighted that for both traffic streams, the overall passenger delay could be reduced. For the departure traffic stream, this resulted in a reduction of 22% for the arrival stream of 19.4%.
Evaluating the annual impact of both scheduling approaches on arrivals, the wind-independent approach resulted in 1869 arrival cancellations in the first quarter (−1% compared to the wind-dependent scheduling), 3213 arrival cancellations in total for 2019 (−1%), a minimum daily punctuality rating of 89.8% (−5%), and an average passenger delay of 00:57 min (steady).
5. Discussion and Conclusions
This study aims to assess the impact of wind/gust speeds on a vertiport’s airside traffic flow and to evaluate the resulting vertiport performance by analyzing ten years of METAR wind/gust data and subsequently selecting one representative year for each location as simulation input.
An aspect of the approach taken is the use of METAR wind/gust data for our analysis. Though METAR records provide wind/gust speed information at approximately 10 m above ground, they may only cover the first and last segments of the flight path at a vertiport, and are, therefore, not intended for detailed data analysis covering the entire UAM flight. The possible uncertainty of partially missing wind-speed data sets is negligible, as less than 1% of the values were missing for both locations for our chosen time period, 2011–2020. Furthermore, the analyses focus solely on the wind/gust-related availability of vertiports. Though wind conditions are undoubtedly a critical factor, other weather elements, such as heat/icing conditions, fog, and dangerous weather phenomena such as hail or thunderstorms, can also affect UAM operations. Ignoring the influence of these weather factors limits the holistic understanding of the operational challenges faced by vertiports. Future research should consider integrating other weather factors into the analysis, as well as extending the simulation range in order to provide a more comprehensive assessment of the operational resilience of vertiports under different weather conditions and annual weather outliers.
Using discrete event-based fast-time simulation techniques offers a comprehensive evaluation opportunity of the airside traffic flow under various wind/gust conditions. By simulating one day of traffic demand under the influence of a whole year of historical wind/gust data (2012-EDDM, 2019-EDDH), this study covers a wide range of wind conditions influenced by daily fluctuations, seasonal, and annual differences. This approach allows for a comparative analysis of performance indicators and offers insights into the VALoS and the resulting performance of the rated vertiport throughout a year of operation. However, it is important to note that the selected demand distribution and year, as well as the number and extent of wind categories and vertiport layout, are all contributing to the performance results. Changing those conditions might lead to different outcomes, which is the reason why there is no “one size and operation fits all” solution for vertiports.
The use of the VALoS concept as a performance metric for vertiport operations is a notable aspect of this study. By using aggregated individual airside flight delays, the VALoS concept provides a comprehensive assessment of performance indicators for stakeholders such as passengers, eVTOL aircraft operators, and vertiport operators. The distinction between acceptable and non-acceptable VALoS categories based on predefined thresholds allows the evaluation of airside traffic flow characteristics and the representation of wind-related influences on its performance. These insights can be used by vertiport planners and operators to evaluate the potential impact on vertiport site selection, business cases, and revenues. However, our primary focus is on VALoS performance metrics for vertiport operations, including vertiport usability and utilization. Though these metrics provide important insights into the operational performance, they do not directly address other critical factors such as safety, contingencies, or noise impact. The analysis should be complemented by additional studies that incorporate a broader range of considerations to ensure a comprehensive understanding of the implications.
Initial sensitivity analyses conducted in the study provide additional insight into the impact of varying wind category thresholds on the wind-related availability of vertiports. This study acknowledges the challenge of determining appropriate thresholds and uses different threshold values for sensitivity analysis. Lower wind thresholds result in an increased frequency of wind/gust conditions that exceed operational conditions. The selection of those thresholds can have a significant impact on the wind-impacted time windows and the resulting performance outcome. Moreover, the analysis does not consider other possibly important wind factors such as wind direction. Wind direction may play a crucial role in managing a heterogeneous (e)VTOL fleet, as it affects the approach and departure paths of (e)VTOLs. Further research and consultation with industry (e)VTOL experts is needed to establish standardized and practical thresholds and to derive safety requirements that can be universally applied once real-world operational limitations for (e)VTOL aircraft have been tested.
The second sensitivity analyses performed on the separation values and on the “ideal wind-dependent” scheduling approach used aims to explore the impact of wind/gusts on traffic flow characteristics and the resulting performance of the vertiport. Varying values result in higher scheduling and operational delays and, therefore, lower punctuality performance compared to wind-operational conditions. According to the most conservative scenario of = 20 s, a vertiport located at Hamburg airport would have to expect 11.7 days of cumulative annual downtime. Future separation distances between (e)VTOL aircraft may vary depending on aircraft type, traffic density, vertiport location, and other weather conditions. Therefore, the results of the sensitivity analysis should be considered as a starting point for further investigation and refinement, rather than as definitive guidelines for establishing separation distances for all operational scenarios.
Furthermore, the sensitivity analysis compares two different scheduling approaches: “ideal wind-dependent” and “wind-independent”. Though the “wind-independent” approach shows significant improvements in overall passenger delay over the “wind-dependent” approach, the vertiport’s capacity, and, therefore, its utilization, was not ideally distributed. To account for additional waiting time to enter the terminal airspace of the vertiport, for the arrival stream, additional airborne waiting periods were required tactically. For departures, the “wind-independent” scheduling approach resulted in reduced scheduling delays, but increased FATO and gate blocking times, resulting in increased ground delays. Throughout the year, there was no significant difference in the resulting VALoS performance between the two scheduling approaches, but this can vary significantly between days, seasons, and chosen demand distributions.
In conclusion, the approach of analyzing METAR wind/gust data, conducting vertiport airside traffic simulations, and evaluating its performance using the VALoS concept provides valuable insights into the impact of wind/gust conditions on vertiport operations and its service availability. The results of this study highlight the importance of considering wind-dependent operational concepts and a careful selection of wind category thresholds to ensure safe and efficient UAM operations. The VALoS concept provides a comprehensive framework for evaluating performance indicators, supporting stakeholders to make informed decisions about vertiport traffic flow characteristics and performances, and vertiport planners to select the most wind-favourable/profitable location. Both locations experience performance decrease in the first quarter of the respective year containing over 50% of the annual cancellations. Exceeding wind-operational conditions occurred especially during noon and early afternoon hours. Therefore, for each specific location, the daily accepted schedule should be planned based on both long-term wind history and actual wind forecasts. It can also be considered to limit the demand during frequently high wind-impacted hours and months as early as the planning stage, in order to add additional buffers.
Future research should extend the analysis of the impact on airside traffic flows at vertiports to other weather parameters. For example, temperature and icing are critical weather parameters that have a significant impact on battery performance and passenger comfort, and, thus, overall safety. Even though this paper focuses on a single vertiport, UAM requires a network to operate. En-route weather changes causing in-flight delays will require tactical sequencing adjustments that may impact airside traffic flows at the destination vertiport. In addition, VALoS performance targets can be adjusted for each vertiport within the network to meet local stakeholder requirements. Once eVTOL flight test data and certification specifications are publicly available, we are able to update our assumptions about eVTOL performance capabilities and initiate a next iteration of vertiport airside performance analysis. To account for changes in long-term averages of weather patterns (climate), we recommend stimulating +30 years of wind/weather data. Since we are addressing a vertiport operation at airports, UAM operations will also fly in controlled airspace; thus, a holistic evaluation of the air traffic management interfaces and processes is required in the future.
Author Contributions
Conceptualization, K.S., R.S. and F.K.; methodology, K.S. and F.K.; software, K.S. and R.S. (Section 3.3, Section 4.1 and Section 4.2); validation, K.S.; formal analysis, K.S. and R.S.; investigation, K.S. and R.S.; data curation, K.S. and R.S.; writing—original draft preparation, K.S. and R.S. (Section 3.3, Section 4.1 and Section 4.2); writing—review and editing, K.S., R.S. and F.K.; visualization, K.S. and R.S. (Section 3.3, Section 4.1 and Section 4.2); supervision, K.S.; project administration, K.S. All authors have read and agreed to the published version of the manuscript.
Funding
This research received no external funding.
Data Availability Statement
Not Applicable.
Acknowledgments
We would like to thank Sina Leib for her assistance in initiating the analysis and Annette Temme for her insightful feedback and suggestions, which played a crucial role in improving the quality and clarity of this manuscript. This work was conducted under the cooperation agreement between DLR and Bauhaus Luftfahrt e.V. and contributes to the DLR projects HorizonUAM and THOR.
Conflicts of Interest
The authors declare no conflict of interest.
Abbreviations
The following abbreviations are used in this manuscript:
| Arr | Arrival |
| ConOps | Concept of Operations |
| CS | Certification Specification |
| Dep | Departure |
| DES | Discrete Event-based |
| EASA | European Union Aviation Safety Agency |
| EDDH | Hamburg Airport |
| EDDM | Munich Airport |
| EDDS | Stuttgart Airport |
| eVTOL | Electrical Vertical Take-off and Landing |
| FAA | Federal Aviation Administration |
| FAR | FAA Regulation |
| FATO | Final Approach and Take-off Area |
| G | Gust Speed |
| hr | Hour |
| ICAO | International Civil Aviation Authority |
| IFR | Instrument Flight Rules |
| IS | Impact Score |
| ISA | ICAO Standard Atmosphere |
| LIEDT | Linear Independent Expandable Drive-Through |
| METAR | Meteorological Aviation Routine Weather Report |
| MOC | Means of Compliance |
| MSL | Mean Sea Level |
| NASA | National Aeronautics and Space Administration |
| SC | Special Condition |
| ST | Separation Time |
| sUAS | Small Unmanned Aircraft System |
| TAF | Terminal Aerodrome Forecast |
| U.S. | United States of America |
| UAM | Urban Air Mobility |
| UAS | Unmanned Aircraft System |
| UTM | Unmanned Aircraft System Traffic Management |
| VALoS | Vertidrome Airside Level of Service |
| VFR | Visual Flight Rules |
| VMC | Visual Meteorological Conditions |
| VTOL | Vertical Take-off and Landing |
| W | Wind Speed |
| WA | Wind Advisory |
| WO | Wind Operational |
| WS | Wind Shutdown |
| WW | Wind Warning |
Appendix A
Figure A1.
Weekly/24-h distribution of the VALoS dashboard for arrival and departure airside traffic streams at a vertiport located at EDDM for a one-week scenario starting from January 15th to 21st, 2012. The stakeholders vertiport operator (“Punctuality”), eVTOL operator (“eVTOL”), and passenger (“PAX”) are depicted with their assigned performance metric punctuality, delay, and average delay, respectively. Occurring wind categories are depicted in percent for each day at the bottom left. Color code: green = VALoS acceptable, red = VALoS non-acceptable, gray = cancelled flights, dark green and red = time windows with processed flights and cancelled requests. Date format: dd/mm/yyyy. (a) Weekly/24 h arrival VALoS dashboard. (b) Weekly/24 h departure VALoS dashboard.

Figure A2.
24-h distribution of the total departure delay per flight composed of airborne, ground, and scheduling delay for a potential vertiport operation at EDDH during 7 March 2019.
Figure A2.
24-h distribution of the total departure delay per flight composed of airborne, ground, and scheduling delay for a potential vertiport operation at EDDH during 7 March 2019.

Figure A3.
Arrival sensitivity analyses of the daily average PAX delay (top) and maximum eVTOL airborne delay per flight (bottom) due to changing under same environmental (wind), structural (vertiport layout and ConOps), and demand constraints for a vertiport location at EDDH during 2019.
Figure A3.
Arrival sensitivity analyses of the daily average PAX delay (top) and maximum eVTOL airborne delay per flight (bottom) due to changing under same environmental (wind), structural (vertiport layout and ConOps), and demand constraints for a vertiport location at EDDH during 2019.

Figure A4.
Sensitivity analysis of the 24-h distribution of the total departure delay by switching to “wind-independent scheduling” under the same environmental (wind), structural (vertiport layout and ConOps), and demand constraints for a potential vertiport location at EDDH on 7 March 2019.
Figure A4.
Sensitivity analysis of the 24-h distribution of the total departure delay by switching to “wind-independent scheduling” under the same environmental (wind), structural (vertiport layout and ConOps), and demand constraints for a potential vertiport location at EDDH on 7 March 2019.

References
- Federal Aviation Administration (FAA). Weather-Related Aviation Accident Study 2003–2007. Available online: https://www.asias.faa.gov/i/studies/2003-2007weatherrelatedaviationaccidentstudy.pdf (accessed on 9 April 2023).
- Long, T. Analysis of Weather-Related Accident and Incident Data Associated with Section 14 CFR Part 91 Operations. Coll. Aviat. Rev. Int. 2022, 40, 15. [Google Scholar]
- Schweiger, K.; Knabe, F.; Korn, B. An exemplary definition of a vertidrome’s airside concept of operations. Aerosp. Sci. Technol. 2021, 125, 107144. [Google Scholar] [CrossRef]
- Schweiger, K.; Knabe, F.; Korn, B. Urban Air Mobility: Vertidrome Airside Level of Service Concept. In Proceedings of the AIAA Aviation 2021 Forum, Virtual Event, 2–6 August 2021. [Google Scholar] [CrossRef]
- Clay, B.; Baumgaertner, P.; Thompson, P.; Meyer, S.; Reber, R.; Berry, D. Civil Tiltrotor Missions and Applications: A Research Study. Available online: https://ntrs.nasa.gov/search.jsp?R=19910004111 (accessed on 4 May 2020).
- Gilbert, G.A.; Freund, D.J.; Winick, R.M.; Cararelli, N.J.; Hodgkins, R.F.; Vickers, T.K. Community Rotorcraft Air Transportation Benefits and Opportunities. Available online: https://ntrs.nasa.gov/api/citations/19820008135/downloads/19820008135.pdf (accessed on 4 April 2023).
- Peisen, D.J. Analysis of Vertiport Studies Funded by the Airport Improvement Program (AIP). Available online: https://apps.dtic.mil/sti/pdfs/ADA283249.pdf (accessed on 5 April 2023).
- Peisen, D.; Sawer, B. Heliport/Vertiport MLS Precision Approaches. Available online: https://apps.dtic.mil/sti/pdfs/ADA283505.pdf (accessed on 20 November 2020).
- McKinley, J. Evaluating Wind Flow Around Buildings on Heliport Placement. Available online: https://apps.dtic.mil/dtic/tr/fulltext/u2/a153512.pdf (accessed on 19 January 2021).
- Stathopoulos, T.; Storms, R. Wind environmental conditions in passages between buildings. J. Wind. Eng. Ind. Aerodyn. 1986, 24, 19–31. [Google Scholar] [CrossRef]
- Peterka, J.; Meroney, R.; Kothari, K. Wind flow patterns about buildings. J. Wind. Eng. Ind. Aerodyn. 1985, 21, 21–38. [Google Scholar] [CrossRef]
- Sawer, B.; Peisen, D.J. VFR Heliport Obstacle-Rich Environments: Test and Evaluation. Available online: https://apps.dtic.mil/sti/pdfs/ADA573708.pdf (accessed on 30 May 2023).
- Thompson, P.; Neir, R.; Reber, R.; Scholes, R.; Alexander, H.; Sweet, D.; Berry, D. Civil Tiltrotor Missions and Applications Phase II: The Commercial Passenger Market. Available online: https://ntrs.nasa.gov/search.jsp?R=19910016812 (accessed on 5 May 2020).
- Federal Aviation Administration (FAA). Advisory Circular 150/5390-3-Vertiport Design (Cancelled). Available online: https://www.faa.gov/regulations_policies/advisory_circulars/index.cfm/go/document.information/documentID/23096 (accessed on 26 May 2023).
- Uber Elevate. Fast-Forwarding to a Future of On-Demand Urban Air Transportation. Available online: https://evtol.news/__media/PDFs/UberElevateWhitePaperOct2016.pdf (accessed on 5 April 2023).
- European Union Aviation Safety Agency (EASA). Special Condition Vertical Take-Off and Landing (VTOL) Aircraft. Available online: https://www.easa.europa.eu/sites/default/files/dfu/SC-VTOL-01.pdf (accessed on 20 September 2021).
- European Union Aviation Safety Agency (EASA). Second Publication of Means of Compliance with the Special Condition VTOL Issue 2. Available online: https://www.easa.europa.eu/en/downloads/136697/en (accessed on 6 April 2023).
- European Union Aviation Safety Agency (EASA). Second Publication of Proposed Means of Compliance with the Special Condition VTOL Issue 1. Available online: https://www.easa.europa.eu/downloads/128938/en (accessed on 8 December 2021).
- European Union Aviation Safety Agency (EASA). Vertiports Prototype Technical Specifications for the Design of VFR Vertiports for Operation with Manned VTOL-Capable Aircraft Certified in the Enhanced Category (PTS-VPT-DSN). Available online: https://www.easa.europa.eu/downloads/136259/en (accessed on 27 March 2022).
- Ranquist, E.; Steiner, M.; Argrow, B. Exploring the range of weather impacts on UAS operations. In Proceedings of the 18th Conference on Aviation, Range, and Aerospace Meteorology, Seattle, WA, USA, 22–26 January 2017; Available online: https://ams.confex.com/ams/97Annual/webprogram/Manuscript/Paper309274/J3_1_Exploring_Range_of_Weather_Ranquist.pdf (accessed on 30 May 2023).
- U.S. Department of Commerce, NOAA. Beaufort Wind Scale. Available online: https://www.weather.gov/mfl/beaufort (accessed on 9 April 2023).
- Ploetner, K.O.; Al Haddad, C.; Antoniou, C.; Frank, F.; Fu, M.; Kabel, S.; Llorca, C.; Moeckel, R.; Moreno, A.T.; Pukhova, A.; et al. Long-term application potential of urban air mobility complementing public transport: An upper Bavaria example. CEAS Aeronaut. J. 2020, 11, 991–1007. [Google Scholar] [CrossRef] [PubMed]
- Patterson, M.D.; Antcliff, K.R.; Kohlman, L.W. A Proposed Approach to Studying Urban Air Mobility Missions Including an Initial Exploration of Mission Requirements. In Proceedings of the AHS International 74th Annual Forum and Technology Display, Phoenix, AZ, USA, 14–17 May 2018; p. 19. [Google Scholar]
- Zelinski, S. Operational Analysis of Vertiport Surface Topology. In Proceedings of the 2020 AIAA/IEEE 39th Digital Avionics Systems Conference (DASC), San Antonio, TX, USA, 11–15 October 2020; p. 10. [Google Scholar] [CrossRef]
- Reiche, C.; Cohen, A.P.; Fernando, C. An Initial Assessment of the Potential Weather Barriers of Urban Air Mobility. IEEE Trans. Intell. Transp. Syst. 2021, 22, 6018–6027. [Google Scholar] [CrossRef]
- Reiche, C.; Brody, F.; McGillen, C.; Siegel, J.; Cohen, A. An Assessment of the Potential Weather Barriers of Urban Air Mobility (UAM); Transportation Sustainability Research Center: Berkeley, CA, USA, 2018. [Google Scholar] [CrossRef]
- Ng, H.K. Collaborative Weather Research and Development for Urban Air Mobility. Available online: https://ntrs.nasa.gov/api/citations/20220005500/downloads/20220005500_HokKNg_FPAW2022_presentation_final.pdf (accessed on 9 April 2023).
- Lundby, T.; Christiansen, M.P.; Jensen, K. Towards a Weather Analysis Software Framework to Improve UAS Operational Safety. In Proceedings of the 2019 International Conference on Unmanned Aircraft Systems (ICUAS), Atlanta, GA, USA, 11–14 June 2019; pp. 1372–1380. [Google Scholar] [CrossRef]
- Unisphere GmbH. Global Report on UAM Service Availability. Available online: https://www.unisphere.de/_files/ugd/0bc3ff_b1f61ebc9eb84e71b7d2833ef90af1cd.pdf (accessed on 9 May 2023).
- Unisphere GmbH. Global Icing Report for Air Taxi Services. Available online: https://www.unisphere.de/operational-analytics (accessed on 9 May 2023).
- Schweiger, K.; Preis, L. Urban Air Mobility: Systematic Review of Scientific Publications and Regulations for Vertiport Design and Operations. Drones 2022, 6, 179. [Google Scholar] [CrossRef]
- Berchoff, D. Weather-Resilient AAM Operations in Urban Environments. Available online: https://vtol.org/files/dmfile/20200422---don-berchoff---truweather---weather-solutions.pdf (accessed on 9 September 2021).
- Adkins, K.A.; Akbas, M.; Compere, M. Real-Time Urban Weather Observations for Urban Air Mobility. Int. J. Aviat. Aeronaut. Aerosp. 2020, 7, 28. [Google Scholar] [CrossRef]
- Steiner, M. Urban Air Mobility: Opportunities for the Weather Community. Bull. Am. Meteorol. Soc. 2019, 100, 2131–2133. [Google Scholar] [CrossRef]
- European Union Aviation Safety Agency (EASA). Easy Access Rules for Large Aeroplanes (CS-25). Available online: https://www.easa.europa.eu/en/document-library/easy-access-rules/easy-access-rules-large-aeroplanes-cs-25 (accessed on 8 May 2023).
- Federal Aviation Administration (FAA). 14 CFR Part 25—Airworthiness Standards: Transport Category Airplanes. Available online: https://www.ecfr.gov/current/title-14/chapter-I/subchapter-C/part-25 (accessed on 8 May 2023).
- Dlugosch, S.J. Performance Based Navigation Concept for Vertiports. Master’s Thesis, FH Aachen, Aachen, Germany, 2022. [Google Scholar]
- Ahrenhold, N.; Pohling, O.; Schier-Morgenthal, S. Impact of Air Taxis on Air Traffic in the Vicinity of Airports. Infrastructures 2021, 6, 140. [Google Scholar] [CrossRef]
- Kallies, C.; Schweiger, K.; Karásek, R.; Morscheck, F.; Lambers, D. Development and Evaluation of a U-space Route Structure for the City of Frankfurt Connecting Airport and Trade Fair Via Fast-Time Simulation. In Proceedings of the 2023 Integrated Communication, Navigation and Surveillance Conference (ICNS), Herndon, VA, USA, 18–20 April 2023; pp. 1–8. [Google Scholar] [CrossRef]
- Feldhoff, E.; Soares Roque, G. Determining infrastructure requirements for an air taxi service at Cologne Bonn Airport. CEAS Aeronaut. J. 2021, 12, 821–833. [Google Scholar] [CrossRef] [PubMed]
- Deutscher Wetterdienst (DWD). Wetter und Klima-Deutscher Wetterdienst-Glossar-F-Föhn. Available online: https://www.dwd.de/DE/service/lexikon/Functions/glossar.html?lv2=100784&lv3=100882 (accessed on 16 April 2023).
- ARD Alpha. Föhn und Wetterfühligkeit: Wie der Warme Fallwind Entsteht und Was er Bewirkt. Available online: https://www.ardalpha.de/wissen/umwelt/klima/meteorologie-wetter-foehn-wind-100.html (accessed on 16 April 2023).
- Weather Spark. Climate and Average Weather Year Round in Hamburg. Available online: https://weatherspark.com/y/68301/Average-Weather-in-Hamburg-Germany-Year-Round, (accessed on 16 April 2023).
- Meteoblue. Simulated historical climate & weather data for Hamburg. Available online: https://www.meteoblue.com/en/weather/historyclimate/climatemodelled/hamburg_germany_2911298, (accessed on 16 April 2023).
- International Civil Aviation Organization (ICAO). Airport Planning Manual—Part I—Master Planning (Doc 9184-AN/902), 2nd ed.; International Civil Aviation Organization (ICAO): Montreal, QC, Canada, 1987. [Google Scholar]
- Mohamed, A.; Marino, M.; Watkins, S.; Jaworski, J.; Jones, A. Gusts Encountered by Flying Vehicles in Proximity to Buildings. Drones 2022, 7, 22. [Google Scholar] [CrossRef]
- Federal Aviation Administration (FAA). Aviation Weather Services. Available online: https://www.faa.gov/documentlibrary/media/advisory_circular/ac_00-45h.pdf (accessed on 21 April 2023).
- Schultz, M.; Lorenz, S.; Schmitz, R.; Delgado, L. Weather Impact on Airport Performance. Aerospace 2018, 5, 109. [Google Scholar] [CrossRef] [Green Version]
- International Civil Aviation Organization (ICAO). Aerodrome Design Manual—Runways (Doc 9157—Part 1), 4th ed.; International Civil Aviation Organization (ICAO): Montreal, QC, Canada, 2020. [Google Scholar]
- Adam, W.; Jellinghaus, K. Wettermeldungen für die Luftfahrt Handbuch Flugwetterdienste Band Obs Version 4.0. Available online: https://www.dwd.de/DE/leistungen/lf_11_flugwetterbetriebsdienste/handbuch_flugwetterdienst_obs_4.0.pdf;jsessionid=25AC83DA0F127E88EB68DB9CA71124FC.live31082?__blob=publicationFile&v=2 (accessed on 21 April 2023).
- Deutscher Wetterdienst (DWD). METAR/TREND/TAF Meteorological Reports and Forecasts for Aviation. Available online: https://www.dwd.de/SharedDocs/broschueren/EN/luftfahrt/metar_taf.pdf?__blob=publicationFile&v=1 (accessed on 21 April 2023).
- Schweiger, K. Vertidrome Airside Level of Service: Impact of Stochastic Deviations and Short-Term Disruptions on Vertiport Operations. In Proceedings of the Deutscher Luft-und Raumfahrt Kongress DLRK 2022, Dresden, Germany, 27–29 September 2022. [Google Scholar]
Figure 1.
Selected vertiport layout and UAM demand. (a) 3D concept: Vertiport LIEDT layout with 180° omnidirectional obstacle free volume for each FATO with variable gate parking positions (not true to scale) [3]. (b) Demand distribution representing the forecast for Munich East Train Station published by [22] but used exemplarily for both vertiport locations at EDDH and EDDM.

Figure 2.
Wind/gust speed statistics related to wind categories (decade 2011–2020). (a) Frequency of different wind conditions displayed in % for EDDS (Reference), EDDM, and EDDH. (b) Selection of a representative year regarding wind/gust activities at EDDH (2019) and EDDM (2012).
Figure 2.
Wind/gust speed statistics related to wind categories (decade 2011–2020). (a) Frequency of different wind conditions displayed in % for EDDS (Reference), EDDM, and EDDH. (b) Selection of a representative year regarding wind/gust activities at EDDH (2019) and EDDM (2012).

Figure 3.
Seasonal wind/gust speed statistic (decade 2011–2020). (a) Cumulative probabilities for the occurrence of wind/gust speed values at EDDM and EDDH. (b) Influence of gusts on wind conditions in winter/summer seasons at EDDS (Reference), EDDM, EDDH.
Figure 3.
Seasonal wind/gust speed statistic (decade 2011–2020). (a) Cumulative probabilities for the occurrence of wind/gust speed values at EDDM and EDDH. (b) Influence of gusts on wind conditions in winter/summer seasons at EDDS (Reference), EDDM, EDDH.

Figure 4.
Frequency of critical wind/gust speed strengths throughout the day at EDDS (Reference), EDDM, EDDH (decade 2011–2020).
Figure 4.
Frequency of critical wind/gust speed strengths throughout the day at EDDS (Reference), EDDM, EDDH (decade 2011–2020).

Figure 5.
Wind Sensitivity Part I for EDDM and EDDH (decade 2011–2020). (a) Variation of lower and upper range limits: frequencies of wind/gust-categories. (b) Annual variability of WO-exceeding conditions (blue) under varying upper WO-thresholds.
Figure 5.
Wind Sensitivity Part I for EDDM and EDDH (decade 2011–2020). (a) Variation of lower and upper range limits: frequencies of wind/gust-categories. (b) Annual variability of WO-exceeding conditions (blue) under varying upper WO-thresholds.

Figure 6.
365-day distribution of introduced wind categories for vertiport locations at EDDH and EDDM. Related to it, number of cancelled arrival flights and the annual development of the VALoS performance indicator “arrival punctuality” for the stakeholder vertiport operator. (a) 2019: vertiport located at EDDH. (b) 2012: vertiport located at EDDM.

Figure 7.
365-day distribution of the daily average VALoS PAX delay for the arrival traffic stream at a vertiport location at EDDH and EDDM. Top dashed line at 02:00 min represents the VALoS PAX performance target. The bottom dashed line at 00:55 min represents the average arrival PAX delay for a WO-day. (a) 2019: vertiport located at EDDH. (b) 2012: vertiport located at EDDM.

Figure 8.
Weekly/24-h distribution of the VALoS dashboard for arrival and departure airside traffic streams at a vertiport located at EDDH for a one-week scenario starting from 4–10 March 2019. The stakeholders vertiport operator (“Punctuality”), eVTOL operator (“eVTOL”), and passenger (“PAX”) are depicted with their assigned performance metric punctuality, delay, and average delay, respectively. Occurring wind categories are depicted in percent for each day at the bottom left. Color code: green = VALoS acceptable, red = VALoS non-acceptable, gray = cancelled flights, dark green/dark red = time windows with processed flights/cancelled requests. Date format: dd/mm/yyyy. (a) Weekly/24-h arrival VALoS dashboard. (b) Weekly/24-h departure VALoS dashboard.

Figure 9.
24-h distribution of the total arrival delay per flight composed of airborne, ground, and scheduling delay for a potential vertiport operation at EDDH during 7 March 2019.
Figure 9.
24-h distribution of the total arrival delay per flight composed of airborne, ground, and scheduling delay for a potential vertiport operation at EDDH during 7 March 2019.

Figure 10.
Sensitivity analysis of 365-day distribution of introduced wind categories, number of cancelled arrival flights, and annual development of the VALoS performance indicator “arrival punctuality” for the stakeholder vertiport operator due to changing , but under same environmental (wind/gust), structural (vertiport layout and ConOps), and demand constraints for a potential vertiport location at EDDH during 2019.

Figure 11.
Sensitivity analysis of the 24-h distribution of the total arrival delay by switching to “wind-independent” scheduling under the same environmental (wind), structural (vertiport layout and ConOps), and demand constraints for a potential vertiport location at EDDH on 7 March 2019.
Figure 11.
Sensitivity analysis of the 24-h distribution of the total arrival delay by switching to “wind-independent” scheduling under the same environmental (wind), structural (vertiport layout and ConOps), and demand constraints for a potential vertiport location at EDDH on 7 March 2019.


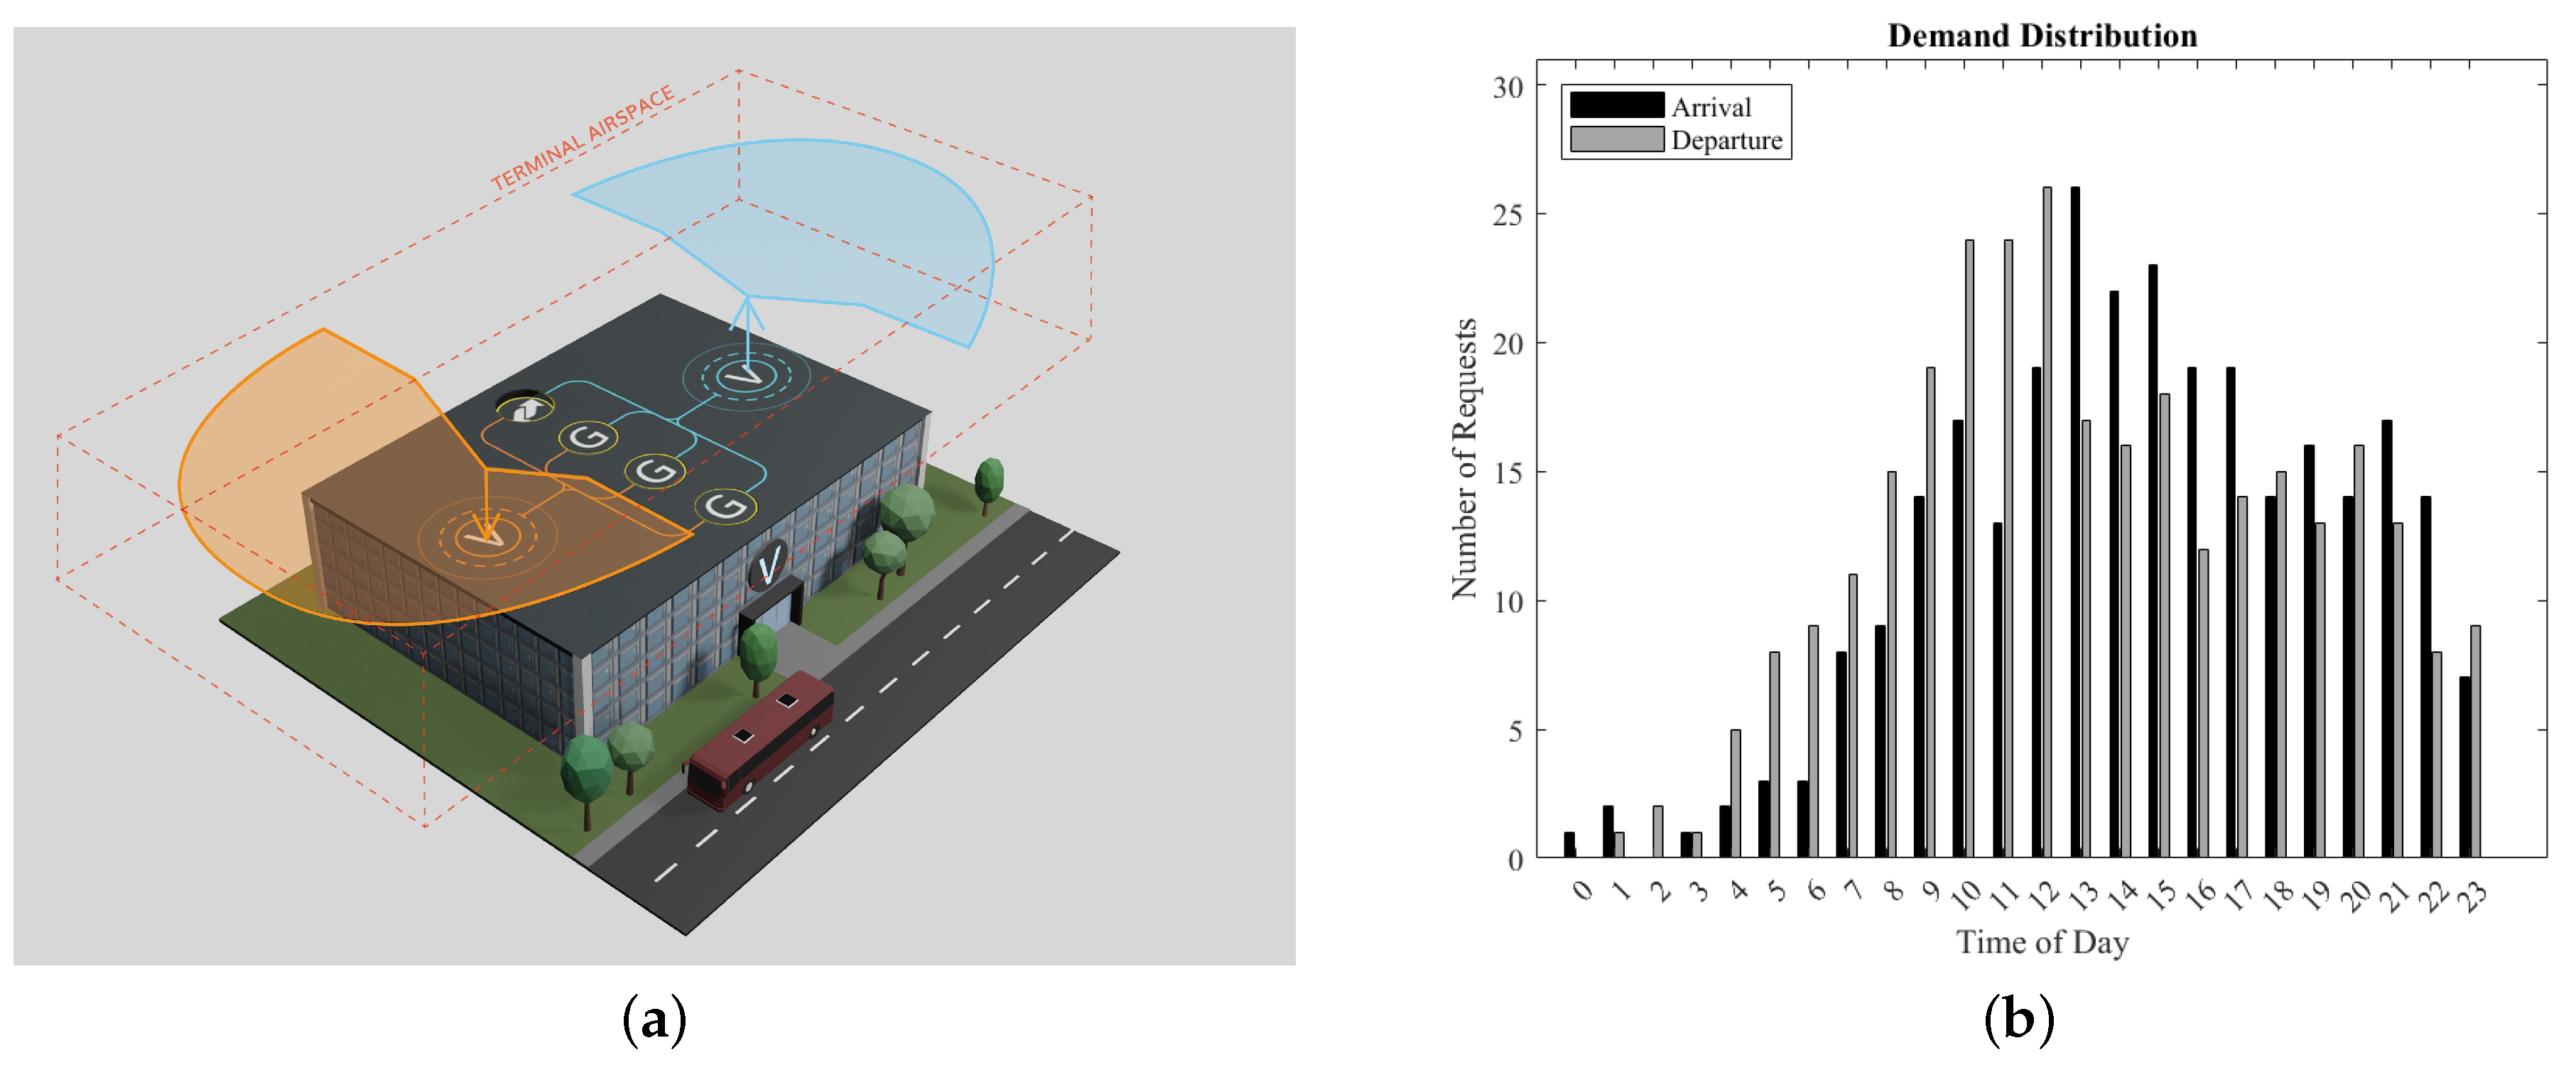
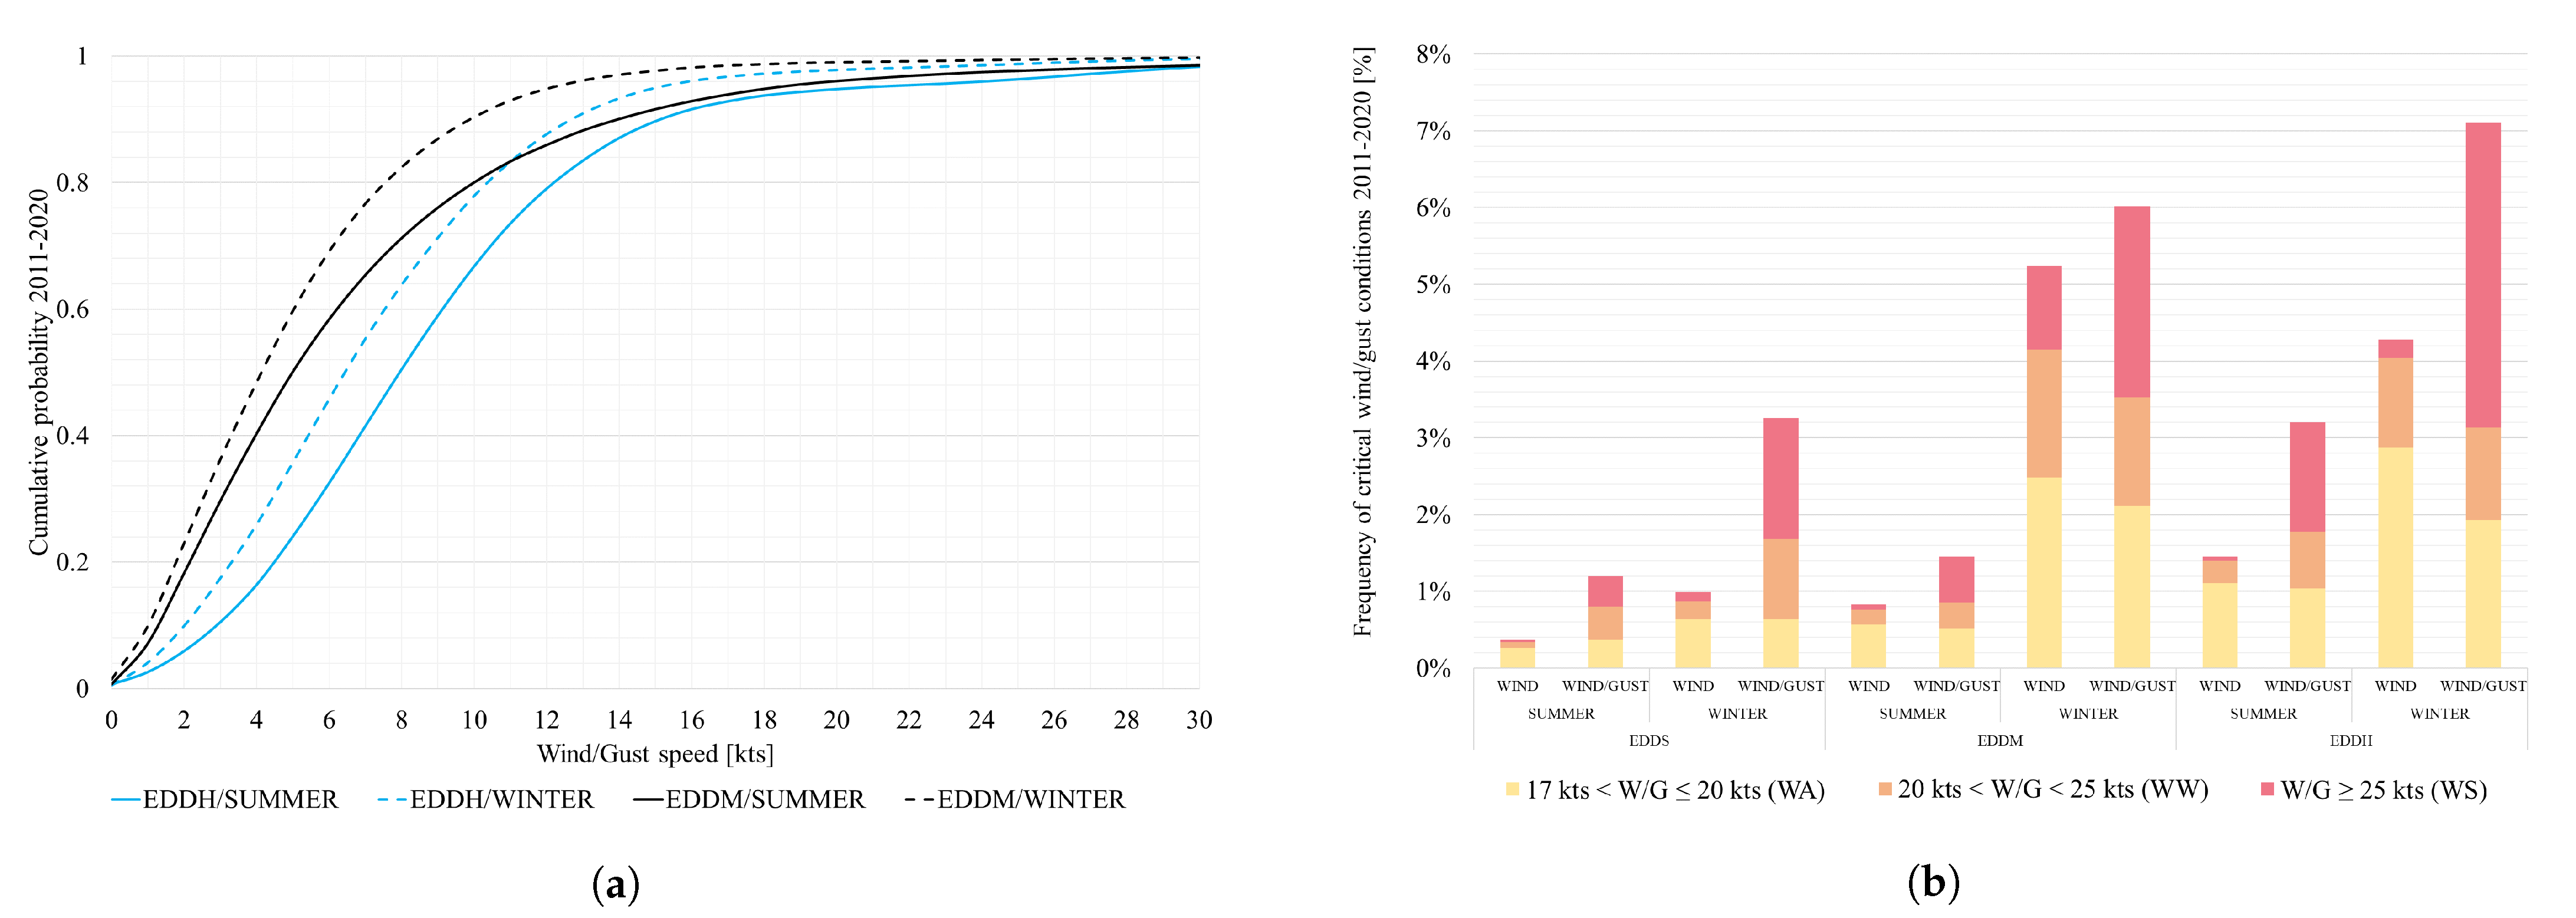
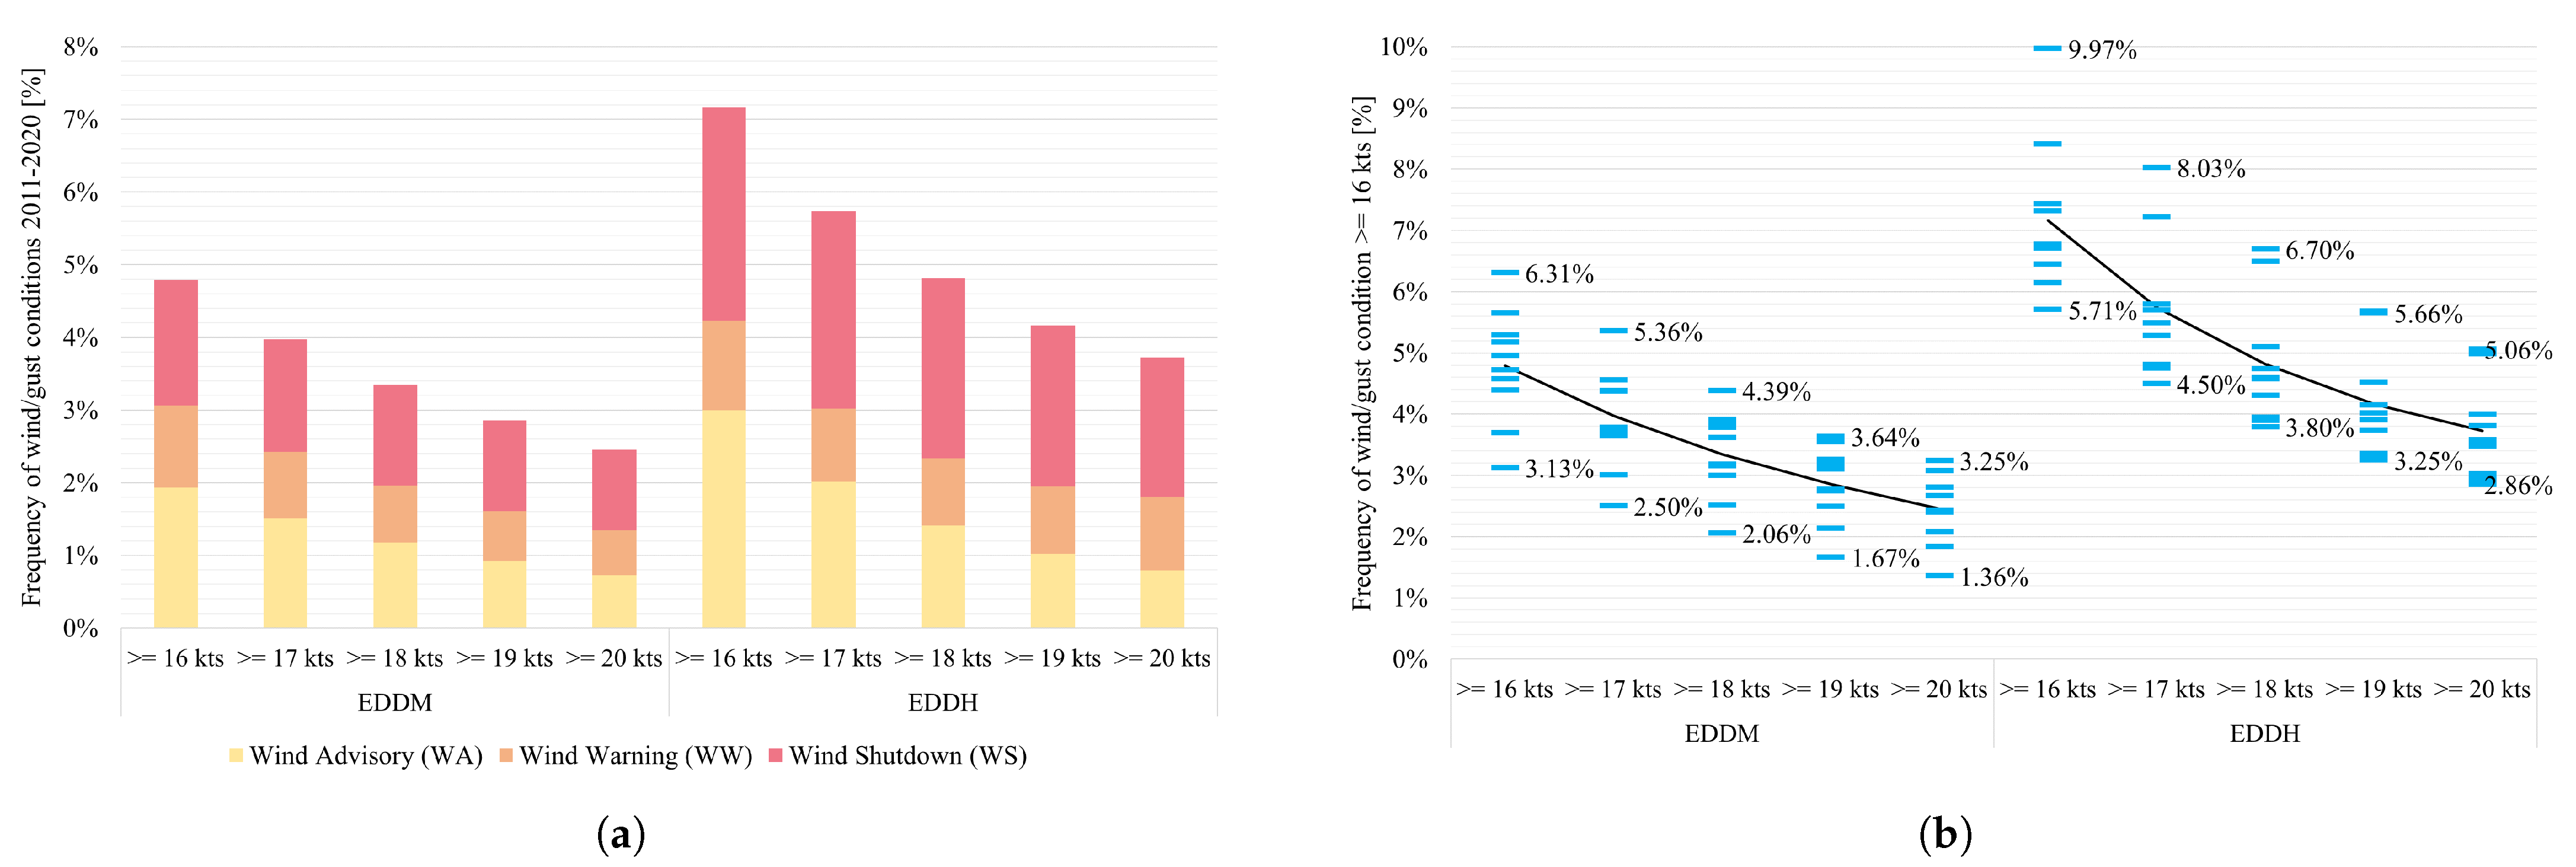
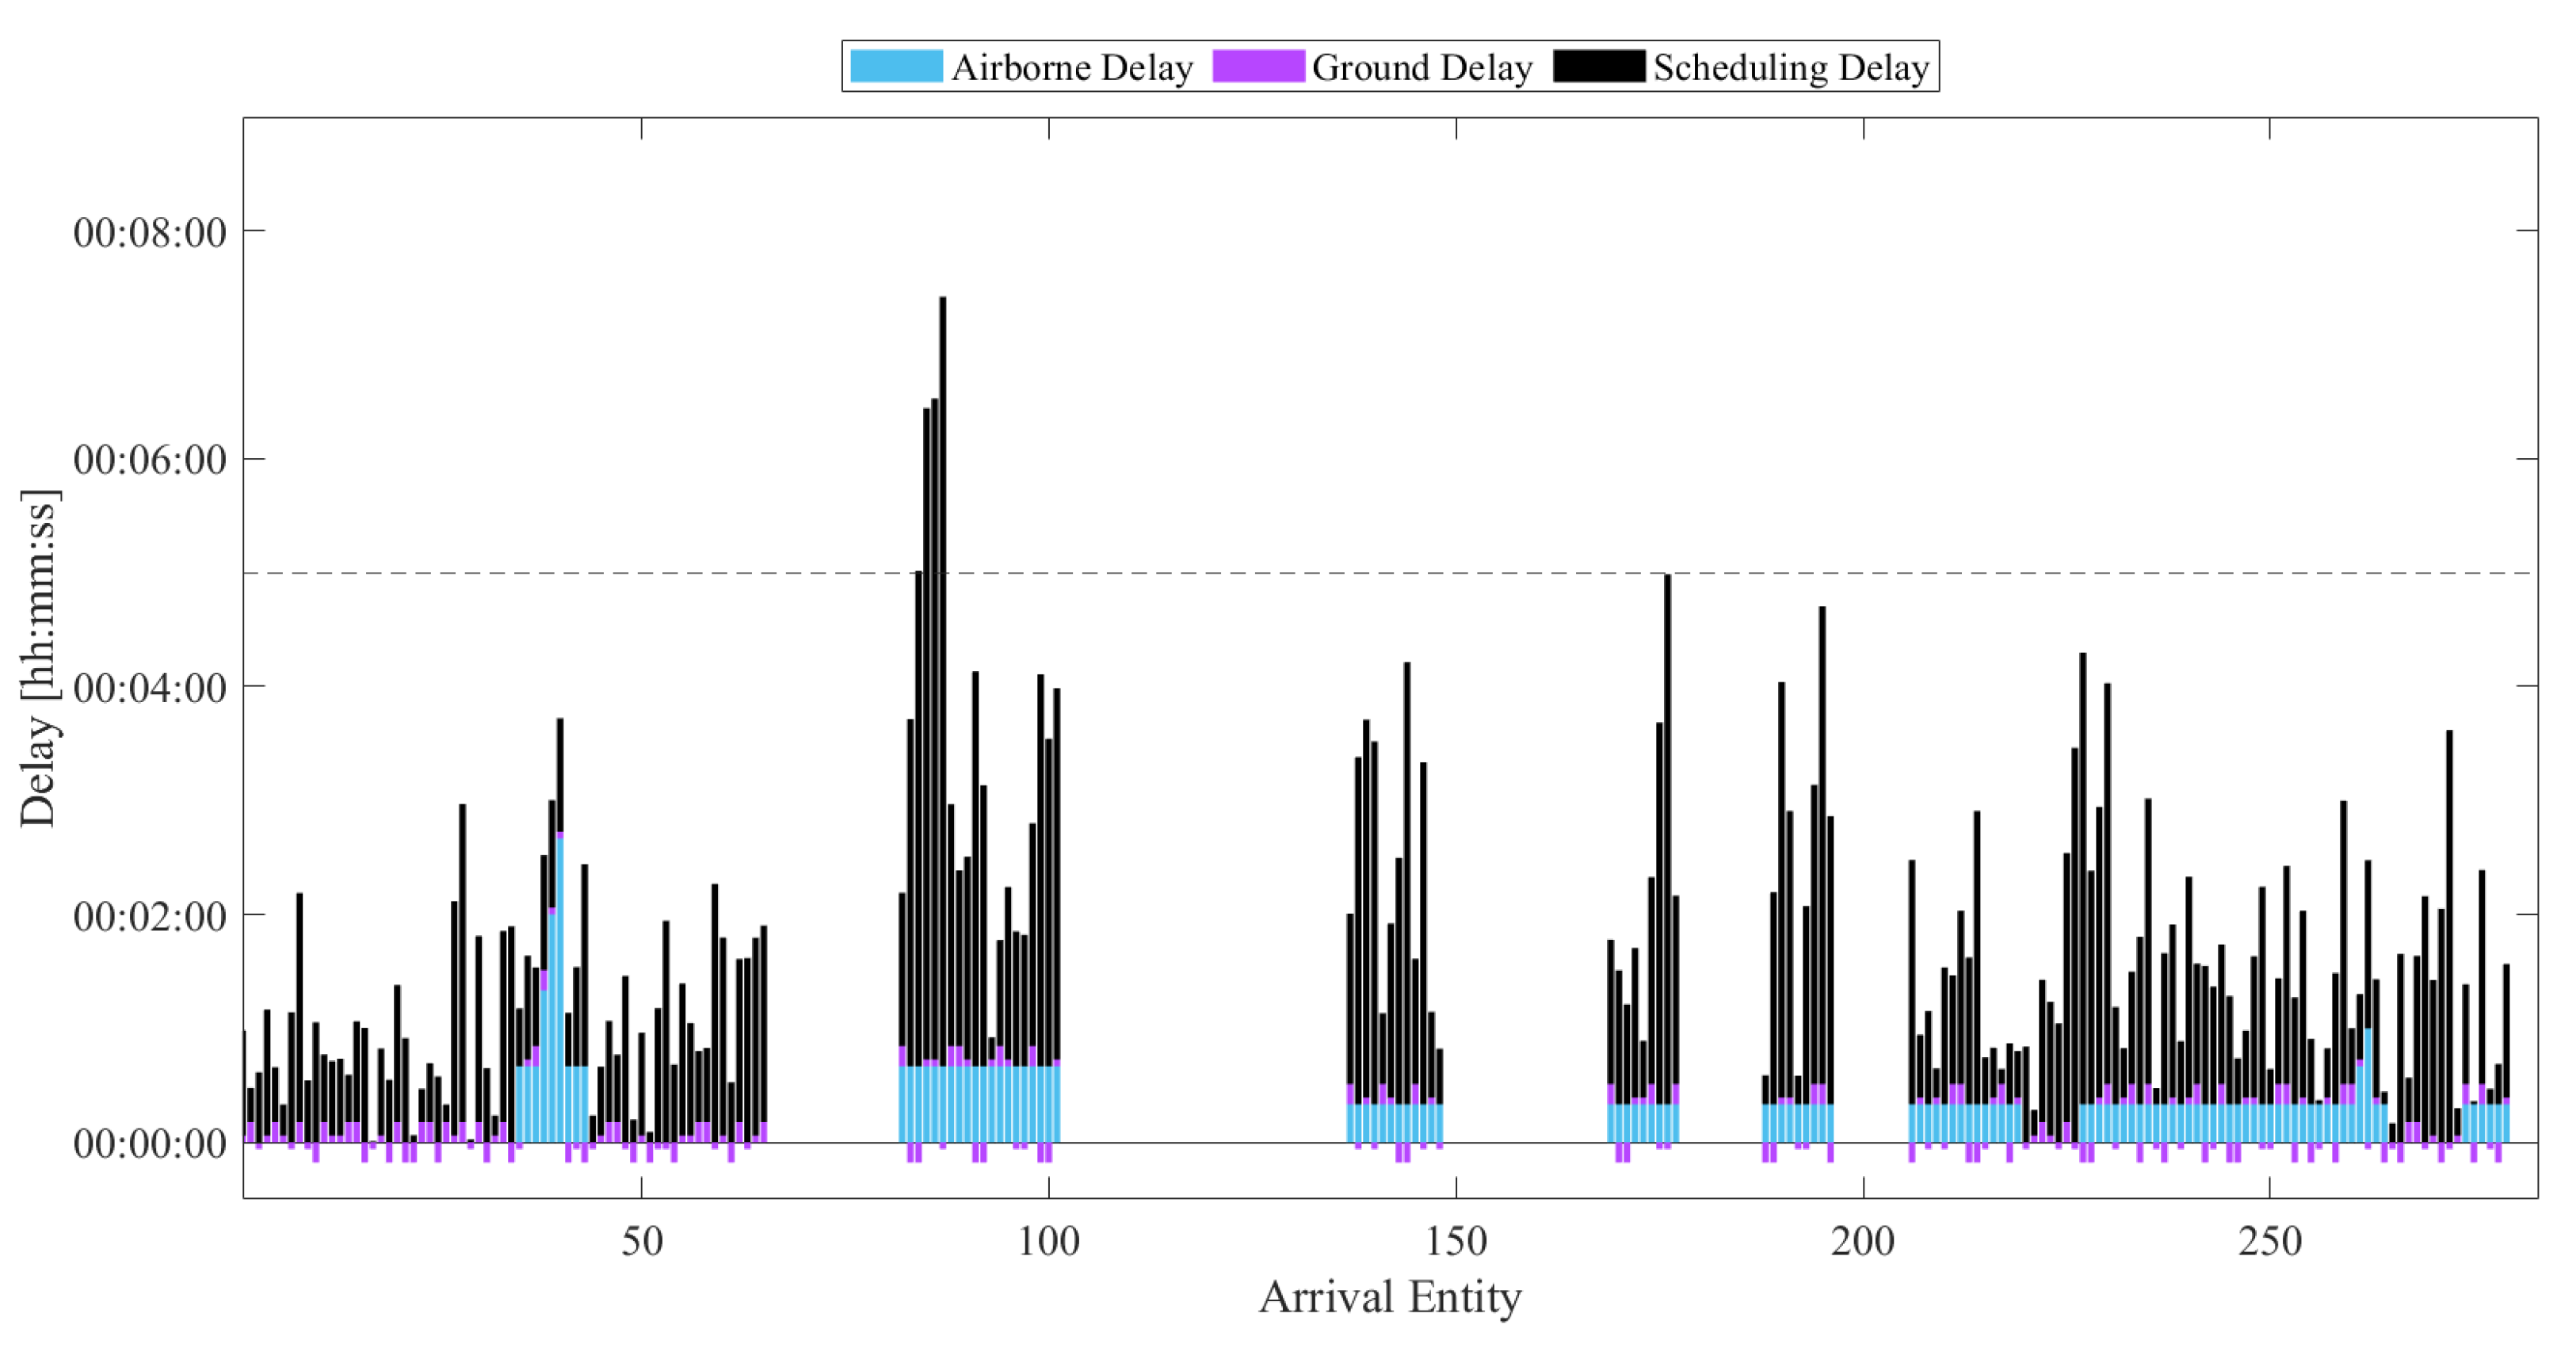
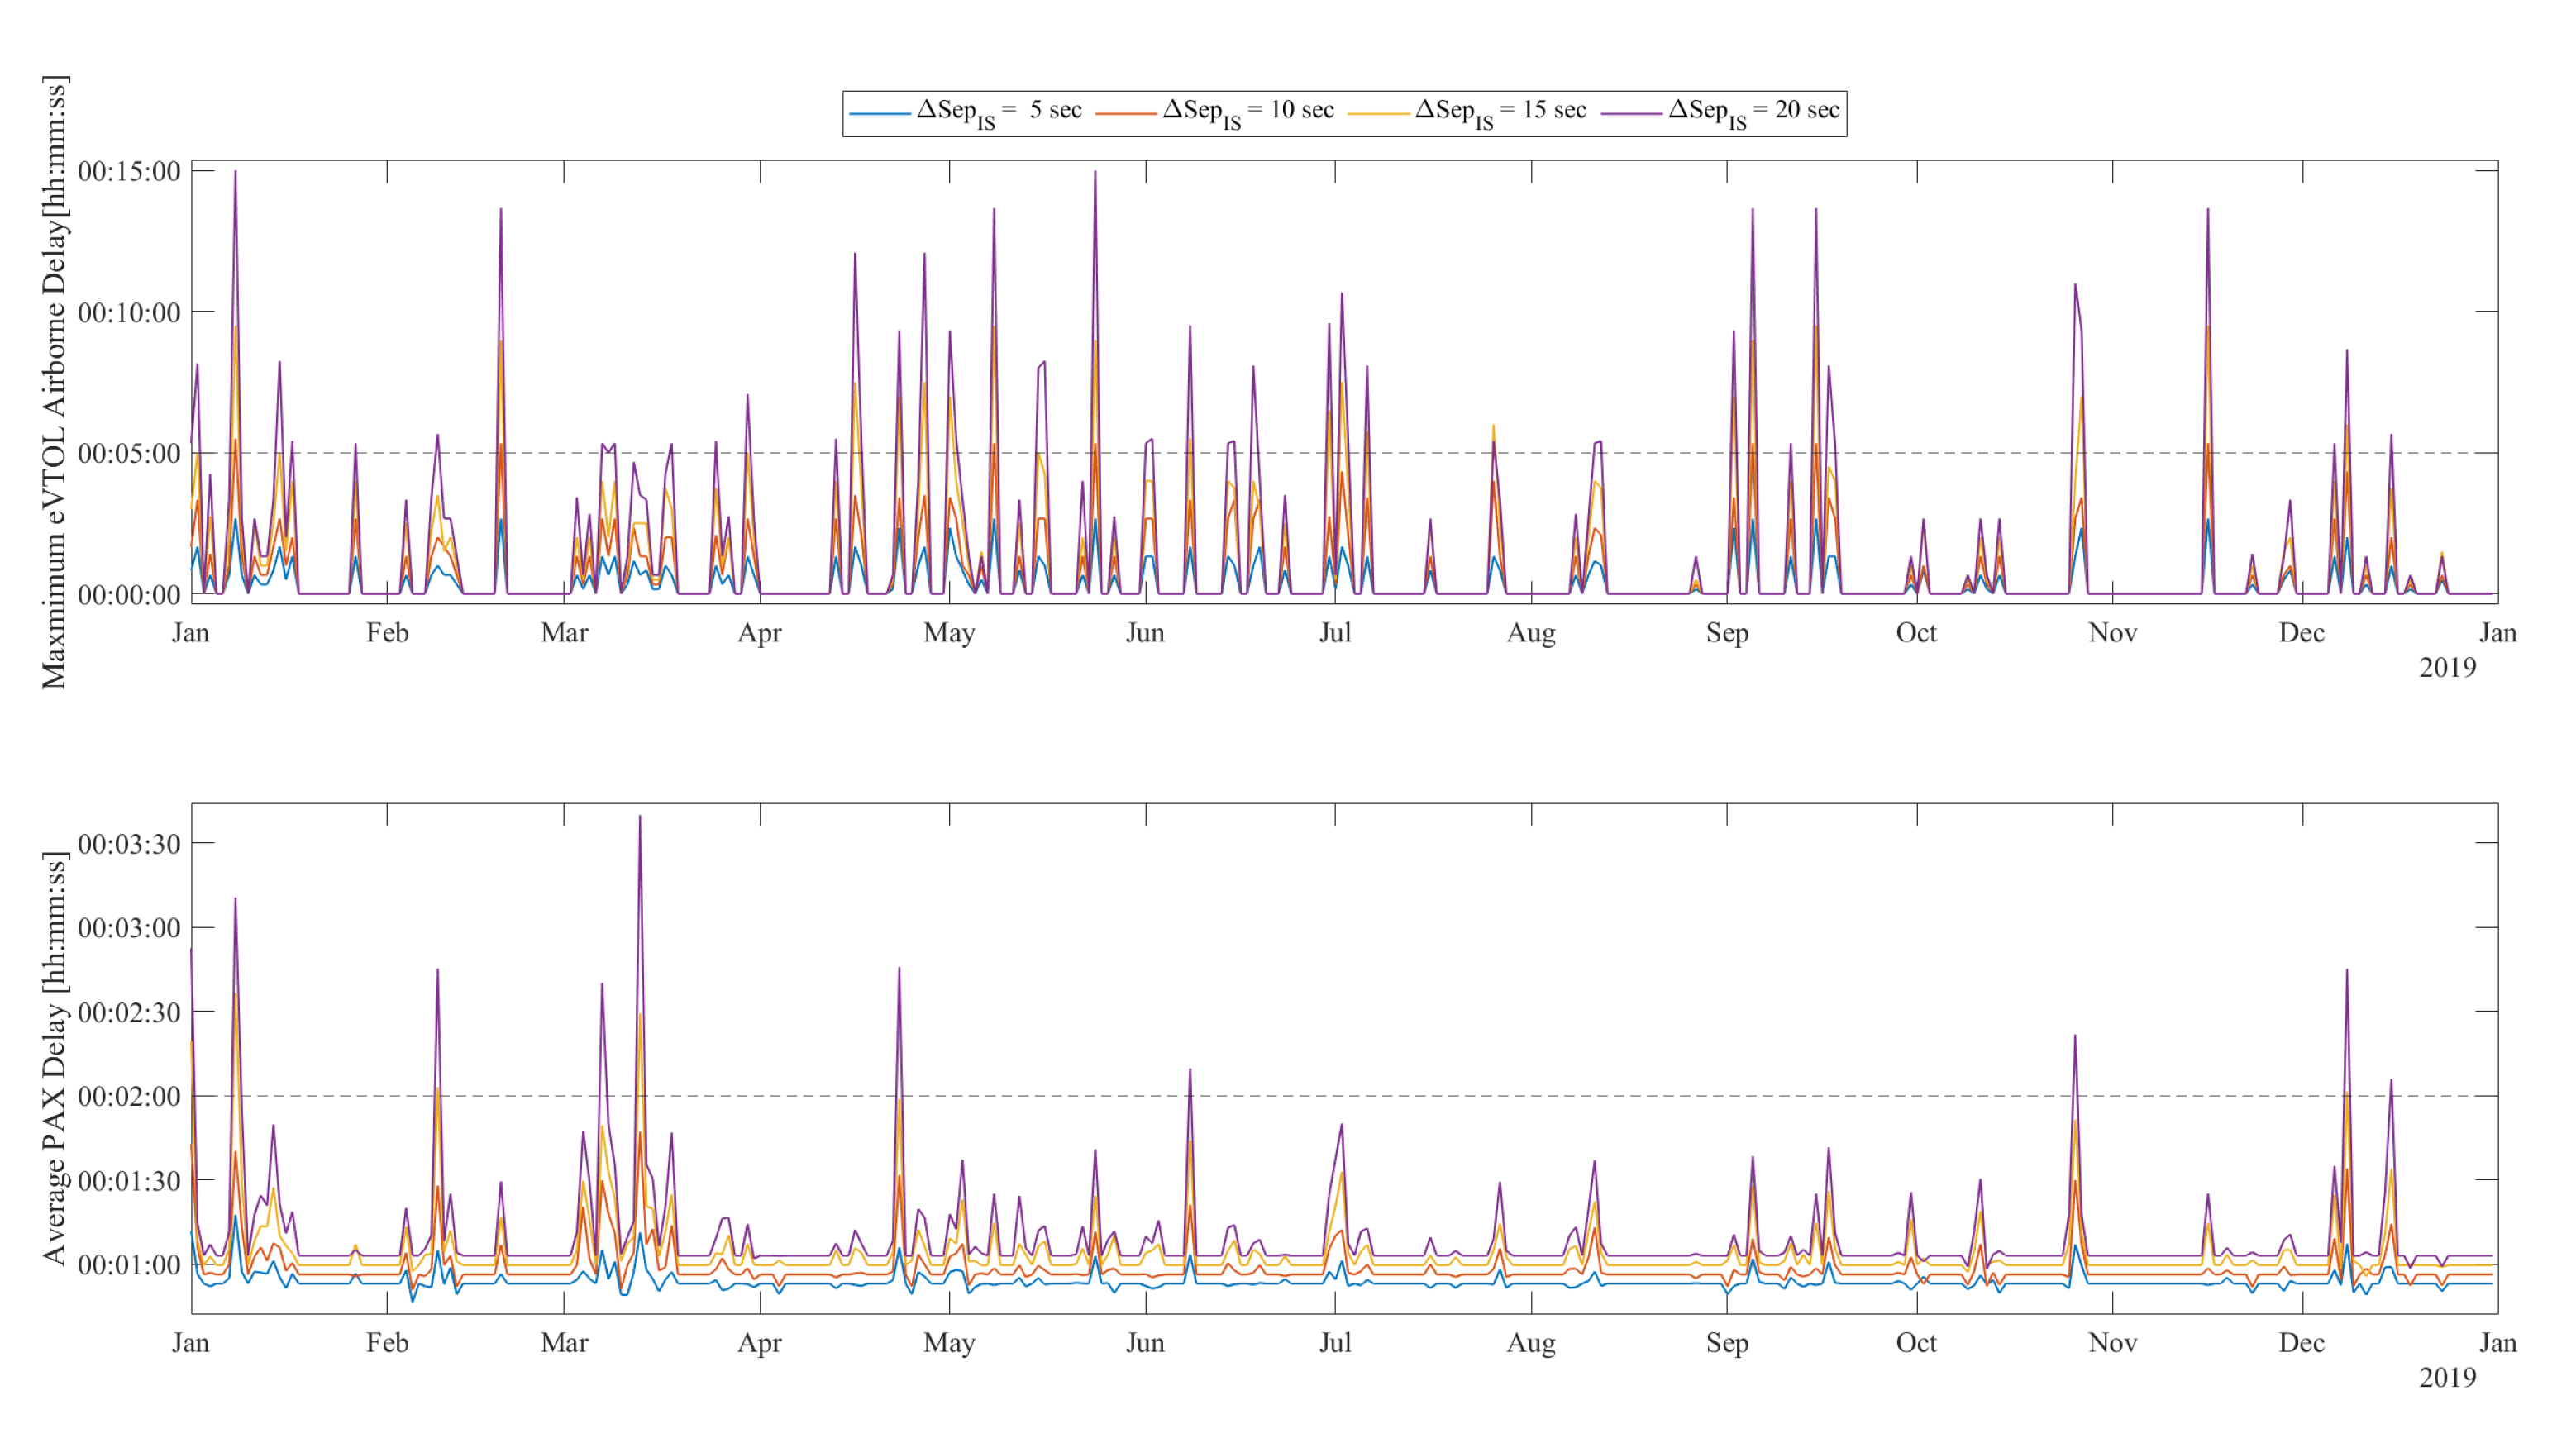
Table 1.
Summary of potential wind threshold references for UAM operations.
| Parameter | Wind Speed | Based on | Type of Operation | Source |
|---|---|---|---|---|
| Large/Transportation Fixed-Wing Aircraft | ||||
| Crosswind | at least 20 kts demonstrated | EASA CS25 and FAR Part 25 | Take-off and landing | 2023, [35,36] |
| Tailwind | ≤10 kts | EASA CS25 | Take-off and landing on dry runways, hard limit, higher values may be demonstrated and then used | 2023, [35] |
| Tailwind | ≤5 kts | EASA CS25 | Steep approaches, hard limit, higher values may be demonstrated and then used | 2023, [35] |
| Helicopter | ||||
| Wind | <15 kts | Pilot survey | Helicopter under VMC in obstacle rich environment | 1994, [12] |
| Gust | <20 kts | Passenger comfort | Helicopter | 1984, [9] |
| <25 kts | Pilot survey | Helicopter under VMC in obstacle rich environment | 1994, [12] | |
| VTOL Aircraft | ||||
| Wind | at least 17 kts | EASA MOC SC-VTOL | UAM VTOL operation in certified category | 2022, [18] |
| 20 kts | Operating 95% of the time | UAM operation in U.S. | 2018, [23] | |
| 15–20 kts, 20–25 kts, ≥25 kts | Classes of wind | UAM operation in U.S. | 2018/2021, [25,26] | |
| green: <15 kts, yellow: <20 kts, red: >25 kts | Horizontal wind speed threshold | UAM operation | 2022, [27] | |
| nominal: <15 kts, moderate: 15–20 kts, severe: >20 kts | Mean wind speed | UAM operation | 2022, [29] | |
| ≤ 16.7 kts | Assumption for mean wind speed | UAM operation with Volocopter multirotor | 2019, [28] | |
| Crosswind | ≤15 kts | Heliport operations subject matter expert interviews | UAM operation | 2020, [24] |
| Headwind | 20 m/s (38.9 kts) | Operating 99% of the time | UAM operation in Upper Bavaria | 2020, [22] |
| 10 kts | Operating at least 50% of the time | UAM operation in U.S. | 2018, [23] | |
| ≤35 kts | Operating 95% of the time | UAM operation in U.S. | 2018, [23] | |
| ≤26.7 kts | Mean gust speed threshold | UAM operation with Volocopter mulitrotor | 2019, [28] | |
| ≤30 kts | Gusts in vertiport terminal airspace | VTOL operation | 2022, [37] | |
| red: >35 kts | Horizontal gust speed threshold | UAM operation | 2022, [27] | |
| red: >6 m/s (11.7 kts) | Vertical gust speed threshold | UAM operation | 2022, [27] | |
Table 2.
Vertiport airside service times.
| Vertiport Element | Operation | Service Times | Capacity |
|---|---|---|---|
| Arrival Pad | Approach | 75 s | 48 Arr/h |
| Departure Pad | Take-off | 66 s | 54 Dep/h |
| Gate | De-Boarding | 5 min | 12 Arr/h |
| Gate | Boarding | 5 min | 12 Dep/h |
| Gate | Turnaround | 10 min | 6 Arr+Dep/h |
| Taxiway | Ground taxiing | 11–27 s | N/A |
| dependent on taxiway |
Table 3.
Main components of a METAR message.
| Component | Measurement | Example | |
|---|---|---|---|
| METAR | Wind | direction azimuth in degrees/speed (kts) | 12009KT |
| Visibility | horizontal visibility/runway visual range (m) | 9999 | |
| Precipitation | significant weather phenomenon | -RA | |
| Cloud | cover/height 100 (ft) above MSL | BKN040 | |
| Temperature | air/dew point (°C) | 05/M02 | |
| Pressure | sea-level pressure QNH (hPa) | Q1032 | |
| TAF | TEMPO SHRA |
Table 4.
Wind parameters in METAR messages.
| Wind Direction | Wind Speed |
|---|---|
| rounded to the nearest 10 degrees | KT (knots), MPS (meters per second), MPH (miles per hour) |
| 000° to 350° | 0–99 knots |
| V: varying conditions | G: gust speed exceeds 10 knots or more the mean wind speed |
| VRB: varying wind directions/wind directions cannot be determined | |
| Specific Features: | |
| 00000KT | CALM conditions (no wind) |
| /////KT | direction and speed cannot be determined |
| P99 (P199KPH) | Wind speeds and gusts of 100 knots and more |
Table 5.
Wind-dependent vertiport ConOps.
| WIND CATEGORIES | |||
| Elements: | Wind speed (W) (kts), gust speed (G) (kts) | ||
| Approach: | If both occur, gusts are selected as the more critical and, therefore, dominant parameter | ||
| WO | WA | WW | WS |
| W/G ≤ 17 kts | 17 kts < W/G ≤ 20 kts | 20 kts < W/G < 25 kts | W/G ≥ 25 kts |
| SEPARATION CATEGORIES | |||
| Elements: | Separation Time (ST) [s], Impact Score (IS) | ||
| Approach: | IS>3 → “impacted hour” [25,26] | ||
| Assumption: | Separation time is adjusted accordingly per each IS increase → = 10 s | ||
| Separation Time Calculation: | |||
| Nominal Separation O | Increased Separation I | Increased Separation II | Flight Prohibition |
| =75 s Arrival | =95 s Arrival | =115 s Arrival | Requests will be cancelled |
| =66 s Departure | =86 s Departure | =106 s Departure | |
Disclaimer/Publisher’s Note: The statements, opinions and data contained in all publications are solely those of the individual author(s) and contributor(s) and not of MDPI and/or the editor(s). MDPI and/or the editor(s) disclaim responsibility for any injury to people or property resulting from any ideas, methods, instructions or products referred to in the content. |
© 2023 by the authors. Licensee MDPI, Basel, Switzerland. This article is an open access article distributed under the terms and conditions of the Creative Commons Attribution (CC BY) license (https://creativecommons.org/licenses/by/4.0/).
Share and Cite
MDPI and ACS Style
Schweiger, K.; Schmitz, R.; Knabe, F. Impact of Wind on eVTOL Operations and Implications for Vertiport Airside Traffic Flows: A Case Study of Hamburg and Munich. Drones 2023, 7, 464. https://doi.org/10.3390/drones7070464
AMA Style
Schweiger K, Schmitz R, Knabe F. Impact of Wind on eVTOL Operations and Implications for Vertiport Airside Traffic Flows: A Case Study of Hamburg and Munich. Drones. 2023; 7(7):464. https://doi.org/10.3390/drones7070464
Chicago/Turabian StyleSchweiger, Karolin, Reinhard Schmitz, and Franz Knabe. 2023. "Impact of Wind on eVTOL Operations and Implications for Vertiport Airside Traffic Flows: A Case Study of Hamburg and Munich" Drones 7, no. 7: 464. https://doi.org/10.3390/drones7070464