
Drone-Based Environmental Emergency Response in the Brazilian Amazon

School of Engineering and Applied Sciences, The George Washington University, 800 22nd St, Washington, DC 20052, USA
*
Author to whom correspondence should be addressed.
Drones 2023, 7(9), 554; https://doi.org/10.3390/drones7090554
Submission received: 17 July 2023
/
Revised: 8 August 2023
/
Accepted: 18 August 2023
/
Published: 27 August 2023
(This article belongs to the Special Issue UAV IoT Sensing and Networking)
Abstract
:This paper introduces a location–allocation model to support environmental emergency response strategic planning using a drone-based network. Drones are used to verify potential emergencies, gathering additional information to support emergency response missions when time and resources are limited. The resulting discrete facility location–allocation model with mobile servers assumes a centralized network operated out of sight by first responders and government agents. The optimization problem seeks to find the minimal cost configuration that meets operational constraints and performance objectives. To test the practical applicability of the proposed model, a real-life case study was implemented for the municipality of Ji-Paraná, in the Brazilian Amazon, using demand data from a mobile whistle-blower application and from satellite imagery projects that monitor deforestation and fire incidents in the region. Experiments are performed to understand the model’s sensitivity to various demand scenarios and capacity restrictions.
1. Introduction
The Amazon is the largest rainforest in the world and plays an important role in managing the Earth’s natural systems. However, climate change is altering the region’s rainfall patterns and decreasing its resilience to threats, such as fires and biodiversity loss [1]. The rainforest is also under great deforestation threats and recent years have seen record-high rates of forest loss [2]. The main causes of deforestation in the Amazon are agricultural expansion, mining, and logging, all of which are mostly illegal [3,4,5].
The Amazon covers nine countries, and most of its area is within Brazil’s jurisdiction [3]. Brazil is responsible for over 80% of the deforestation in the region, even though protected areas account for 54% of the Brazilian Amazon [6,7]. In the Paris Agreement, Brazil stated several ambitious goals, such as zeroing illegal deforestation by 2030, dramatically reducing greenhouse gas emissions (GHGE), and restoring and reforesting native vegetation [8,9]. However, in 2020, deforestation rates reached new heights and the country is not on track to fulfill its commitments [2]. Currently, the country leads the global list of tropical rainforest tree cover loss and saw the greatest deforestation of the decade in 2020 [2,10].
Addressing Amazon Rainforest deforestation threats is an issue of global and regional concern due to the region’s high biodiversity and the potential feedback to the Earth’s natural cycles [11,12]. Due to the negative synergies between deforestation, climate change, and widespread anthropogenic fire, it is estimated that the removal of 30 to 40% of the Amazon Rainforest could transform it into a permanently drier climate, hindering efforts to achieve the goals outlined in the Paris Agreement [13,14,15,16].
Deforestation and wildfires are costly and deadly, presenting not only a risk to wildlife but also to human health [17,18]. Living near Amazon fire outbreaks was shown to increase the probability of hospitalizations due to medical emergencies [19]. In the 2019 fire season, it is estimated that Brazil had nearly 5000 additional deaths due to fine particulate matter emitted by wildfires in the Amazon region [20]. Additionally, the pollutants emitted can travel long distances and affect areas far away from where the fire initially took place [21]. Effective management of wildfires requires early detection and rapid extinguishment, to minimize potential damages to wildlife and human health [17,22].
Managing wildfires and combating increased clearing in the Amazon region requires improving and enforcing environmental policies and using state-of-the-art technologies to help enforce existing regulations and prevent new deforestation [2,23,24]. Increased monitoring and law enforcement can help prevent deforestation and protect native forest, because weak oversight is related to higher rates of deforestation [25,26]. The lack of an appropriate response to environmental crimes and illegal occupation can have devastating effects, as there are clear links between impunity, land speculation, and forest degradation in the Amazon [27].
In recent years, communities in the Amazon region and public security agents have started to use drones to improve their surveillance capabilities and document illegal forest degradation in the area [28]. The Madre de Dios region, in the southern part of the Peruvian Amazon, is a region threatened by illegal mining, logging, and illegal deforestation. Community leaders developed a comprehensive monitoring system that included satellite monitoring, drone patrols, and legal action in case of irregularities [28,29,30]. In Brazil, members of the Uru-Eu-Wau-Wau indigenous territory are also using drones to help track illegal deforestation in their land [31]. Also in Brazil, firefighters and the armed forces are using drones to support emergency response operations [32,33].
The use of drones in the Amazon forest has many advantages. First, drones are small and flexible and can be placed in a variety of locations without requiring major infrastructure investments. Secondly, illegal deforestation is often caused by outsiders who wish to exploit the rainforest, and encounters between government agents and illegal actors are often not peaceful [4,34]. The use of drones would allow first responders and park rangers to gather information more safely, because drones can fly to dangerous environments that would otherwise be inaccessible to humans or difficult to reach by road.
In this context, this paper introduces a drone-based network design model to support the environmental emergency response in the Brazilian Amazon. The proposed model is strategic in nature and seeks to determine a minimal-cost network configuration that meets operational constraints and performance targets. Drones are used to verify complaints and to gather information to support the emergency response planning process. The drones are operated out of sight through a centralized network operated by government agents and first responders. The resulting optimization problem is a discrete facility location–allocation model with mobile servers.
The contribution of this paper is threefold. First, it introduces a novel method to design a drone network that extends the literature on drone-based models by considering different types of emergencies and drones and by explicitly modeling the impact of additional batteries, unlike previous approaches that assume a single type of service and do not consider the effect of additional batteries on the total available endurance and network cost [35,36,37]. Additionally, although drones are already being used in the Amazon Rainforest for small-scale missions, to the best of the authors’ knowledge, this is the first study to provide a formalized analytical method to support the strategic decision planning involved in designing a drone-based network to support the environmental emergency response in the region. Lastly, this paper demonstrates the applicability of the proposed approach by solving a realistic case study based on the municipality of Ji-Paraná, located in the Brazilian Amazon, using real emergency data from well-known sources of Amazon Rainforest deforestation and fire incidents. The results show that drones have the potential to considerably reduce the response time in both rural and urban areas, thus highlighting the benefits obtained when drones are considered in the emergency response mission.
The rest of this paper is organized as follows. Section 2 discusses the related research. The proposed optimization model is described in Section 3. The case study is discussed at length in Section 4. The results are discussed in Section 5. Finally, the concluding remarks and future research directions are discussed in Section 6.
2. Related Work
This section presents a discussion of the current research related to drone-based environmental emergency response and drone-based strategic discrete location–allocation models.
In emergency response planning, the time span between the request for service and the arrival of first responders at the incident location must be reduced as much as possible to gather more precise information about the event and to prevent it from spiraling out of control. For example, forest fires are unpredictable and can expand rapidly and cause severe damage [38,39]. Arriving early to the scene also allows first responders to gather information about suspicious activities related to deforestation and forest degradation, because many environmental emergencies are anthropogenic [5,40].
Traditionally, planning for an environmental emergency response is based on visual observations and subjective estimation by experts or bystanders [17]. However, these observations can be ambiguous, imprecise, and incomplete, which can jeopardize the operation, because decision-makers can operate under a lot of pressure and are time-constrained.
Drones have emerged as an appropriate technology to perform data collection tasks in hard-to-reach regions or where the task is unsafe or impossible for humans. The aerial view that drones provide can help in forest monitoring as well as a fast response in large-scale areas [41]. Wireless sensor networks (WSN) for forest monitoring are an alternative to drone technology. However, sensors can be too sensitive when used outdoors, are difficult to maintain, and are not scalable due to their static nature [42]. Satellites are also popular forest monitoring tools, but they have limited ground coverage, a long time lag to deliver the information, and low resolution, making it hard to detect small areas of forest clearing [43,44].
Drones are useful in an environmental emergency response due to their maneuverability, wide range of sensors, remote control, automation, and better large-distance surveillance and monitoring. They provide a cost-efficient alternative for preventing and detecting and the real-time support of environmental emergencies [42] while not causing too much disturbance for the region’s wildlife [45,46]. Drones have been proposed for many different forestry and environmental emergency response applications, such as for gathering live information about wildfires to support firefighters on duty and to conduct wildlife inventory management in the Peruvian Amazon [47,48].
Designing a network of drones to support an environmental emergency response requires determining the number of drones, the locations where launch stations should be established, and the allocation of drones to incidents. Another important consideration when designing emergency response systems is the type of emergency to consider, because each one must be served by different types of drones. Drones can be chosen based on various specifications, such as endurance, maximum range of operation, speed, and acquisition cost. Such a model belongs to the class of capacitated multi-facility location–allocation problems, where the incident locations are customers and the drone bases are mobile servers and there is a limit to the demand each drone can serve.
Traditionally, facility location–allocation models deal with the problem of opening new base stations, with mobile or static servers, to respond to a set of client demands and allocating each customer to a specific base [49]. Facility location problems can be discrete or continuous. In the former, the location of candidate base stations is known a priori, while in the latter, the locations of candidate stations are decision variables in the model. A review of the main discrete facility location problems can be found in [50]. These problems arise in many practical applications, such as the location of fire brigades, hospitals, and distribution centers. More recently, facility location–allocation problems have been applied in the context of designing drone-based networks in a variety of contexts.
Although drones are being used to support environmental emergency response and conservation [38,39,42,44,45,46,51,52], the majority of the works are empirical studies [41,53,54] or operational models for continuous monitoring of wildland, mission planning, and coordinated task allocation [17,55,56].
A monitoring system for tactical forest firefighting is introduced in [17]. The authors propose an unmanned aerial vehicle (UAV) system with remote sensors and discuss the architecture of a system in which drones need to respond to three types of missions: patrol, confirmation, and monitoring. Although the model presents a detailed analysis of a firefighting system architecture and discusses remote sensing and image processing techniques relevant for such systems, it does not consider strategic aspects of the network design, such as the location of bases or cost considerations. In [56], a UAV system consisting of several drones and a central station for fire monitoring is introduced. The system seeks to compute in real time the evolution of the fire front shape and potentially other parameters related to fire propagation. Given that the missions discussed in the paper consist of multiple drones, the authors discuss in detail the decision-support algorithms used for the coordination and control of the fleet of vehicles. However, the study does not consider how the central station should be distributed or other strategic decisions related to the design of the drone network.
Another relevant related area of research is UAV task allocation models, particularly swarm methods [57,58,59,60,61]. In these problems, drones operate as a fleet or swarm in coordinated missions. In such scenarios, a safe operation requires implementing a motion path planning and navigation system for multiple drones with support for collision prediction and avoidance, given that the drones must operate in a coordinated manner with incomplete and uncertain information and cope with dynamic environments. Although swarm approaches are useful techniques to deal with the problem of missions that require fleets of drones operating in a coordinated manner, the problem in the scope of the present paper requires different modeling approaches. This is mainly because, here, the focus is the strategic decisions that stakeholders must make when designing a drone-based network to support an environmental emergency response. In the present paper, the decision-maker must make several strategic decisions prior to addressing tactical aspects of the implication.
In summary, this project differs from swarm-based task allocation models in three main ways. First, in the present model, each drone is assigned a single mission and makes one-to-one trips from the base station to the location of the incident, unlike in models where a group of drones must visit several locations prior to returning. Thus, routing considerations are not in the scope of the proposed research. Secondly, the central planner controls the allocation of tasks, not the agents. Lastly, the numbers of drones and base stations are not known a priori and are also decision variables in the model.
To the best of the authors’ knowledge, there are no other works addressing the strategic drone network design for the environmental response planning problem described in this paper. However, there are examples in the healthcare, tourism, and transportation literature that use discrete facility location models to design drone networks, which are of interest for the present research. One recent application of drones is to provide support to out-of-hospital cardiac arrests (OHCA) by delivering automated external defibrillators to the location of the emergency. In [62], a queuing-based location–allocation model is introduced to respond to OHCA events in Toronto. A discrete facility location–allocation model is used to determine where to open facilities and the assignments of patients to facilities while a queuing model was used to determine the number of drones to place at each base station, considering the effect of congestion. In [35], a maximum coverage location problem is used to determine the placement of drones such that all OHCAs in Salt Lake City could be reachable in under one minute. The work is expanded in [36], which formulated a backup coverage location–allocation problem to design a network of drone-based defibrillator delivery to OHCAs in Salt Lake City.
Emergency medical services differ from environmental emergencies in two ways. First, an environmental emergency response network is unlikely to be congested, whereas medical emergencies can happen enough times in a day to merit an explicit consideration of congestion, such as in [62], or backup coverage, such as in [35,36]. Secondly, in the case of medical emergencies, the response time is the most relevant metric, because not arriving within a certain time interval may be the difference between life and death. For environmental emergencies, on the other hand, this is not necessarily the case. Arriving as quickly as possible at incident locations is still relevant, but cost considerations must also be taken into account more explicitly.
Another implementation of a drone facility location can be found in the tourism management literature. In [37], an unmanned aerial vehicle (UAV) network is proposed to provide online virtual tours in open-air tourist attractions using a discrete facility location–allocation model. The model considers that each location can be partially covered by different launch stations and seeks to determine the number of drone launching stations to open, the location of each base, and the number of drones assigned to each center. The objective function minimizes the total cost of the system as a function of the number of drones and the cost of opening facilities. The model assumes that drones are always fully operational and that extra batteries are stored at each launching station, but the number and cost of additional batteries are not explicitly considered in the model. Additionally, the model only considers one type of customer and a single type of drone is considered in the model.
The problem of locating a pre-specified number of capacitated facilities and assigning drones to serve customer demands is discussed in [63]. Each facility serves as a drone launching site for distributing the resources in a transportation network. Drones make several one-to-one trips from the facility location to the demand points and back until the battery range is met. The recharging of drone batteries is not considered due to the short-term nature of the planning period considered. The paper presents an integer linear programming formulation that seeks to maximize coverage while explicitly incorporating the drone energy consumption and range constraints, the maximum coverage facility location problem with drones. Given the complexity of the proposed problem and high solution times with state-of-the-art mixed integer programming (MIP) solvers, the authors propose Greedy and decomposition heuristics to improve the solution times, something that is crucial for the short-term planning period considered in their work.
Contributions
Technological advancements in environmental emergency response planning are increasingly important given the synergies between climate change and environmental disasters, such as wildfires, as well as deforestation and forest degradation. A better environmental emergency response can also help law enforcement gather information about illegal deforestation and act quickly under time pressure. Drones have recently arisen as useful tools to help gather information to support the environmental emergency response in the Amazon region. However, there are still few strategic network design models that address the issues faced in the region, although similar models have been implemented for other cases, such as OHCA responses, tourism management, and drone delivery models [35,36,37,62]. This paper introduces a novel drone-based location–allocation model that seeks to find the location of bases, the number of drones of each type for each base, and the allocation of bases and drones to environmental emergencies.
In the model proposed in this paper, which belongs to the capacitated discrete multi-facility location–allocation family of problems, a centralized decision-maker seeks to determine the number and locations of launch stations to be established, the types of drones to be placed in each location, and the assignment of launch stations to incidents such that the total cost of the network is minimized and performance targets are reached. A case study is performed for the city of Ji-Paraná, a municipality in the Brazilian Amazon. The demand data are modeled from satellite imagery and whistle-blower data, both of which are reliable sources of historical demand data that are used by first responders in the region. Drones are already being used by communities in the Amazon region to provide additional monitoring capability to respond to environmental threats. To the authors’ best knowledge, the present study is the first of its kind to formalize an optimization problem to aid strategic decision making regarding drone-based environmental emergency response networks.
This paper contributes to the existing body of literature in three ways. First, from an environmental response perspective, this case study presents an original project that can aid communities and first responders as they plan to enhance their actions to curb deforestation in the Brazilian Amazon. Given the magnitude of fires in the region, environmental emergency missions will likely still need to consider other vehicles such as manned aircrafts and ground trucks for an effective fire response. However, the use of drones in confirmation missions, to gather additional information regarding environmental emergencies, can help ensure that adequate resources are mobilized, particularly during the fire season. Secondly, from a modeling perspective, the proposed research innovates by expanding the literature on the location–allocation model to include an application for the environmental emergency response planning decisions faced by decision-makers in the field. Lastly, by performing a sensitivity analysis using real data from past fire seasons, this work demonstrates the applicability of the proposed model.
3. Proposed Model
Consider a strategic decision-maker that must make operational decisions regarding a drone-based network to support an environmental emergency response when there are multiple types of emergencies, each one requiring drones equipped with different types of sensors. Here, drones are used in confirmation missions, to verify environmental emergency incidents and gather additional information that can help first responders better plan their missions. Each drone makes one-to-one trips between base stations and incident locations. The context of the proposed optimization model is a decision-maker who needs to design a network of drones to prepare for a season of increased environmental emergencies, using the best available information to model the demand and considering operational constraints and performance targets. The objective of the model is to find a minimal cost configuration that would allow reaching a target coverage ratio. The decisions to be made are the following:
- Where to open drone facilities given a set of potential locations?
- How many operators are needed in each location?
- How many drones of each type are needed in each location?
- Which drones should be assigned to each location–emergency type pair?
- What type of facility to open in each location?
- How many backup batteries are needed in each facility for each drone type?
- What portion of the demand for a given emergency will be covered by each drone?
This is a problem currently faced by first responders and communities in the Amazon region and that can arise during annual strategic planning sessions or when non-governmental organizations seek funding from international agencies [28].
The resulting optimization problem belongs to the class of capacitated implicit coverage discrete multi-facility location–allocation problems [64,65,66,67] because multiple facilities must be located from a predefined set of candidate locations, drones must be allocated to each emergency, multiple facilities can be opened, there are capacity constraints due to battery and range limits, and each drone can cover a fraction of the demand in each emergency location.
The remainder of this section will introduce the resulting drone-based location–allocation problem. In the resulting formulation, different types of emergencies are considered, each one requiring drones with specific attributes. The objective function minimizes the total cost of the network, which includes fixed facility costs, operational costs, and investment costs. The central planner seeks to determine which bases to open and the allocation of drones to bases and emergencies while meeting operational requirements and performance targets, making this a strategic decision problem. The context of the problem is a network of drones used for environmental emergency verification, to help first responders plan for the emergency response operations. Each incident must be covered by at least one drone, and the central planner seeks to determine which bases to open, the allocation of drones to bases and emergencies, and the ratio of the demand for each incident location that is covered by the different drone–base combinations. The drones are mobile servers, and the emergencies are assumed to be static clients.
3.1. Notation
3.1.1. Sets
- I
- Set of locations of environmental emergencies.
- J
- Set of candidate drone bases.
- K
- Set of drone types.
- E
- Set of type of environmental emergencies.
- W
- Set of types of facilities.
- L
- Set of links defining the catchment regions, type of incident per location, and drone requirements, where .
3.1.2. Parameters
- dij
- Distance between drone base and incident , determined using Haversine distances.
- λie
- Demand for emergency in site .
- ck
- Annualized acquisition cost of drone (USD/year).
- vk
- Flight speed of drone (m/s).
- ωk
- Effective flying time for drone (s).
- rk
- Coverage radius of drone (m).
- τe
- On-scene/mission time for emergency (s).
- Annual cost of opening a drone base w in location j (USD/year).
- ϕk
- Maximum number of batteries allowed for drone type k (USD/year).
- Annualized cost of battery for drone type k (USD/year).
- Nw
- Maximum number of drones per facility type w.
- M
- Maximum number of drones per operator.
- s
- Annual salary for drone operators (first responders) (USD/year).
3.1.3. Decision Variables
- njk
- Integer variable representing the number of drones of type k allocated to facility .
- bjk
- Integer variable representing the number of batteries for drone type k allocated to facility .
- oj
- Integer variable representing the number of operators needed in facility j, assuming that each one can operate M drones at a time.
- Binary variable that takes value 1 if facility type w is opened on location j.
- yj
- Binary variable that takes value 1 if facility is opened, and 0 otherwise.
- xijke
- Binary variable that takes value 1 if emergency in site is covered by base and drone , and 0 otherwise.
- αijke
- Continuous variable representing the portion of the demand for emergency in site is covered by base and drone .
3.2. Drone-Based Facility Location–Allocation Model
The resulting problem is a discrete facility location–allocation model that seeks to minimize the total annual cost of the network.
The objective function (1) minimizes the total cost of operating the drone network. The first term in the objective function represents the total acquisition cost of drones, the second term represents the total cost of additional batteries, the third term represents the total cost of opening drone facilities, and the last term represents the cost of drone operators. Constraints (6) and (7) ensure that each location j must have at most one type of facility w and that the facility will be large enough to accommodate the number of drones assigned to a given location. Constraint (2) ensures that each emergency is covered by at least one drone. Constraint (3) requires that the sum of the portion of the demand covered for each emergency location equals one. Constraint (4) ensures that the total number of drones allocated to each base station does not exceed the maximum allowed per base station. Constraint (5) assigns one operator for each M drone allocated in the system. Constraint (8) guarantees that an unopened base cannot be assigned to cover any emergency. Constraint (9) limits the number of additional batteries allowed for each base and drone type. Constraint (10) guarantees that if a fraction of the demand is covered by a base and drone, the integer variable representing that link takes value one. Constraint (11) requires that a drone can only be assigned to serve locations that fall within its catchment radius. Constraint (12) ensures that a drone can only be assigned to a facility if the total service time plus the total travel time is less than its endurance. Constraint (13) ensures that the total response time of all assignments to a drone and base cannot exceed the total available endurance. Constraints (14)–(16) define the integer and continuous variables.
4. Case Study
4.1. Study Settings
The city of Ji-Paraná, the second most-populous municipality in the Brazilian state of Rondônia, is the focus of the case study discussed in this section. The city overlaps with the Jaru Biological Reserve and with the Indigenous Territory Igarapé Lourdes. A map of the municipality is depicted in Figure 1. The reserve and the territory are under deforestation threats due to agricultural expansion, logging, mining, and land-grabbers, because agriculture and cattle raising are the municipality’s main economic activities [68,69,70,71]. The deforestation in the region affects the municipality’s rainfall and its microclimate [72]. During the dry season, which usually reaches its peak in the months of August to October, the municipality has an increasing number of fire outbreaks in both urban and rural regions [68,73]. The high number of fires also impacts the municipality’s health system, as the number of patients with respiratory issues increases significantly [74,75,76]. Thus, Ji-Paraná is an ideal location to implement a case study of the model, given how much it could benefit from additional support in managing environmental emergencies.
4.2. Demand Data
Given that forest fragmentation due to environmental degradation can make areas more prone to further land-use changes, such as fires [77], the locations to be covered by the drone network are determined using historical data on forest fires, forest degradation, and logging. Not only did these areas have environmental emergencies in the past, but they are also more vulnerable to environmental emergencies in the future, as observed in recent fire seasons [26]. The demand data cover urban and rural environmental emergencies in the municipality of Ji-Paraná and include data from satellite imagery and from an app that collected user reports on harmful offenses in the region. Two main types of environmental emergencies are considered: deforestation and fires, both of which are related to the main causes of forest loss in the region [3]. Two years’ worth of data are considered and the daily average number of occurrences per census block group during the dry season is calculated to find an upper limit to the demand. The following sections describe each data source in more detail. Figure 2 depicts the original demand distribution and the aggregation per census block group, which will be used in the optimization model.
4.2.1. Satellite Imagery
Satellite data for forest fires and deforestation are obtained from Brazil’s National Institute for Space Research (INPE). For deforestation and forest degradation incidents, data from the INPE’s DETER project are considered, which uses a satellite-based system for near real-time (NRT) detection of the removal of native forest, degradation, and logging [78]. It uses MODIS 250 m imagery with an almost daily revisit time and can detect forest clearings of at least 3 ha. DETER also sends daily alerts to environmental protection agencies, serving as an early warning system that can support surveillance and control of deforestation. Deforestation warning data from the DETER system, as well as the geospatial information for the region, were downloaded from INPE’s Terrabrasilis project [79]. This is one of the most reliable data sources for forest degradation in the Brazilian Amazon, particularly given that the DETER system was developed to support monitoring and control of forest deforestation and degradation [80].
For active fire and burned areas, data from INPE’s “Programa Queimadas” (Fire Program) are used, which provide temporal and geospatial daily information for fire occurrences worldwide [81]. The satellites can detect fires with 30 m of extension and 1m of width, although the actual area burned or the kind of vegetation affected cannot be detected. The data allow finding fire outbreaks, but because it uses multiple satellites, it is possible that the same fire may be detected by different systems and appear as different incidents. Still, the number of fire outbreaks is still a good estimate of the demand for fire emergencies in the region. The temporal and spatial data for Ji-Paraná’s fire outbreaks for 2020–2021 were downloaded from the BDQueimadas webtool [82]. This is also a reliable data source, used by first responders in the region to support mission and strategic planning.
4.2.2. Whistle-Blower Data
Although the satellite imagery provides good information for the areas detected in the past, some fire and deforestation incidents are undetected. Fire fronts of less than 30 m, fires that occur close to the soil and do not affect the tree canopy, low visibility due to clouds, imprecise fire focus, or short-term fires that missed the capture interval are all examples of instances that the existing satellites would miss [81]. For example, during the dry season, the city of Ji-Paraná, a small urban conglomerate in the southwest area of the municipality has a higher number of fire incidents which are not detected by satellite imagery. To address this issue, this research considers data from the Guardiões da Amazônia Project by the Brazilian Army.
One of the duties of the Brazilian Army is to protect the Brazilian Amazon from national and international threats. In 2020, after unprecedented levels of deforestation in the Brazilian Amazon, the Army was deployed to enforce law and order in the Brazilian Legal Amazon and fight fire outbreaks and illegal deforestation in the region. [83,84]. As part of the operation, the 17th Jungle Infantry Brigade developed the platform “Guardiões da Amazônia”, which allowed users to report illegal forest degradation due to deforestation, logging, or mining [85]. Users could submit images, notes about the incident, and the location where it took place. The information was then used by control and inspection agencies to help identify the actors responsible for the activities. The application had two modules. One is a mobile application that allows civilians to submit complaints anonymously and securely. The second was a web application restricted to environmental monitoring agencies, which could plan their response based on the information received from the application. These data were used in conjunction with satellite imagery to ensure that the proposed model covers as many demand points as possible, which is relevant due to the strategic nature of the problem presented.
4.2.3. Environmental Emergencies Incidence Rate
The incidence rates are calculated considering fire and deforestation incidents that happened in 2020 and 2021. Given that fires and areas with recent deforestation make the forest more vulnerable [26,77], these are locations that should be covered. For modeling purposes, the census block groups of Ji-Paraná are the locations to be covered, and the centroids of each census block group are the locations of the emergencies, an approach that is commonly used when dealing with strategic decision problems [35,36]. The average daily demand is calculated per census block group for each environmental emergency. The fire data from the Guardiões app are double counted to account for the missing 2021 data. About 90% of the emergencies recorded in Ji-Paraná over 2020–2021 occurred during the peak of the dry season, in the months of August, September, and October. Thus, the daily average demand is calculated by dividing all the occurrences in the year by three months. This would over-count the demand, because it would consider incidents that happened outside of the planning period. However, because these are areas with fragmentation due to the fires and recent deforestation, they are more likely to have an emergency in the future, so it is not unreasonable to include them in the demand set. All geospatial operations to find the incidence rate are performed using QGIS Desktop 3.22.0 using the “Centroid, Points in Polygon Analysis” and “Intersection” features, similar to the method described in [86].
The alerts for emergencies in each census block group are assumed to follow a Poisson arrival process with the rate equal to the average daily number of occurrences per census block group. This is a common assumption when studying fire distributions [87,88] that is here extended to deforestation for simplicity. All census block groups in the rural area that had an emergency in the past year are also required to be covered for at least one incident per day, even if the resulting demand distribution for the given target coverage is zero. This is performed to ensure that regions in remote areas, which may only recently have started to deal with deforestation, are still covered in a worst-case scenario.
4.3. Candidate Base Stations
In Ji-Paraná, most of the existing emergency response stations are based in the southwestern portion of the municipality, known as the city of Ji-Paraná. However, even though the rural region of the municipality has many environmental emergencies near indigenous territories and permanent protection areas, in discussion with first responders, they mentioned that it is not unusual for the response times in those areas to be as much as 3 h, while in the city, the target response time is 30 min. To address the high response times for incidents in rural regions, the Ji-Paraná Fire Brigade often hires temporary workers to be located in regions outside of the city center, to respond to emergencies during the dry season.
Given that there is flexibility in the set of candidate locations, a modified version of the finite dominating set methodology (FDS) is used to determine candidate mobile base stations. The finite dominating set is an approach to reduce an infinite number of potential launch sites to a finite discrete set to improve the computational tractability of the model [35,36]. In the traditional implementation of the FDS method, locations are determined by finding the intersection points of all demand-covering circles, which contain all potential sites that can completely cover the demand [64]. This paper considers all intersections between the demand-covering circles for each original location of the emergencies and the municipality transportation network. The coverage radius will depend on the type of drone being used, because each drone has a different communication radius. The modified FDS is implemented in QGIS 3.22.0 using the Buffer and the Line Intersection features, resulting in 90,270 unique candidate base stations. For computational tractability, 474 locations are randomly selected, which is equivalent to three times the number of census block groups.
4.4. Drone Specifications
Brazil’s Civil Aviation National Agency (ANAC) regulates the use of drones in civilian applications [89]. Autonomous UAVs are prohibited in Brazil for civilian use, but the military drone missions for civilian applications are not subject to the same restrictions. Remotely piloted drones flying beyond the visual line of sight (BVLOS) are allowed with special authorization from ANAC and so are flights with a maximum flying radius of 30 km [90].
The present model assumes that drones will live-stream images from the incident location to a base station, so that first responders can gather the information necessary to support the decision-making process. Drones will also be equipped with sensors, cameras, and on-board microprocessors that can help it fly to its destination without needing an operator and gather information about the environmental emergencies [52]. The set of possible drones include three that can be used for fires and deforestation missions and three that can be used solely for deforestation missions. Each drone has different specifications and the trade-offs between each one are considered in the optimization model. All drones are capable of flying above 20 meters, which is the average canopy height in Western Amazon [91]. The acquisition costs, as of January 2022, and specifications of the drones considered in this research were obtained by searching popular UAV online stores [92,93,94]. and Table 1 contains the specifications of the drones considered in the case study.
Each drone is assumed to have a predetermined number of spare batteries, which are also decision variables in the model. The batteries are assumed to be fully recharged at the beginning of each 24 h shift. Assuming that drones have an average lifetime of years [37], and considering Brazil’s interest rate of in January 2022, the annualized values of the drone and battery costs are calculated using the following correction factor:
Drone Deployment
A drone must fly to the location of an environmental emergency, which is determined based on alerts from a satellite monitoring system or whistle-blowers. Each environmental emergency location serves as a customer, while drones act as mobile servers. Drones fly to an incident location, gather the information, and then return to a base station. Drones have a limited service range due to endurance and transmission limitations, so it is required that a drone can only service locations that are within a certain distance from where it is placed. Assumptions include uniform drone speed, steady wind conditions, and weather that allows for drone flights.
The timeline of the drone deployment is as follows:
- An environmental emergency takes place.
- Environmental protection agents receive an alert of an environmental emergency from real-time monitoring systems, whistle-blowers, or bystanders.
- The drone is prepared for the flight. The period between the call arrival and the dispatch of the drone is the dispatch time.
- Drones are deployed from the launch station to the scene of the incident. The period between the dispatch until arrival at the scene is the flight time.
- The drone remains on scene to gather information about the incident (on-scene time).
- The drone flies back to the base station.
- Upon arrival, the drone must be reset and prepared for a new flight. The time to prepare the drone for a new flight after it returns from a mission is the reset time.
The model in this paper explicitly considers steps 4 to 6, which correspond to the on-scene time and the total equipment flying time.
4.5. Facility and Operator Cost
The drones are considered to be part of a temporary emergency response network, implemented to provide additional support during the dry season. In Ji-Paraná, it is already the case that first responders plan for additional capacity during the peak of the dry season, when most environmental emergencies take place. Given that drones are flexible, the bases would not require major infrastructure investments and a commercial warehouse would suffice. However, because the drone bases are assumed to be opened in locations where there may not be any available infrastructure, the facility costs will differ depending on the location of the base. For bases located in the city of Ji-Paraná, the cost will be estimated as the cost of renting a commercial warehouse for three months. For bases located in the rural region, the cost will be the construction cost of a commercial warehouse.
The facility costs are calculated using a piecewise function, considering centers of size 50 (type A) and 100 (type B) squared meters, which can allocate 5 and 10 drones, respectively. It is assumed that an operator can control at most five drones simultaneously. These numbers are lower than the ones used in a recent application of drones for tourism [37]. The reduced values are used because, even though the flights are expected to be autonomous, these are still emergency response missions that may require some oversight, to ensure smooth data collection. To estimate operator salaries, data from a recent selection process for the fire department of Ji-Paraná for temporary engineers are used; it offered a monthly salary of USD 981.33 (BRL 5531.38) [95].
The rent per square meter of a commercial facility in Ji-Paraná was BRL 15.46 in 2014 [96]. Adjusting that value for inflation and converting to American dollars results in a rent per square meter price of USD 5.61 in January 2022. Assuming three months of rent for the duration of the dry season, this results in a yearly facility cost of USD 5049. The construction cost per square meter for a base located in the rural area was USD 167.52 (BRL 944.22) in November of 2021 [97]. All values were annualized using Equation (17), considering an interest rate of 9.25%.
5. Results
The model is implemented using Gurobi on Python, a state-of-the-art MIP solver used in many works in the related literature regarding drone network strategical planning [35,36,37,62]. The MIP gap is set to 0.01%, and the maximal run time is set to 3600 s. Default parameters are assumed for the Gurobi Solver otherwise.
The following are redundant valid constraints and one auxiliary variable that are added to speed up the optimization process.
For all instances, it is assumed that min for all environmental emergencies, and the effective flying time for each drone is set at . A maximum of or drones can be placed in facility types A and B, respectively, and there are no limits on the number of batteries that can be stored in each facility. Additionally, the number of missions that an operator can oversee in a given day is restricted to 15, and the maximum number of drones that an operator can manage simultaneously is set at . The coverage levels are used to generate the demand per day for each scenario, by finding the quantile for the Poisson distribution with the corresponding incidence rate. The results consider an operation that runs 24 h and 7 days per week during the dry season and the number of operators is estimated per 12 h shift. All scenarios assume that the operating conditions are favorable for drone flights.
5.1. Scenarios
The sensitivity analysis is performed based on the target coverage, the demand scenario, and the maximal number of batteries per drone. The scenarios considered are illustrated in Figure 3.
The following instances are considered:
- Assuming that the number of incidents in each census block group follows a Poisson distribution with rate , the impact of varying the incidence rate is studied. In the base case (demand scenario 1), it is assumed that for each census block group the average incidence rate is equal to the observed values for the 2020 and 2021 dry seasons. Additional incidence rates of 3 (demand scenario 3) and (demand scenario 5) are considered for each census block group. The network configuration is then estimated when under the three target coverage objectives.
- To understand the impact of the battery capacity per drone, it is assumed that the demand is equal to the average observed () and three target coverage objectives are considered, with different limits on the number of batteries allowed per drone. Considering the additional batteries explicitly is important because drones can take about 60–90 min to recharge, so simply assuming that a drone is ready to fly when called is not sufficient, given the downtime associated with recharging the batteries.
5.1.1. Impact of Varying the Maximum Backup Battery
To study the impact of varying the maximum number of available batteries and the impact on the total network cost, the model is solved for instances that consider a different maximal number of additional batteries, for an incidence rate of per each census block group, and considering three different target coverage levels. The summarized results are displayed in Table 2 and Table 3.
Overall, increasing the number of available backup batteries tends to result in a network with a lower cost without significantly affecting the range of response times (RT). The cost is reduced, primarily, because, when backup batteries are allowed, the number of drones needed is significantly reduced, and the additional batteries needed are overall cheaper. This result indicates that considering additional batteries explicitly can allow finding drone networks that are much cheaper than when additional batteries are not allowed. Even when the number of backup batteries is five, that would still mean that a drone could have its flying capacity increased fivefold for each working day. For the most part, most base stations have five drones or less, but bases with more than five drones are required in some instances when the target coverage is 99%.
Table 3 shows that only the drones with firefighting and surveillance capability are selected, with drone type 3 being preferred, followed by drone types 5 and 4.
Figure 4, Figure 5 and Figure 6 illustrate the actual response time of the network for each scenario considered. The dots represent the original location of the emergencies, and the triangles represent the base stations that were opened in this scenario. The colored bar represents the response time to the emergency in the optimal solution, in minutes.
Although the range of response times is similar across different scenarios, the response times increase on average as the number of backup batteries increases. This happens because when more backup batteries are allowed, fewer base stations are selected. Additionally, when considering the centroids as demand points as in the optimization, the maximum response time is under 11 min. However, the actual response times of the emergencies, based on the bases assigned to cover a given census block group in the optimal solution, can be as high as 20 min. Although a response time of 20 min is still an improvement to the current levels in the region, it is also twice what had been observed in the optimization model, which can be problematic in congested networks.
5.1.2. Impact of Varying the Incidence Rate
To understand how the network configuration is affected by different demand scenarios, the model is solved assuming varying target coverage levels and keeping the maximal number of batteries fixed at . Table 4 and Table 5 summarize the results for the instances considered.
As expected, the cost of the network increases as the incident rate increases, and it also increases as the target coverage increases. In fact, the total number of batteries, drones, operators, and facilities all increase monotonically as the demand and target coverage increases. Base type A dominates the solution, but some bases of type B are opened in more congested scenarios. The maximum response times are comparable across all scenarios, with a maximum overall time of 12.8 min.
Table 5 summarizes the distribution of drones in the network for the different demand scenarios and target coverage levels. Although here drones of type 3 and 5 still dominate, followed by drone type 4, in certain instances it is optimal to use drones of type 0 and 1. Still, overall, for the drone types considered, it appears that drones that can be used for different types of missions are preferable to using drones that can only be used for a single mission.
Figure 7, Figure 8 and Figure 9 illustrate the actual response time of the network for each scenario considered. In general, as the demand increases, more bases are opened, so the actual response times are reduced as the incident rate increases. However, as observed in Section 5.1.1, the actual response times considering the location of the emergencies is at times over twice what was estimated in the optimal solution using the center of the census block groups.
5.2. Key Findings and Implications for Practical Implementation
The sections above described the results of the optimization model and relevant practical implications, which are summarized in this section. First, this paper sought to propose a strategic drone-based facility location–allocation problem to be used by practitioners and first responders in the Amazon Rainforest region. This problem stems from a practical need, given that drones are already used in the region to support the environmental emergency response, and this paper is the first to propose a mathematical formulation for the decision problem faced by central planners.
The sensitivity analysis results indicate that considering additional batteries could significantly reduce the cost of the network. That is because stocking up on batteries allows for a reduction in the total number of drones needed for the network to operate. This was not explicitly modeled in the related works [37,63,98], but the proposed formulation introduces a way to take batteries into consideration in the model, which is particularly relevant in strategic planning contexts when planners would need to know in advance the number of batteries required to proceed with the acquisition of the necessary equipment.
However, when more batteries are allowed in the system, fewer bases are opened and the response times increase. Still, the response times observed in all the scenarios are still considerably smaller than the ones observed in the region for similar emergencies. In Ji-Paraná, the response time in a rural area is around 3 h, whereas in urban areas that number is around 30 min. In our proposed design, no location is more than 20 min away from its assigned base station, highlighting the potential for drones to help improve the response to environmental emergencies in the region.
The model introduced in this paper also considers multiple types of drones to respond to different types of emergencies. Generally, drones that can be used for multiple types of emergencies are preferred to those that can only be used for a single type of emergency. Intuitively, this makes sense as it means that the optimal solution favors drones that are not as likely to be idle given that they can be assigned to cover all types of emergencies considered. As the network becomes more congested, single-emergency drones start to be considered in the optimal solution given that, in such instances, the amount of emergencies of a specific type justified acquiring such equipment.
Additionally, by considering the trade-offs of different types of drones in the model, particularly when it relates to cost and performance, the proposed model allows for selecting the most cost-effective drones, even if at a first glance it is not clear that choosing a certain kind of drone would be the most economical alternative.
Given the strategic nature of the decision problem considered in this paper, algorithmic methods to improve the solution time are out of the scope of this research. However, the average MIP gap after one hour is around 4% across the scenarios considered, which is comparable to values found in the related experiments [63] and still allows to find solutions that considerably improve the response time of the network.
Lastly, the sensitivity analysis also supports the validity of the proposed approach. That is, higher demand corresponds to larger networks, higher coverage implies increased total costs, and more batteries imply a reduced total cost at the expense of higher response times. This shows that the proposed model behaves as expected and provides further support to its practical relevance.
6. Conclusions
Deforestation in the Brazilian Amazon is reaching a tipping point, beyond which the rainforest may change permanently, making it difficult to reach the goals outlined in the Paris agreement. This is happening due to the simultaneous threats of deforestation and forest degradation by illegal actors. New technologies such as drones can help law enforcement and first responders plan better environmental emergency response missions by collecting relevant information in a timely manner. In this context, this paper introduces a drone-based mobile facility location–allocation problem to find a minimal cost network of drones to support the environmental emergency response in the Brazilian Amazon during the dry season. The model takes into consideration multiple kinds of drones and explicitly considers the number of additional batteries. A case study is implemented for the municipality of Ji-Paraná, located in the western Amazonian state of Rondônia.
Allowing additional batteries significantly reduces the network cost, but the average response times may increase if the resulting solutions have fewer facilities. For the scenarios considered, smaller facilities are preferable to larger facilities, which are only opened when the congestion increases. The model also provides evidence that considering multiple drone types may allow finding networks with lower costs when the demand to be covered is high. However, for the drone types considered in our example, drones that could be used in different kinds of missions are preferable to drones that could only be used for a single mission. Lastly, the results indicate that although using the census block groups as proxies for the demand can help with model tractability, the estimated response times are much smaller than the actual response times observed when considering the real location of the emergencies.
This work is not without limitations. First, we use census block groups as proxies for the demand which can help with computational tractability [35,36] but may underestimate the actual response time of the network. This research addresses this issue by considering the actual response times when analyzing the optimal solution, which in the case study proposed was still providing a considerable improvement from the current response times in the region. However, future research could explore other clustering methods, given that the census block groups as defined by the government are highly heterogeneous.
Secondly, the proposed research only considers the deployment portion of the drone operation, but there are other aspects associated with the drone flight that could affect the optimal network configuration. For example, the proposed model assumes that the network operates without maintenance issues and does not consider battery performance reduction that could be an issue after multiple flights. Additionally, although the simplifications we implemented are commonly used in the drone deployment literature [35,36,37], other aerodynamic aspects of the drone flights could impact the implementation in real life. Approaches such as the robust optimization model described in [99] could enhance the proposed model by incorporating uncertainty about unknown random variables that can affect the performance of the drone flight. Queuing-based approaches such as the one described in [62,100] could also enhance the model by addressing the decision-dependent uncertainty that arises in location–allocation models, given that the location of the drone bases and allocations affect the mean service time.
Given the strategic, long-term nature of the proposed model, enhanced algorithmic solutions are out of the scope of this project and the proposed model was solved using state-of-the-art optimization software. However, heuristic solutions such as the ones described in [63,100,101] could be explored to improve the solution time.
Even in the face of its limitation, the strategic drone-based environmental emergency network model proposed in this paper provides a foundation from which future research may be conducted. Given that Brazil has a track record of reverting deforestation trends [102], this work provides decision-makers with tools that can help enforce and support policies to put the country on a positive path to reduce forest loss in the Brazilian Amazon.
Author Contributions
Conceptualization, J.C. and H.A.; Methodology, J.C.; Software, J.C.; Validation, J.C. and H.A.; Data curation, J.C.; Writing – original draft, J.C.; Writing – review & editing, J.C.; Visualization, J.C.; Supervision, H.A. All authors have read and agreed to the published version of the manuscript.
Funding
This research received no external funding.
Data Availability Statement
No new data was created or analyzed in this study. Any third party data was referred to as such throughout the text and can be downloaded from the corresponding sources. Restrictions apply to the availability of the “Guardiões da Amazônia” data. It was obtained via a data request submitted to the 17th Jungle Infantry Brigade.
Conflicts of Interest
The authors declare no conflict of interest.
References
- Zemp, D.; Schleussner, C.F.; Barbosa, H.; Rammig, A. Deforestation effects on Amazon forest resilience. Geophys. Res. Lett. 2017, 44, 6182–6190. [Google Scholar]
- Junior, C.H.S.; Pessôa, A.C.; Carvalho, N.S.; Reis, J.B.; Anderson, L.O.; Aragão, L.E. The Brazilian Amazon deforestation rate in 2020 is the greatest of the decade. Nat. Ecol. Evol. 2021, 5, 144–145. [Google Scholar]
- Albuquerque, I.; Alencar, A.; Angelo, C.; Azevedo, T.; Barcellos, F.; Coluna, I.; Junior, C.C.; Cremer, M.; Piatto, M.; Potenza, R.; et al. Análise Das Emissões Brasileiras de Gases de Efeito Estufa e Suas Implicações para as Metas do Clima do BRASIL 1970–2019; Technical Report; Observatório do Clima: Brasília, Brazil, 2020. [Google Scholar]
- Hosonuma, N.; Herold, M.; De Sy, V.; De Fries, R.S.; Brockhaus, M.; Verchot, L.; Angelsen, A.; Romijn, E. An assessment of deforestation and forest degradation drivers in developing countries. Environ. Res. Lett. 2012, 7, 044009. [Google Scholar]
- van Solinge, T.B. Deforestation crimes and conflicts in the Amazon. Crit. Criminol. 2010, 18, 263–277. [Google Scholar]
- Soares-Filho, B.; Moutinho, P.; Nepstad, D.; Anderson, A.; Rodrigues, H.; Garcia, R.; Dietzsch, L.; Merry, F.; Bowman, M.; Hissa, L.; et al. Role of Brazilian Amazon protected areas in climate change mitigation. Proc. Natl. Acad. Sci. USA 2010, 107, 10821–10826. [Google Scholar]
- USAID. Climate Risk Profile: Brazil; Technical Report; United States Agency for International Development: Washington, DC, USA, 2020. [Google Scholar]
- Intended Nationally Determined Contribution Towards Achieving The Objective of the United Nations Framework Convention on Climate Change; United Nations Framework Conventional on Climatic Change: Rio de Janeiro, Brazil, 2015.
- Piotrowski, M. Nearing the Tipping Point: Drivers of Deforestation in the Amazon Region; Inter-American Dialogue: Washington, DC, USA, 2019. [Google Scholar]
- Kröger, M. Deforestation, cattle capitalism and neodevelopmentalism in the Chico Mendes Extractive Reserve, Brazil. J. Peasant. Stud. 2020, 47, 464–482. [Google Scholar]
- Ostendorf, B.; Hilbert, D.W.; Hopkins, M.S. The effect of climate change on tropical rainforest vegetation pattern. Ecol. Model. 2001, 145, 211–224. [Google Scholar]
- Covey, K.; Soper, F.; Pangala, S.; Bernardino, A.; Pagliaro, Z.; Basso, L.; Cassol, H.; Fearnside, P.; Navarrete, D.; Novoa, S.; et al. Carbon and Beyond: The Biogeochemistry of Climate in a Rapidly Changing Amazon. Front. For. Glob. Chang. 2021, 4, 11. [Google Scholar] [CrossRef]
- Malhi, Y.; Roberts, J.T.; Betts, R.A.; Killeen, T.J.; Li, W.; Nobre, C.A. Climate change, deforestation, and the fate of the Amazon. Science 2008, 319, 169–172. [Google Scholar]
- Laurance, W.F.; Williamson, G.B. Positive feedbacks among forest fragmentation, drought, and climate change in the Amazon. Conserv. Biol. 2001, 15, 1529–1535. [Google Scholar]
- Lovejoy, T.E.; Nobre, C. Amazon Tipping Point. Sci. Adv. 2018, 4, 2340. [Google Scholar] [CrossRef]
- Fearnside, P.M. Brazil’s Amazon forest in mitigating global warming: Unresolved controversies. Clim. Policy 2012, 12, 70–81. [Google Scholar] [CrossRef]
- Sherstjuk, V.; Zharikova, M.; Sokol, I. Forest fire-fighting monitoring system based on UAV team and remote sensing. In Proceedings of the 38th IEEE International Conference on Electronics and Nanotechnology (ELNANO), Kyiv, Ukraine, 24–26 April 2018; pp. 663–668. [Google Scholar] [CrossRef]
- Ellwanger, J.H.; Kulmann-Leal, B.; Kaminski, V.L.; Valverde-Villegas, J.; Veiga, A.B.G.; Spilki, F.R.; Fearnside, P.M.; Caesar, L.; Giatti, L.L.; Wallau, G.L.; et al. Beyond diversity loss and climate change: Impacts of Amazon deforestation on infectious diseases and public health. An. da Acad. Bras. de Ciências 2020, 92, 1–33. [Google Scholar]
- Machado-Silva, F.; Libonati, R.; de Lima, T.F.M.; Peixoto, R.B.; de Almeida Franca, J.R.; Magalhães, M.d.A.F.M.; Santos, F.L.M.; Rodrigues, J.A.; DaCamara, C.C. Drought and fires influence the respiratory diseases hospitalizations in the Amazon. Ecol. Indic. 2020, 109, 105817. [Google Scholar]
- Nawaz, M.; Henze, D. Premature deaths in Brazil associated with long-term exposure to PM2. 5 from Amazon fires between 2016 and 2019. GeoHealth 2020, 4, e2020GH000268. [Google Scholar] [PubMed]
- Barcellos, C.; Xavier, D.; Hacon, S.; Artaxo, P.; Magalhães, M.; Matos, V.; Monteiro, A.M.; Feitosa, P. Queimadas na Amazônia e Seus Impactos na Saúde: A Incidência de Doenças Respiratórias no Sul Da Amazônia Aumentou; Fundação Oswaldo Cruz (Fiocruz): Rio de Janeiro, Brazil, 2019. [Google Scholar]
- Cano-Crespo, A.; Oliveira, P.J.; Boit, A.; Cardoso, M.; Thonicke, K. Forest edge burning in the Brazilian Amazon promoted by escaping fires from managed pastures. J. Geophys. Res. Biogeosci. 2015, 120, 2095–2107. [Google Scholar]
- Börner, J.; Kis-Katos, K.; Hargrave, J.; König, K. Post-crackdown effectiveness of field-based forest law enforcement in the Brazilian Amazon. PLoS ONE 2015, 10, e0121544. [Google Scholar]
- Carvalho, W.D.; Mustin, K.; Hilário, R.R.; Vasconcelos, I.M.; Eilers, V.; Fearnside, P.M. Deforestation control in the Brazilian Amazon: A conservation struggle being lost as agreements and regulations are subverted and bypassed. Perspect. Ecol. Conserv. 2019, 17, 122–130. [Google Scholar]
- Assunção, J.; Gandour, C.; Rocha, R. DETERring Deforestation in the Amazon: Environmental Monitoring and Law Enforcement; Climate Policy Initiative, Núcleo de Avaliaçao de Políticas Climáticas, Pontifica Universidade Católica (PUC): Rio de Janeiro, Brazil, 2017; p. 36. [Google Scholar]
- Cardil, A.; De-Miguel, S.; Silva, C.A.; Reich, P.B.; Calkin, D.; Brancalion, P.H.; Vibrans, A.C.; Gamarra, J.G.; Zhou, M.; Pijanowski, B.C.; et al. Recent deforestation drove the spike in Amazonian fires. Environ. Res. Lett. 2020, 15, 121003. [Google Scholar]
- Bustamante, M.M.; Nobre, C.A.; Smeraldi, R.; Aguiar, A.P.; Barioni, L.G.; Ferreira, L.G.; Longo, K.; May, P.; Pinto, A.S.; Ometto, J.P. Estimating greenhouse gas emissions from cattle raising in Brazil. Clim. Chang. 2012, 115, 559–577. [Google Scholar]
- Vargas-Ramírez, N.; Paneque-Gálvez, J. The global emergence of community drones (2012–2017). Drones 2019, 3, 76. [Google Scholar] [CrossRef]
- Finer, M.; Castañeda, C.; Novoa, S.; Paz, L. MAAP #126: Drones and Legal Action in the Peruvian Amazon; Amazon Conservation Association: Washington, DC, USA, 2016. [Google Scholar]
- Weisse, M.; Nogueron, R. Indigenous Communities Fend Off Invaders in the Peruvian Amazon; World Resources Institute: Washington, DC, USA, 2017. [Google Scholar]
- Teixeira, F. Flying High: Brazilian Tribe Keeps Watch over Forest with Drones; Reuters: New York, NY, USA, 2020. [Google Scholar]
- Nunes, T.J. Aplicação da Tecnologia Através de Drones no Corpo de Bombeiros Militar de Santa Catarina; Universidade Federal de Santa Catarina: Florianópolis, Brazil, 2017. [Google Scholar]
- Salles, E.B.C. A Incorporação de Drones Para Vigilância de Espaços Urbanos Brasileiros: O Uso Pelas Forças Armadas E Órgãos de Segurança Pública da União E Do Estado De Santa Catarina. Rev. Direito Governança Novas Tecnol. 2018, 4, 83–103. [Google Scholar] [CrossRef]
- Perazzoni, F. Amazonia, organized crime and illegal deforestation: Best practices for the protection of the Brazilian Amazon. In The 21st Century Fight for the Amazon; Springer: Berlin/Heidelberg, Germany, 2018; pp. 21–55. [Google Scholar]
- Pulver, A.; Wei, R.; Mann, C. Locating AED enabled medical drones to enhance cardiac arrest response times. Prehospital Emerg. Care 2016, 20, 378–389. [Google Scholar] [CrossRef]
- Pulver, A.; Wei, R. Optimizing the spatial location of medical drones. Appl. Geogr. 2018, 90, 9–16. [Google Scholar] [CrossRef]
- Ilkhanizadeh, S.; Golabi, M.; Hesami, S.; Rjoub, H. The Potential Use of Drones for Tourism in Crises: A Facility Location Analysis Perspective. J. Risk Financ. Manag. 2020, 13, 246. [Google Scholar] [CrossRef]
- Skorput, P.; Mandzuka, S.; Vojvodic, H. The use of Unmanned Aerial Vehicles for forest fire monitoring. In Proceedings of the 2016 IEEE International Symposium ELMAR, Zadar, Croatia, 12–14 September 2016; pp. 93–96. [Google Scholar] [CrossRef]
- Akhloufi, M.A.; Castro, N.A.; Couturier, A. UAVs for wildland fires. In Proceedings of the Autonomous Systems: Sensors, Vehicles, Security, and the Internet of Everything, International Society for Optics and Photonics, Orlando, FL, USA, 16–18 April 2018; Volume 10643, p. 106430M. [Google Scholar]
- Morello, T.F.; Ramos, R.M.; Anderson, L.O.; Owen, N.; Rosan, T.M.; Steil, L. Predicting fires for policy making: Improving accuracy of fire brigade allocation in the Brazilian Amazon. Ecol. Econ. 2020, 169, 106501. [Google Scholar] [CrossRef]
- Martínez-de Dios, J.R.; Merino, L.; Ollero, A.; Ribeiro, L.M.; Viegas, X. Multi-UAV Experiments: Application to Forest Fires. In Multiple Heterogeneous Unmanned Aerial Vehicles; Ollero, A., Maza, I., Eds.; Springer: Berlin/Heidelberg, Germany, 2007; pp. 207–228. [Google Scholar] [CrossRef]
- Akhloufi, M.A.; Castro, N.A.; Couturier, A. Unmanned Aerial Systems for Wildland and Forest Fires: Sensing, Perception, Cooperation and Assistance. Drones 2021, 5, 15. [Google Scholar] [CrossRef]
- Afghah, F.; Razi, A.; Chakareski, J.; Ashdown, J. Wildfire Monitoring in Remote Areas using Autonomous Unmanned Aerial Vehicles. In Proceedings of the IEEE INFOCOM 2019—IEEE Conference on Computer Communications Workshops (INFOCOM WKSHPS), Paris, France, 29 April–2 May 2019; pp. 835–840. [Google Scholar] [CrossRef]
- Tang, L.; Shao, G. Drone remote sensing for forestry research and practices. J. For. Res. 2015, 26, 791–797. [Google Scholar] [CrossRef]
- Ivošević, B.; Han, Y.G.; Cho, Y.; Kwon, O. The use of conservation drones in ecology and wildlife research. J. Ecol. Environ. 2015, 38, 113–118. [Google Scholar] [CrossRef]
- Wich, S.A.; Koh, L.P. Conservation Drones: Mapping and Monitoring Biodiversity; Oxford University Press: Oxford, UK, 2018. [Google Scholar]
- Caballero, L.C.; Saito, C.; Micheline, R.B.; Paredes, J.A. On the design of an UAV-based store and forward transport network for wildlife inventory in the western Amazon rainforest. In Proceedings of the 2017 IEEE XXIV International Conference on Electronics, Electrical Engineering and Computing (INTERCON), Cusco, Peru, 15–18 August 2017; pp. 1–4. [Google Scholar]
- Simoes, D.; Rodrigues, A.; Reis, A.B.; Sargento, S. Forest Fire Monitoring Through a Network of Aerial Drones and Sensors. In Proceedings of the 2020 IEEE International Conference on Pervasive Computing and Communications Workshops (PerCom Workshops), Austin, TX, USA, 23–27 March 2020; pp. 1–6. [Google Scholar]
- Cooper, L. Location-allocation problems. Oper. Res. 1963, 11, 331–343. [Google Scholar] [CrossRef]
- Daskin, M.S. What you should know about location modeling. Nav. Res. Logist. (NRL) 2008, 55, 283–294. [Google Scholar] [CrossRef]
- Berie, H.T.; Burud, I. Application of unmanned aerial vehicles in earth resources monitoring: Focus on evaluating potentials for forest monitoring in Ethiopia. Eur. J. Remote Sens. 2018, 51, 326–335. [Google Scholar] [CrossRef]
- Jiménez López, J.; Mulero-Pázmány, M. Drones for conservation in protected areas: Present and future. Drones 2019, 3, 10. [Google Scholar] [CrossRef]
- Martínez-de Dios, J.R.; Merino, L.; Caballero, F.; Ollero, A. Automatic forest-fire measuring using ground stations and unmanned aerial systems. Sensors 2011, 11, 6328–6353. [Google Scholar] [CrossRef]
- Dang-Ngoc, H.; Nguyen-Trung, H. Evaluation of Forest Fire Detection Model using Video captured by UAVs. In Proceedings of the 19th IEEE International Symposium on Communications and Information Technologies (ISCIT), Ho Chi Minh City, Vietnam, 25–27 September 2019; pp. 513–518. [Google Scholar] [CrossRef]
- Wing, M.G.; Burnett, J.D.; Sessions, J. Remote sensing and unmanned aerial system technology for monitoring and quantifying forest fire impacts. Int. J. Remote Sens. Appl. 2014, 4, 18–35. [Google Scholar] [CrossRef]
- Merino, L.; Caballero, F.; Martínez-de Dios, J.R.; Maza, I.; Ollero, A. An unmanned aircraft system for automatic forest fire monitoring and measurement. J. Intell. Robot. Syst. 2012, 65, 533–548. [Google Scholar] [CrossRef]
- Ferreira, P.R.; Boffo, F.S.; Bazzan, A.L. Using Swarm-GAP for distributed task allocation in complex scenarios. In Proceedings of the Massively Multi-Agent Technology: AAMAS Workshops, MMAS 2006, LSMAS 2006, and CCMMS 2007, Hakodate, Japan, 9 May 2006; Honolulu, HI, USA, 15 May 2007; Selected and Revised Papers 6. Springer: Berlin/Heidelberg, Germany, 2008; pp. 107–121. [Google Scholar]
- Alfeo, A.L.; Cimino, M.G.; Vaglini, G. Enhancing biologically inspired swarm behavior: Metaheuristics to foster the optimization of UAVs coordination in target search. Comput. Oper. Res. 2019, 110, 34–47. [Google Scholar] [CrossRef]
- Majd, A.; Ashraf, A.; Troubitsyna, E.; Daneshtalab, M. Integrating learning, optimization, and prediction for efficient navigation of swarms of drones. In Proceedings of the 26th IEEE Euromicro International Conference on Parallel, Distributed and Network-based Processing (PDP), Cambridge, UK, 21–23 March 2018; pp. 101–108. [Google Scholar]
- De Masi, G.; Ferrante, E. Quality-dependent adaptation in a swarm of drones for environmental monitoring. In Proceedings of the 2020 IEEE Advances in Science and Engineering Technology International Conferences (ASET), Dubai, United Arab Emirates, 4 February–9 April 2020; pp. 1–6. [Google Scholar]
- Schwarzrock, J.; Zacarias, I.; Bazzan, A.L.; de Araujo Fernandes, R.Q.; Moreira, L.H.; de Freitas, E.P. Solving task allocation problem in multi unmanned aerial vehicles systems using swarm intelligence. Eng. Appl. Artif. Intell. 2018, 72, 10–20. [Google Scholar] [CrossRef]
- Boutilier, J.J.; Brooks, S.C.; Janmohamed, A.; Byers, A.; Buick, J.E.; Zhan, C.; Schoellig, A.P.; Cheskes, S.; Morrison, L.J.; Chan, T.C. Optimizing a drone network to deliver automated external defibrillators. Circulation 2017, 135, 2454–2465. [Google Scholar] [CrossRef]
- Chauhan, D.; Unnikrishnan, A.; Figliozzi, M. Maximum coverage capacitated facility location problem with range constrained drones. Transp. Res. Part C Emerg. Technol. 2019, 99, 1–18. [Google Scholar] [CrossRef]
- Murray, A.T.; Tong, D. Coverage optimization in continuous space facility siting. Int. J. Geogr. Inf. Sci. 2007, 21, 757–776. [Google Scholar] [CrossRef]
- Murray, A.T. Geography in coverage modeling: Exploiting spatial structure to address complementary partial service of areas. Ann. Assoc. Am. Geogr. 2005, 95, 761–772. [Google Scholar] [CrossRef]
- Carlo, H.J.; Aldarondo, F.; Saavedra, P.M.; Torres, S.N. Capacitated continuous facility location problem with unknown number of facilities. Eng. Manag. J. 2012, 24, 24–31. [Google Scholar] [CrossRef]
- Plastria, F. Continuous location problems: Research, results and questions. In Facility Location: A Survey of Applications and Methods; Springer: Berlin/Heidelberg, Germany, 1995; pp. 85–127. [Google Scholar]
- ICMBio. Plano de Manejo da Reserva Biológica do Jaru; Instituto Chico Mendes de Conservação da Biodiversidade: Brasília, Brazil, 2010. [Google Scholar]
- Rudke, A.; Brito, A.; Carreira, J.; Bezerra, R.; Santos, A. Análise multitemporal da cobertura vegetal na reserva biológica do Jaru e zona de amortecimento, Rondônia. In Proceedings of the Anais XVI Simpósio Brasileiro De Sensoriamento Remoto-SBSR, Foz do Iguaçu, Brasil, 13–18 April 2013; pp. 1564–1570. [Google Scholar]
- IDESAM. Boletim do Desmatamento—Corredor Tupi-Mondé (RO/MT); Instituto de Conservação e Desenvolvimento Sustentável da Amazônia: Manaus, Brazil, 2018. [Google Scholar]
- Pfeifer, L.F.M.; Salman, A.K.D.; Taborda, J.M.M.; da Silva, G.M.; Andrade, J.S.; de Araujo, L.; de Souza, V.L.; Teixeira, O.d.S. Caracterização da pecuária em Rondônia. In Avanços da Pecuária na Amazônia: Pesquisas em Desenvolvimento Regional em RONDônia; Salman, A.K.D., Schlindwein, J.A., Pfeifer, L.F.M., Eds.; EDUFRO: Porto Velho, Brazil, 2021. [Google Scholar]
- Butt, N.; De Oliveira, P.A.; Costa, M.H. Evidence that deforestation affects the onset of the rainy season in Rondônia, Brazil. J. Geophys. Res. Atmos. 2011, 116, 15174. [Google Scholar] [CrossRef]
- ALVES, F.S.M.; FISCH, G.; VENDRAME, Í.F. Modificações do microclima e regime hidrológico devido ao desmatamento na Amazônia: Estudo de um caso em Rondônia (RO), Brasil. Acta Amaz. 1999, 29, 395. [Google Scholar] [CrossRef]
- Andrade Filho, V.S.d.; Artaxo Netto, P.E.; Hacon, S.d.S.; Carmo, C.N.d. Distribuição espacial de queimadas e mortalidade em idosos em região da Amazônia Brasileira, 2001–2012. Rev. Ciênc. Saúde Coletiva 2017, 22, 245–253. [Google Scholar] [CrossRef]
- Silva, L.B.; de Souza Mendes, D.F.; da Silva, R.M.P. Impactos da Poluição das Queimadas à Saúde Humana: Internações por Doenças Respiratórias no Estado de Rondônia entre 2009 e 2018. Rev. Multidiscip. Psicol. 2020, 14, 414–427. [Google Scholar]
- Rodrigues, P.C.d.O.; Ignotti, E.; Hacon, S.d.S. Distribuição espaço-temporal das queimadas e internações por doenças respiratórias em menores de cinco anos de idade em Rondônia, 2001 a 2010. Epidemiol. Serv. Saúde 2013, 22, 455–464. [Google Scholar] [CrossRef]
- Armenteras, D.; González, T.M.; Retana, J. Forest fragmentation and edge influence on fire occurrence and intensity under different management types in Amazon forests. Biol. Conserv. 2013, 159, 73–79. [Google Scholar] [CrossRef]
- Diniz, C.G.; de Almeida Souza, A.A.; Santos, D.C.; Dias, M.C.; da Luz, N.C.; de Moraes, D.R.V.; Maia, J.S.; Gomes, A.R.; da Silva Narvaes, I.; Valeriano, D.M.; et al. DETER-B: The new Amazon near real-time deforestation detection system. IEEE J. Sel. Top. Appl. Earth Obs. Remote. Sens. 2015, 8, 3619–3628. [Google Scholar] [CrossRef]
- INPE. Terrabrasilis—Downloads. Available online: http://terrabrasilis.dpi.inpe.br/downloads/ (accessed on 1 September 2021).
- Shimabukuro, Y.E.; dos Santos, J.R.; Formaggio, A.R.; Duarte, V.; Rudorff, B.F.T. The Brazilian Amazon monitoring program: PRODES and DETER projects. In Global Forest Monitoring from Earth Observation; Francis: Abingdon, UK, 2012; Achard, F., Hansen, M.C., Eds.; Taylor & Francis: Abingdon, UK, 2012; pp. 153–169. [Google Scholar]
- DGI. Perguntas Frequentes—Programa Queimadas. Available online: https://queimadas.dgi.inpe.br/queimadas/portal/informacoes/perguntas-frequentes (accessed on 10 January 2022).
- DGI. BDQueimadas—Programa Queimadas—INPE. Available online: https://queimadas.dgi.inpe.br/queimadas/bdqueimadas/ (accessed on 23 October 2021).
- Decreto no. 10.341, de 6 de Maio de 2020; Câmara dos Deputados: Brasília, Brazil, 2020.
- Decreto no. 10.394, de 10 de Junho de 2020; Câmara dos Deputados: Brasília, Brazil, 2020.
- Aplicativo Guardiões da Amazônia Recebe Denúncias de Crimes Ambientais. Available online: https://www.gov.br/pt-br/noticias/meio-ambiente-e-clima/2020/07/aplicativo-guardioes-da-amazonia-recebe-denuncias-de-crimes-ambientais (accessed on 15 September 2020).
- Custodio, J.E.; Lejeune, M.A. Spatiotemporal Data Set for Out-of-Hospital Cardiac Arrests. INFORMS J. Comput. 2021, 34, 669. [Google Scholar] [CrossRef]
- Boubeta, M.; Lombardía, M.J.; Marey-Pérez, M.; Morales, D. Poisson mixed models for predicting number of fires. Int. J. Wildland Fire 2019, 28, 237–253. [Google Scholar] [CrossRef]
- Podur, J.J.; Martell, D.L.; Stanford, D. A compound Poisson model for the annual area burned by forest fires in the province of Ontario. Environmetrics 2010, 21, 457–469. [Google Scholar] [CrossRef]
- ANAC. Orientações para Usuários de Drones; Agência Nacional de Aviação Civil: São José dos Campos, Brazil, 2017. [Google Scholar]
- ANAC. ANAC Autoriza Drone Com Capacidade Para Voar Distâncias De Até 30 km; Agência Nacional de Aviação Civil: São José dos Campos, Brazil, 2020. [Google Scholar]
- Asner, G.P.; Kellner, J.R.; Kennedy-Bowdoin, T.; Knapp, D.E.; Anderson, C.; Martin, R.E. Forest canopy gap distributions in the southern Peruvian Amazon. PLoS ONE 2013, 8, e60875. [Google Scholar] [CrossRef]
- UAV Systems International. Available online: https://uavsystemsinternational.com/ (accessed on 5 January 2022).
- DSLRPros. Available online: https://www.dslrpros.com/ (accessed on 5 January 2022).
- DJI Store. Available online: https://store.dji.com/ (accessed on 5 January 2022).
- CBMRO. EDITAL No 1/2021/CBM-CP; Corpo de Bombeiros Militar—CBM: Rondônia, Brazil, 2021. [Google Scholar]
- Silva, J.H.d. Análise Comparativa do Valor do Metro Quadrado dos Imóveis, Entre os Municípios de Cacoal, Ji-Paraná e Vilhena, no Estado de Rondônia; Universidade Federal de Rondônia: Cacoal, Brazil, 2014. [Google Scholar]
- SINDUSCON-RO. Custos Unitários Básicos de Construção. Available online: http://sindusconro.com.br/home/?wpfb_dl=450 (accessed on 9 September 2022).
- Zhu, T.; Boyles, S.D.; Unnikrishnan, A. Two-stage robust facility location problem with drones. Transp. Res. Part C Emerg. Technol. 2022, 137, 103563. [Google Scholar] [CrossRef]
- Chauhan, D.R.; Unnikrishnan, A.; Figliozzi, M.; Boyles, S.D. Robust maximum coverage facility location problem with drones considering uncertainties in battery availability and consumption. Transp. Res. Rec. 2021, 2675, 25–39. [Google Scholar] [CrossRef]
- Shavarani, S.M.; Mosallaeipour, S.; Golabi, M.; İzbirak, G. A congested capacitated multi-level fuzzy facility location problem: An efficient drone delivery system. Comput. Oper. Res. 2019, 108, 57–68. [Google Scholar] [CrossRef]
- Al-Rabiaah, S.; Hosny, M.; AlMuhaideb, S. An efficient greedy randomized heuristic for the maximum coverage facility location problem with drones in healthcare. Appl. Sci. 2022, 12, 1403. [Google Scholar] [CrossRef]
- Assunção, J.; Gandour, C.; Rocha, R. Deforestation slowdown in the Brazilian Amazon: Prices or policies? Environ. Dev. Econ. 2015, 20, 697–722. [Google Scholar] [CrossRef]
Figure 1.
Map of Ji-Paraná (source: Google Maps).

Figure 2.
Fire and Deforestation Occurrences in 2020–2021 per Census Block Group.

Figure 3.
Scenarios Considered in the Case Study.

Figure 4.
Network configuration when varying maximal battery capacity, 90% coverage.

Figure 5.
Network configuration when varying maximal battery capacity, 95% coverage.

Figure 6.
Network configuration when varying maximal battery capacity, 99% coverage.

Figure 7.
Network configuration when varying incidence rate, 90% coverage.

Figure 8.
Network configuration when varying incidence rate, 95% coverage.

Figure 9.
Network configuration when varying incidence rate, 99% coverage.


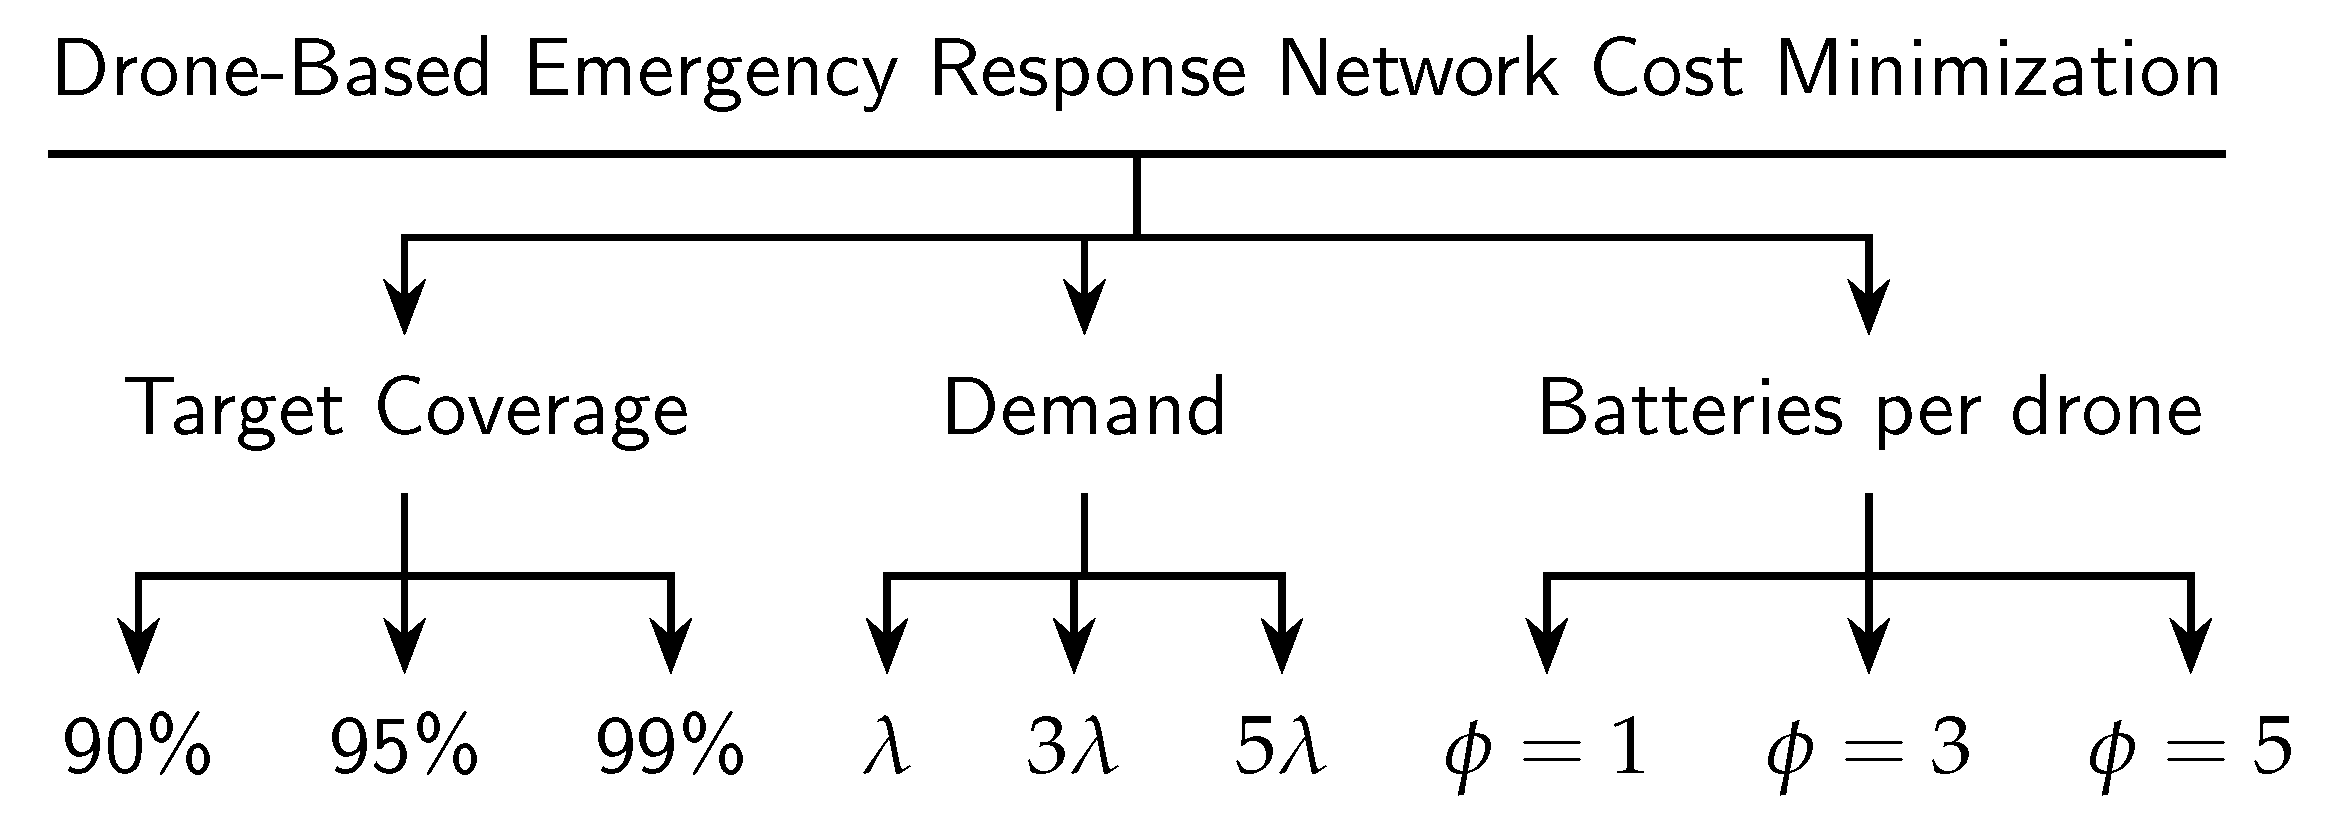
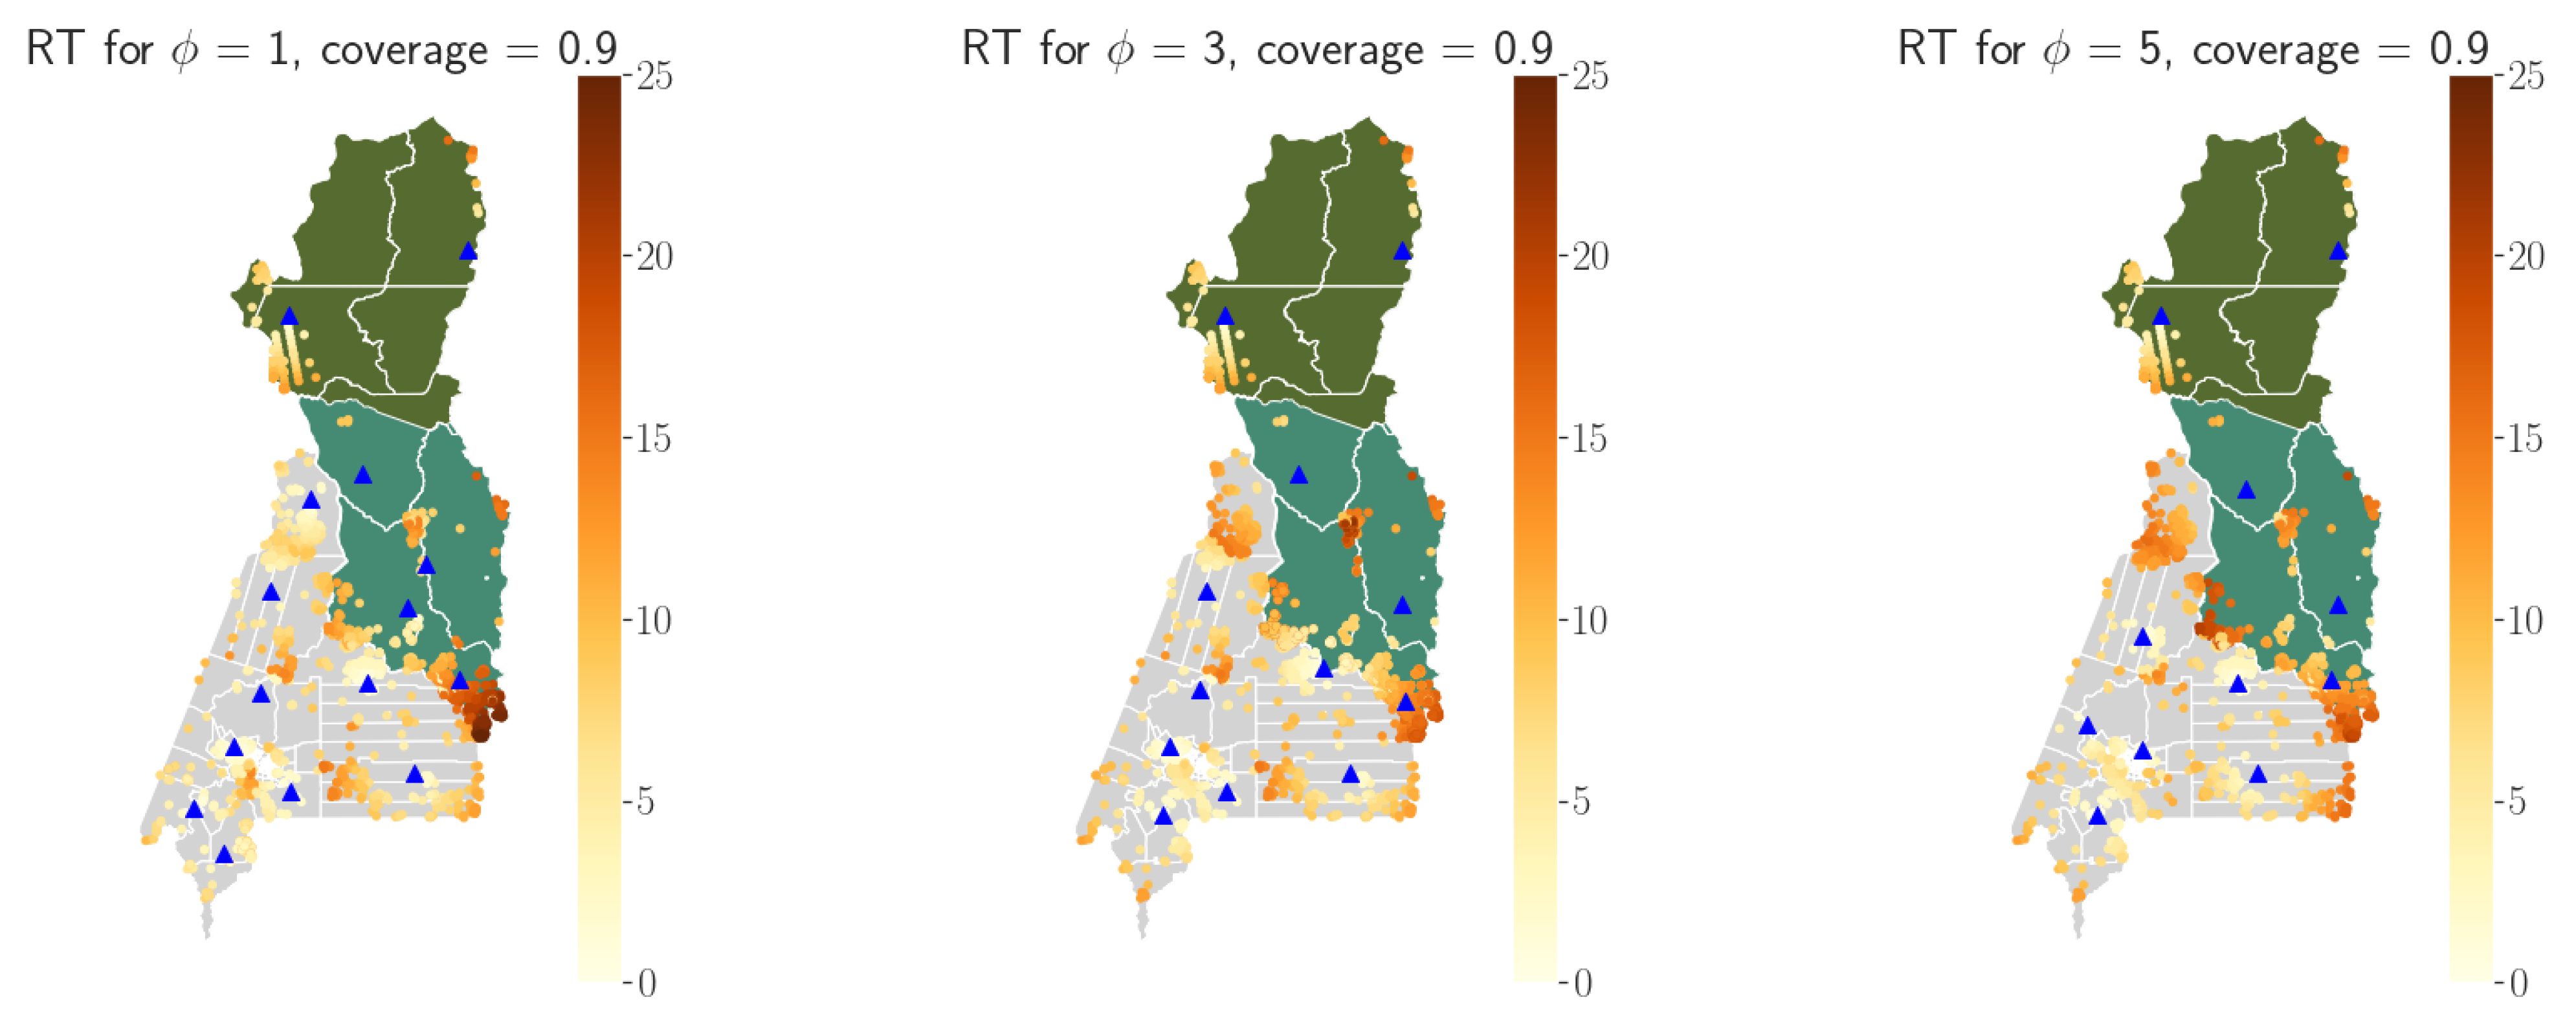
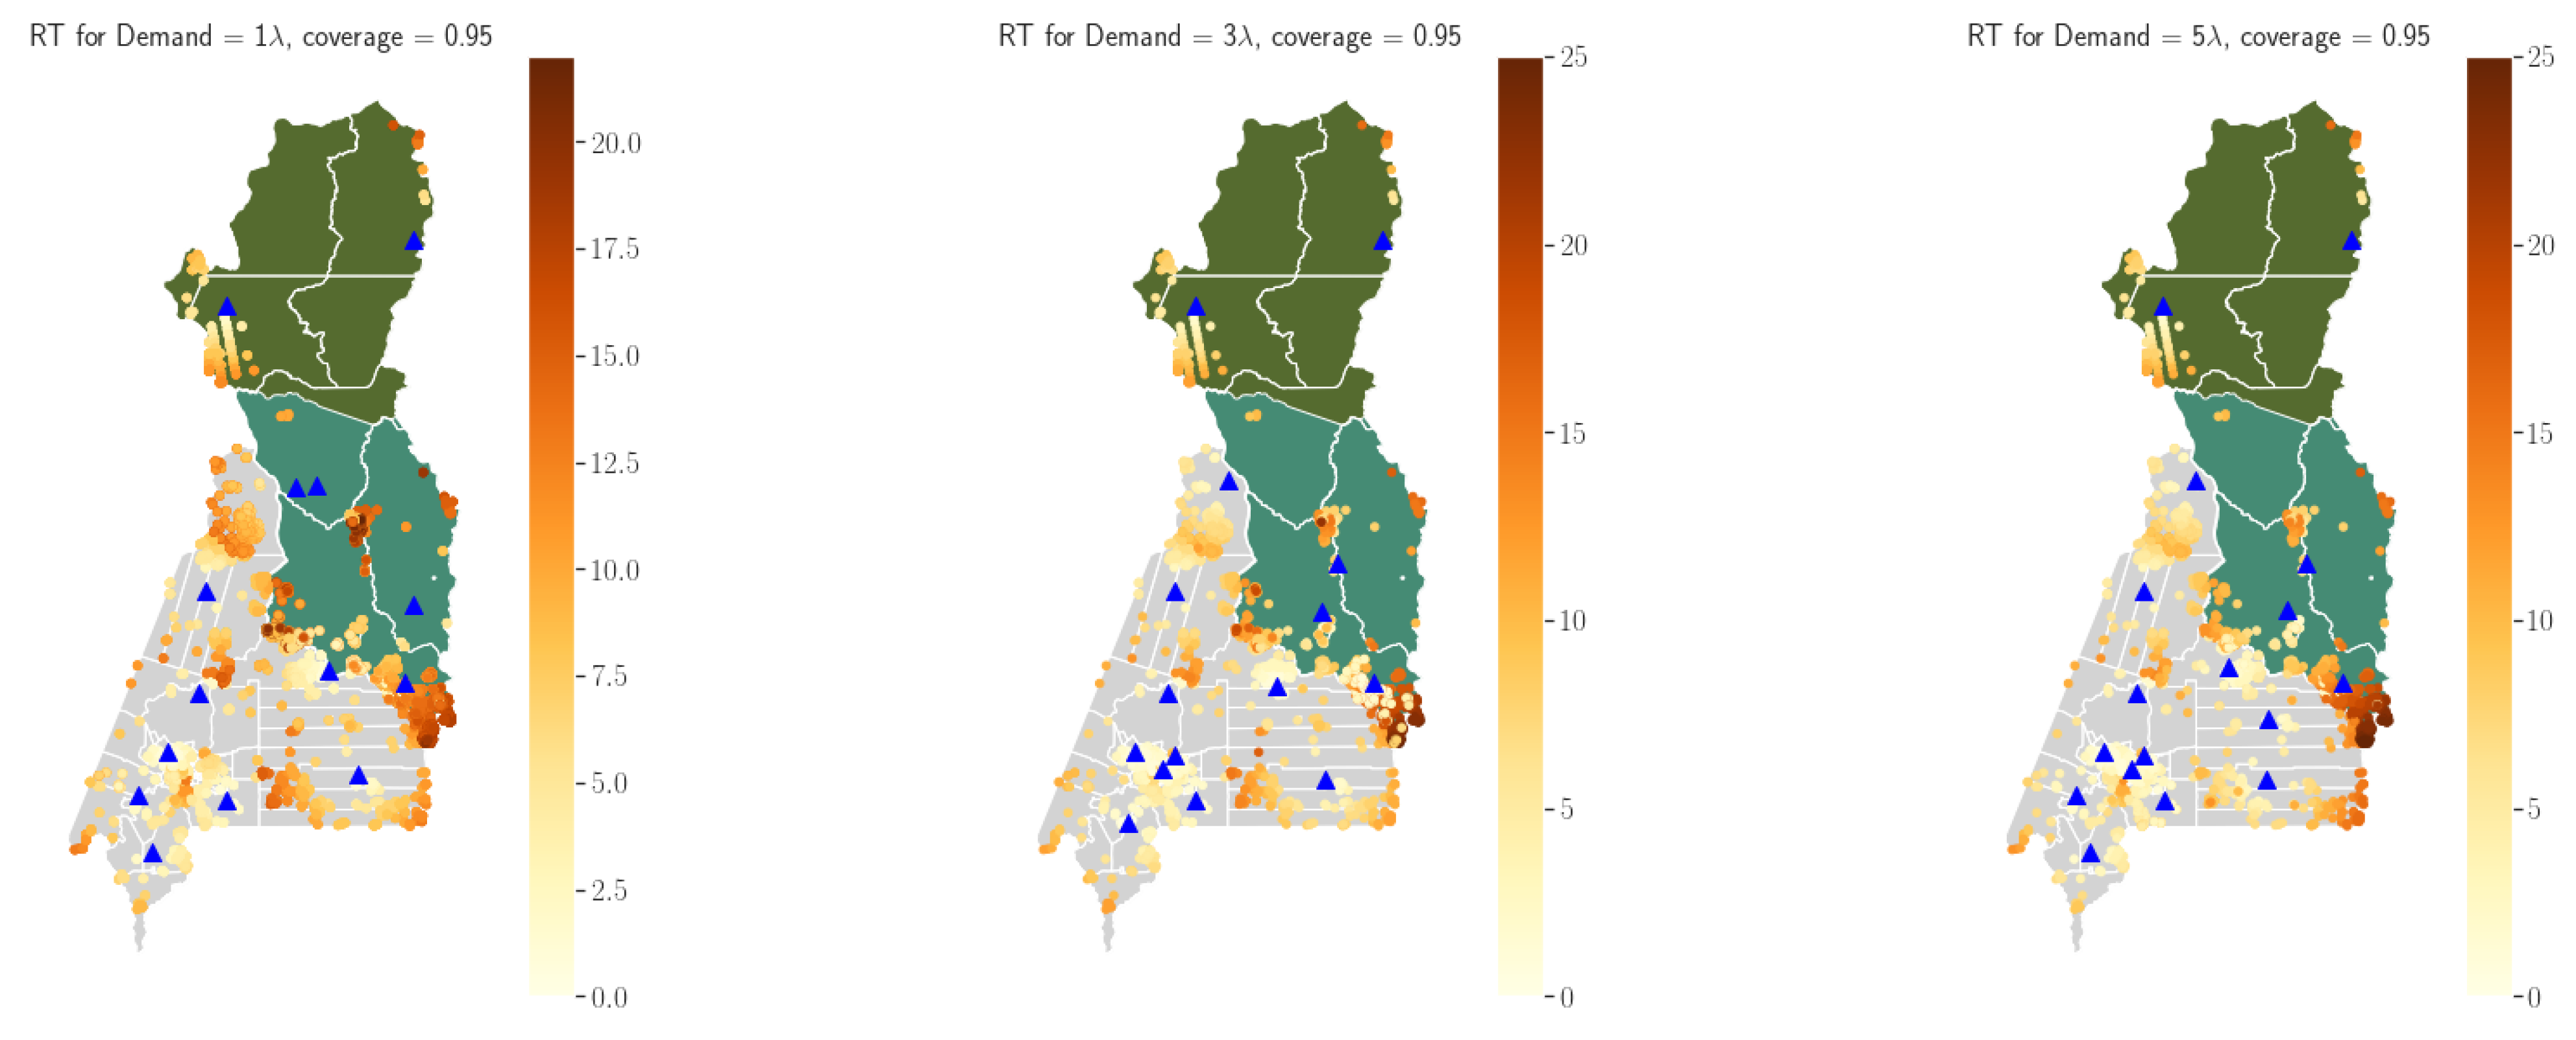
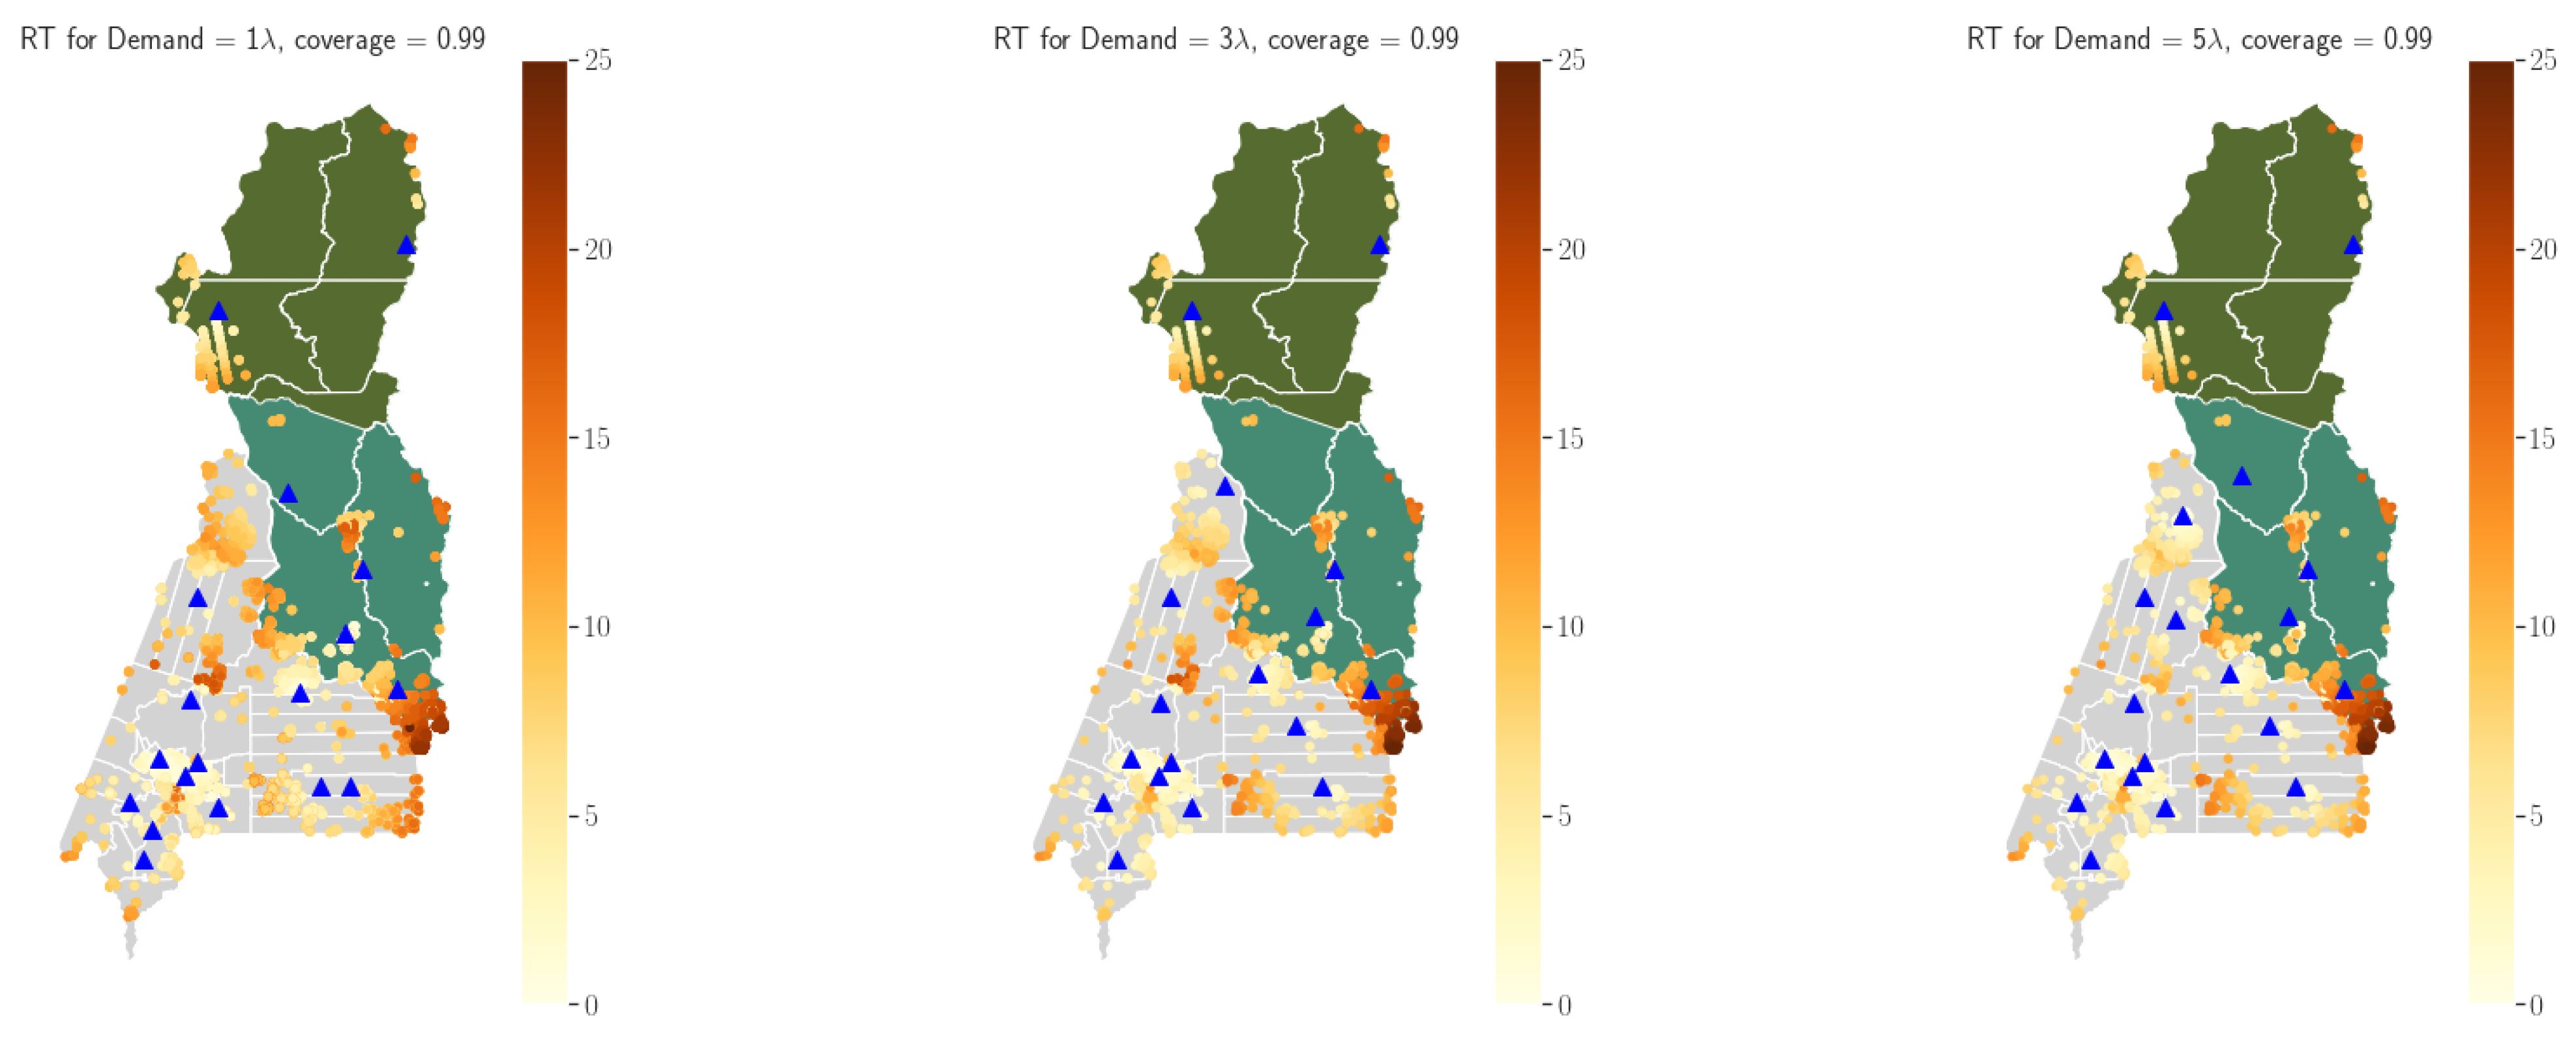
Table 1.
Drones considered in the case study and their specifications.
| Drone Model | Speed (m/s) | Max Range (m) | Endurance (s) | Battery Cost (USD) | Cost (USD) | Application |
|---|---|---|---|---|---|---|
| (0) Skywalker Ready To Fly v2.2 | 25 | 20,000 | 3600 | 400 | 3400 | Surveillance |
| (1) Talon GT | 28 | 15,000 | 2700 | 300 | 2000 | Surveillance |
| (2) Believer | 20 | 20,000 | 7200 | 400 | 4600 | Surveillance |
| (3) Autel Evo II Dual 640 | 15 | 8800 | 2280 | 219 | 10,500 | Fire and Surveillance |
| (4) DJI Matrice 300 RTK | 23 | 15,000 | 3300 | 700 | 25,500 | Fire/Surveillance |
| (5) DJI Mavic 2 Enterprise Advanced | 20 | 10,000 | 1860 | 184 | 6500 | Fire/Surveillance |
Table 2.
Summary of Results when Varying Battery Capacity.
| Coverage | Batteries | Drones | Operators | Cost (USD) | Total Demand | Base A | Base B | Max RT (s) | Min RT (s) | MIP Gap | |
|---|---|---|---|---|---|---|---|---|---|---|---|
| 0.9 | 1 | 29 | 36 | 15 | 198,867 | 15 | 15 | - | 617 | 50 | 4% |
| 3 | 42 | 18 | 12 | 158,557 | 12 | 12 | - | 641 | 57 | 7% | |
| 5 | 50 | 13 | 11 | 137,272 | 11 | 11 | - | 641 | 50 | 3% | |
| 0.95 | 1 | 40 | 44 | 16 | 226,112 | 16 | 16 | - | 617 | 42 | 3% |
| 3 | 59 | 24 | 14 | 176,499 | 13 | 13 | - | 638 | 54 | 6% | |
| 5 | 67 | 16 | 12 | 151,179 | 11 | 11 | - | 641 | 42 | 2% | |
| 0.99 | 1 | 73 | 76 | 21 | 341,858 | 18 | 15 | 3 | 617 | 13 | 3% |
| 3 | 107 | 38 | 19 | 240,816 | 15 | 23 | 2 | 641 | 14 | 4% | |
| 5 | 118 | 28 | 19 | 211,962 | 14 | 14 | - | 641 | 13 | 5% |
Table 3.
Total Number of Drones and Batteries per Drone Type when Varying Number of Backup Batteries.
Table 3.
Total Number of Drones and Batteries per Drone Type when Varying Number of Backup Batteries.
| Batteries | Drone Types | ||||||
|---|---|---|---|---|---|---|---|
| Coverage | 3 | 4 | 5 | 3 | 4 | 5 | |
| 0.9 | 1 | 28 | 0 | 1 | 34 | 0 | 2 |
| 3 | 30 | 0 | 12 | 13 | 0 | 5 | |
| 5 | 37 | 0 | 13 | 9 | 0 | 4 | |
| 0.95 | 1 | 38 | 1 | 1 | 41 | 1 | 2 |
| 3 | 52 | 0 | 7 | 20 | 0 | 4 | |
| 5 | 49 | 5 | 13 | 11 | 1 | 4 | |
| 0.99 | 1 | 71 | 1 | 1 | 73 | 1 | 2 |
| 3 | 103 | 6 | 14 | 43 | 2 | 6 | |
| 5 | 104 | 0 | 14 | 24 | 0 | 4 | |
Table 4.
Summary of Results when Varying Incidence Rate.
| Coverage | Demand Scenario | Batteries | Drones | Operators | Cost (USD) | Total Demand | Base A | Base B | Max RT (s) | Min RT (s) | MIP Gap |
|---|---|---|---|---|---|---|---|---|---|---|---|
| 0.9 | 1 | 42 | 18 | 12 | 158,557 | 12 | 12 | - | 641 | 57 | 7% |
| 0.9 | 3 | 84 | 33 | 15 | 203,794 | 13 | 13 | - | 704 | 43 | 4% |
| 0.9 | 5 | 121 | 46 | 21 | 260,032 | 16 | 15 | 1 | 629 | 15 | 5% |
| 0.95 | 1 | 59 | 24 | 14 | 176,499 | 13 | 13 | - | 638 | 54 | 6% |
| 0.95 | 3 | 105 | 41 | 18 | 238,624 | 15 | 15 | - | 768 | 15 | 4% |
| 0.95 | 5 | 148 | 56 | 24 | 300,631 | 17 | 16 | 1 | 751 | 15 | 3% |
| 0.99 | 1 | 107 | 38 | 19 | 240,816 | 15 | 23 | 2 | 641 | 14 | 4% |
| 0.99 | 3 | 158 | 58 | 26 | 314,231 | 17 | 15 | 2 | 647 | 15 | 3% |
| 0.99 | 5 | 204 | 74 | 33 | 380,361 | 19 | 16 | 3 | 617 | 15 | 3% |
Table 5.
Total number of drones and batteries per drone type when varying incidence rate.
| Batteries | Drone Types | ||||||||||
|---|---|---|---|---|---|---|---|---|---|---|---|
| Coverage | Demand Scenario | 0 | 1 | 3 | 4 | 5 | 0 | 1 | 3 | 4 | 5 |
| 0.9 | 1 | 0 | 0 | 30 | 0 | 12 | 0 | 0 | 13 | 0 | 5 |
| 3 | 1 | 0 | 76 | 0 | 7 | 1 | 0 | 28 | 0 | 4 | |
| 5 | 0 | 0 | 113 | 3 | 5 | 0 | 0 | 42 | 1 | 3 | |
| 0.95 | 1 | 0 | 0 | 52 | 0 | 7 | 0 | 0 | 20 | 0 | 4 |
| 3 | 1 | 0 | 97 | 0 | 7 | 2 | 0 | 35 | 0 | 3 | |
| 5 | 1 | 0 | 142 | 0 | 5 | 1 | 0 | 52 | 0 | 3 | |
| 0.99 | 1 | 0 | 0 | 123 | 6 | 14 | 0 | 0 | 43 | 2 | 6 |
| 3 | 0 | 0 | 148 | 6 | 4 | 1 | 0 | 52 | 2 | 3 | |
| 5 | 0 | 2 | 199 | 0 | 3 | 0 | 1 | 71 | 0 | 2 | |
Disclaimer/Publisher’s Note: The statements, opinions and data contained in all publications are solely those of the individual author(s) and contributor(s) and not of MDPI and/or the editor(s). MDPI and/or the editor(s) disclaim responsibility for any injury to people or property resulting from any ideas, methods, instructions or products referred to in the content. |
© 2023 by the authors. Licensee MDPI, Basel, Switzerland. This article is an open access article distributed under the terms and conditions of the Creative Commons Attribution (CC BY) license (https://creativecommons.org/licenses/by/4.0/).
Share and Cite
MDPI and ACS Style
Custodio, J.; Abeledo, H. Drone-Based Environmental Emergency Response in the Brazilian Amazon. Drones 2023, 7, 554. https://doi.org/10.3390/drones7090554
AMA Style
Custodio J, Abeledo H. Drone-Based Environmental Emergency Response in the Brazilian Amazon. Drones. 2023; 7(9):554. https://doi.org/10.3390/drones7090554
Chicago/Turabian StyleCustodio, Janiele, and Hernan Abeledo. 2023. "Drone-Based Environmental Emergency Response in the Brazilian Amazon" Drones 7, no. 9: 554. https://doi.org/10.3390/drones7090554