

Three-Dimensional Indoor Positioning Scheme for Drone with Fingerprint-Based Deep-Learning Classifier


1
Division of Electronics and Electrical Engineering, Dongguk University, Seoul 04620, Republic of Korea
2
School of Physics and Electronic Engineering, Qilu Normal University, Jinan 250200, China
*
Author to whom correspondence should be addressed.
Drones 2024, 8(1), 15; https://doi.org/10.3390/drones8010015
Submission received: 17 November 2023
/
Revised: 29 December 2023
/
Accepted: 5 January 2024
/
Published: 9 January 2024
(This article belongs to the Special Issue Drones Navigation and Orientation)
Abstract
:Unmanned aerial vehicles (UAVs) hold significant potential for various indoor applications, such as mapping, surveillance, navigation, and search and rescue operations. However, indoor positioning is a significant challenge for UAVs, owing to the lack of GPS signals and the complexity of indoor environments. Therefore, this study was aimed at developing a Wi-Fi-based three-dimensional (3D) indoor positioning scheme tailored to time-varying environments, involving human movement and uncertainties in the states of wireless devices. Specifically, we established an innovative 3D indoor positioning system to meet the localisation demands of UAVs in indoor environments. A 3D indoor positioning database was developed using a deep-learning classifier, enabling 3D indoor positioning through Wi-Fi technology. Additionally, through a pioneering integration of fingerprint recognition into wireless positioning technology, we enhanced the precision and reliability of indoor positioning through a detailed analysis and learning process of Wi-Fi signal features. Two test cases (Cases 1 and 2) were designed with positioning height intervals of 0.5 m and 0.8 m, respectively, corresponding to the height of the test scene for positioning simulation and testing. With an error margin of 4 m, the simulation accuracies for the dimension reached 94.08% (Case 1) and 94.95% (Case 2). When the error margin was 0 m, the highest simulation accuracies for the dimension were 91.84% (Case 1) and 93.61% (Case 2). Moreover, 40 real-time positioning experiments were conducted in the dimension. In Case 1, the average positioning success rates were 50.8% (Margin-0), 72.9% (Margin-1), and 81.4% (Margin-2), and the corresponding values for Case 2 were 52.4%, 74.5%, and 82.8%, respectively. The results demonstrated that the proposed method can facilitate 3D indoor positioning based only on Wi-Fi technologies.
1. Introduction
Recent years have witnessed a growing demand for the use of unmanned aerial vehicles (UAVs) in indoor applications such as mapping, surveillance, navigation, and search and rescue operations [1]. To meet the requirements of indoor applications of UAVs, precise indoor navigation systems are required. Specifically, positioning is crucial for the guidance, navigation, and control of UAVs. Global navigation satellite systems (GNSSs) are extensively used for the outdoor localisation of UAVs; however, severe fading and unpredictable multipath fading may adversely affect the related signals. Therefore, GNSS services cannot be exploited in all scenarios, particularly in urban or indoor environments [2]. Consequently, indoor positioning approaches have been developed using wireless technologies such as Bluetooth, radio frequency identification, ultra-wideband (UWB) frameworks, and Wi-Fi. Notably, wireless local area networks are the most commonly used technology for indoor localisation because of the widespread availability of UAVs with Wi-Fi interfaces. Developers can use these technologies and hardware to establish a reliable and cost-effective indoor positioning system for UAVs.
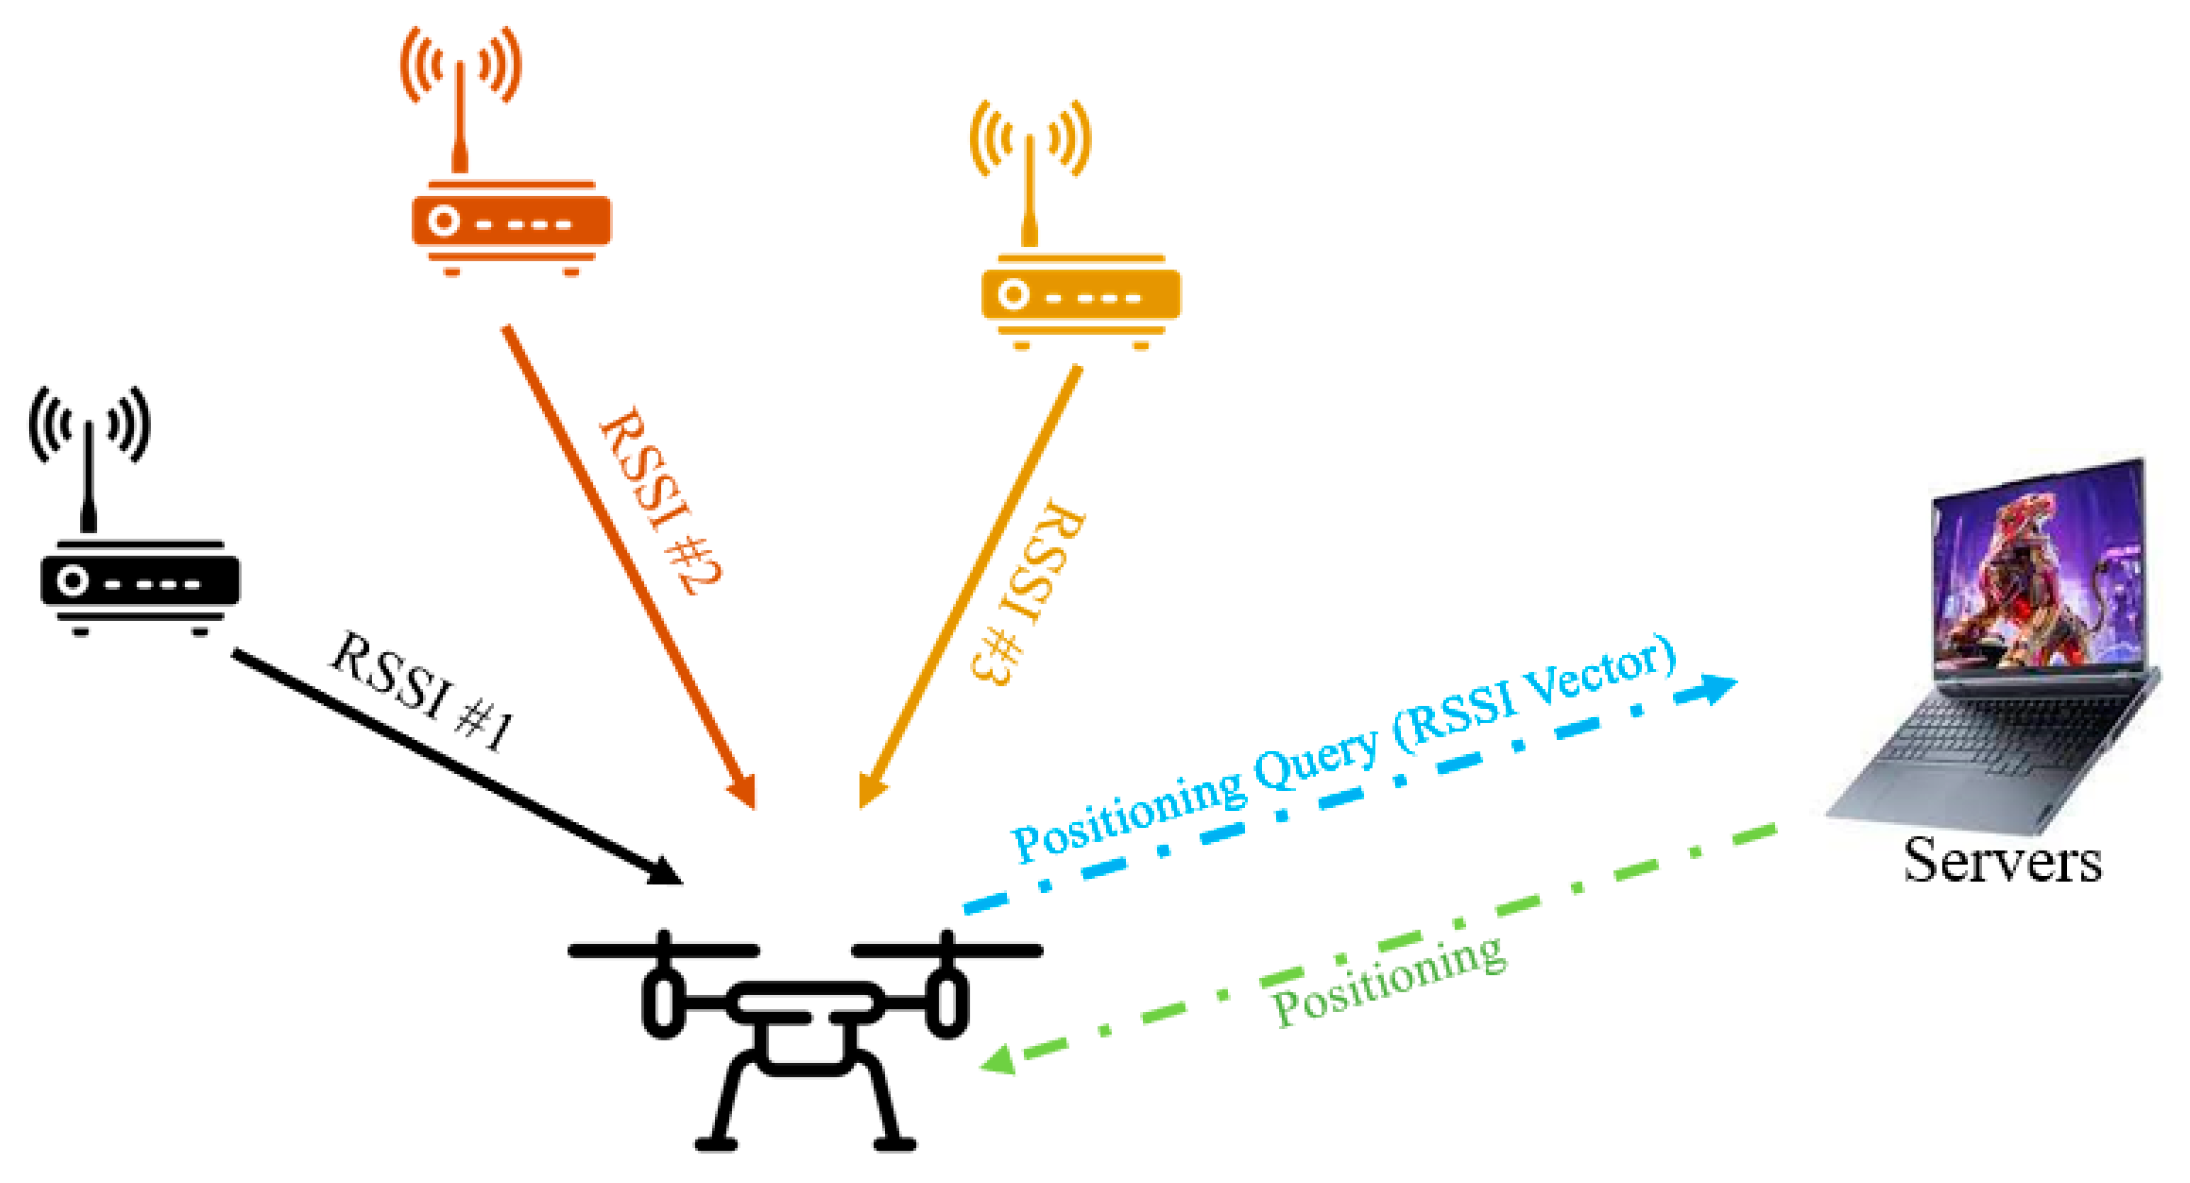
Two main approaches are typically applied when using Wi-Fi for localisation: One approach is to use signal propagation models to calculate the distance to the access point (AP) for localisation, based on the received signal strength indicator (RSSI) or channel state information of Wi-Fi signals, as shown in Figure 1. The other approach is to create a Wi-Fi fingerprint map and compare it with the current Wi-Fi signal to estimate the location [3,4]. Such fingerprinting techniques have been noted to facilitate the development and availability of indoor positioning methods [5], because of advantageous features such as extensive and stable signal coverage, the absence of the need for additional hardware devices, and favourable penetration and propagation capabilities within indoor environments.
The successful implementation of fingerprint recognition requires the resolution of several challenges. First, it is crucial to mitigate the impact of signal propagation variations caused by reflections, scattering, and multipath phenomena in indoor environments. Second, efficient offline phase planning is necessary to determine the optimal number and locations of reference points (RPs) while considering time and resource constraints. Lastly, it is essential to define and optimise location estimation algorithms, with specific functions and proximity criteria, depending on the chosen algorithm [6]. To address these challenges, we previously established an indoor positioning system leveraging deep-learning classifiers [7], as depicted in Figure 2.
This positioning system consists of offline and online phases. The offline phase involves the collection and analysis of indoor positional data. For instance, in the test environment, RSSI data are gathered, a database is created, and deep-learning classifiers are developed through model training. The results obtained in this phase directly influence the accuracy of real-time localisation. In contrast, the online phase is focused on testing and using the deep-learning classifier developed in the previous step for real-time localisation. Notably, while deep learning has the potential to enhance indoor positioning accuracy, its successful application has been hindered by limited database capacity. To address this problem, a deep-learning indoor positioning system based on data augmentation has been developed [7]. Data augmentation is used in the offline phase to expand the RSSI fingerprint database and enhance the training effectiveness of the deep-learning model, leading to improved positioning accuracy. In the online phase, the ‘majority rule’ is adopted to select the most frequent positioning results provided by the server, effectively reducing errors and further enhancing accuracy. Furthermore, a clustering-based noise elimination scheme has been introduced to mitigate the impact of environmental noise on the dataset [8]. By detecting and removing noise points for each RP in the offline phase of the indoor positioning framework, the purity of the database is improved, resulting in an increased probability of successful fingerprint-based localisation.
At present, the mainstream 3D indoor positioning scheme involves a combination of hardware and an RSSI fingerprint algorithm. For example, a robust 3D indoor positioning scheme has been established by combining altitude localisation based on barometer sensors and planar localisation based on the RSSI fingerprinting algorithm [9]. In addition, a scheme combining a Bluetooth device and an RSSI fingerprint algorithm [10] has been developed to achieve 3D indoor positioning. The stability of Bluetooth devices can help overcome the limitations of the traditional RSSI fingerprinting scheme, and the two-way ranging scheme can reduce the errors in single ranging, thereby improving the positioning accuracy. Furthermore, to address the limitations in vertical direction measurement in 3D indoor positioning systems, attributable to sensor properties and unexpected occlusion, a novel sensor fusion algorithm [11] has been proposed. This algorithm improves the height estimation accuracy of a UWB barometer integrated positioning system by introducing a pseudo-reference update mechanism and an extended Kalman filter. Moreover, a precise 3D indoor localisation and trajectory optimisation framework combining sparse Wi-Fi fine-time measurement anchors and built-in sensors has been established [12] to achieve 3D indoor positioning. This system enables accurate and stable 3D indoor positioning and trajectory optimisation under complex indoor environments involving sparse wireless stations. Table 1 summarises the relevant studies.
In the existing approaches for 3D indoor localisation, hardware is required to achieve dimension localisation, and an RSSI fingerprint recognition algorithm is required to achieve dimension localisation. In addition, existing hardware-based solutions, including inertial measurement units, UWB, vision systems [17], and radar [18], achieve indoor positioning with additional hardware and complex fusion algorithms. While these technologies already offer mature indoor positioning solutions, high-precision indoor positioning technologies incur various costs and require additional auxiliary equipment or extensive analogue processing. Therefore, it is desirable to establish cost-effective positioning technologies with enhanced accuracy. A comparison of such technologies is presented in Table 2.
Overall, the existing approaches are challenging to implement, owing to the requirements of additional hardware and the development of fusion algorithms. In contrast, Wi-Fi-based indoor positioning technology has emerged as a promising solution, with several advantageous features, such as extensive and stable signal coverage, the absence of the need for additional hardware devices, and favourable penetration and propagation capabilities within indoor environments. Considering these aspects, this study was aimed at developing a Wi-Fi fingerprint-based 3D indoor positioning scheme (3-DIPS) for drones, enabling the 3D positioning of drones in indoor environments using only Wi-Fi fingerprints. The core concept of the proposed scheme is the introduction of height positioning information (HRP) to the collected RSSI data, based on an existing 2D indoor localisation scheme [7]. The proposed 2D indoor positioning scheme can achieve indoor positioning in the dimensions using a previously established positioning method. However, to achieve positioning in the dimension, a height database is employed. The processing workflow for the height data is consistent with that of 2D indoor positioning. During data collection, the original 2D data are replaced with height data and input to a deep-learning model for training and testing. In the online phase, the test results for the and dimensions are combined and computed to obtain the 3D indoor positioning result. We set the localisation range of the dimension positioning RPs as 2 m, based on the test environment described in our previous work [7,8]. In addition, considering the dimensions of UAV devices and the requirements of specific usage scenarios, the height positioning range for the HRPs was set as 0.5 m (Case 1) and 0.8 m (Case 2). These intervals were chosen to reflect real-world scenarios: In certain indoor environments, a 0.5 m resolution may be sufficient for applications such as surveillance or monitoring, whereas more demanding scenarios, such as search and rescue operations, would require a higher vertical resolution, such as 0.8 m in Case 2. Evaluation of the system under these conditions can provide insights into its adaptability to diverse indoor applications. In the proposed scheme, the RP and HRP are input to a convolutional neural network (CNN) model in the offline phase to obtain two training sets (XY-Classifier and H-Classifier). This classifier is passed to the online phase and fed with real-time measurement information regarding the location of an unknown user. The test results demonstrate that the proposed method can enable the 3D indoor positioning of UAVs in complex and time-varying environments, without any additional hardware deployment and setup. In the context of this work, time-varying environments refer to conditions in which both human movement and uncertainty regarding the state of the wireless device impact the trial. The main contributions of this work can be summarised as follows:
- We established an innovative 3D indoor positioning system to meet the localisation demands of UAVs in indoor environments.
- We developed a 3D indoor positioning database based on a deep-learning classifier, enabling 3D indoor positioning through Wi-Fi technology.
- This study represents the first attempt at integrating fingerprint recognition with wireless positioning technology. The precision and reliability of indoor positioning were enhanced through a detailed analysis and learning process of Wi-Fi signal features.
2. Background
2.1. Environment Setup
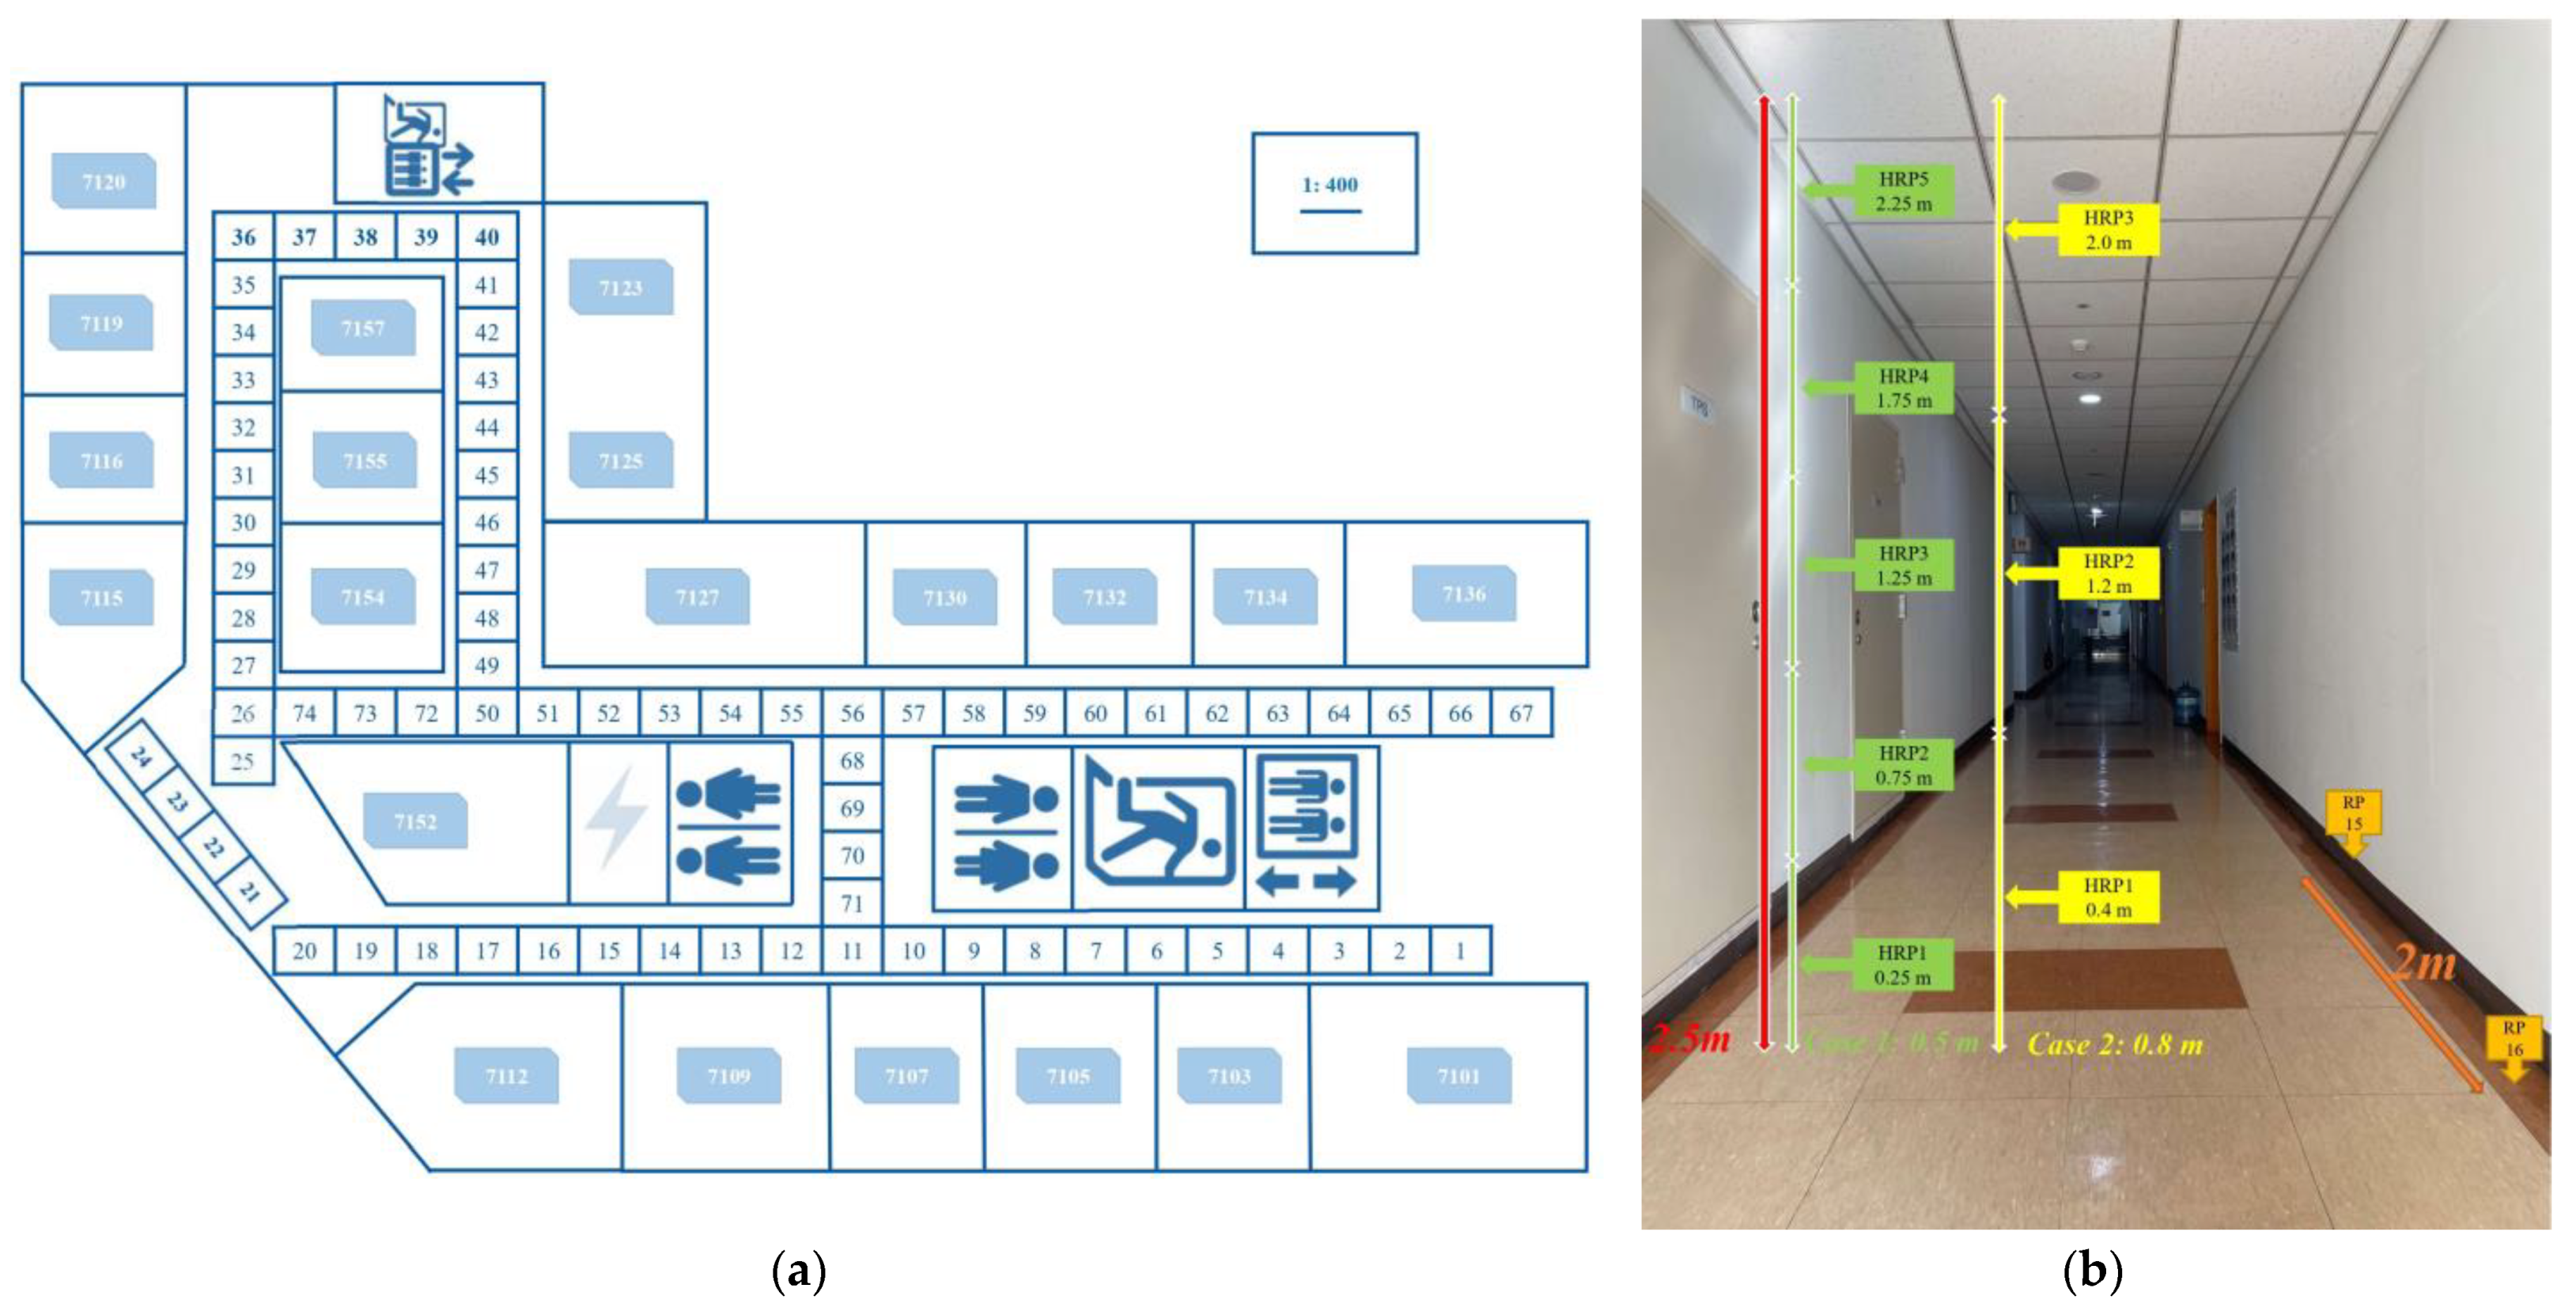
Data collection and testing were performed on the seventh floor of the new engineering building at Dongguk University, Seoul, Korea. As shown in Figure 3a, the target area was split into 74 grids of 2 m × 2 m RPs in an area sized 52 m × 32 m. In addition, considering the dimensions of the UAV devices and the requirements of certain usage scenarios, five grids containing 0.5 m HRPs (Case 1) and three grids containing 0.8 m HRPs (Case 2) were set, with the roof height being 2.5 m, as shown in Figure 3b. Because each RP represented the grid centre, any location in the grid could be assumed to be an RP. As shown in Figure 3b, the distance between any two adjacent RPs was 2 m. The positioning server was a Dell Alienware Model P31E, and a smartphone (Samsung SHV-E310K) was used instead of a UAV for data collection and testing. Python was used to build the fingerprint database, classify the fingerprints, and run the online experiments.
Android devices were used for reading and verifying the data. An error message was displayed on a serially linked terminal if the data were incorrect. Otherwise, the RSSI data were buffered and sent to the server over a Wi-Fi AP. The server located an Android device by comparing the RSSI results with reference data. The result was then returned to the Android device, where its CPU analysed the RSSIs from nearby APs. The Wi-Fi device operated within the 2.412–2.480 GHz range according to the 802.11bgn wireless standard. The sensitivity range was 15–93 dBm.
2.2. CNN Model and Data Augmentation
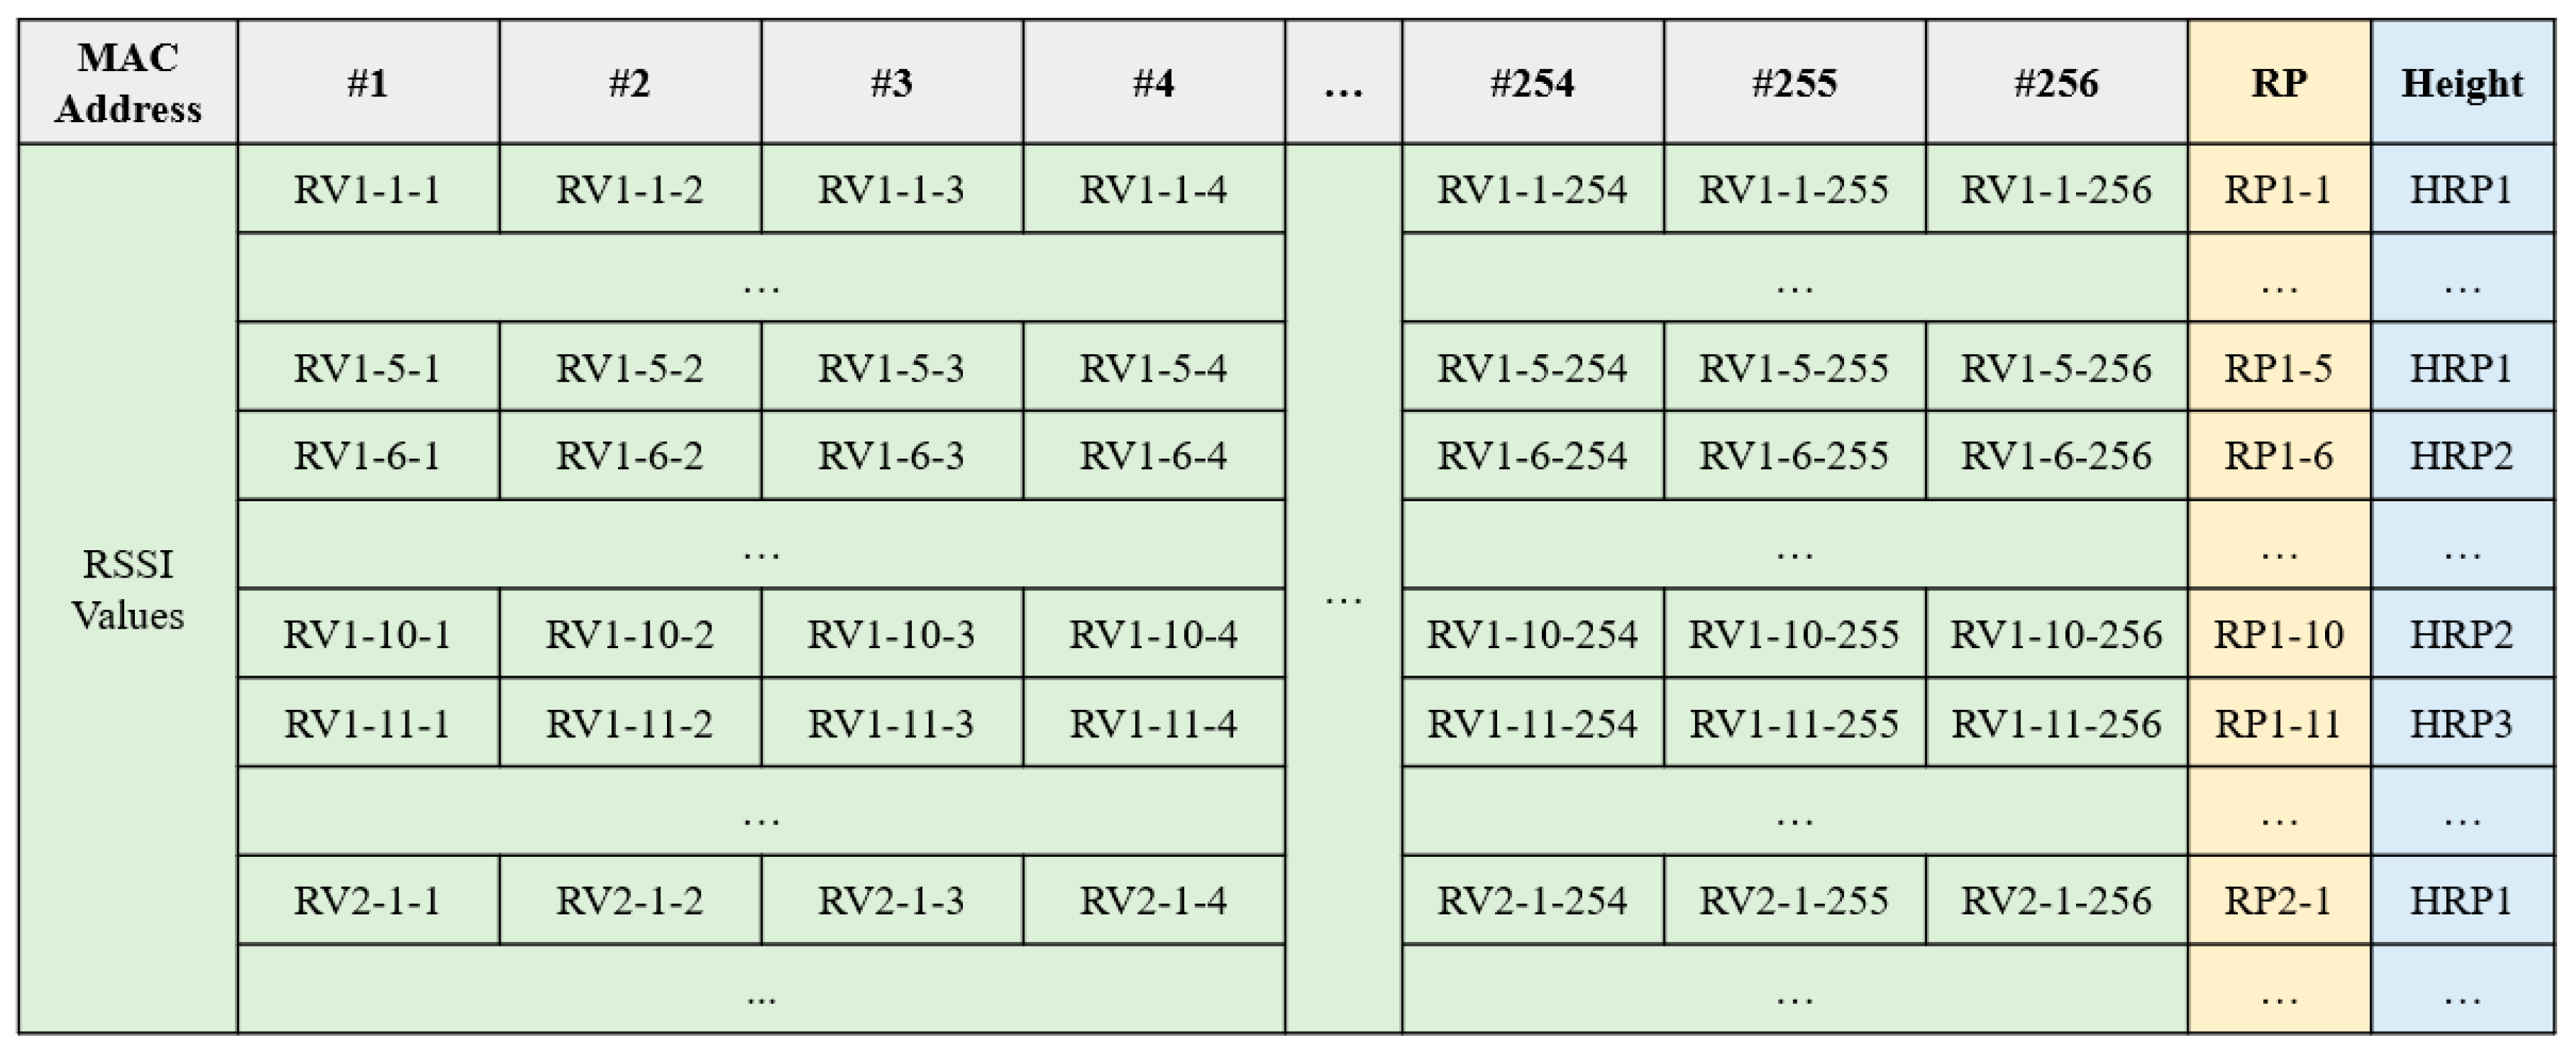
The RSSI data were converted to a comma-separated value (CSV) file and sent to the deep-learning model. Figure 4 shows the produced CSV file structure, containing all of the collected RSSI data, including 256 MAC addresses from various APs (grey box) and RSSI values (green box) for each RP (yellow box) and HRP (blue box). The RSSI values were measured five times at each RP and HRP, in the forward and backward directions. The sample duration for each RSSI measurement was 5 s, and the total sampling time was 25 s for the five measurements.
Figure 5 shows the architecture of the previously developed five-layer CNN classifier [7]. The first layer included 16 × 16 × 1 rectified linear unit (ReLU) images with dropout. Max pooling was omitted in the first layer due to limited input data. The second layer, with 18,496 parameters, consisted of a 16 × 16 convolutional layer with ReLU activation, followed by an 8 × 8 max pooling layer, which served as the input for the third layer, a fully connected (FC) layer with 3072 nodes connected to a hidden FC layer with 1024 nodes. The output layer, a softmax layer with 74 nodes representing the total number of RPs in our setup, had an inner width of 1024. A dropout of 0.5 was applied to the first four layers. The learning rate was set to 0.001, and the total parameter count was 2,266,698. The computed output represented the total RPs and HRPs in the setup. To address underfitting or overfitting issues arising from poor data quality or insufficient data, data augmentation techniques were employed to effectively increase the training data volume by modifying the existing data.
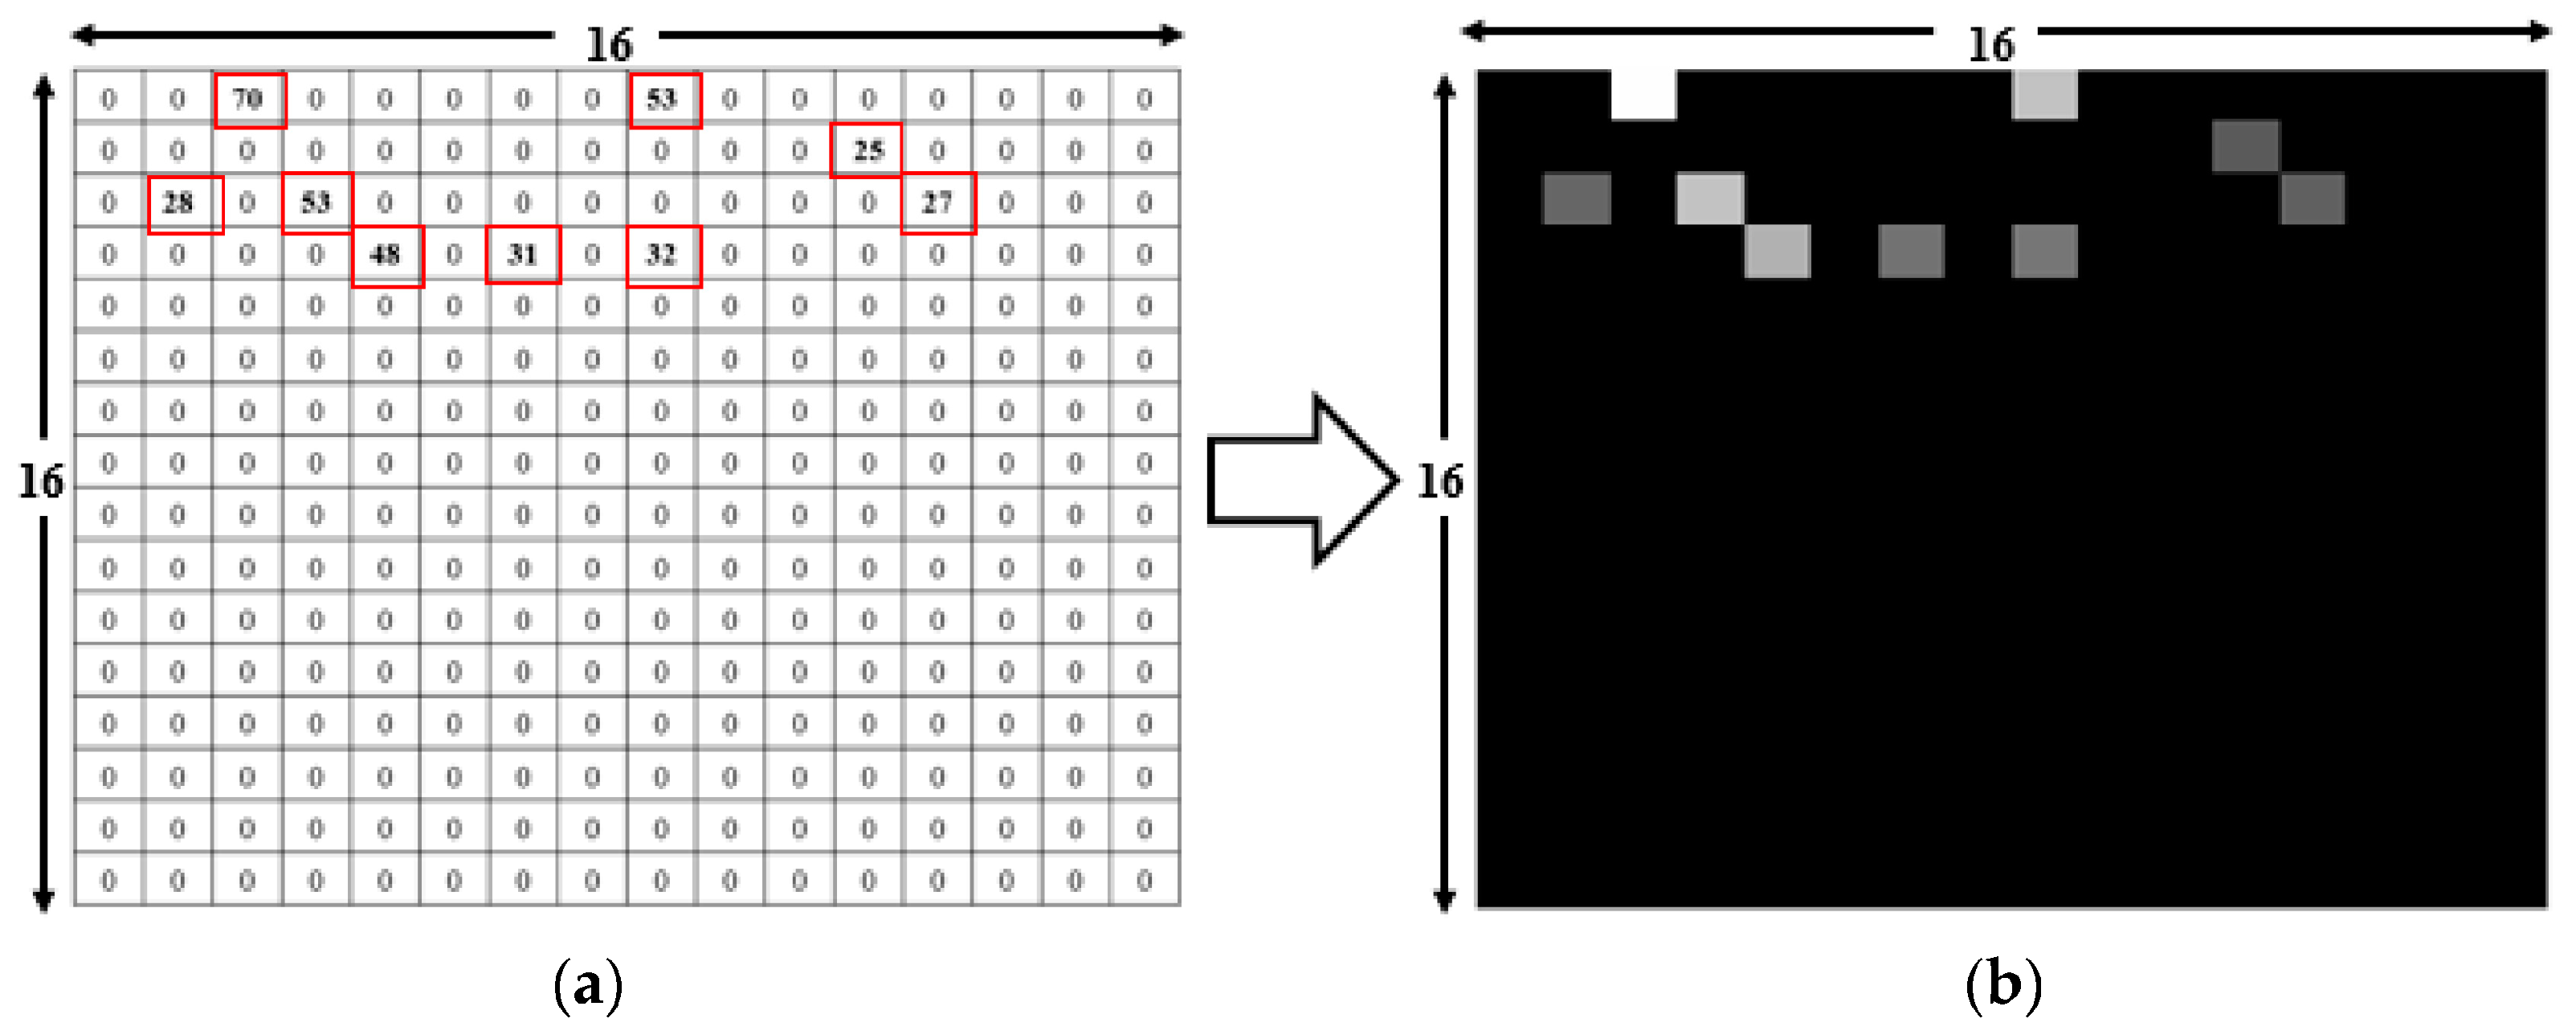
The input image was generated using the RSSI data from 74 RPs and 5 or 3 HRPs. Each RP and HRP recorded the RSSI for 256 APs, although only some of these APs are displayed in this paper. The RSSI data from several APs generated a 16 × 16 picture. Figure 6a shows nine visible RSSI values, ranging from 25 to 70, among 256 APs, with the remaining values represented as 0. Figure 6b illustrates the RSSI values as a grayscale image, with higher RSSI values associated with brighter pixels. The brightest grayscale image corresponds to the maximum RSSI of 70, while the darkest non-black image corresponds to the minimum RSSI of 25. The remaining 247 locations appear dark, as their RSSI values are zero. Similarly, the input RSSI files for other RPs and HRPs produce distinct images for the deep-learning network.
3. 3-DIPS
The core concept of the proposed scheme was the introduction of HRP to the collected RSSI data based on the previous 2D indoor localisation scheme, as shown in Figure 4. The scheme input the RP and HRP to the CNN model in the offline phase to obtain two training sets (XY-Classifier and H-Classifier). These classifiers were then used in the online phase, employing real-time measurement information pertaining to the location of an unknown user.
The RSSI dataset used in this study included two types of reference information: RP and HRP. Therefore, during localisation testing, the collected RSSI data were divided into two types (RP and HRP references), as shown in Figure 7. For dimension localisation, the RSSI dataset of the RP (blue box) was converted to a CSV file, enhanced through data augmentation techniques, and input to the XY-CNN model for training and testing. Similarly, for dimension localisation, the RSSI dataset of the HRP (green box) was input to the H-CNN model for training and testing. Data collection, pre-processing, and model training were carried out in a manner consistent with established research practices [8].
To evaluate the effect of the HRP height on the 3D indoor positioning performance, we divided the indoor height (2.5 m) into two intervals: 0.5 m (Case 1) and 0.8 m (Case 2). Case 1 contained five height intervals with the HRP at the centre of the interval, i.e., HRP1 at 0.25 m and HRP2 at 0.75 m. Similarly, Case 2 contained three height intervals, with HRP1 at 0.4 m, as shown in Figure 3b. The experimental environment involved time-varying and complex conditions with pedestrians, wireless devices, and other elements, which rendered processing challenging. To address these challenges, data were collected in different directions (forward/backward) and at different times (morning/afternoon) over eleven days. Specifically, the collector held the smartphone at different HRPs and measured stationary data at each RP. Forward and backward data were collected in the morning and afternoon, with ‘forward’ and ‘backward’ referring to the sequential collection of RSSI values from RP1 to RP74 and from RP74 to RP1, respectively. Table 3 summarises the RSSI values collected for Cases 1 and 2. The data collected in the morning and afternoon are labelled M and A, respectively, and those collected in the forward and backward directions are labelled F and B, respectively.
Both databases were fed to the CNN model for feature learning. The datasets pertaining to the HRPs were randomly divided into training and testing databases. For example, three datasets in HRP1 (Case 1) were randomly selected as the training databases, and the remaining dataset was specified as the test database. Similarly, for Case 2, six datasets from HRP1 were randomly selected as the training databases, and two datasets were identified as the test databases. The training and test databases were input to the CNN model and used for feature learning, as outlined in Algorithm 1.
| Algorithm 1: Pseudocode for 3-DIPS in the CNN model |
|
The Python-based CNN classifier generated a metafile with a set of weights and biases after each epoch. Many metafiles were generated after multiple epochs, and the metafile with the highest success rate was selected for subsequent real-time localisation experiments (online phase). The trained classifiers were used in real-time experiments (offline phase), and position tests were conducted using a measurement machine and a location server. RSSI values were collected at each known RP and HRP during the actual measurements, and the collected values were fed into the trained classifier for comparative analysis to determine the and dimensions of the unknown user. Five RSSI measurements were obtained at the same RP and random HRP for each experiment, and the trained classifier fed back the five localisation decisions from the location server, i.e., and . No additional hardware was used for the 3D indoor positioning. Figure 8 shows the process flow of the proposed method, offering a more intuitive visualisation of the algorithm’s structure and execution paths compared with the pseudocode.
Compared with alternative approaches that are not based on GPS signals, this scheme is cost-effective, has a broad applicability facilitated by the widespread availability of Wi-Fi, and exhibits improved accuracy through the integration of deep-learning classifiers. Nevertheless, it encounters various challenges, including environmental sensitivity, dependence on comprehensive databases, and limitations in height resolution. These factors may potentially impact its suitability for specific applications (Table 4).
4. Numerical Results
4.1. Simulation Results
The 3-DIPS was used to perform simulations on the and databases, and the configurations with the highest accuracy (Table 5) were selected for real-time testing. For the dimension, owing to the floor height limitation, only five (Case 1) or three (Case 2) HRP partitions were used. Therefore, only the case of Margin-0 (height positioning error of 0 m) of the HRP was considered in this work. The Margin-0 accuracies for Cases 2 and 1 were 93.61% and 91.84%, respectively, corresponding to a difference of more than 1.5%. Therefore, a larger HRP interval could enable more robust positioning. For the dimension, the Margin-0 case (0 m error) corresponded to that in which the RP number was accurately predicted by the CNN-trained model. In the Margin-1 case (i.e., 2 m error), the predicted test RP matched the neighbouring RP, while in the Margin-2 case (i.e., 4 m error) the predicted test RP matched the difference of two RPs. For Case 1, the Margin-0, -1, and -2 accuracies were 58.29%, 89.68%, and 94.08%, respectively, and the corresponding values for Case 2 were 58.99%, 90.63%, and 94.95%. The simulation results of the dimension for Cases 1 and 2 were similar, although the results for Case 2 were slightly superior owing to the collection of more RSSI datasets. This conclusion is consistent with those of previous studies [8]: The number of datasets for the dimension influences the corresponding localisation accuracy.
The effectiveness of the dimension was defined as the cumulative distribution function (CDF) of the location error within a specified distance, as shown in Figure 9. An accuracy of more than 90% was achieved with a location error of approximately 2.07 m (Case 1) and 1.92 m (Case 2), and an accuracy of more than 80% was achieved with a location error of 1.11 m (Case 1) and 0.98 m (Case 2). In the case of the dimension, the height of the testing floor was only 2.5 m, considerably smaller than the dimensions (52 m × 32 m). Therefore, for the dimension, a 2 m × 2 m RP grid was likely excessively small, and the Margin-2 case (4 m error) was considered to be the maximum positioning error. In contrast, for the (H) dimension, a localisation grid with a height of 0.5 m (Case 1) or 0.8 m (Case 2) represented a large positioning range in comparison with the 2.5 m floor height. For example, in Case 2, when the test device was at HRP2 (height of 1.2 m), Margin-1 already included all heights, which could not truly reflect the effectiveness of localisation. Therefore, the maximum positioning error for the dimension was set as 0 m (Margin-0). Consequently, the maximum positioning errors in the dimension (Margin-2) and dimension (Margin-0) were similar.
4.2. Real-Time Experimental Results for the (X,Y) and (H) Dimensions
The learned classifier for location testing was used for real-time experiments. The measured RSSI value of the unknown point was fed to a CNN model to analyse the numerical characteristics. Subsequently, the retrieved characteristics were compared with those in the trained classifier to determine the superior classifier, and the final position was selected based on the RP with the characteristics most similar to those of the trained classifier. Based on 3-DIPS, the positioning performances for the XY and H Databases were separately evaluated. For the dimension positioning, location tests were conducted at different times (morning and afternoon) and in different directions (forward and backward), and data were collected five times at random heights at each RP. The results were returned by the location server. For the dimension localisation, the real height (RH) was selected randomly for five tests at each RP, and the test height (TH) was returned from the location server. Table 6 summarises the real-time experimenta results.
To address the challenges posed by the time-varying environment, real-time tests for both cases were conducted eight times over an eight-day period, with two separate tests for each time (morning (M)/afternoon (A)) and direction (forward (F)/backward (B)). For the dimension, results with measurement errors smaller than or equal to two were considered successful, and the data represented the probability of success. For the dimension, results with a positioning error of 0 m (Margin-0) were considered. The real-time experimental results are presented in Table 7. The localisation accuracies for Case 2 in the dimension were 57.44% (Margin-0), 87.63% (Margin-1), and 90.91% (Margin- 2). The corresponding values for Case 1 were 56.91%, 86.95%, and 90.73%, respectvely. The results of both cases were similar, although the results for Case 2 were slightly superior. For the dimension, Case 2 yielded the highest average test accuracy (90.13%), and the accuracy exceeded 90% in five of eight experimental runs. The average test accuracy for Case 1 was 88.41%, and the highest accuracy was 89.98%. The results of Case 2 were significantly better than those of Case 1. This difference may be attributed to the increased complexity introduced by a smaller height interval, rendering it challenging to accurately determine the vertical position. This observation indicated that a larger localisation interval enabled more consistent localisation performance in 3D indoor localisation scenarios for large users such as UAVs.
Moreover, Table 7 shows that the real-time experimental results for both dimensions were slightly smaller than the laboratory simulation results. This phenomenon likely occurred because the real-time experiments were conducted in a time-varying and complex environment, and the presence of pedestrians and randomly operated Wi-Fi transmitting devices (such as wireless printers) led to some interference to the signal, as observed in previous studies [7,8].
4.3. Real-Time Experimental Results for the Dimension
To further verify the localisation performance of 3-DIPS in the dimension, the and dimensions of the same test order were selected and recombined for each test, as shown in Table 8. For each case, 40 sets of results were obtained in the dimension; that is, the tests for each case were conducted eight times, with five determinations in each test. The positioning success rate in the dimension was determined by both RP and HRP. Only the Margin-0 case was considered for the HRP, and all three errors were considered for the RP. In other words, four types of positioning results were obtained for the dimension: Margin-0, with a 0 m error for the RP and HRP; Margin-1, with a 2 m error for the RP and a 0 m error for the HRP; Margin-2, with a 4 m error for the RP and a 0 m error for the HRP; and false, indicating failed positioning owing to errors in the HRP or RP exceeding 4 m.
Figure 10 shows the positioning performance in the dimension. The blue line represents the walls in the experimental environment, and the blue dots represent the true positions and user locations. The test results for Margin-0 are marked in green, appearing consistent with the blue dots. The test results for Margin-1 and Margin-2 are marked in pink and black, respectively: The height is consistent with the blue dots, but with errors of 2 m and 4 m in the dimension. Failed positioning points are marked in red, indicating errors in the HRP or errors exceeding 4 m in the dimension. In particular, Figure 10 shows the results of a single positioning trial for Case 1. The successful positioning counts for Margin-0, -1, and -2 were 38, 16, and 5, respectively, with positioning success rates of 51.4%, 73.0%, and 79.7%, as indicated in Table 9.
For Case 1, Margin-0, -1, and -2 errors were observed in 37, 54, and 60 of the 74 test locations, respectively. In contrast, owing to the larger height interval (0.8 m) in Case 2, Margin-0, -1, and -2 errors were achieved for 39, 56, and 61 test locations, respectively. The positioning success rates for the three types of errors for Cases 1 and 2 are presented in Figure 11. The average positioning success rates for Case 1 over 40 trials were 50.8% (Margin-0), 72.9% (Margin-1), and 81.4% (Margin-2), while the corresponding values for Case 2 were 52.4%, 74.5%, and 82.8%, respectively. The experimental results validated that the proposed method could realise the indoor positioning of users based only on Wi-Fi.
Table 10 presents the positioning accuracy in two dimensions: and . The indoor positioning accuracy for was significantly lower than that for the (X,Y) case. For example, in Case 1, the positioning accuracy for Margin-0 in the dimension was approximately 6% lower, indicating the occurrence of four fewer successful tests for Margin-0 compared with those in the previous scenario. The accuracies for Margin-1 and Margin-2 decreased by approximately 14% and 9%, respectively. A similar pattern was observed in Case 2, with the Margin-0, Margin-1, and Margin-2 values decreasing by approximately 5%, 13%, and 8%, respectively. Overall, the reduction in Case 2 was smaller than that in Case 1, indicating that the positioning of was more robust when a larger positioning interval was used.
During real-time experiments, the proposed Wi-Fi-based localisation method encountered challenges, and several limitations were identified. Environmental variability, including that related to obstacles, electronic device interference, and time-varying signal conditions, affected the positioning accuracy despite our mitigation efforts. Limited generalisation stemmed from the reliance of the proposed method on a comprehensive training database, highlighting the need for continuous updates to enhance adaptability. Height resolution sensitivity, with intervals of 0.5 m and 0.8 m, could impact precision in applications requiring detailed mapping. Acknowledging these limitations is crucial for understanding potential reliability and accuracy issues, particularly in indoor environments. Future work must be aimed at addressing these constraints by enhancing the robustness of the algorithm, augmenting the database, and performing optimisations for diverse hardware environments.
5. Conclusions
This paper proposes a Wi-Fi-based 3-DIPS framework to achieve precise 3D positioning of UAVs in indoor environments. In simulations, the localisation accuracy in the dimension was similar for both cases, exceeding 94% (Margin-2). For the dimension, the results for Case 2 (93.64%) were superior to those of Case 1 (91.84%) due to the larger interval. Experimental results in a real-time environment showed that 3-DIPS achieved accuracies of 88.41% (Case 1) and 90.13% (Case 2) in the dimension in the Margin-0 case (0-m error). For the dimension, the average positioning success rates in Case 1 were 50.8% (Margin-0), 72.9% (Margin-1), and 81.4% (Margin-2) in the dimension, and the corresponding values for Case 2 were 52.4%, 74.5%, and 82.8%, respectively. To extend this scheme to larger and more complex experimental environments, future work will be aimed at establishing databases for different floors. With these diverse floor databases, UAVs will be able to be positioned on various floors, enabling the determination of both the current floor and the horizontal location.
Author Contributions
S.L. and S.-H.H. conceptualised this research. S.L. and H.L. performed the simulations, experiments, and database collection. S.L. and S.-H.H. validated the numerical results. The research was planned and executed under the supervision of S.-H.H.; S.L. and S.-H.H. contributed to the writing of this article. All authors have read and agreed to the published version of the manuscript.
Funding
This research received no external funding.
Data Availability Statement
The data presented in this study are available on request from the corresponding author. The data are not publicly available due to the further research relying on the data is still underway.
Conflicts of Interest
The authors declare no conflict of interest.
References
- Sandamini, C.; Maduranga, M.W.P.; Tilwari, V.; Yahaya, J.; Qamar, F.; Nguyen, Q.N.; Ibrahim, S.R.A. A review of indoor positioning systems for UAV localization with machine learning algorithms. Electronics 2023, 12, 1533. [Google Scholar] [CrossRef]
- Farahsari, P.S.; Farahzadi, A.; Rezazadeh, J.; Bagheri, A. A survey on indoor positioning systems for iot-based applications. IEEE Internet Things J. 2022, 9, 7680–7699. [Google Scholar] [CrossRef]
- Zhang, Y.; Li, D.; Wang, Y. An indoor passive positioning method using CSI fingerprint based on Adaboost. IEEE Sens. J. 2019, 19, 5792–5800. [Google Scholar] [CrossRef]
- Song, Q.W.; Guo, S.T.; Liu, X.; Yang, Y.Y. CSI amplitude fingerprinting based NB-IoT indoor localization. IEEE Internet Things J. 2017, 5, 1494–1504. [Google Scholar] [CrossRef]
- Subedi, S.; Pyun, J.Y. A survey of smartphone-based indoor positioning system using RF-based wireless technologies. Sensors 2020, 20, 7230. [Google Scholar] [CrossRef] [PubMed]
- Caso, G.; De Nardis, L.; Di Benedetto, M. Frequentist inference for WiFi fingerprinting 3D indoor positioning. In Proceedings of the 2015 IEEE International Conference on Communication Workshop (ICCW), London UK, 8–12 June 2015; pp. 809–814. [Google Scholar]
- Haider, A.; Wei, Y.; Liu, S.; Hwang, S.H. Pre- and post-processing algorithms with deep learning classifier for Wi-Fi fingerprint-based indoor positioning. Electronics 2019, 8, 195. [Google Scholar] [CrossRef]
- Liu, S.; Sinha, R.S.; Hwang, S.-H. Clustering-based noise elimination scheme for data pre-processing for deep learning classifier in fingerprint indoor positioning system. Sensors 2021, 21, 4349. [Google Scholar] [CrossRef] [PubMed]
- Bisio, I.; Sciarrone, A.; Bedogni, L.; Bononi, L. WiFi meets barometer: Smartphone-based 3D indoor positioning method. In Proceedings of the 2018 IEEE International Conference on Communications (ICC), Kansas City, MO, USA, 20–24 May 2018; pp. 1–6. [Google Scholar]
- Li, H.; Trocan, M.; Galayko, D. Virtual fingerprint and two-way ranging-based Bluetooth 3D indoor positioning with RSSI difference and distance ratio. J. Electromagn. Waves Appl. 2019, 33, 2155–2174. [Google Scholar] [CrossRef]
- Li, J.; Wang, Y.; Chen, Z.; Ma, L.; Yan, S. Improved height estimation using extended Kalman filter on UWB-barometer 3D indoor positioning system. Wirel. Commun. Mob. Comput. 2021, 2021, 7057513. [Google Scholar] [CrossRef]
- Yu, Y.; Chen, R.; Shi, W.; Chen, L. Precise 3D indoor localization and trajectory optimization based on sparse Wi-Fi FTM anchors and built-in sensors. IEEE Trans. Veh. Technol. 2022, 71, 4042–4056. [Google Scholar] [CrossRef]
- Saadatzadeh, E.; Ali Abbaspour, R.; Chehreghan, A. An improvement in smartphone-based 3D indoor positioning using an effective map matching method. J. Ambient. Intell. Humaniz. Comput. 2022, 14, 13741–13771. [Google Scholar] [CrossRef]
- Cossu, G.; Ciaramella, E. A 3D indoor positioning system based on common visible LEDs. Phys. Commun. 2022, 54, 101843. [Google Scholar] [CrossRef]
- Khalili, B.; Ali Abbaspour, R.; Chehreghan, A.; Vesali, N. A context-aware smartphone-based 3D indoor positioning using pedestrian dead reckoning. Sensors 2022, 22, 9968. [Google Scholar] [CrossRef] [PubMed]
- Sen, U.; Yesilirmak, Y.E.; Bayman, I.O.; Arsan, T.; Panayirci, E.; Stevens, N. 3D indoor positioning with spatial modulation for visible light communications. Opt. Commun. 2023, 529, 129091. [Google Scholar] [CrossRef]
- Benini, A.; Mancini, A.; Longhi, S. An IMU/UWB/vision-based extended Kalman filter for mini-UAV localization in indoor environment using 802.15. 4a wireless sensor network. J. Intell. Robot. Syst. 2013, 70, 461–476. [Google Scholar] [CrossRef]
- Krátký, M.; Fuxa, L. Mini UAVs detection by radar. In Proceedings of the International Conference on Military Technologies (ICMT) 2015, Brno, Czech Republic, 19–21 May 2015; pp. 1–5. [Google Scholar]
- Ariante, G.; Ponte, S.; Del Core, G. Bluetooth low energy based technology for small UAS indoor positioning. In Proceedings of the 2022 IEEE 9th International Workshop on Metrology for AeroSpace (MetroAeroSpace), Pisa, Italy, 27–29 June 2022; pp. 113–118. [Google Scholar]
- Xiao, X.; Fan, Y.; Dufek, J.; Murphy, R. Indoor UAV localization using a tether. In Proceedings of the 2018 IEEE International Symposium on Safety, Security, and Rescue Robotics (SSRR), Philadelphia, PA, USA, 6–8 August 2018; pp. 1–6. [Google Scholar]
- Brzozowski, B.; Kaźmierczak, K.; Rochala, Z.; Wojda, M.; Wojtowicz, K. A concept of UAV indoor navigation system based on magnetic field measurements. In Proceedings of the 2016 IEEE Metrology for Aerospace (MetroAeroSpace), Florence, Italy, 22–23 June 2016; pp. 636–640. [Google Scholar]
- Yang, L.; Feng, X.; Zhang, J.; Shu, X. Multi-ray modeling of ultrasonic sensors and application for micro-UAV localization in indoor environments. Sensors 2019, 19, 1770. [Google Scholar] [CrossRef] [PubMed]
- Tiemann, J.; Schweikowski, F.; Wietfeld, C. Design of an UWB indoor-positioning system for UAV navigation in GNSS-denied environments. In Proceedings of the 2015 International Conference on Indoor Positioning and Indoor Navigation (IPIN), Banff, AL, Canada, 13–16 October 2015; pp. 1–7. [Google Scholar]
- Xin, C.; Wu, G.; Zhang, C.; Chen, K.; Wang, J.; Wang, X. Research on indoor navigation system of UAV based on lidar. In Proceedings of the 2020 12th International Conference on Measuring Technology and Mechatronics Automation (ICMTMA), Phuket, Thailand, 28–29 February 2020; IEEE: New York, NY, USA, 2020; pp. 763–766. [Google Scholar]
Figure 1.
Three-dimensional (3D) indoor positioning based on received signal strength indicator.

Figure 2.
Fingerprint positioning with a deep-learning classifier [7].
Figure 2.
Fingerprint positioning with a deep-learning classifier [7].

Figure 3.
Environment setup: (a) floor map with 74 reference points (RPs); (b) internal environment and dimension reference points (HRPs).
Figure 3.
Environment setup: (a) floor map with 74 reference points (RPs); (b) internal environment and dimension reference points (HRPs).

Figure 4.
Example of the input comma-separated value (CSV) file format for Case 2.

Figure 5.
Convolutional neural network (CNN) architecture used in this study [7].
Figure 5.
Convolutional neural network (CNN) architecture used in this study [7].

Figure 6.
Deep-learning input file conversion from a CSV file to an image [8]: (a) CSV readings of nine visible received signal strength indicators (RSSIs) from 256 access points (APs) as shown in red box, used as the input. (b) The grayscale picture is converted, and nine bright dots representing the APs observed at the reference point (RP) [7] are converted to black and white.

Figure 7.
Example of Case 1 RSSI dataset conversion for RP and HRP; (2-1 ×5) indicates five RSSI data measurements at the height of HRP1 at RP2.
Figure 7.
Example of Case 1 RSSI dataset conversion for RP and HRP; (2-1 ×5) indicates five RSSI data measurements at the height of HRP1 at RP2.

Figure 8.
Process flow of the experiment.

Figure 9.
Cumulative distribution function (CDF) vs. dimension positioning. The X-axis represents the dimension positioning errors, and the Y-axis represents the accuracy for different positioning errors.
Figure 9.
Cumulative distribution function (CDF) vs. dimension positioning. The X-axis represents the dimension positioning errors, and the Y-axis represents the accuracy for different positioning errors.

Figure 10.
Example of dimension positioning for Case 1: (a) 3D view; (b) dimension view; (c) dimension view.
Figure 10.
Example of dimension positioning for Case 1: (a) 3D view; (b) dimension view; (c) dimension view.

Figure 11.
dimension positioning results for Cases 1 and 2.


Table 1.
State-of-the-art three-dimensional (3D) indoor positioning strategies.
| Reference | Year Published | Hardware | Methods |
|---|---|---|---|
| [9] | 2018 | Barometer sensor | Barometer sensor combined with received signal strength (RSSI) fingerprinting to develop an indoor positioning algorithm based on a 3D smartphone |
| [10] | 2019 | Bluetooth | Bluetooth-based 3D indoor positioning scheme based on RSSI fingerprinting and bidirectional ranging |
| [11] | 2021 | UWB barometer | UWB barometer 3D indoor positioning system, including a pseudo-reference update mechanism and the extended Kalman filter |
| [12] | 2022 | Built-in sensors | Precise 3D indoor localisation and trajectory optimisation framework combining sparse Wi-Fi fine-time measurement anchors and built-in sensors |
| [13] | 2022 | Mobile phone sensors | Method for indoor positioning in three smartphone carrying modes (i.e., texting, calling, and swinging), based on data derived from an accelerometer, magnetometer, gyroscope, and gravity and pressure sensors |
| [14] | 2022 | Visible LED | Real-life 3D indoor navigation localisation system using visible LED lights placed on the ceiling |
| [15] | 2022 | Pedestrian dead-reckoning | Adaptive pedestrian dead-reckoning method to improve the robustness and accuracy of three-dimensional positioning by adjusting parameters based on different phone carrying modes, pedestrian activities, and individual characteristics |
| [16] | 2023 | Visible light | Novel 3D indoor visible-light positioning algorithm based on spatial modulation |
Table 2.
Comparison of indoor drone positioning technologies.
| Reference | Approaches | Advantages | Limitations |
|---|---|---|---|
| [17] | IMU/UWB/ vision | Mitigates errors associated with inertial sensors | High computational complexity |
| [18] | Radar | Efficient in detecting low, small, and slow objects. | High-frequency-based radar enables the detection of faster UAVs |
| [19] | Tether | Reduces prediction time in real-world environments | Requires a power optimisation approach when operating in highly complex indoor radio channels |
| [20] | Bluetooth | Application of a Kalman filter enhances the collected data by mitigating the effects of noise, drift, and bias errors | Outdoor tests must be conducted to develop a safe landing area determination system |
| [21] | Magnetic field measurements | Enhances the accuracy | The impact of powered and operating electronic devices must be explored |
| [22] | Ultrasonic sensors | Efficiently localises a UAV within a moving frame | Use of the ML approach can enhance tracking accuracy |
| [23] | UWB | Improves the accuracy of positioning probabilities using global navigation satellite systems | The filtering process must be optimised to address the specific navigation controller requirements and magnetometer challenges when operating indoors |
| [24] | LiDAR | Use of synchronous positioning and mapping algorithms enables accurate and timely real-time positioning | The accuracy of UAV positioning relies on the performance of the onboard LiDAR, which poses cost challenges |
Table 3.
Types of datasets for Cases 1 and 2.
| Case | HRP (Height/m) | RP (Location/m) | Types of Datasets | Number of Data Files |
|---|---|---|---|---|
| Case 1 | HRP1 (0.25) | RP1–RP74 (2) | MF-1, MB-1, AF-1, AB-1 | 4 |
| HRP2 (0.75) | RP1–RP74 (2) | MF-2, MB-2, AF-2, AB-2 | 4 | |
| HRP3 (1.25) | RP1–RP74 (2) | MF-3, MB-3, AF-3, AB-3 | 4 | |
| HRP4 (1.75) | RP1–RP74 (2) | MF-4, MB-4, AF-4, AB-4 | 4 | |
| HRP5 (2.25) | RP1–RP74 (2) | MF-5, MB-5, AF-5, AB-5 | 4 | |
| Case 2 | HRP1 (0.4) | RP1–RP74 (2) | MF-1-1, MB-1-1, AF-1-1, AB-1-1 MF-1-2, MB-1-2, AF-1-2, AB-1-2 | 8 |
| HRP2 (1.2) | RP1–RP74 (2) | MF-2-1, MB-2-1, AF-2-1, AB-2-1 MF-2-2, MB-2-2, AF-2-2, AB-2-2 | 8 | |
| HRP3 (2.0) | RP1–RP74 (2) | MF-3-1, MB-3-1, AF-3-1, AB-3-1 MF-3-2, MB-3-2, AF-3-2, AB-3-2 | 8 |
Table 4.
Advantages and disadvantages of the proposed methodology.
| Advantages | Disadvantages | ||
|---|---|---|---|
| Cost-effectiveness | Utilises existing Wi-Fi infrastructure, avoiding the need for additional hardware | Randomness of APs | Randomness of AP (on/off) affects positioning accuracy |
| Ubiquity of Wi-Fi | Capitalises on the widespread presence of Wi-Fi networks, ensuring facile and broad applicability in various indoor settings | Database dependence | Relies heavily on a comprehensive and representative database |
| Deep-learning classifier | Employs advanced deep-learning techniques to interpret Wi-Fi signal data, resulting in enhanced adaptability and accuracy in diverse environments | Height resolution limitations | May not meet the precision needs of all applications due to its set height resolution intervals |
Table 5.
Simulation results with the highest accuracy.
| Case | (X, Y) Dimension Accuracy (%) | (H) Dimension Accuracy (%) | ||
|---|---|---|---|---|
| Margin-0 (0-m Error) | Margin-1 (2 m Error) | Margin-2 (4 m Error) | Margin-0 (0 m Error) | |
| Case 1 | 58.29 | 89.68 | 94.08 | 91.84 |
| Case 2 | 58.99 | 90.63 | 94.95 | 93.61 |
Table 6.
Example of real-time experiment results for Case 1.
| Positioning Decision | RP1 | RP2 | RP3 | RP4 | … | RP74 | |
|---|---|---|---|---|---|---|---|
| Dimension experiments RP | 1 | 1 | 2 | 2 | 3 | … | 73 |
| 2 | 1 | 2 | 3 | 4 | 74 | ||
| 3 | 2 | 2 | 3 | 4 | 73 | ||
| 4 | 1 | 3 | 3 | 5 | 74 | ||
| 5 | 1 | 4 | 4 | 4 | 74 | ||
| Success decisions for the dimension | Margin-0 | 4 | 3 | 3 | 3 | … | 3 |
| Margin-1 | 5 | 4 | 5 | 5 | 5 | ||
| Margin-2 | 5 | 5 | 5 | 5 | 5 | ||
| Dimension experiments TH(RH) | 1 | 1(1) | 5(5) | 2(2) | 3(3) | … | 2(5) |
| 2 | 2(3) | 2(2) | 1(1) | 2(2) | 4(4) | ||
| 3 | 5(5) | 3(1) | 2(1) | 2(5) | 3(3) | ||
| 4 | 2(2) | 1(1) | 4(4) | 3(3) | 1(2) | ||
| 5 | 3(3) | 1(3) | 3(3) | 2(1) | 5(5) | ||
| Success decisions for dimension | Margin-0 | 4 | 3 | 4 | 3 | … | 3 |
Table 7.
Real-time experimental results for the indoor positioning accuracy in the and dimensions.
| Case | Time and Direction | Test Number | (X, Y) Dimension Accuracy (%) | (H) Dimension Accuracy (%) | ||
|---|---|---|---|---|---|---|
| Margin-0 (0 m Error) | Margin-1 (2 m Error) | Margin-2 (4 m Error) | Margin-0 (0 m Error) | |||
| Case 1 | MF | 1 | 56.77 | 86.57 | 89.76 | 88.09 |
| AF | 2 | 57.01 | 88.33 | 91.90 | 87.36 | |
| MB | 3 | 56.89 | 86.20 | 89.78 | 88.70 | |
| AB | 4 | 57.21 | 86.74 | 90.97 | 88.45 | |
| MB | 5 | 56.09 | 88.15 | 89.75 | 87.78 | |
| AB | 6 | 56.72 | 86.37 | 89.86 | 87.68 | |
| MF | 7 | 56.56 | 86.31 | 90.54 | 89.22 | |
| AB | 8 | 58.02 | 86.90 | 93.27 | 89.98 | |
| Average | 56.91 | 86.95 | 90.73 | 88.41 | ||
| Case 2 | MF | 1 | 56.98 | 88.90 | 92.57 | 90.33 |
| AF | 2 | 56.83 | 86.05 | 90.33 | 89.41 | |
| MB | 3 | 58.56 | 88.07 | 90.55 | 90.06 | |
| AB | 4 | 57.61 | 86.33 | 90.60 | 90.42 | |
| MB | 5 | 57.90 | 87.58 | 90.59 | 90.54 | |
| AB | 6 | 57.77 | 87.62 | 91.48 | 89.46 | |
| MF | 7 | 57.31 | 88.47 | 90.34 | 91.08 | |
| AB | 8 | 56.56 | 88.06 | 90.81 | 89.73 | |
| Average | 57.44 | 87.63 | 90.91 | 90.13 | ||
Table 8.
Example of real-time experimental results for Case 1 for the dimension.
| Position Decision 1 in Test 1 | Position Decision 2 in Test 1 | ||
|---|---|---|---|
| True Location | Test Result | True Location | Test Result |
| (RP1, HRP1) | (RP1, HRP1) | (RP1, HRP3) | (RP1, HRP2) |
| (RP2, HRP5) | (RP2, HRP5) | (RP2, HRP2) | (RP2, HRP2) |
| (RP3, HRP2) | (RP2, HRP2) | (RP3, HRP1) | (RP3, HRP1) |
| (RP4, HRP3) | (RP3, HRP3) | (RP4, HRP2) | (RP3, HRP2) |
| (RP5, HRP2) | (RP5, HRP4) | (RP5, HRP2) | (RP5, HRP4) |
| … | … | ||
| (RP73, HRP4) | (RP72, HRP4) | (RP73, HRP3) | (RP71, HRP2) |
| (RP74, HRP5) | (RP73, HRP2) | (RP74, HRP4) | (RP74, HRP4) |
Table 9.
Real-time experimental results for the indoor positioning accuracy in the dimension.
| Case 1 Accuracy (%) | ||||||||||||||
| Test | Decision | Margin | Test | Decision | Margin | Test | Decision | Margin | ||||||
| 0 | 1 | 2 | 0 | 1 | 2 | 0 | 1 | 2 | ||||||
| 1 | 1 | 51.4 | 73.0 | 79.7 | 4 | 16 | 52.7 | 71.6 | 82.4 | 7 | 31 | 48.6 | 71.6 | 79.7 |
| 2 | 50.0 | 74.3 | 81.1 | 17 | 51.4 | 71.6 | 82.4 | 32 | 51.4 | 71.6 | 79.7 | |||
| 3 | 48.6 | 75.7 | 79.7 | 18 | 51.4 | 71.6 | 83.8 | 33 | 52.7 | 75.7 | 82.4 | |||
| 4 | 50.0 | 71.6 | 82.4 | 19 | 50.0 | 74.3 | 82.4 | 34 | 51.4 | 73.0 | 81.1 | |||
| 5 | 51.4 | 74.3 | 83.8 | 20 | 48.6 | 71.6 | 81.1 | 35 | 54.1 | 71.6 | 82.4 | |||
| 2 | 6 | 51.4 | 73.0 | 79.7 | 5 | 21 | 52.7 | 70.3 | 81.1 | 8 | 36 | 50.0 | 73.0 | 82.4 |
| 7 | 52.7 | 74.3 | 79.7 | 22 | 52.7 | 70.3 | 82.4 | 37 | 51.4 | 71.6 | 81.1 | |||
| 8 | 52.7 | 73.0 | 81.1 | 23 | 51.4 | 74.7 | 82.4 | 38 | 50.0 | 74.3 | 82.4 | |||
| 9 | 51.4 | 74.3 | 81.1 | 24 | 50.0 | 73.0 | 81.1 | 39 | 52.7 | 71.6 | 81.1 | |||
| 10 | 50.0 | 71.6 | 82.4 | 25 | 50.0 | 74.3 | 82.4 | 40 | 48.6 | 71.6 | 79.7 | |||
| 3 | 11 | 50.0 | 75.7 | 79.7 | 6 | 26 | 50.0 | 71.6 | 79.7 | Average | 50.8 | 72.9 | 81.4 | |
| 12 | 48.6 | 71.6 | 81.1 | 27 | 50.0 | 74.3 | 83.8 | |||||||
| 13 | 52.7 | 70.3 | 82.4 | 28 | 51.4 | 73.0 | 82.4 | |||||||
| 14 | 50.0 | 73.0 | 79.7 | 29 | 51.4 | 74.3 | 81.1 | |||||||
| 15 | 48.6 | 74.3 | 81.1 | 30 | 48.6 | 73.0 | 81.1 | |||||||
| Case 2 Accuracy (%) | ||||||||||||||
| Test | Decision | Margin | Test | Decision | Margin | Test | Decision | Margin | ||||||
| 0 | 1 | 2 | 0 | 1 | 2 | 0 | 1 | 2 | ||||||
| 1 | 1 | 52.7 | 74.3 | 82.4 | 4 | 16 | 51.1 | 77.0 | 85.1 | 7 | 31 | 52.7 | 73.0 | 81.1 |
| 2 | 54.1 | 77.0 | 83.8 | 17 | 52.7 | 73.0 | 82.4 | 32 | 51.4 | 71.6 | 82.4 | |||
| 3 | 52.7 | 75.7 | 81.1 | 18 | 54.1 | 75.7 | 83.8 | 33 | 54.1 | 73.0 | 83.8 | |||
| 4 | 51.4 | 73.0 | 85.1 | 19 | 52.7 | 73.0 | 85.1 | 34 | 52.7 | 74.3 | 82.4 | |||
| 5 | 52.7 | 75.7 | 83.8 | 20 | 51.4 | 74.3 | 85.1 | 35 | 51.4 | 75.7 | 82.4 | |||
| 2 | 6 | 52.7 | 75.7 | 81.1 | 5 | 21 | 52.7 | 77.0 | 83.8 | 8 | 36 | 52.7 | 74.3 | 81.1 |
| 7 | 52.7 | 75.7 | 82.4 | 22 | 52.7 | 75.7 | 83.8 | 37 | 51.4 | 74.3 | 85.1 | |||
| 8 | 54.1 | 73.0 | 83.8 | 23 | 54.1 | 74.3 | 81.1 | 38 | 50.0 | 75.7 | 82.4 | |||
| 9 | 52.7 | 73.0 | 83.8 | 24 | 54.1 | 73.0 | 83.8 | 39 | 51.4 | 74.3 | 83.8 | |||
| 10 | 51.4 | 75.7 | 81.1 | 25 | 51.4 | 74.3 | 82.4 | 40 | 51.4 | 74.3 | 85.1 | |||
| 3 | 11 | 51.4 | 77.0 | 82.4 | 6 | 26 | 52.7 | 74.3 | 82.4 | Average | 52.4 | 74.5 | 82.8 | |
| 12 | 54.1 | 74.3 | 83.8 | 27 | 51.4 | 71.6 | 83.8 | |||||||
| 13 | 52.7 | 75.7 | 81.1 | 28 | 50.0 | 74.3 | 83.8 | |||||||
| 14 | 54.1 | 74.3 | 82.4 | 29 | 51.4 | 73.0 | 81.1 | |||||||
| 15 | 52.7 | 75.7 | 83.8 | 30 | 52.7 | 73.0 | 83.8 | |||||||
Table 10.
Comparison of indoor positioning accuracy in Cases 1 and 2 in the and dimensions.
| Case | (X, Y, H) Dimension (%) | (X, Y) Dimension (%) | Difference (%) | ||||||
|---|---|---|---|---|---|---|---|---|---|
| Margin-0 | Margin-1 | Margin-2 | Margin-0 | Margin-1 | Margin-2 | Margin-0 | Margin-1 | Margin-2 | |
| Case 1 | 50.8 | 72.9 | 81.4 | 56.91 | 86.95 | 90.73 | −6.11 | −14.05 | −9.33 |
| Case 2 | 52.4 | 74.5 | 82.8 | 57.44 | 87.63 | 90.91 | −5.04 | −13.13 | −8.11 |
Disclaimer/Publisher’s Note: The statements, opinions and data contained in all publications are solely those of the individual author(s) and contributor(s) and not of MDPI and/or the editor(s). MDPI and/or the editor(s) disclaim responsibility for any injury to people or property resulting from any ideas, methods, instructions or products referred to in the content. |
© 2024 by the authors. Licensee MDPI, Basel, Switzerland. This article is an open access article distributed under the terms and conditions of the Creative Commons Attribution (CC BY) license (https://creativecommons.org/licenses/by/4.0/).
Share and Cite
MDPI and ACS Style
Liu, S.; Lu, H.; Hwang, S.-H. Three-Dimensional Indoor Positioning Scheme for Drone with Fingerprint-Based Deep-Learning Classifier. Drones 2024, 8, 15. https://doi.org/10.3390/drones8010015
AMA Style
Liu S, Lu H, Hwang S-H. Three-Dimensional Indoor Positioning Scheme for Drone with Fingerprint-Based Deep-Learning Classifier. Drones. 2024; 8(1):15. https://doi.org/10.3390/drones8010015
Chicago/Turabian StyleLiu, Shuzhi, Houjin Lu, and Seung-Hoon Hwang. 2024. "Three-Dimensional Indoor Positioning Scheme for Drone with Fingerprint-Based Deep-Learning Classifier" Drones 8, no. 1: 15. https://doi.org/10.3390/drones8010015