
Harmonized Skies: A Survey on Drone Acceptance across Europe


1
Institute of Flight Guidance, German Aerospace Center, 38108 Brunswick, Germany
2
SKOPOS Institute for Market and Communication Research GmbH & Co. KG, 50354 Hürth, Germany
*
Author to whom correspondence should be addressed.
Drones 2024, 8(3), 107; https://doi.org/10.3390/drones8030107
Submission received: 6 February 2024
/
Revised: 13 March 2024
/
Accepted: 14 March 2024
/
Published: 20 March 2024
(This article belongs to the Collection Feature Papers of Drones Volume II)
Abstract
:This study investigated the public acceptance of drones in six European countries. For this purpose, an online questionnaire was created, which was completed by 2998 participants. The general attitude towards drones, concerns, approval for different use cases, minimum tolerable flight altitude, acceptable flight areas, and the impact of personal and demographic attributes on drone acceptance were analyzed. Overall, attitudes towards drones were quite positive in the entire sample and even improved slightly in a second measurement at the end of the questionnaire. However, the results also show that acceptance strongly depends on the use case. Drones for civil and public applications are more widely accepted than those for private and commercial applications. Moreover, the population still has high concerns about privacy and safety. Knowledge about drones, interest in technologies, and age proved essential to predicting acceptance. Thus, tailored communication strategies, for example, through social media, can enhance public awareness and acceptance.
1. Introduction
Drones, ranging from hobbyist devices to potential air taxis, might become increasingly prevalent in our skies, shaping a dynamic and an evolving global market [1]. As people might be affected by drones by overflights or by being active users of specific use cases, public approval of drone missions is crucial for many business cases, and is also an enabler for the implementation of U-space in Europe. U-space envisages numerous digital supporting services to ensure safe drone operations in busy airspaces like those above urban areas [2]. This approach harmonizes regulations and introduces innovative services and procedures, marking a pivotal advancement in drone operations [3]. There are different attempts to harmonize the European drone market. The European Drones Outlook Study prioritizes coordination and alignment at the European level. This refers to an “EU drone package” that needs to be implemented quickly to establish a single drone market. According to a SESAR-based study, a shared technological and regulatory ecosystem is required to bring together all relevant stakeholders [4]. The CORUS-XUAM project released the fourth edition of a Concept of Operation (ConOps) for European uncrewed air traffic. It comprises, for example, infrastructure, safety, traffic management, flight rules, and also social acceptability [2]. Social acceptance is also addressed in the European Drone Strategy 2.0 of the European Commission. The Commission is interested in ensuring that drones are supported by society and addressing concerns like noise, safety, and privacy [5].
Since EU-wide harmonization among the European population requires a high level of drone approval, the following study is dedicated to this topic. The study focuses on civil drones, representing diverse systems and vehicles that can operate in a highly automated manner. According to Boucher, these drones encompass individual flying devices, ground stations, software systems, communication infrastructures, and other components. RPAS (Remotely Piloted Aircraft Systems) vehicles vary in size, weight, and automation levels. They are often categorized by weight, with a significant regulatory threshold of 150 kg; drones under this limit are regulated at the national level, while those above are regulated at the European level. System complexity varies based on operating altitudes, line of sight, and applications, including state, commercial, and recreational uses. RPAS are highly customizable, allowing the same base system to be configured with different payloads for various marketable services in government, commercial, and recreational sectors [6].
To investigate the general acceptance of drones in Europe, an online survey was conducted across six European countries within the project USpace4UAM [7]. The study addresses various aspects of drone acceptance, including the general attitude toward drones, approval for specific use cases, concerns, tolerable flight altitudes, approval of drone flights in different areas, and the impact of demographic and personal attributes on acceptance. The survey is based on the telephone survey conducted by the German Aerospace Center in 2018 [8]. It covers many of the same aspects but in several EU countries.
2. Theoretical Framework
2.1. State of Research
According to an EASA survey conducted in several European cities in 2021, individuals have a strong interest in using drone services and have a mainly positive perception of drones [9]. Acceptance may differ depending on the nation being polled. For instance, responses to German surveys varied between very positive and very negative opinions about civilian drone use [8,10]. In Australia, a different study revealed more neutral attitudes [11]. A survey including the US public and UAM stakeholders identified several factors affecting public acceptance of drones. Among them are perceived benefits and risks, use case, flight area, drone characteristics, usage, and production costs [12].
A systematic literature review conducted by Sabino et al. identified the main expected benefits as flexibility and variety of drone applications, cost reductions, technology safety, and the applicability of drones for emergency response and monitoring [13]. A Nordic study indicates that the main benefit of using drones is seen in improved accessibility of areas that are hard to reach [14]. About concerns, numerous surveys have shown that people’s primary worries are that drones might invade their privacy [8,10,12,13,14,15,16,17,18] or that the technology is not secure enough [8,9,10,13,14,15,16,17,19,20,21,22,23,24,25,26] and drones might crash and hurt people.
Research also shows that the acceptance of drones depends on the use case. Public, industrial, or health-related applications are favored over private and commercial ones [8,10,14,16,17,27]. For example, drone usage for civil protection, science, and medical delivery is more tolerated than parcel or passenger transport. Furthermore, it makes a difference where drones fly. People would rather accept drones flying in sparsely populated areas [8,21] than close to houses and people. Use cases that benefit society may be an exemption [23]. When planning drone missions and flight routes, it also needs to be considered that visual and acoustic pollution caused by drones may disturb people and influence public acceptance negatively [8,20,23,24,28,29,30,31].
2.2. Research Questions
The state of research shows that drone acceptance has already been examined in numerous studies and various facets. However, many studies examined acceptance in one country and not on a broader level. The EASA survey was conducted in various European countries but focused on passenger transportation and parcel delivery by drone rather than drones in general [9]. This study also focuses on several EU countries and covers all civilian drones, which have a wide range of applications, e.g., filming, parcel delivery, rescue missions, research, hobbies, etc. This study aims to record the acceptance of drones in several European countries and to compare it between the individual countries. Previous research shows that drone acceptance is built upon several factors. Firstly, people have a general attitude towards drones. Secondly, it is essential for drone acceptance that the population does not have strong concerns about the implementation of drones. Studies have also shown that acceptance depends on the intended use and that not all use cases are equally accepted. Attitude, concerns, and approval for different use cases are therefore used in this study to measure the construct of acceptance. These three aspects were analyzed for the entire sample. Furthermore, comparisons were made between countries. The following research questions guided this analysis:
RQ1a:
How high is the public acceptance of drones at the European level?
RQ1b:
Does the public acceptance of drones vary throughout different European countries?
To harmonize the regulations for drone traffic throughout the EU, it is crucial to determine the population’s requirements regarding mission planning, as they may be affected by the visual presence of flying drones and/or their noise impact. As described in the state of research, there are already initial indications that drones could disturb people. To avoid this, it could be essential to consider where drones fly and at what altitude. Previous studies have already shown preferences on the part of the population concerning the flight area. The flight altitude can also play a role, as this determines whether a drone is perceived visually and/or acoustically by people on the ground. This aspect is also crucial for the localization of landing sites, as drones fly at very low altitudes during take-off and landing, and people in the vicinity may be disturbed by this. This study, therefore, investigated the acceptance of flights in different areas and the minimum tolerated flight altitude for drones for public, commercial, and private purposes. The following research question drove this analysis:
RQ2:
What are the requirements of the general public regarding flight planning (flying area and altitude) for drones?
As the public should accept the regulations for flying drones in general, this study was interested in understanding the influence of individual factors on acceptance. This knowledge could be helpful to understand if and which groups there are in the general public concerning the acceptance of drones. A random forest model was created for this purpose. The model incorporates several factors identified as relevant in previous research [8,10,11,13,21,29,32]. These include gender, age, income, residence, knowledge about drones, interest in modern technologies, and drone experience. Additionally, the country of the participants was included. The analysis dealt with the following research question:
RQ3:
How do personal and demographic factors affect the acceptance of drones?
3. Method
3.1. Procedure
A questionnaire was developed and distributed across six European nations to investigate the public acceptance of drones in Europe. These nations comprised Germany, the United Kingdom (UK), Poland, Spain, the Czech Republic, and Austria. These countries were selected because they were represented in the Uspace4UAM project consortium.
One part of the questionnaire addressed the acceptance of drones in general, involving attitude, use cases, concerns, minimum flight altitude, flying area, and personal and demographic attributes. The second part focused on the acceptance and possible usage of air taxis. This paper will only report the methodology and findings of the first questionnaire section regarding the overall acceptance of drones. One exception is the item on the acceptance of various use cases. Drones for passenger transportation were included here because this is a frequently mentioned business case.
The questionnaire addressed civilian drones, not those used for military purposes. To explain the term drones, the participants were given the following definition at the beginning of the questionnaire: “The drones we are talking about have a size from 50 cm up to 2 m. They have multiple rotors and are powered by batteries. We are talking about civilian drones, that for example are used to take pictures or videos or transport smaller objects. These drones are controlled by humans from the ground or fly fully independently on a pre-planned route”.
The questionnaire items are based on the telephone poll conducted by the German Aerospace Center (DLR) in 2018 [8]. Other response choices and additional items, though, were employed. Overall attitude, acceptance of use cases, and different concerns about drones were measured on a 7-point scale with extrema labeling (attitude: 1 = very negative, 7 = very positive; concerns: 1 = not concerned at all, 7 = very concerned; acceptance of use cases and flying area: 1 = strongly disagree, 7 = strongly agree). Participants were also offered a “Don’t know” option for the items mentioned. Concerns (10 items) and uses cases (11 items) were measured via matrix questions in which the participants were asked to rate each item from the matrix on the scale. Additionally, concerns were captured by asking participants to write their worries about drones in an open text form. To evaluate the minimum tolerable flight altitude, the participants were asked to choose their preferred altitude for public, commercial, and private drone applications from different flight altitudes. The question referred to the cruising altitude of a drone, i.e., a flyover, not to take off or land. Response categories comprise 1 = no minimum flight altitude, 2 = 10 m (maple tree, one-family house), 3 = 15 m (multi-family house with four levels), 4 = 20 m (Brandenburg Gate, Berlin), 5 = 50 m (Arc de Triomphe, Paris), 6 = 100 m (Big Ben, London), 7 = more than 100 m, 8 = don’t know. The response categories 5–7 were not included in the telephone survey 2018 and were added to this study, as the flight altitudes are more likely to correspond to the actual cruising altitudes. Lower altitudes are more relevant in the hobby sector or for take-off and landing processes. As can be seen from the response categories, various types of buildings or tree heights were given as a reference for the respective flight altitudes so that the participants could better visualize them.
The market research institute SKOPOS conducted the data collection on behalf of DLR. SKOPOS adapted the questionnaire to the respective native languages of the individual countries. Recruitment was carried out via an online access panel. Population-representative quotas for gender and age were used for each country. If corresponding quotas were reached, the survey was closed for these groups of people. The age limit for participants was set between 18 and 65 years old, as the proportion of internet users among older people in the six countries surveyed varies considerably (between 43 and 76 percent) [33,34]. This could lead to a bias, particularly in countries with a lower proportion, because internet use may be determined by factors such as affinity for technology or social status. Furthermore, an analysis in Germany shows that significantly fewer older women have access to the Internet than older men [35]. Participation in the survey was financially remunerated. The survey was run from April to May 2022.
3.2. Analysis
The data-cleaning process was conducted by SKOPOS. For this purpose, response rates, the variance within item batteries, the fit of open-ended responses to the question, and the general consistency of response behavior were analyzed. Any data records with conspicuous deviations were removed.
The analyses in this study comprise various methods. These include exploratory methods such as factor analysis, statistical tests such as t-tests, ANOVAs, non-parametric tests, and algorithms such as random forest. A significance level of α = 0.05 was set for all statistical tests, and missing values have been removed. This was performed for each item individually by excluding cases that selected the “Don’t know” response option.
The dataset referring to the questionnaire part on the general acceptance of drones is available in a publicly accessible repository.
3.2.1. Attitude
The mean values of attitude toward drones were calculated. With a paired t-test, it was analyzed whether the means significantly differed at the survey’s beginning and end. With a one-way ANOVA, differences between the countries were explored.
3.2.2. Use Cases
Mean values were calculated for the different use cases, including the whole sample. A Principal Component Analysis (PCA) was conducted to explore components, and according to the outcome, those use cases belonging to a dimension were consolidated to a scale. The mean values of these scales were then compared using a paired t-test to detect significant differences between the factors for each country. With a one-way ANOVA, differences between the countries were analyzed.
3.2.3. Concerns
Mean values were calculated for the 10 concerns-related items and then aggregated to one scale. According to a reliability analysis, the scale’s internal consistency was high (α = 0.909). The mean values of the scale were compared using a one-way ANOVA to evaluate whether mean values significantly differed between countries.
Participants could additionally express their concerns in an open-response format. The answers were translated into English with Google Translate from the library “deep_translator” [36]. This is a flexible, accessible, unlimited Python tool that uses multiple translators to translate between different languages. The frequencies of the individual words were determined with Python’s library NLTK, a platform for building Python programs to work with human language data [37]. Words that were not related to concerns were removed. Then, a list containing all content-bearing words and their frequencies was created. The word frequencies for the whole sample and the individual countries were visualized in a word cloud. The size of the words was an indicator of the weights (frequency). A further analysis was conducted to determine the frequency of responses indicating no concerns. For this purpose, the keyword “no” was searched within all answers and only responses which indicated no concerns were filtered.
3.2.4. Flying Area and Flight Altitude
To evaluate the acceptance of flight areas, mean values related to the approval of drone flights in different community types and city areas were calculated. Regarding flight altitude, mean values for the acceptable minimum flight altitudes were compared between public, commercial, and private drone applications using a Friedman test.
3.2.5. Impact of Demographic and Personal Attributes on Acceptance
The impact of demographic and personal attributes on acceptance was analyzed using the random forest method. Random forest is an ensemble model from machine learning and is one of the supervised learning algorithms. The method was developed by Leon Breiman [38]. A random forest can be used to make predictions of a target variable using several predictor variables and to determine the influence of the individual predictor variables. For the prediction, the algorithm divides the data into randomized subsets, creates randomized tree predictors, and aggregates their predictions. For instance, in regression scenarios, averages are used to aggregate predictions [39,40]. By combining multiple uncorrelated decision trees, the predictive accuracy can be enhanced. Random forest analyses are versatile for classification and regression tasks [38,41]. They construct decision trees by considering every possible split on each predictor variable, selecting the “best” split based on criteria like Root Mean Square Error (RMSE). This recursive process continues until a stopping criterion is met and terminal nodes are formed [42]. Using the CART (classification and regression trees) algorithm, random forest establishes optimal decision thresholds for variables through recursive partitioning. This overcomes the limitations of single-tree CART models in handling complex data. In construction, random forest generates hundreds or thousands of decision trees, averting overfitting by aggregating their outputs [43].
In our analysis, acceptance involved the target variable’s attitude, concerns, and approval for private and commercial and public and civil use cases. For each target variable, a random forest regression was conducted. There is proof from the literature that knowledge of drones, experience with drones [8,29], gender [8], inhabitants of residence [21], age, and income [8] have an impact on acceptance. Thus, they were included as predicting features in all analyses. Besides that, country and interest in modern technologies were additional predictor variables. In the random forest analysis, dummy coding of the categorical variable’s country, gender, and income was used to allow the algorithm to capture non-linear relationships between the categories better and improve the model’s performance. For the reporting in the results section (Section 4.3), the model predictions were aggregated back to their original response categories for better readability. The variable income is initially available in the dataset in separate categories with different currencies for each country. A new variable with Euro values was created for the analysis based on Eurostat statistics 2018 [44]. These provide the average annual household income for all EU countries. The average income was assigned to the “moderate income” category. Values below this were defined as “low income” and those above as “high income”. There is also the response category “not specified”.
Missing values were not included in the analyses. All random forest regressions followed the same procedure. In the first step, 10-fold cross-validation was carried out to assess the model’s predictive performance. In the next step, hyperparameters were optimized. They included the number of estimators (number of trees), the maximum depth of each tree, and the minimum sample in a split. In the optimization process, all possible combinations of parameters were tested following a grid search approach. The combination resulting in the lowest RMSE was chosen for the model.
The Python codes for the random forest analyses are available in a publicly accessible repository.
3.2.6. Sample
A total of 2998 people responded to the questionnaire. Around 500 people from each of the six countries participated. Fifty-one percent were female, 48 percent were male, and less than one percent chose the “diverse” option or denied the answer. The age of the sample ranged from 18 to 65, with an average age of 41 (SD = 13). More than half of the participants had a university degree or a vocational education. The general interest in modern technology was moderate to high across the sample (M = 6.49, SD = 2.56; 0 = not at all interested in modern technologies, 10 = very interested in modern technologies). Most people already had some experience with drones, albeit mostly second-hand expertise (63%), meaning having seen or heard drones. A total of 19% of the respondents had used a drone independently and had first-hand experience. Only 18% stated they had no experience with drones.
A few things became apparent when looking for potential biases In the sample. First, compared to other countries, there were noticeably more individuals in Spain who held a university degree, and in the Czech Republic, there were many people with secondary modern school qualifications. Despite the UK’s 84% urbanization rate [45], most participants in the sample lived in small towns. Lastly, individuals with a high income dominated in the Czech Republic and the United Kingdom.
4. Results
4.1. Attitude
Mean values indicate that at the beginning of the questionnaire, attitudes toward drones ranged from moderate to positive across all countries (see Figure 1). The most positive attitude was observed in Poland and the most negative in Austria. A one-way ANOVA revealed an overall significant effect when comparing the mean values of attitude between the six countries (F(5,2724) = 46.6, p < 0.001, ηp2 = 0.079, n = 2730). It was a moderate effect with an effect size of f = 0.29. According to the pairwise comparison, Poland (M = 5.64, SD = 1.32) and Spain (M = 5.46, SD = 1.32) differed significantly from every other country (Germany: M = 4.68, SD = 1.55; UK: M = 4.67, SD = 1.51; Czech Republic: M = 4.84, SD = 1.47; Austria: M = 4.54, SD = 1.49). Moreover, there was a significant difference between the Czech Republic (M = 4.84, SD = 1.47) and Austria (M = 4.54, SD = 1.49).
Attitude was measured at the beginning and end of the drone-related section of the questionnaire. The findings revealed a slight increase in almost all countries except Poland and Spain, where a slight decrease could be observed.
A paired t-test was conducted to analyze whether there was a significant change in attitude in the overall sample. Findings exhibited a significant improvement (t = −6.06, p < 0.001, n = 2687) between the first (M = 4.99, SD = 1.50) and the second measurement (M = 5.11, SD = 1.38). The effect size due to Cohen (1988) was d = 0.12, which is a weak effect. Paired t-tests were also conducted for the single countries, pointing out that attitude significantly improved in the UK, the Czech Republic, and Austria, as well as in the total sample (see Table 1).
4.2. Use Cases
Mean values related to the approval for various drone use cases suggested two categories of applications with different acceptance levels. The use cases (see Figure 2), ranging from disaster management to monitoring transport networks and energy supply, were more accepted by people than the use cases ranging from photos and videos for news reports to passenger transport, which were moderately accepted.
Thus, an explorative factor analysis tested their structure to aggregate the items for further analyses. The Bartlett test (χ2(55) = 16,150.52, p < 0.001), as well as the Kaiser–Meyer–Olkin Measure of Sampling Adequacy (KMO = 0.919), suggested that the variables were appropriate for using factor analysis. Thus, a PCA with varimax rotation was conducted. The analysis suggested two factors with an eigenvalue bigger than 1.0. Therefore, a two-factor solution was chosen, which explains 66 percent of the variance. Factor 1 was defined as civil and public use cases, and factor 2 was defined as private and commercial use cases (see Table 2). This is the same structure as the bar chart in Figure 2 suggests. A reliability analysis indicated a high internal consistency for factors 1 (α = 0.896) and 2 (α = 0.853).
A paired t-test revealed significant differences (t = 46.31, p < 0.001, n = 2572) between public and civil (M = 5.62, SD = 1.24) and private and commercial drone applications (M = 4.53, SD = 1.47) in the total sample. The effect size due to Cohen (1992) was r = 0.91, which is a strong effect. Paired t-tests were also performed for the individual countries, demonstrating significant differences between the use cases (see Table 3 and Figure 3).
A one-way ANOVA further revealed a significant difference for both private and commercial F(5,2638) = 35.7, p < 0.001, ηp2 = 0.063, n = 2644) and public and civil use cases F(5,2766) = 11.5, p < 0.001, ηp2 = 0.020, n = 2772) between the countries. The effect size was moderate for private and commercial (f = 0.26) and small for public and civil use cases (f = 0.14).
In the case of private and commercial use cases, Games–Howell posthoc tests indicated that the mean value in Poland (M = 5.17, SD = 1.31) significantly differed from all other countries (Germany: M = 4.14, SD = 1.58; UK: M = 4.32, SD = 1.43; Spain: M = 4.73, SD = 1.32; Czech Republic; M = 4.62, SD = 1.43; Austria: M = 4.12, SD = 1.46). Spain (M = 4.73, SD = 1.32), and the Czech Republic (M = 4.62, SD = 1.43) significantly differed from Germany (M = 4.14, SD = 1.58), the UK (M = 4.32, SD = 1.43), Poland (M = 5.17, SD = 1.31), and Austria (M = 4.12, SD = 1.46).
In terms of public and civil use cases, Games–Howell posthoc tests showed that the mean values in Germany (M = 5.48, SD = 1.33) and the UK (M = 5.44, SD = 1.26) significantly differed from those in Poland (M = 5.90, SD = 1.17), Spain (M = 5.78, SD = 1.14), and the Czech Republic (M = 5.78, SD = 1.16). Additionally, Austria (M = 5.50, SD = 1.24) significantly differed from Poland (M = 5.90, SD = 1.17), Spain (M = 5.78, SD = 1.14), and the Czech Republic (M = 5.78, SD = 1.16).
4.3. Concerns
Responses related to various drone concerns showed that people were moderately to intensely concerned about the different aspects. The biggest concern was that drones might violate citizens’ privacy or be misused for criminal actions. Participants were least concerned about drone noises (see Figure 4).
All concern-related items were aggregated to one scale by calculating mean values for further analyses. Mean values for the different countries revealed the highest level of concern in Germany and the UK and the lowest in Poland (see Figure 5).
A one-way ANOVA revealed an overall significant effect when comparing the mean values of the concern scale between the six countries (F(5,2608) = 12.9, p < 0.001, ηp2 = 0.024, n = 2614). It was a small effect with an effect size of f = 0.16. Games–Howell posthoc tests indicate significant differences between Poland (M = 4.40, SD = 1.36) and Germany (M = 4.94, SD = 1.19), UK (M = 4.96, SD = 1.24), Spain (M = 4.84, SD = 1.20), and Austria (M = 4.85, SD = 1.17). Furthermore, there are significant differences between the Czech Republic (M = 4.63, SD = 1.25) and Germany (M = 4.94, SD = 1.19) and the UK (M = 4.96, SD = 1.24).
Concern-related statements from the open response format were analyzed according to the frequency of content-bearing keywords. Figure 6 visualizes the outcome in a word cloud. It involves the results from the entire sample. The five most common concern-related words of each subsample are shown in Table 4. The word privacy was mentioned most often across all countries. The results are consistent with the findings from the previous analysis, which indicates privacy concerns and concerns about criminal abuse are most important.
The relative frequency of people with no concerns was 28% for the whole sample. Table 5 shows the relative frequencies of participants without concerns for each country. According to the findings, Poland and the UK had the highest number of respondents without concerns, whereas the Czech Republic had the lowest.
4.4. Flying Area and Flight Altitude
Mean values for flight areas where drone operations are acceptable showed that drone flights are most favorable in uninhabited regions. Only in this category were responses rather positive. The acceptance of flights over sparsely populated areas and small towns was moderate, whereas it dropped into the negative scale range for medium-sized and big cities (see Figure 7).
As drone operations in big cities are unfavorable, the acceptance of flights in various city areas was moderate to negative (Figure 8). In cities, flights were most tolerable in industrial parks and recreational areas, whereas they were less acceptable in city centers and housing areas.
According to relative frequencies of tolerable minimum flight altitudes for different drone applications, drones used for public functions can fly at lower altitudes of up to 20 m, which was acceptable to 50% of participants. In comparison, fewer people would tolerate such altitudes for private or commercial uses (see Figure 9).
The results of a Friedman test revealed that the tolerated minimum flight altitude significantly differed between the three fields of use (ꭓ2 (2) = 141.39, p < 0.001, n = 2183). Lower altitudes were acceptable for drones with public functions, followed by privately used drones. Commercial drones should fly at high altitudes. According to a Dunn–Bonferroni posthoc test there were significant differences between public and private drones (z = 0.13, p < 0.001, Cohen’s r = 0.00), public and commercial drones (z = 0.30, p = < 0.001, Cohen’s r = 0.01), as well as between private and commercial drones (z = −0.18, p < 0.001, Cohen’s r = 0.00). However, the effect sizes mentioned show that this was an extremely weak effect. For each field of usage, 20 percent or more of the participants chose the “Don’t know” option. Thus, they were not considered in the Friedman test.
A look at the total frequencies was taken to see if the number of participants who chose the “Don’t know” option was associated with drone experience. The frequencies are presented in Table 6. In all categories (drones with public, commercial, and private functions), it appears that within the group of participants with no experience, there was the highest number of individuals who chose “Don’t know” (around 40% in each category) compared to the groups of participants with first- or second-hand experience.
4.5. Impact of Demographic and Personal Attributes on Acceptance
A random forest analysis was conducted for four target variables, each involving eight predicting features. The correlation matrix in Figure 10 shows that none of the factors in the model correlate too highly with each other, as all coefficients are below 0.8.
In each model’s first step, a 10-fold cross-validation was performed, followed by hyperparameter optimization to increase the model performance. Table 7 provides an overview of each random forest analysis’s selected parameters, model performance, and sample size. The sample sizes differ because missing values were removed beforehand. The hyperparameters involved the maximum depth of the regression trees, the number of trees (estimators), and the minimum sample split. The selected hyperparameters resulting in the lowest RMSE, and thus being used for building the random forest, are shown. The out-of-bag (OOB) accuracy indicates the correct predictions and is a metric for the model performance. Its values range between 0 and 1. The OOB values indicate that more than 80% of the predictions were made correctly in each model.
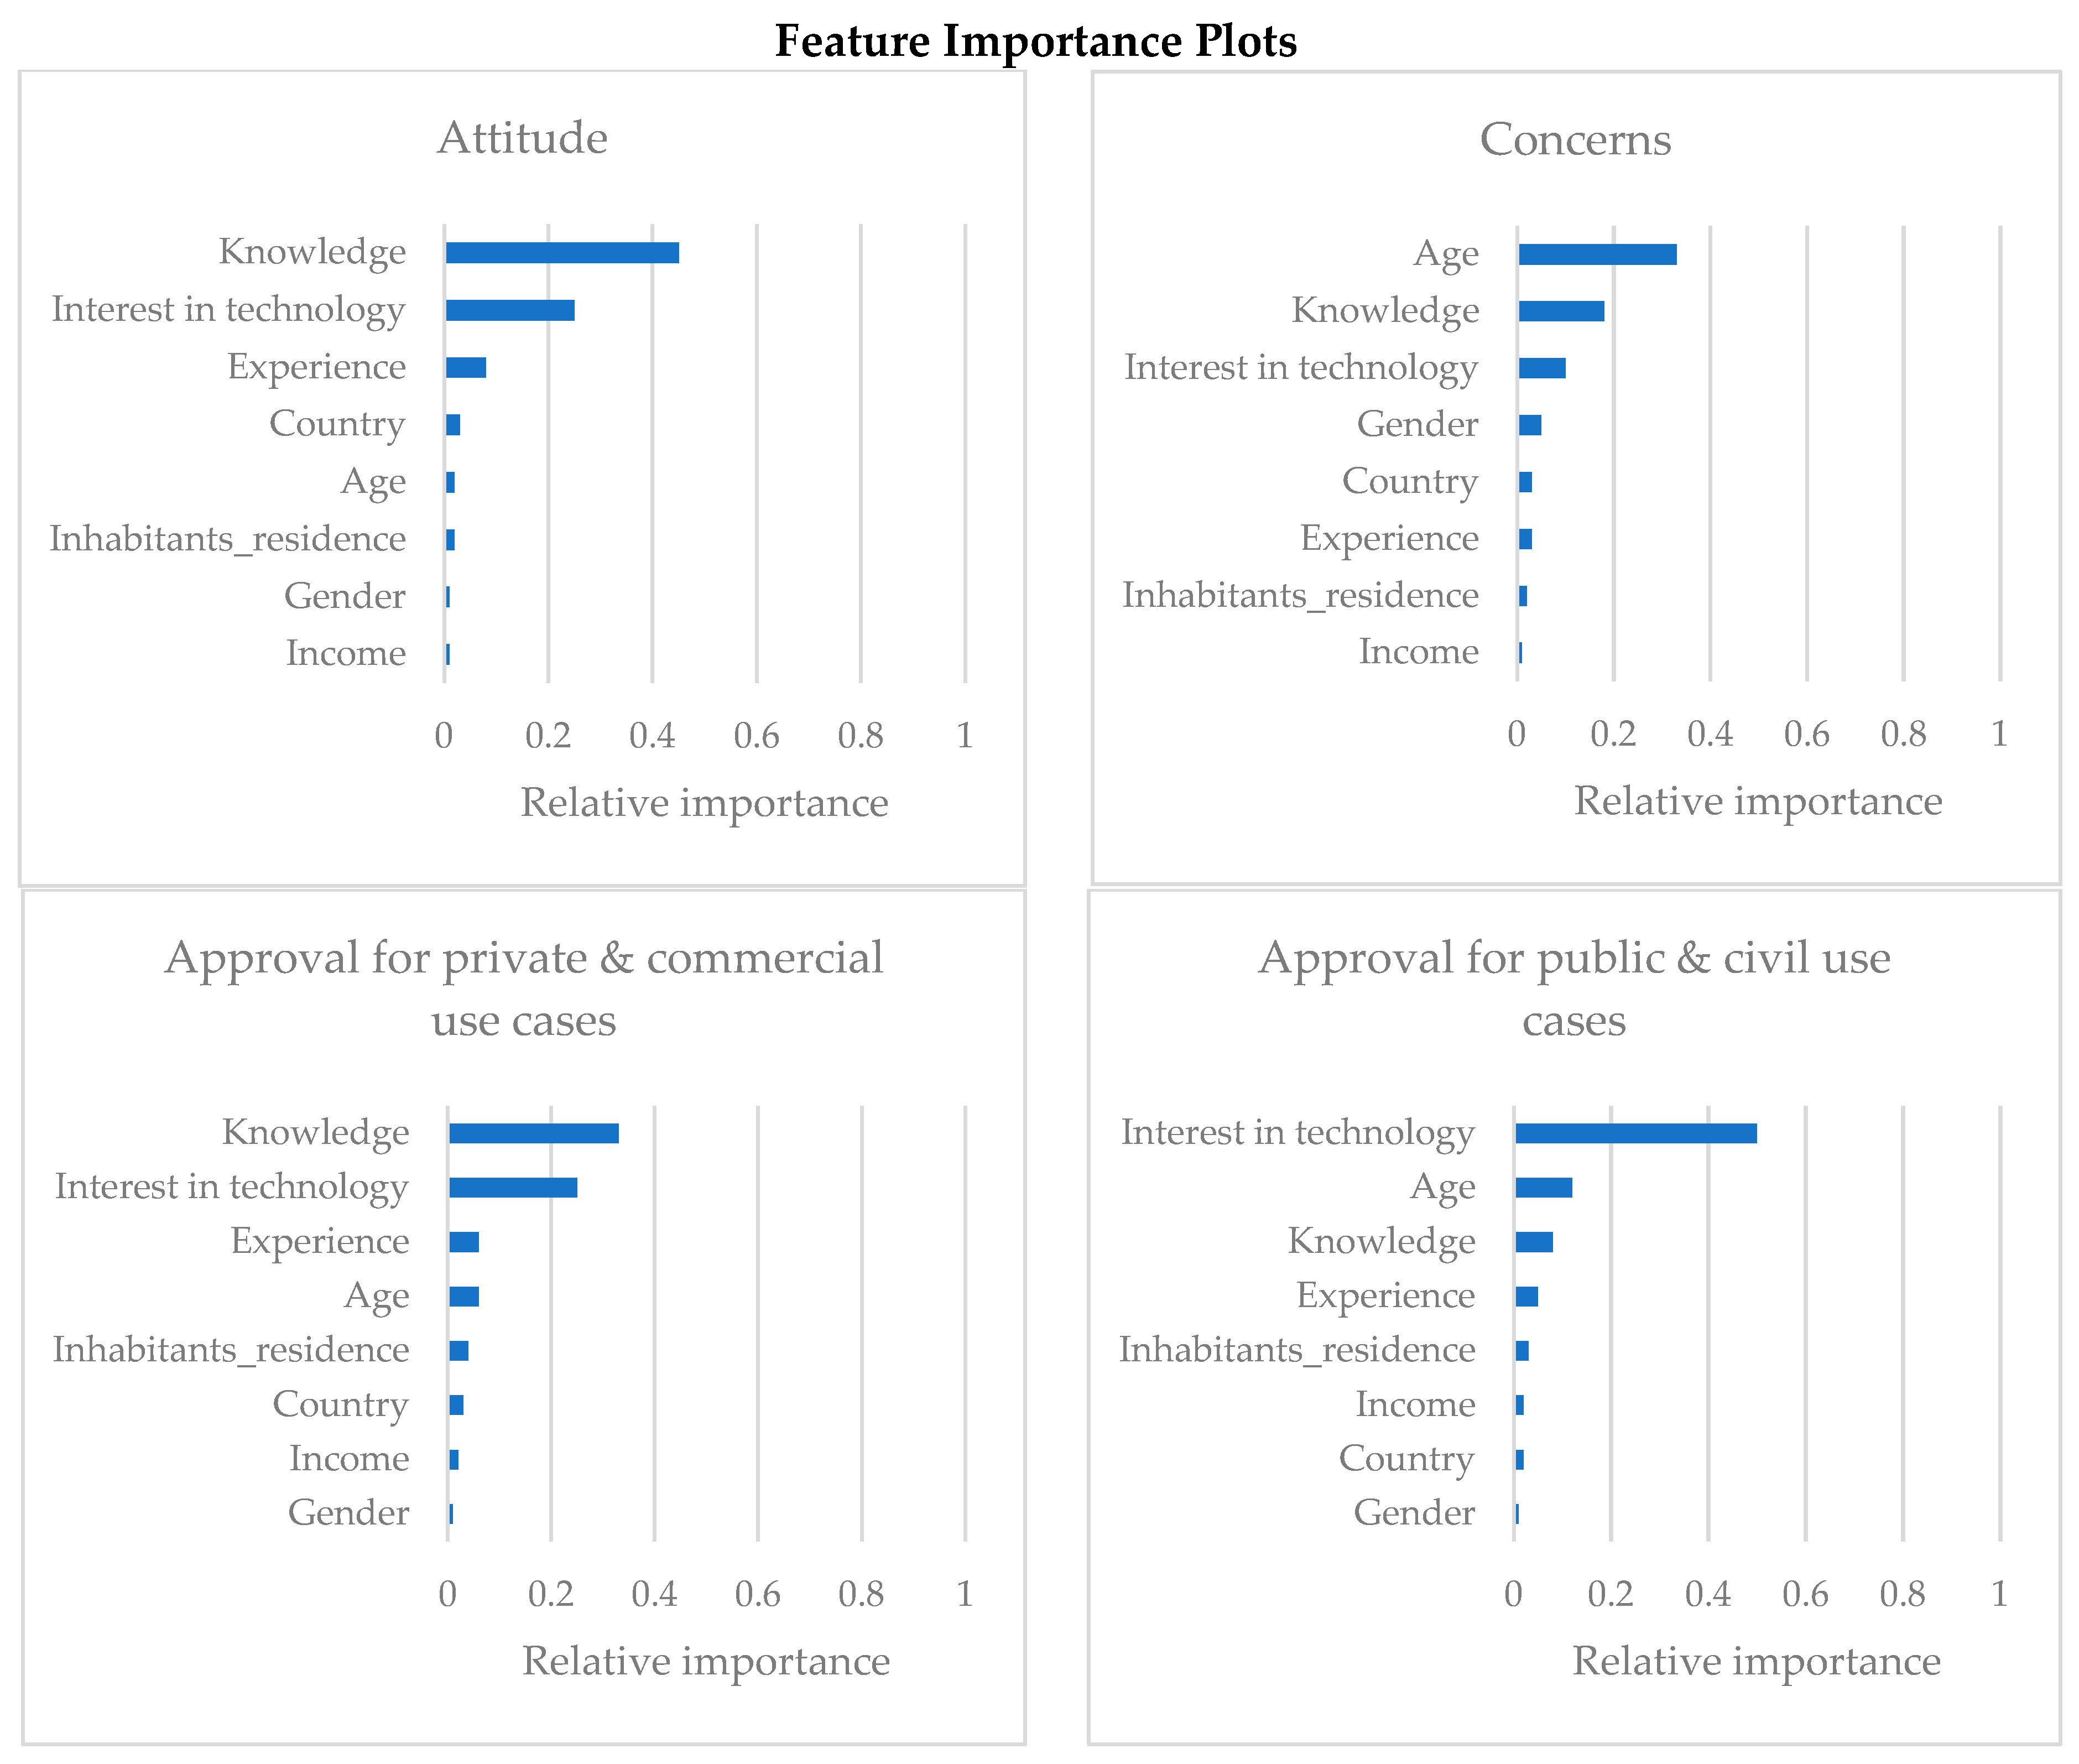
The outcome of the random forest analyses is presented in Feature Importance (Figure 11) and Partial Dependence Plots (Figure 12).
The Feature Importance Plots show how important each feature is for predicting the target variable. In the models referring to the attitude toward drones and the approval for private and commercial use cases, knowledge about drones had the most substantial impact, followed by general interest in technology. In case of public and civil use cases, technology interest was the dominant influence. Regarding concerns related to drones, age was the feature with the highest importance.
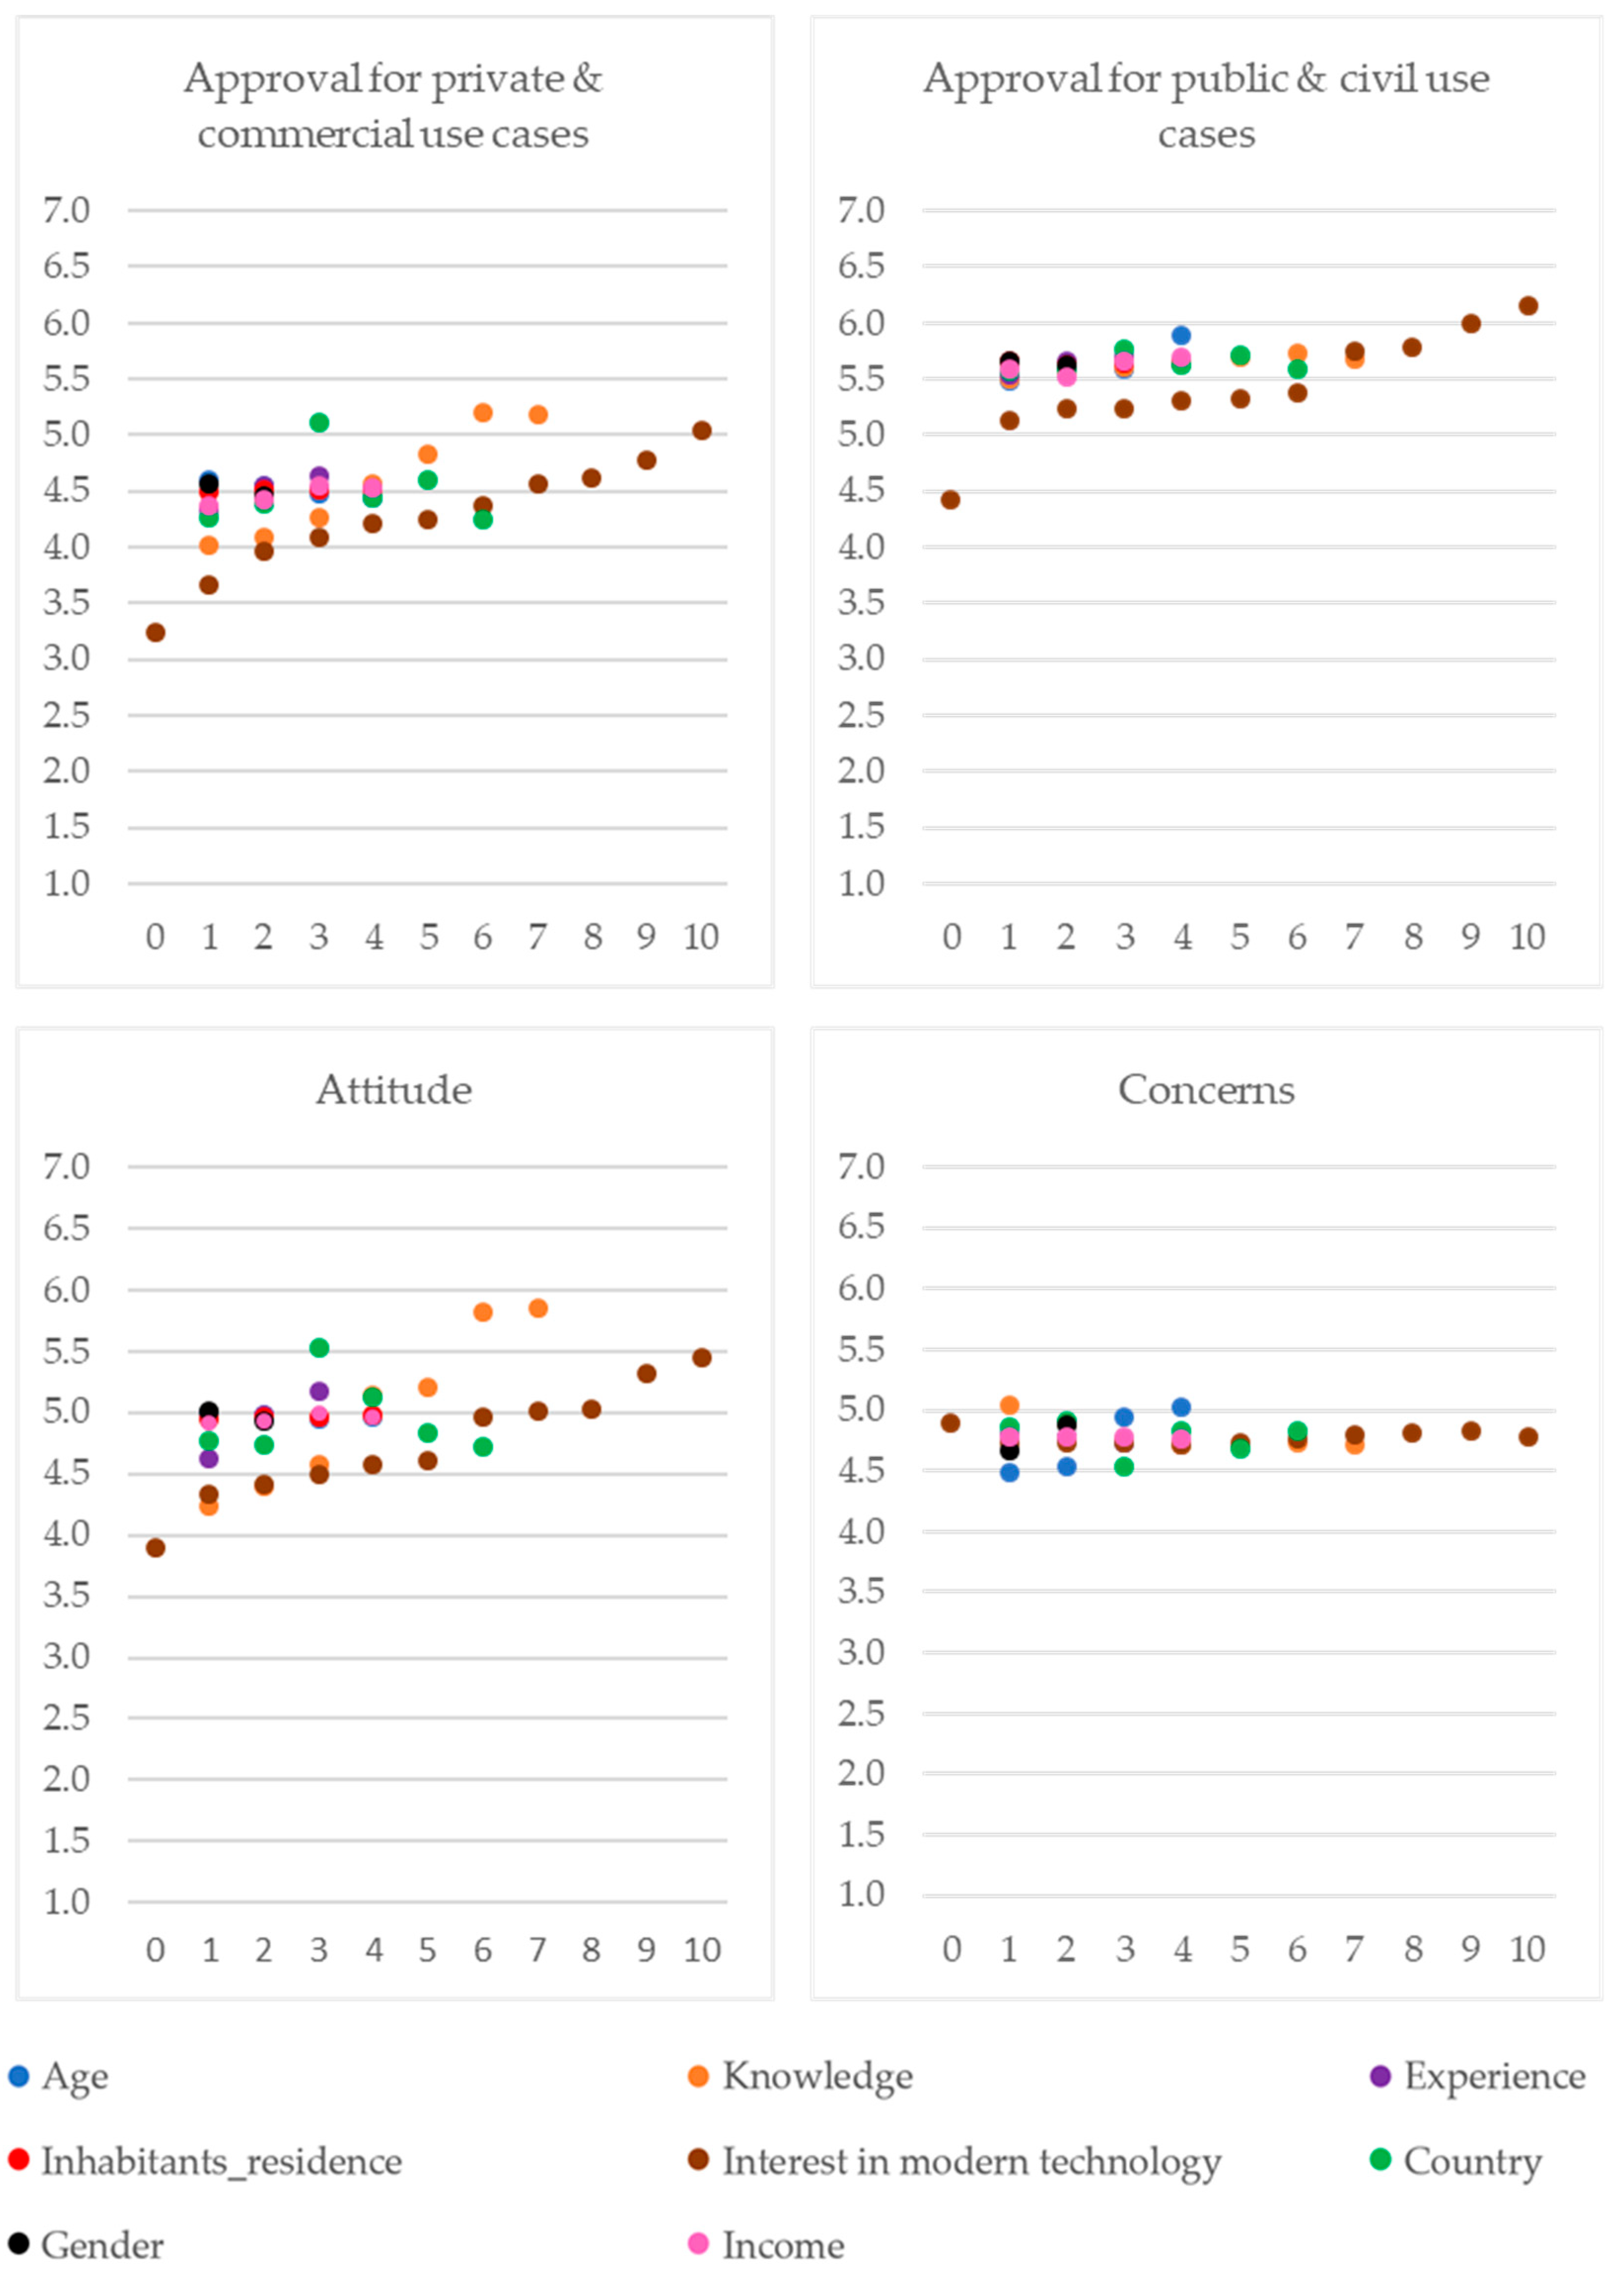
The Partial Dependence Plots present the predicted values of the target variable for each feature category. As the categories are shown as numeric values, the plots’ interpretation is guided by Table 8. It lists the variable names and their categories as numeric and string values. The percentage of people in the sample is also given for categorical and ordinal variables.
Referring to the target variables attitude and approval for private and commercial use cases, as with the feature importance plots, the importance of knowledge and also interest in technologies is visible here. Both target variables gradually became more positive when people were more informed about drones or the more they were interested in modern technologies in general. There were also differences in the predictions for the country. As was already seen in the results in Section 4.3 and Section 4.4, the predicted values for Poland were noticeably more positive than for the other countries. Spain also reached higher values than the other countries, but the predictions were not as high as for Poland. More experience with drones led to a somewhat more positive attitude as well. The predicted values of the other features, however, differed little.
Similar observations can be made regarding concerns and approval for public and civil use cases. In particular, approval for private and commercial use cases also became more positive as interest in modern technologies increased. Still, the range of differences between the values of all other features was smaller than for the other target variables. Here, the predictions for the individual variables seemed to differ significantly less from one another. Regarding concerns, the fluctuations were most vigorous for the variable age, which aligns with the results presented in Feature Importance Plots.
5. Discussion
5.1. Results
5.1.1. RQ1a: How High Is the Public Acceptance of Drones at European Level?/RQ1b: Does the Public Acceptance of Drones Vary throughout Different European Countries?
To answer the research questions, we measured three aspects of drone acceptance. The general attitude towards drones, the approval for different use cases, and concerns with respect to drones were measured. These aspects were compared among the six countries, but also analyzed for the total sample. The findings revealed a generally positive attitude within the total sample. However, significant differences between countries exist, prompting an examination of their practical relevance, especially considering the weak effect size. These differences necessitate a careful consideration of potential biases. Even if efforts were made to collect representative samples, biases in the country’s samples can cause some of the effects found here. Taking together the weak effects of country differences, the possible bias in the sample, and the low significance of the country in the random forest analysis, the country seems to play less of a role in the acceptance of drones.
Our findings underscore substantial variations in the acceptability of drones across diverse use cases. Notably, public and civil applications, such as disaster management or research, receive higher approval compared to private and commercial ones, like passenger transport or recreational use. This difference is statistically significant, indicating a strong effect and suggesting that public acceptance of drones is closely linked to the specific use case. This aligns with existing research, emphasizing the pivotal role of implementation and perceived benefits in shaping public approval ([8,14,17,27,40]). A mixed-method study on drone acceptance points out that the approval for specific use cases depends on how they are implemented and how beneficial people perceive them. For example, the intention to use air taxis depends on the price, safety, or the location of landing spots [46].
Like in other studies, the findings of this survey also show that people’s most significant concerns relate to the violation of privacy followed by the use of drones for criminal purposes. Concerns are lowest in terms of noise pollution. Comparisons between countries regarding concerns revealed significant differences, but as with attitude, the effect is weak. This fits with the observation that the country in the random forest analysis also did not have a high predictive power on the variables. The question arises: how can existing concerns be addressed and reduced? On the one hand, laws and regulations should guarantee data protection. Pauner et al. state that EU legislation does not sufficiently cover new privacy and data protection threats. Activities to address data protection and privacy issues related to drones should be standardized across the EU and worldwide [47]. Further measures to address public concerns may include providing real-time information on drone activities, e.g., who is flying and for what purpose, via platforms similar to Flight Radar. Visual indicators like flashing lights can signal when drones capture media, enhancing awareness and addressing privacy concerns. Moreover, care must be taken to ensure that cyber security is considered. U-space architectures must be secure in this respect. Besides that, it needs to be guaranteed that in the future drone operations are often conducted in a highly automated U-space environment. In the event of an incident, drones should be able to switch to a safe state or capable of a safe landing (e.g., by using parachutes). Security risks should also be considered when planning missions. Densely populated areas or security-critical infrastructures might be avoided. Prioritizing safety in implementing U-spaces is fundamental for fostering public trust in drone operations.
In conclusion, the study indicates a generally positive acceptance of drones with weak differences among countries. This provides a favorable foundation for the implementation of U-spaces in Europe. However, it is imperative to address existing concerns adequately, as highlighted earlier. When introducing novel technologies, a fundamental question arises: Are extensive efforts necessary to increase acceptance, or will people gradually adapt to innovations over time? Notably, the study suggests that the effort required may not be enormous in the case of drones due to the already positive attitude observed. The conducted questionnaire already slightly positively affected the participants’ attitudes, highlighting the impact of even minor interventions. Implications for entities such as companies and research institutions include enhancing communication about new technologies and potentially, for example, using social media platforms or public events. Small-scale measures could effectively raise societal awareness. Integrating acceptance considerations in scientific or industrial drone projects is crucial, emphasizing effective communication with the public on technical developments. Moreover, opportunities should be seized to involve the general public, for example, when flight demonstrations are carried out or when test fields and living labs are established in certain regions, as they offer a practical opportunity to familiarize society with drones. Concerning increasing the acceptance of new technologies such as drones, it would be interesting to carry out studies investigating the efficiency of individual measures to increase acceptance.
5.1.2. RQ2: What Are the Requirements of the General Public Regarding Flight Planning (Flying Area and Altitude) for Drones?
This survey revealed findings similar to the telephone survey in Germany concerning the acceptance of different flight areas and flight altitudes [8]. According to the results, drone flights are most tolerable in uninhabited or sparsely populated regions. In cities, the highest tolerance is identified for flights in business and industrial areas, whereas drones are not favored to operate in housing areas.
Regarding flight altitude, only minimal differences were found between drones with public functions and commercial or private drone operations. Considering this, together with the results on the flight area, it may be less important for people how high drones fly for various applications, but rather where they fly and that they do not disturb people. In practice, it is probably also difficult for people to classify the purpose of a drone if it is not labeled in some way, for example, by the company logo. On the other hand, Hui found in his experiment that altitude plays a role. He observed a decreased annoyance with increasing flight altitude [48]. In our survey, it is striking that 20 percent of the participants were unsure about the minimum tolerable flight altitude. Further analyses suggest that this could have to do with a lack of experience with drones, as many people who stated that they had no experience with drones chose the “Don’t know” response option. Participants with first-hand experience, on the other hand, compound to a minor proportion in the “Don’t know” category. Eventually, they have been in contact with drones most frequently through their flights and can better assess different flight altitudes and their corresponding noise exposure as their experience increases. Experiments are helpful for a better assessment of tolerable minimum flight altitudes, in which participants experience drones flying in different altitudes with visual and acoustic stimuli [31,49,50,51]. There are a few studies that followed this approach. Studies on noise impact are crucial and should also be considered in future research on the acceptance of drones. Based on the results of the surveys, it would be interesting to investigate how drones are experienced in different regions and urban areas. This is also important to research when planning landing points. At cruising altitude, drones are probably less noticeable, but the noise impact is an essential consideration if they land close to people. Noise mapping based on various research data is also essential for flight path planning. The practical implication of the results is that when planning drone flights, it is vital to ensure that drones primarily fly over areas where they will not disturb people, like in sparsely populated areas or industrial areas. This is in line with the current SORA (Specific Operations Risk Assessment) requirements, according to which drones should avoid flying over densely populated areas due to the increasing ground risk [52]. If possible, landing points should be located so that the noise of drones taking off and landing is not disturbing. However, it could be that landing points are also planned in cities, for example, for logistics drones or air taxis. In that case, it could make sense to locate them at central hubs such as railway stations and airports where there are no residential areas in the immediate vicinity and where drone noise is masked by other traffic noise.
5.1.3. RQ3: How Do Personal and Demographic Factors Affect the Acceptance of Drones?
Knowledge and interest in modern technology were the most decisive predicting factors regarding the general attitude toward drones and approval for different use cases. This aligns with existing research indicating that people with higher knowledge about drones are more positive about them [13,15,53,54]. Knowledge is more relevant for attitude and approval for private and commercial use cases. In contrast, interest in technology is the more important factor for approval for public and civil use cases. This could be because drone deployments for purposes that are used for the good of society already enjoy a high level of approval. It could, therefore, be that people who are open to new technologies are also open to using them for such purposes. However, approval was lower for private and commercial use cases, and people differed more strongly in their opinions. It could be that the population is divided into people who already have a high level of knowledge, experience, and interest in drones and are, therefore, potential early adopters of this technology and people who are not yet as experienced and interested. People with a high level of knowledge may also see more advantages in all possible drone use cases.
So, high knowledge about drones and interest in technology appear to be important drivers for a high level of acceptance among the population. When it comes to new technologies, early adopters often get to grips with a particular innovation very early and show a high commitment and willingness to use it. According to the Diffusion of Innovation Theory [55], early adopters are crucial in adopting novel technologies. The theory operates at both individual and aggregated levels. At the individual level, it focuses on the adoption process involving the innovation, individuals who have adopted it, those yet to adopt it, and communication channels facilitating information exchange. The theory explains the stages an individual goes through in deciding to adopt. Communication, including word-of-mouth and mass media, influences this process. On the aggregate level, the theory suggests an S-shaped cumulative adoption pattern over time. Some individuals adopt earlier, reflecting their innovativeness [56]. Within the group of potential adopters, there are often less than 20 percent early adopters, but these play a very important role in the diffusion process of innovations. Early adopters are characterized, in particular, by a positive technology orientation, more knowledge, and prior experience with a novel technology. Dedehayir et al. suggest that businesses should increase adopters’ knowledge of new products and services [56]. Experiential knowledge from earlier adopters is crucial for individuals in the early stages. As experience is limited, it is often obtained from closely connected individuals. In the late stage, when a majority has adopted, externalities from peers’ behaviors become prominent, positively or negatively influencing the remaining individuals’ propensity to adopt. Positive externalities typically lead to widespread diffusion of promising innovations, while negative social influence can result in negative externalities [57]. As discussed in Section 5.1.1, knowledge and experience about drones could be communicated via various communication channels, such as social media platforms, test fields, and living labs. The latter are often located away from urban areas for infrastructural and security-related reasons, meaning that few people come into contact with them. Test fields and living labs presumably attract early adopters, who are most likely to be among their visitors due to the high interest in the technology. Such living labs should, therefore, primarily address this target group. According to the diffusion of innovation theory described above, the early adopters could gain more concrete experience with drones there and disseminate the experience and knowledge they have gained in their environment.
In terms of concerns, age has the highest impact on the predictions. A literature review by Lee and Coughlin identified several factors influencing older people’s adoption of technology [58]. The review found that older people are likelier to adopt a new technology with a recognizable benefit. Technologies are not accepted simply because they are new. According to one study, older people are often unaware of new technologies that could be helpful to them [59]. Regarding drones, older people may be less likely to see the advantages and benefits and are more likely to be concerned about the dangers. When communicating about drones, it is essential to adapt information to different age groups and emphasize the technology’s benefits, especially for older people. Lee’s and Coughlin’s review further revealed that older people are likelier to adopt new technologies if they help them maintain their independence [58]. Drone applications such as delivery services could ensure this, as they could make shopping easier, for example. On the other hand, the review also found that new technologies could bring with them the perceived risk of reducing social interactions [60]. In the instance of parcel delivery by drone, this could be the case because it might reduce interactions such as those you have in the supermarket or with parcel carriers. Lastly, a study by Morris and Venkatesh found that privacy sensitivity is particularly pronounced among older people [61]. In a study on smart home technologies, older participants also reported concerns about possible invasion of privacy by cameras [62]. Privacy concerns are also high with drones and maybe even more pronounced for older people.
5.2. Strengths and Limitations
The study used a large sample size, providing a solid basis for deriving meaningful conclusions. Another strength of this study is that it investigated the acceptance of drones at the European level and compared individual aspects, such as general attitudes towards drones between the different countries. The country was included as a factor in the random forest analysis to examine its influence on acceptance. The random forest approach proved very useful in this study for analyzing the significance of individual factors for different target variables and predicting the target variable for individual factor levels. In their overview of random forests in psychological research, Fife and D’Onofrio notice that they are used comparatively less frequently in psychology. They encourage researchers to apply this method more often, especially for explorative data analysis [63].
One limitation is that although the study was conducted at the European level, it only covered a small selection of EU countries and not all of them. The survey was undertaken only in those countries that were represented in the consortium of the Uspace4UAM project, but these did not include the Scandinavian region or France and Italy, for example. Accordingly, the results cannot be applied to all EU countries. Another limitation is the exclusion of the older population. The results are only representative of people between the ages of 18 and 65. In addition, the biases in the sample regarding education, place of residence, and income should be mentioned. When filtering the participants, no quotas were set for these characteristics, meaning less could be checked for these attributes. For example, it is often the case in online surveys that education is above average, as this group is usually more strongly represented in the panels. This could have led to a bias in the results. This must be considered, particularly in the case of significant differences in the comparison between countries regarding attitude, approval for use cases, and concerns. Concerning place of residence, however, a study by Aydin showed that urban, suburban, and rural residents do not differ in their attitudes towards drones. One possible reason is that these groups do not differ in drone knowledge [32].
In general, it can be said that measuring the acceptance of drones is challenging, as several factors play a role here. This study used the variables of attitude, approval for use cases, and concerns, which were frequently addressed in the relevant literature. However, it cannot be ruled out that other elements play a role. Acoustic and visual pollution were also mentioned as important factors in the discussion. However, it is hardly possible to capture these in surveys; the experiments mentioned in virtual reality are better suited to this. Surveys are unlikely to reflect all facets of drone acceptance adequately. It also cannot be ruled out that certain essential aspects are not represented in the items themselves. This could be the case for use cases and concerns, for example. The results might have differed if the participants had been presented with other or even more use cases and concerns to evaluate. The open response format was therefore included for worries. It was noticeable in the results that concerns similar to those we had expressed in the matrix question on concerns were stated in the open responses.
Author Contributions
Conceptualization, M.S. and A.P.; methodology, M.S., A.P. and E.L.; analysis, M.S., A.P. and F.D.; writing—original draft preparation, M.S., A.P. and F.D.; writing—review and editing, M.S., A.P. and F.D.; visualization, M.S., A.P. and F.D. All authors have read and agreed to the published version of the manuscript.
Funding
The USpace4UAM project has received funding from the SESAR Joint Undertaking under the European Union’s Horizon 2020 research and innovation program under Grant Agreement No 101017643.
Data Availability Statement
The original data presented in the study are openly available at https://zenodo.org/records/10843106 (accessed on 20 March 2024).
Conflicts of Interest
The authors declare no conflicts of interest. Author Eva Linhuber was employed by the company SKOPOS. The remaining authors declare that the research was conducted in the absence of any commercial or financial relationships that could be construed as a potential conflict of interest.
References
- Droneii. Global Drone Market Report 2022–2030. 2023. Available online: https://droneii.com/product/drone-market-report?nowprocket=1 (accessed on 27 July 2023).
- CORUS-XUAM Project. U-Space ConOps and Architecture (Edition 4). 2023. Available online: https://sesarju.eu/sites/default/files/documents/reports/U-space%20CONOPS%204th%20edition.pdf (accessed on 11 December 2023).
- Barrado, C.; Boyero, M.; Brucculeri, L.; Ferrara, G.; Hately, A.; Hullah, P.; Martin-Marrero, D.; Pastor, E.; Rushton, A.P.; Volkert, A. U-space concept of operations: A key enabler for opening airspace to emerging low-altitude operations. Aerospace 2020, 7, 24. [Google Scholar] [CrossRef]
- SESAR Joint Undertaking. European Drones Outlook Study: Unlocking the Value for Europe. 2016. Available online: https://www.sesarju.eu/sites/default/files/documents/reports/European_Drones_Outlook_Study_2016.pdf (accessed on 27 July 2023).
- European Commission. Drone Strategy 2.0: Creating a Large-Scale European Drone Market; European Commission: Brussels, Belgium, 2022. [Google Scholar]
- Boucher, P. Civil Drones in Society; JRC Science and Policy Reports; European Commission: Brussels, Belgium, 2014; p. 9. [Google Scholar]
- SESAR Joint Undertaking. Large Scale Demonstrations Project Uspace4UAM. Available online: https://www.sesarju.eu/projects/Uspace4UAM (accessed on 12 November 2023).
- Eißfeldt, H.; Vogelpohl, V.; Stolz, M.; Papenfuß, A.; Biella, M.; Belz, J.; Kügler, D. The acceptance of civil drones in Germany. CEAS Aeronaut. J. 2020, 11, 665–676. [Google Scholar] [CrossRef]
- EASA. Study on the Societal Acceptance of Urban Air Mobility in Europe. 2021. Available online: https://www.easa.europa.eu/sites/default/files/dfu/uam-full-report.pdf (accessed on 18 March 2024).
- End, A.; Barzantny, C.; Stolz, M.; Grupe, P.; Schmidt, R.; Papenfuß, A.; Eißfeldt, H. Public acceptance of civilian drones and air taxis in Germany: A comprehensive overview. CEAS Aeronaut. J. 2023, preprint. Available online: https://psyarxiv.com/kuvzs/download?format=pdf (accessed on 10 March 2024).
- Clothier, R.A.; Greer, D.A.; Greer, D.G.; Mehta, A.M. Risk perception and the public acceptance of drones. Risk Anal. 2015, 35, 1167–1183. [Google Scholar] [CrossRef]
- Reddy, L.B.; DeLaurentis, D. Opinion survey to reduce uncertainty in public and stakeholder perception of unmanned aircraft. Transp. Res. Rec. 2016, 2600, 80–93. [Google Scholar] [CrossRef]
- Sabino, H.; Almeida, R.V.S.; de Moraes, L.B.; da Silva, W.P.; Guerra, R.; Malcher, C.; Passos, D.; Passos, F.G.O. A systematic literature review on the main factors for public acceptance of drones. Technol. Soc. 2022, 71, 102097. [Google Scholar] [CrossRef]
- Oksman, V.; Kulju, M. Nordic Study on Public Acceptance of Autonomous Drones. In International Conference on Human-Computer Interaction; Springer: Cham, Switzerland, 2022. [Google Scholar]
- Nelson, J.R.; Grubesic, T.H.; Wallace, D.; Chamberlain, A.W. The view from above: A survey of the public’s perception of unmanned aerial vehicles and privacy. J. Urban Technol. 2019, 26, 83–105. [Google Scholar] [CrossRef]
- Grossi, C.; Martin, L.; Wolter, C. Obtaining Public Opinion About sUAS Activity in an Urban Environment. In International Conference on Applied Human Factors and Ergonomics; Springer: Cham, Switzerland, 2020. [Google Scholar]
- Tan, L.K.L.; Lim, B.C.; Park, G.; Low, K.H.; Yeo, V.C.S. Public acceptance of drone applications in a highly urbanized environment. Technol. Soc. 2021, 64, 101462. [Google Scholar] [CrossRef]
- Klauser, F.; Pedrozo, S. Big data from the sky: Popular perceptions of private drones in Switzerland. Geogr. Helv. 2017, 72, 231–239. [Google Scholar] [CrossRef]
- Upadrasta, V.; Leitner, R. Public’s Perspective on Civil Drones: Reasons to support and oppose. In Proceedings of the 10th International Conference on Human Interaction and Emerging Technologies (IHIET 2023), Nice, France, 22–24 August 2023. [Google Scholar]
- Ferreira, T.; Kalakou, S. Strategic Planning for Urban Air Mobility: Perceptions of Citizens and Potential Users on Autonomous Flying Vehicles. In Conference on Sustainable Urban Mobility; Springer: Cham, Switzerland, 2020. [Google Scholar]
- Yedavalli, P.; Mooberry, J. An Assessment of Public Perception of Urban Air Mobility (UAM). Airbus UTM: Defining Future Skies. 2019. Available online: https://www.airbus.com/sites/g/files/jlcbta136/files/2022-07/Airbus-UTM-public-perception-study%20-urban-air-mobility.pdf (accessed on 18 March 2024).
- Çetin, E.; Cano, A.; Deransy, R.; Tres, S.; Barrado, C. Implementing mitigations for improving societal acceptance of urban air mobility. Drones 2022, 6, 28. [Google Scholar] [CrossRef]
- Chang, V.; Chundury, P.; Chetty, M. Spiders in the sky: User perceptions of drones, privacy, and security. In Proceedings of the 2017 CHI Conference on Human Factors in Computing Systems, Denver, CO, USA, 6–11 May 2017. [Google Scholar]
- Walther, J.; PytlikZillig, L.; Detweiler, C.; Houston, A. How people make sense of drones used for atmospheric science (and other purposes): Hopes, concerns, and recommendations. J. Unmanned Veh. Syst. 2019, 7, 219–234. [Google Scholar] [CrossRef]
- Burukina, O.; Khavanova, I. Human–Drone Interaction: Virtues and Vices in Systemic Perspective. In International Conference on Applied Human Factors and Ergonomics; Springer: Cham, Switzerland, 2019. [Google Scholar]
- Al Haddad, C.; Chaniotakis, E.; Straubinger, A.; Plötner, K.; Antoniou, C. Factors affecting the adoption and use of urban air mobility. Transp. Res. Part A Policy Pract. 2020, 132, 696–712. [Google Scholar] [CrossRef]
- Verband unbemannter Luftfahrt (2022). Was denken die Deutschen über Advanced Air Mobility?—Ergebnisse einer repräsentativen Umfrage zu Drohnen und Flugtaxis. Available online: https://www.bdli.de/sites/default/files/global_upload_upload/20220624_Akzeptanzumfrage_DE_Lang.pdf (accessed on 18 March 2024).
- Boucher, P. ‘You wouldn’t have your granny using them’: Drawing boundaries between acceptable and unacceptable applications of civil drones. Sci. Eng. Ethics 2016, 22, 1391–1418. [Google Scholar] [CrossRef] [PubMed]
- Lidynia, C.; Philipsen, R.; Ziefle, M. Droning on about drones—Acceptance of and perceived barriers to drones in civil usage contexts. In Advances in Human Factors in Robots and Unmanned Systems; Springer: Cham, Switzerland, 2017; pp. 317–329. [Google Scholar]
- Wang, Y.; Xia, H.; Yao, Y.; Huang, Y. Flying Eyes and Hidden Controllers: A Qualitative Study of People’s Privacy Perceptions of Civilian Drones in The US. Proc. Priv. Enhancing Technol. 2016, 2016, 172–190. [Google Scholar] [CrossRef]
- Stolz, M.; Laudien, T. Assessing Social Acceptance of Urban Air Mobility using Virtual Reality. In Proceedings of the 2022 IEEE/AIAA 41st Digital Avionics Systems Conference (DASC), Portsmouth, VA, USA, 18–22 September 2022; IEEE: Piscataway, NJ, USA, 2022. [Google Scholar]
- Aydin, B. Public acceptance of drones: Knowledge, attitudes, and practice. Technol. Soc. 2019, 59, 101180. [Google Scholar] [CrossRef]
- Eurostat. How Popular Is Internet Use among Older People? 2020. Available online: https://ec.europa.eu/eurostat/web/products-eurostat-news/-/edn-20210517-1 (accessed on 3 March 2024).
- UNECE. Percentage of Population Using Internet by Age, Sex, Variable, Country and Year. 2021. Available online: https://w3.unece.org/PXWeb2015/pxweb/en/STAT/STAT__30-GE__09-Science_ICT/02_en_GEICT_InternetUse_r.px/table/tableViewLayout1/ (accessed on 3 March 2024).
- Bundesministerium für Familie, S. Frauen und Jugend. Ein Drittel der Hochaltrigen Nutzt das Internet. 2022. Available online: https://www.bmfsfj.de/bmfsfj/aktuelles/alle-meldungen/ein-drittel-der-hochaltrigen-nutzt-das-internet-195818 (accessed on 3 March 2024).
- Deep-Translator 1.11.4. 2023. Available online: https://pypi.org/project/deep-translator/ (accessed on 11 April 2023).
- Natural Language Toolkit. 2023. Available online: https://www.nltk.org/ (accessed on 11 April 2023).
- Breiman, L. Random forests. Mach. Learn. 2001, 45, 5–32. [Google Scholar] [CrossRef]
- Ali, J.; Khan, R.; Ahmad, N.; Maqsood, I. Random forests and decision trees. Int. J. Comput. Sci. Issues (IJCSI) 2012, 9, 272. [Google Scholar]
- Badillo, S.; Banfai, B.; Birzele, F.; Davydov, I.I.; Hutchinson, L.; Kam-Thong, T.; Siebourg-Polster, J.; Steiert, B.; Zhang, J.D. An introduction to machine learning. Clin. Pharmacol. Ther. 2020, 107, 871–885. [Google Scholar] [CrossRef]
- Biau, G.; Scornet, E. A random forest guided tour. Test 2016, 25, 197–227. [Google Scholar] [CrossRef]
- Cutler, A.; Cutler, D.R.; Stevens, J.R. Random forests. In Ensemble Machine Learning: Methods and Applications; Springer Science & Business Media: Berlin/Heidelberg, Germany, 2012; pp. 157–175. [Google Scholar]
- Rigatti, S.J. Random forest. J. Insur. Med. 2017, 47, 31–39. [Google Scholar] [CrossRef]
- Mean and Median Income by Household Type—EU-SILC and ECHP Surveys. 2023. Available online: https://ec.europa.eu/eurostat/databrowser/view/ilc_di04/default/table?lang=en (accessed on 30 November 2023).
- Statista. Europäische Union: Urbanisierungsgrad in den Mitgliedstaaten im Jahr 2022. 2023. Available online: https://de.statista.com/statistik/daten/studie/249029/umfrage/urbanisierung-in-den-eu-laendern/ (accessed on 29 November 2023).
- Stolz, M.; Papenfuss, A.; de Albuquerque Richers, G.C.; Bahnmüller, A.; Syed, A.M.; Gerndt, A.; Fischer, M.; Wegener, J.; Lieb, T.J.; Biella, M. A mixed-method approach to investigate the public acceptance of drones. CEAS Aeronaut. J. 2023, 14, 835–855. [Google Scholar] [CrossRef]
- Pauner, C.; Kamara, I.; Viguri, J. Drones. Current challenges and standardisation solutions in the field of privacy and data protection. In Proceedings of the 2015 ITU Kaleidoscope: Trust in the Information Society (K-2015), Barcelona, Spain, 9–11 December 2015; IEEE: Piscataway, NJ, USA, 2015. [Google Scholar]
- Hui, C.J.; Kingan, M.J.; Hioka, Y.; Schmid, G.; Dodd, G.; Dirks, K.N.; Edlin, S.; Mascarenhas, S.; Shim, Y.-M. Quantification of the psychoacoustic effect of noise from small unmanned aerial vehicles. Int. J. Environ. Res. Public Health 2021, 18, 8893. [Google Scholar] [CrossRef] [PubMed]
- Aalmoes, R.; Sieben, N. Noise and visual perception of Urban Air Mobility vehicles. In Proceedings of the Delft International Conference on Urban Air Mobility (DICUAM), Virtual, 15–17 March 2021. [Google Scholar]
- Torija, A.J.; Li, Z.; Self, R.H. Effects of a hovering unmanned aerial vehicle on urban soundscapes perception. Transp. Res. Part D Transp. Environ. 2020, 78, 102195. [Google Scholar] [CrossRef]
- Gwak, D.Y.; Han, D.; Lee, S. Sound quality factors influencing annoyance from hovering UAV. J. Sound Vib. 2020, 489, 115651. [Google Scholar] [CrossRef]
- EASA. Easy Access Rules for Unmanned Aircraft Systems (Regulations (EU) 2019/947 and 2019/945); EASA: Cologne, Germany, 2022; p. 443. [Google Scholar]
- Macsween-George, S.L. Will the public accept UAVs for cargo and passenger transportation? In Proceedings of the 2003 IEEE Aerospace Conference Proceedings (Cat. No. 03TH8652), Big Sky, MT, USA, 8–15 March 2003; IEEE: Piscataway, NJ, USA, 2003. [Google Scholar]
- Eissfeldt, H.; End, A. Sound, noise, annoyance? Information as a means to strengthen the public acceptance of civil drones. In Proceedings of the INTER-NOISE and NOISE-CON Congress and Conference Proceedings, Institute of Noise Control Engineering. Washington, DC, USA, 1–5 August 2021. [Google Scholar]
- Rogers, E.M.; Singhal, A.; Quinlan, M.M. Diffusion of innovations. In An Integrated Approach to Communication Theory and research; Routledge: London, UK, 2014; pp. 432–448. [Google Scholar]
- Dedehayir, O.; Ortt, R.J.; Riverola, C.; Miralles, F. Innovators and early adopters in the diffusion of innovations: A literature review. Int. J. Innov. Manag. 2017, 21, 1740010. [Google Scholar] [CrossRef]
- Xiong, H.; Payne, D.; Kinsella, S. Peer effects in the diffusion of innovations: Theory and simulation. J. Behav. Exp. Econ. 2016, 63, 1–13. [Google Scholar] [CrossRef]
- Lee, C.; Coughlin, J.F. PERSPECTIVE: Older adults’ adoption of technology: An integrated approach to identifying determinants and barriers. J. Prod. Innov. Manag. 2015, 32, 747–759. [Google Scholar] [CrossRef]
- Heinz, M.; Martin, P.; Margrett, J.A.; Yearns, M.; Franke, W.; Yang, H.I.; Wong, J.; Chang, C.K. Perceptions of technology among older adults. J. Gerontol. Nurs. 2013, 39, 42–51. [Google Scholar] [CrossRef] [PubMed]
- Sharif, M.S.; Shao, B.; Xiao, F.; Saif, M.K. The impact of psychological factors on consumers trust in adoption of m-commerce. Int. Bus. Res. 2014, 7, 148. [Google Scholar] [CrossRef]
- Morris, M.G.; Venkatesh, V. Age differences in technology adoption decisions: Implications for a changing work force. Pers. Psychol. 2000, 53, 375–403. [Google Scholar] [CrossRef]
- Demiris, G.; Rantz, M.J.; Aud, M.A.; Marek, K.D.; Tyrer, H.W.; Skubic, M.; Hussam, A.A. Older adults’ attitudes towards and perceptions of ‘smart home’technologies: A pilot study. Med. Inform. Internet Med. 2004, 29, 87–94. [Google Scholar] [CrossRef] [PubMed]
- Fife, D.A.; D’Onofrio, J. Common, uncommon, and novel applications of random forest in psychological research. Behav. Res. Methods 2023, 55, 2447–2466. [Google Scholar] [CrossRef] [PubMed]
Figure 1.
Mean values of attitude toward drones at the beginning and end of the survey for the participating countries and the total sample. Whiskers indicate standard deviations.
Figure 1.
Mean values of attitude toward drones at the beginning and end of the survey for the participating countries and the total sample. Whiskers indicate standard deviations.

Figure 2.
Participants’ approval for different drone applications. Whiskers indicate standard deviations.
Figure 2.
Participants’ approval for different drone applications. Whiskers indicate standard deviations.

Figure 3.
Approval for public and civil use cases compared to approval for private and commercial use cases in the different countries and the total sample. Whiskers indicate standard deviations.
Figure 3.
Approval for public and civil use cases compared to approval for private and commercial use cases in the different countries and the total sample. Whiskers indicate standard deviations.

Figure 4.
Participants’ single concerns about drones. Whiskers indicate standard deviations.

Figure 5.
Mean values of the scale related to concerns for the participating countries and the total sample. Whiskers indicate standard deviations.
Figure 5.
Mean values of the scale related to concerns for the participating countries and the total sample. Whiskers indicate standard deviations.

Figure 6.
The word cloud shows the risks and concerns people associate with drones. The bigger the words, the more frequently they were stated by the participants.
Figure 6.
The word cloud shows the risks and concerns people associate with drones. The bigger the words, the more frequently they were stated by the participants.

Figure 7.
People’s approval for drones flying in different community types. Whiskers indicate standard deviations.
Figure 7.
People’s approval for drones flying in different community types. Whiskers indicate standard deviations.

Figure 8.
People’s approval for drones flying in different city areas. Whiskers indicate standard deviations.
Figure 8.
People’s approval for drones flying in different city areas. Whiskers indicate standard deviations.

Figure 9.
Relative frequencies of acceptable minimum flight altitudes compared between public, private, and commercial drones.
Figure 9.
Relative frequencies of acceptable minimum flight altitudes compared between public, private, and commercial drones.

Figure 10.
Correlations among the factors of the random forest model.

Figure 11.
The Feature Importance Plots indicate the relative importance of each feature according to its impact on the target variable. A relative importance of a feature of 0 corresponds to one percent and 1 corresponds to 100 percent.
Figure 11.
The Feature Importance Plots indicate the relative importance of each feature according to its impact on the target variable. A relative importance of a feature of 0 corresponds to one percent and 1 corresponds to 100 percent.

Figure 12.
The Partial Dependence Plots show the predicted values of the target variables for each feature. The predicted values are presented on the y-axis, and the features’ categories are on the x-axis.
Figure 12.
The Partial Dependence Plots show the predicted values of the target variables for each feature. The predicted values are presented on the y-axis, and the features’ categories are on the x-axis.


Table 1.
Results of a paired t-test for attitude on drones comparing responses at the beginning and the end of the survey for the participating countries.
Table 1.
Results of a paired t-test for attitude on drones comparing responses at the beginning and the end of the survey for the participating countries.
| Country | n | M (1st Measurement) | M (2nd Measurement) | T | p | Cohen’s d |
|---|---|---|---|---|---|---|
| Germany | 434 | 4.71 (SD = 1.55) | 4.81 (SD = 1.42) | −1.87 | 0.062 | - |
| UK | 417 | 4.67 (SD = 1.52) | 5.03 (SD = 1.44) | −6.53 | <0.001 *** | 0.32 |
| Poland | 454 | 5.65 (SD = 1.31) | 5.59 (SD = 1.19) | 1.39 | 0.165 | - |
| Spain | 474 | 5.47 (SD = 1.32) | 5.46 (SD = 1.27) | 0.13 | 0.895 | - |
| Czech Republic | 449 | 4.84 (SD = 1.47) | 5.01 (SD = 1.38) | −3.54 | <0.001 *** | 0.17 |
| Austria | 459 | 4.54 (SD = 1.49) | 4.74 (SD = 1.39) | −4.25 | <0.001 *** | 0.20 |
| Total sample | 2687 | 4.99 (SD = 1.50) | 5.11 (SD = 1.38) | −6.06 | <0.001 *** | 0.12 |
Note: Asterisks indicate the strength of statistical significance (0.01 * = significant, 0.001 ** = highly significant, <0.001 *** = extremely significant).
Table 2.
Groups of use cases according to the factor analysis.
| Factor 1: Civil & Public Use Cases | Factor 2: Private & Commercial Use Cases |
|---|---|
| Disaster management | Photos & videos for news reports |
| Research | Parcel delivery |
| Agriculture | Hobby |
| Medical use | Photos & videos for advertisement |
| Civil protection | Passenger transport (air taxi) |
Table 3.
Results of a paired t-test for acceptance on public and civil compared to private and commercial use cases for the participating countries.
Table 3.
Results of a paired t-test for acceptance on public and civil compared to private and commercial use cases for the participating countries.
| Country | n | M (Public & Civil) | M (Private & Commercial) | T | p | Cohen’s d |
|---|---|---|---|---|---|---|
| Germany | 429 | 5.46 (SD = 1.35) | 4.17 (SD = 1.57) | 20.14 | <0.001 *** | 0.97 |
| UK | 408 | 5.40 (SD = 1.28) | 4.32 (SD = 1.44) | 17.88 | <0.001 *** | 0.89 |
| Poland | 440 | 5.88 (SD = 1.16) | 5.18 (SD = 1.31) | 15.07 | <0.001 *** | 0.72 |
| Spain | 439 | 5.74 (SD = 1.15) | 4.74 (SD = 1.32) | 18.45 | <0.001 *** | 0.88 |
| Czech Republic | 417 | 5.74 (SD = 1.18) | 4.64 (SD = 1.42) | 20.54 | <0.001 *** | 1.01 |
| Austria | 440 | 5.50 (SD = 1.26) | 4.12 (SD = 1.46) | 22.75 | <0.001 *** | 1.08 |
| Total sample | 2,572 | 5.62 (SD = 1.24) | 4.53 (SD = 1.57) | 46.31 | <0.001 *** | 0.91 |
Note: Asterisks indicate the strength of statistical significance (0.01 * = significant, 0.001 ** = highly significant, <0.001 *** = extremely significant).
Table 4.
The most frequently stated concerns in each country.
| Total | Germany | UK | Poland | Spain | Czech Republic | Austria |
|---|---|---|---|---|---|---|
| privacy | privacy | privacy | privacy | privacy | privacy | privacy |
| people | people | people | people | people | invasion | private |
| private | private | invasion | fall | accident | fall | fall |
| fall | spy | spy | spy | fall | abuse | crash |
| invasion | protection | invade | lack | private | people | people |
Table 5.
Amount of people with no concerns in each country.
| Total | Germany | UK | Poland | Spain | Czech Republic | Austria |
|---|---|---|---|---|---|---|
| 28.0 | 23.4% | 34.5% | 35.0% | 32.0% | 16.2% | 27.3% |
Table 6.
Proportion of participants expressing uncertainty regarding the tolerable minimum flight altitude, segmented by their experience with drones across three application areas.
Table 6.
Proportion of participants expressing uncertainty regarding the tolerable minimum flight altitude, segmented by their experience with drones across three application areas.
| Number of Participants Choosing “Don’t Know” within the Individual Experience Levels | Frequency of Participants for the Respective Levels of Experience | ||
|---|---|---|---|
| Public | No experience | 212 (39%) | 544 (18%) |
| Second-hand experience | 362 (19%) | 1883 (63%) | |
| First-hand experience | 40 (7%) | 560 (19%) | |
| Commercial | No experience | 230 (42%) | 544 (18%) |
| Second-hand experience | 437 (23%) | 1883 (63%) | |
| First-hand experience | 44 (6%) | 560 (18%) | |
| Private | No experience | 216 (40%) | 544 (18%) |
| Second-hand experience | 392 (21%) | 1883 (63%) | |
| First-hand experience | 44 (8%) | 560 (19%) |
Note: The table displays the proportion of participants uncertain about minimum flight altitude, categorized by drone experience and application areas. Counts reflect those choosing “Don’t know” within each experience level. The rightmost column indicates the total number of participants per experience level. The values are given in absolute and relative frequencies (in brackets).
Table 7.
Selected parameters and model performance.
| Variable | Sample Size | Max Depth | Estimators | Min Sample Split | OOB acc |
|---|---|---|---|---|---|
| Attitude | 2711 | 7 | 100 | 30 | 0.88 |
| Concerns | 2594 | 10 | 200 | 150 | 0.84 |
| Approval for private & commercial use cases | 2625 | 10 | 300 | 30 | 0.88 |
| Approval for public & civil use cases | 2750 | 6 | 1000 | 50 | 0.85 |
Table 8.
Overview of features and target variables used in the random forest analyses.
| Features | ||
|---|---|---|
| Variable | Numeric Value | Value Label (and Proportion of the Category in the Sample in %) |
| Country | 1 | Germany (17%) |
| 2 | UK (17%) | |
| 3 | Poland (17%) | |
| 4 | Spain (17%) | |
| 5 | Czech Republic (17%) | |
| 6 | Austria (17%) | |
| Age | 1 | 18–29 years old (23%) |
| 2 | 30–39 years old (45%) | |
| 3 | 40–49 years old (24%) | |
| 4 | 50–65 years old (31%) | |
| Knowledge (scale) | 1–7 | 1 = Not informed at all, 7 = Very well informed |
| Interest in technology | 0–10 | 0 = not at all interested in modern technologies, 10 = very interested in modern technologies |
| Gender | 1 | Male (48%) |
| 2 | Female (52%) | |
| Experience | 1 | No experience (18%) |
| 2 | Second-hand experience (63%) | |
| 3 | First-hand experience (19%) | |
| Inhabitants_residence | 1 | Village (fewer than 5000 inhabitants) (20%) |
| 2 | Small town (5000 to below 20,000 inhabitants) (23%) | |
| 3 | Medium-sized town (20,000 to below 100,000 inhabitants) (23%) | |
| 4 | Big city (more than 100,000 inhabitants) (33%) | |
| Income | 1 | I prefer not to say (7%) |
| 2 | Low income (18%) | |
| 3 | Moderate income (40%) | |
| 4 | High income (33%) | |
| Target Variables | ||
| Variable | Numeric Value | Value Label |
| Attitude (scale) | 1–7 | 1 = Very negative, 7 = Very positive |
| Concerns (scale) | 1–7 | 1 = Not concerned at all, 7 = Very concerned |
| Approval for private & commercial use cases (scale) | 1–7 | 1 = Strongly disagree, 7 = Strongly agree |
| Approval for public & civil use cases (scale) | 1–7 | 1 = Strongly disagree, 7 = Strongly agree |
Disclaimer/Publisher’s Note: The statements, opinions and data contained in all publications are solely those of the individual author(s) and contributor(s) and not of MDPI and/or the editor(s). MDPI and/or the editor(s) disclaim responsibility for any injury to people or property resulting from any ideas, methods, instructions or products referred to in the content. |
© 2024 by the authors. Licensee MDPI, Basel, Switzerland. This article is an open access article distributed under the terms and conditions of the Creative Commons Attribution (CC BY) license (https://creativecommons.org/licenses/by/4.0/).
Share and Cite
MDPI and ACS Style
Stolz, M.; Papenfuß, A.; Dunkel, F.; Linhuber, E. Harmonized Skies: A Survey on Drone Acceptance across Europe. Drones 2024, 8, 107. https://doi.org/10.3390/drones8030107
AMA Style
Stolz M, Papenfuß A, Dunkel F, Linhuber E. Harmonized Skies: A Survey on Drone Acceptance across Europe. Drones. 2024; 8(3):107. https://doi.org/10.3390/drones8030107
Chicago/Turabian StyleStolz, Maria, Anne Papenfuß, Franziska Dunkel, and Eva Linhuber. 2024. "Harmonized Skies: A Survey on Drone Acceptance across Europe" Drones 8, no. 3: 107. https://doi.org/10.3390/drones8030107