1. Introduction
With the still unabated trend towards lightweight construction, advanced composite materials are no longer limited to niche applications. However, not all traditionally manufactured components (e.g., milled parts) can easily be substituted. Consequently, weight optimization is equally important for novel material combinations and classic light metal structures, thus leading to a variety of highly complex and filigree workpieces with substantial requirements regarding the manufacturing process. Tight tolerance specifications are particularly challenging when milling thin-walled structures. Low rigidity causes large workpiece deflections even during the finishing process, which result in an erroneous material removal. There are different approaches to mitigating this problem, from reducing cutting forces and process-induced deformations by parameter optimization to compensating the surface error by adjusting the tool trajectory. Particularly when high demands are placed on accuracy, varying the process parameters alone is not sufficient and other means of error compensation are necessary. In order to recalculate an appropriate NC trajectory, either extensive error measurements or an accurate process simulation model are crucial. This often leads to an unfavorable cost–benefit ratio, which is one of the main reasons preventing industrial application.
Predicting and compensating machining errors have been the subjects of study for many years, which has already led to a vast number of achievements and process improvements. Altintas [
1] laid the foundation for a great deal of work by providing analytical models regarding cutting mechanics and machine tool vibrations. Budak [
2] describes the process of the force-related deformation of thin-walled structures using an analytical model, and shows the potential of reducing it by varying process parameters. Ratchev et al. [
3] coupled a numerical workpiece model with an analytical cutting force model to simulate deformations and derive a modified tool path. Comparable strategies of tool-path adjustments were pursued in further work [
4,
5,
6]. For the prediction of mechanically-induced workpiece deformations of flexible parts, a variety of simulation approaches have been proposed in literature [
7,
8]. Rai and Xirouchakis [
9] additionally integrated a heat input model to simulate thermally-induced workpiece deformations. Schweinoch et al. [
10] developed a hybrid simulation system consisting of a geometric multiscale milling simulation and a finite element method kernel for solving problems of linear thermoelasticity. A detailed approach to identifying the actual heat input within the cutting zone based on measured and simulated workpiece deformations that is designed specifically for thin-walled structures, was proposed by Loehe and Zaeh [
11].
Chatter stability is another important topic in highly-flexible workpieces that has been researched for a long period of time [
12,
13,
14]. Altintas et al. [
15] studied the influence of chatter on the surface location error when flexible workpiece structures are machined. Budak et al. [
16] developed a methodology for the prediction of in-process workpiece dynamics using a finite element model of the workpiece.
Compensation strategies involving tool-path adjustments usually aim at minimizing geometrical errors by directly deriving a tool trajectory that closely mirrors any dimensional deviation. However, in many cases, those optimized tool trajectories are too complex for industrial implementation. As evaluated in detail by Budak and Altintas [
17], the surface error characteristics (i.e., the exact shape of the finished surfaces themselves) significantly affect the level of complexity of the required trajectory adjustment. In many cases, an adequate error-compensation can only be achieved with multiple machining steps. This means a significant increase in machining time, which makes the approach economically unattractive for many applications. One important application for the peripheral milling of thin-walled aluminum workpieces is the production of structural components for aerospace. In order to make tool-path adjustments for error compensation profitable in this area, the machining time of the initial process must remain virtually unchanged. To address this issue, the authors have developed an analytical estimation model that is used in combination with a general compensation approach to predict surface error characteristics. This allows for the pre-selection of tools and process parameters that result in error profiles that are compensated by minimal tool-path adjustments.
2. Materials and Methods
2.1. General Approach for Error Compensation
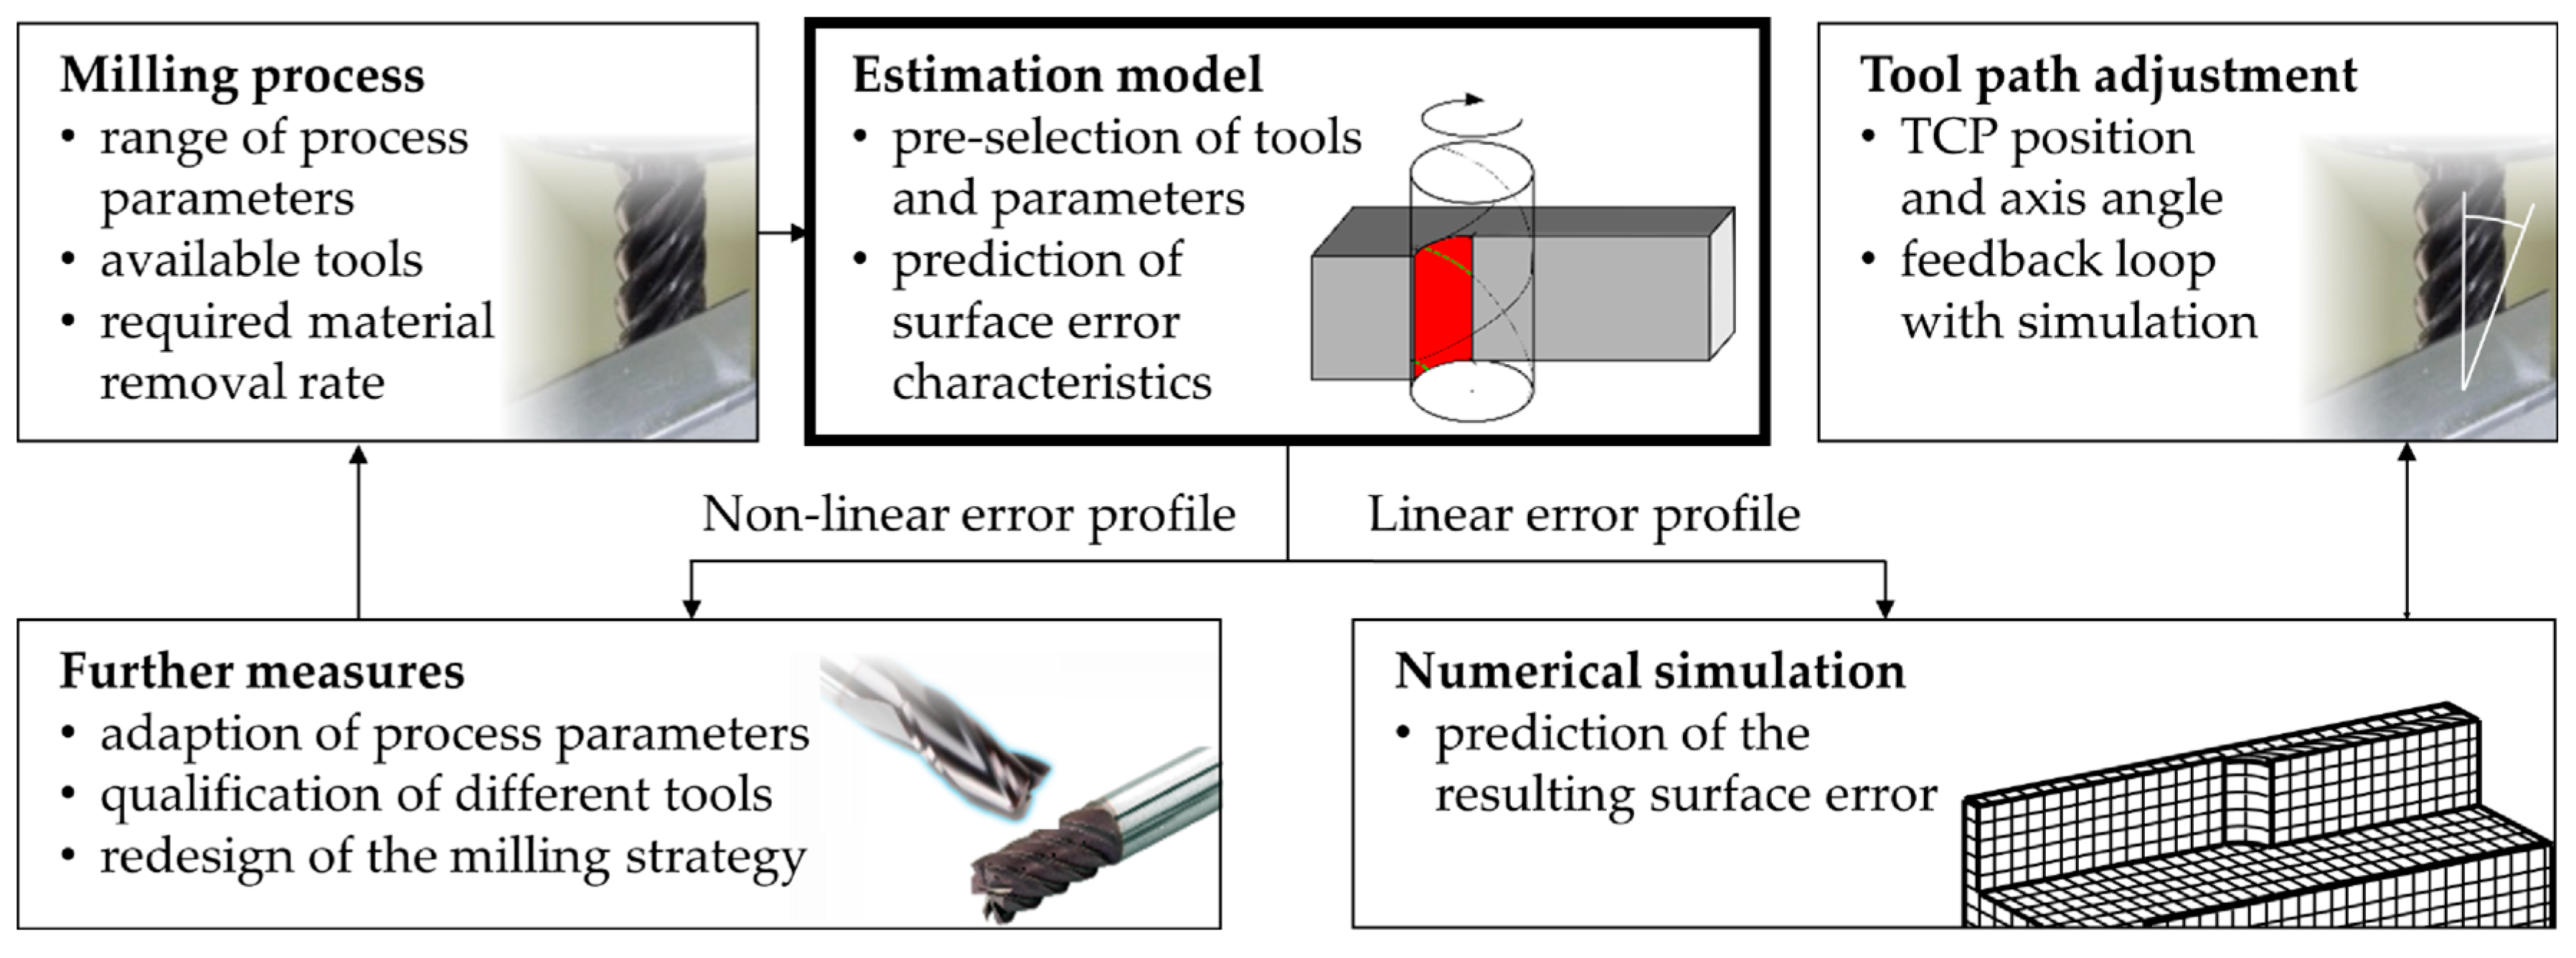
The paper will focus on the analytical estimation model as highlighted in
Figure 1. In order to provide a comprehensive overview, the general approach to mitigating surface errors during the peripheral milling of thin-walled aluminum workpieces is briefly introduced in the following.
The approach is specifically aimed towards the machining of structural components for aerospace applications, which usually includes a high proportion of pocket milling, a great number of stiffening ribs with low wall-thicknesses, and strict requirements regarding tolerance specifications as well as manufacturing time. The estimation model is used to analyze a given milling process that leads to intolerable surface errors. The surface-error characteristics are predicted based on the available range of process parameters and qualified tools. Subsequently, process setups leading to surface errors that can be described in a good approximation by a linear error profile are selected. The exact surface error is determined using a numerical simulation that allows for the calculation of the adapted tool path. If no parameter setup that satisfies the criterion of a nearly-linear error profile can be found, the required tool-path adjustments are assumed to be too complex for a cost-effective compensation. This early evaluation helps to avoid costly numerical modeling and time-consuming simulation runs. In that case, further measures must be taken, ranging from the qualification of different tool geometries and the minimization of workpiece deformation via the adaptation of process parameters up to a redesign of the entire milling strategy.
While the estimation model is an important component of the general approach for error compensation, it is also particularly useful for industrial applications in which a simulative approach is not intended. It can be used to directly identify measures for significant error reduction that can be implemented based on few measurement results. Although no optimal results can be expected, it offers a simple solution for industrial users who do not have enough resources to implement simulation tools in production. In the following section, the surface error formation will be explained briefly before the estimation model is presented in detail.
2.2. Estimation Model
The milling surface finish depends on cutting parameters and tool engagement conditions.
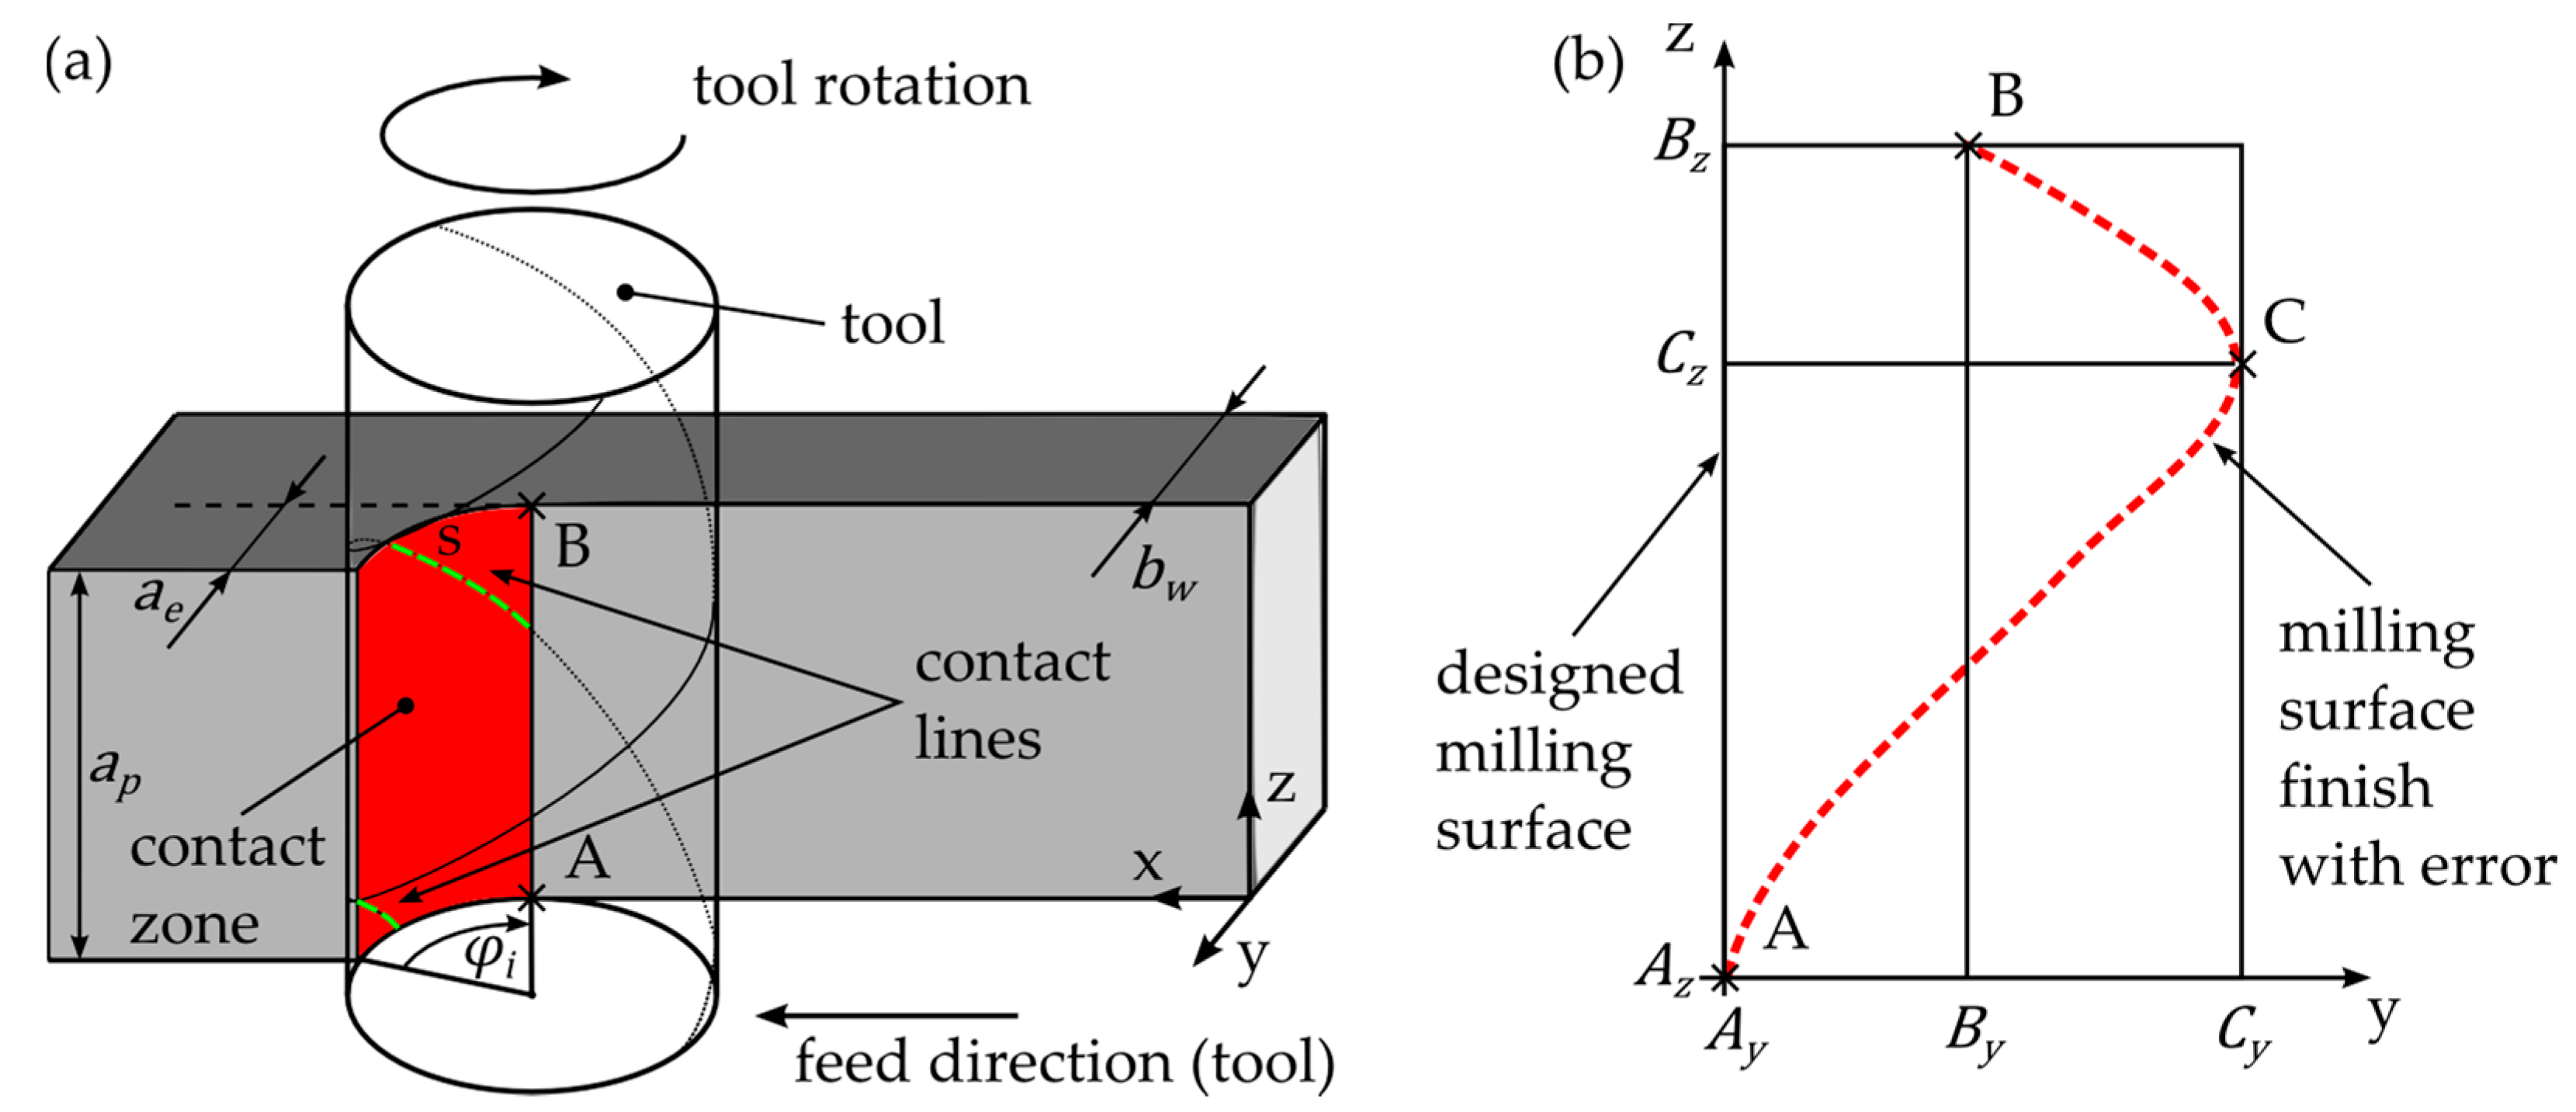
Figure 2a shows the three-dimensional view of a typical peripheral milling setup, with contact zone and tool-workpiece contact lines being highlighted.
Assuming a rigid workpiece, the contact lines are well-defined, and thus a perfect surface is generated. If the part is deflecting, the contact lines for the cutting teeth are shortened, which leads to a faulty surface finish. Ratchev et al. [
18] studied this effect and developed a flexible cutting force model that considers force fluctuations caused by part deflections during the machining process. A typical profile line generated by a helical end mill with multiple flutes is schematically depicted in
Figure 2b. It is mainly influenced by the spring-back behavior of the machined part during the cut.
A common approach to error compensation is to adjust the tool trajectory according to the mirrored profile line [
19]. The complexity of the resulting tool path can be directly derived from this profile line. Ideally, the curve is approximately linear, which only requires the tool axis to be tilted accordingly to cancel out the surface error. While the prediction of the exact profile line is difficult and requires, for instance, a detailed simulation model, its basic geometry can be described by three points: The deviation from the nominal dimension at the lower and top edge (A, B) as well as the location of the maximal deviation (C). The impact of the spring-back effect during a single tooth engagement can be expressed by an error linearity factor defined as
Determining and allows for reliable conclusions regarding the linearity of the error profile line in case the entire curve is not known. Both values can be predicted based on process parameters and engagement conditions using an analytical approach. This enables the selection of parameter sets that generate surface errors that can be nearly completely compensated while avoiding complex tool trajectories.
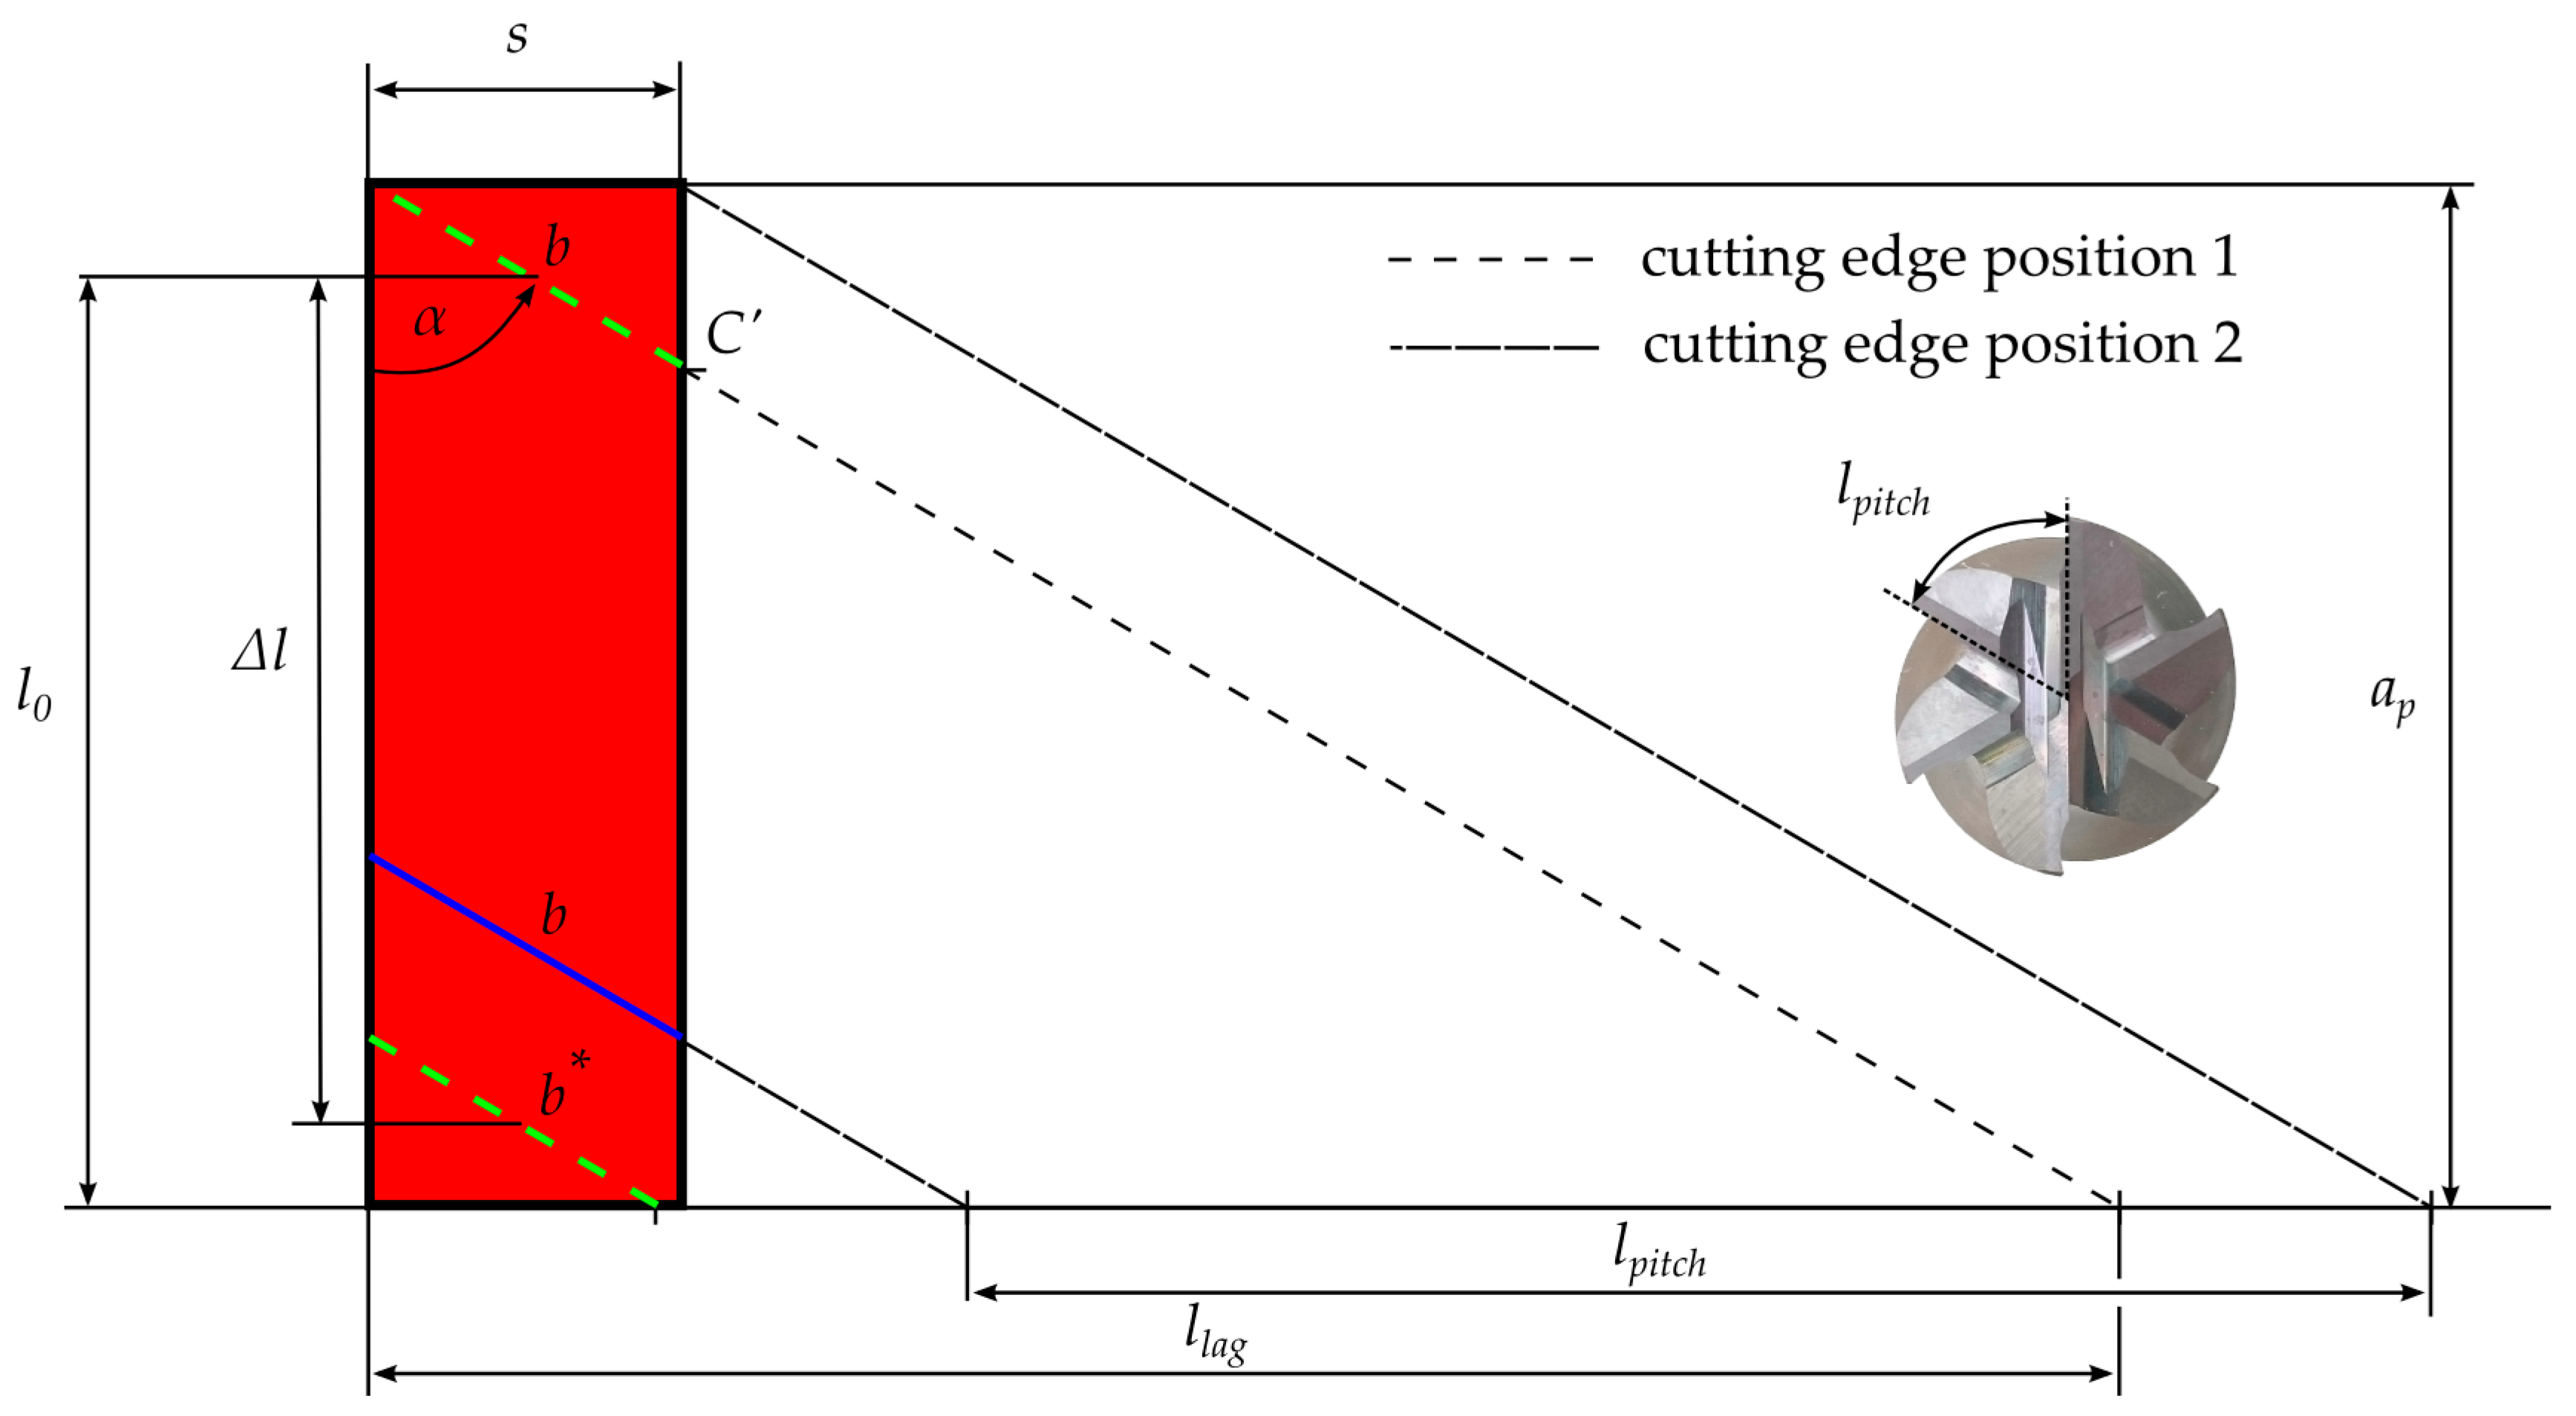
Figure 3 shows the “uncoiled” idealized contact zone of the machined workpiece surface. The dashed lines represent the “uncoiled” cutting edges of the end mill at two different points in time. For the derivation of the model equations, the influence of tool and workpiece deflections on the geometric relations are neglected, and it is assumed that no tool runout is present. In practice, the tool immersion angle and the length of the contact lines continuously change due to the above-mentioned effects. The influence of this simplification on the prediction accuracy of the proposed model will be discussed in
Section 4.
The contact length of each cutting edge can be determined by the intersection of the respective line and the contact surface. By using cutting width
and tool diameter
, the immersion angle
can be calculated as
which yields the immersion arc
:
With cutting depth
and the helix angle
of the end mill, the contact zone is fully defined. Depending on the number of flutes
, the arc length between two consecutive cutting edges
is given by the following equation:
Furthermore, the arc length covered by a single cutting edge during the contact interval can be expressed as
It must be noted that the exit phase of the tool, once it reaches the top edge of the part, is not regarded in the above description. Finally, a contact ratio
can be defined as
A contact ratio means that the total contact length equals the maximal contact length of one single cutting edge throughout a full tool rotation. In order to possibly generate a linear profile line of the surface error, the spring-back of the machined part must be prevented. One way to limit this effect is to have more than one cutting edge in contact simultaneously, which provides support for the flexible workpiece. For this purpose, a contact ratio is necessary.
In the prediction model, chip thickness and cutting force per contact length
are assumed to be constant. Thus, the position of the contact lines can be used to estimate the fictitious bending moment exerted by the cutting edges. For each set of parameters, one cutter position exists in which the fictitious bending moment is maximal. Another position exists that yields a minimal fictitious bending moment. For the calculation, it must be distinguished between two cases, with
2.2.1. Case 1:
The maximal and minimal bending moments can be directly calculated, with one cutting edge fully in contact or no tool–workpiece contact, respectively:
The length of the cutting edge fully in contact with the workpiece
and the average lever arm of the top cutting edge
can be calculated as
2.2.2. Case 2: U ≥ 1
Depending on the contact ratio
, there are one or multiple cutting edges fully in contact with the workpiece (
), while another cutting edge may be partially in contact (
):
The average lever arm of the top cutting edge
is reduced for the following cutting edge by
The maximal bending moment can then be determined via the following equation:
Equation (14) can further be simplified, yielding:
In a similar fashion, the minimal bending moment can be calculated as
with
Equation (16) can also be simplified, which results in
It is assumed that the ratio of the fictitious minimal and maximal moment directly correlate with the error linearity factor as per
Furthermore, the z-position of the maximal dimensional deviation
is expected to correlate with the location of the uppermost contact line at the cutter position, which causes the maximal fictitious bending moment. Considering that chip formation takes place along an entire contact line, the finished surface is effectively generated at the final contact point. Thus,
can be roughly approximated by the
z-coordinate of
(
Figure 3):
However, no statement can be made regarding using this simplified model. This would require a more detailed analysis.
2.3. Experimental Setup
In order to verify the prediction model, milling experiments were carried out using a GROB G350 universal machining center equipped with a five-axis SIEMENS SINUMERIK 840D sl for contouring control. According to the manufacturer’s specifications, the repeat precision of positioning is below 3 µm. Plates of 80
in width and with varying height were machined. The plates were cantilevered from the base and free at all other edges. The surface finish of all workpieces was milled with a single cut, while the remaining wall-thickness was kept constant at 1
for all workpieces.
Table 1 provides an overview of the used process and tool parameters.
Three aluminum (AW 7075 T651) workpieces were machined for each parameter combination, resulting in a total number of 216 parts. The full factorial design of experiments included a randomized sequence to account for statistical uncertainties. By using the selected end mills as well as workpieces at variable height (with ), a wide array of contact ratios could be realized. The form error was evaluated using a Keyence VR-3200 optical 3D surface measurement system that operates on the laser triangulation method with two projection units. The system has a resolution of 0.1 and achieves a measurement accuracy of ±2 at 40× magnification. In order to get optimal results, a highly planar () unmachined surface was used as a reference plane for the milling process as well as the measurement.
3. Results
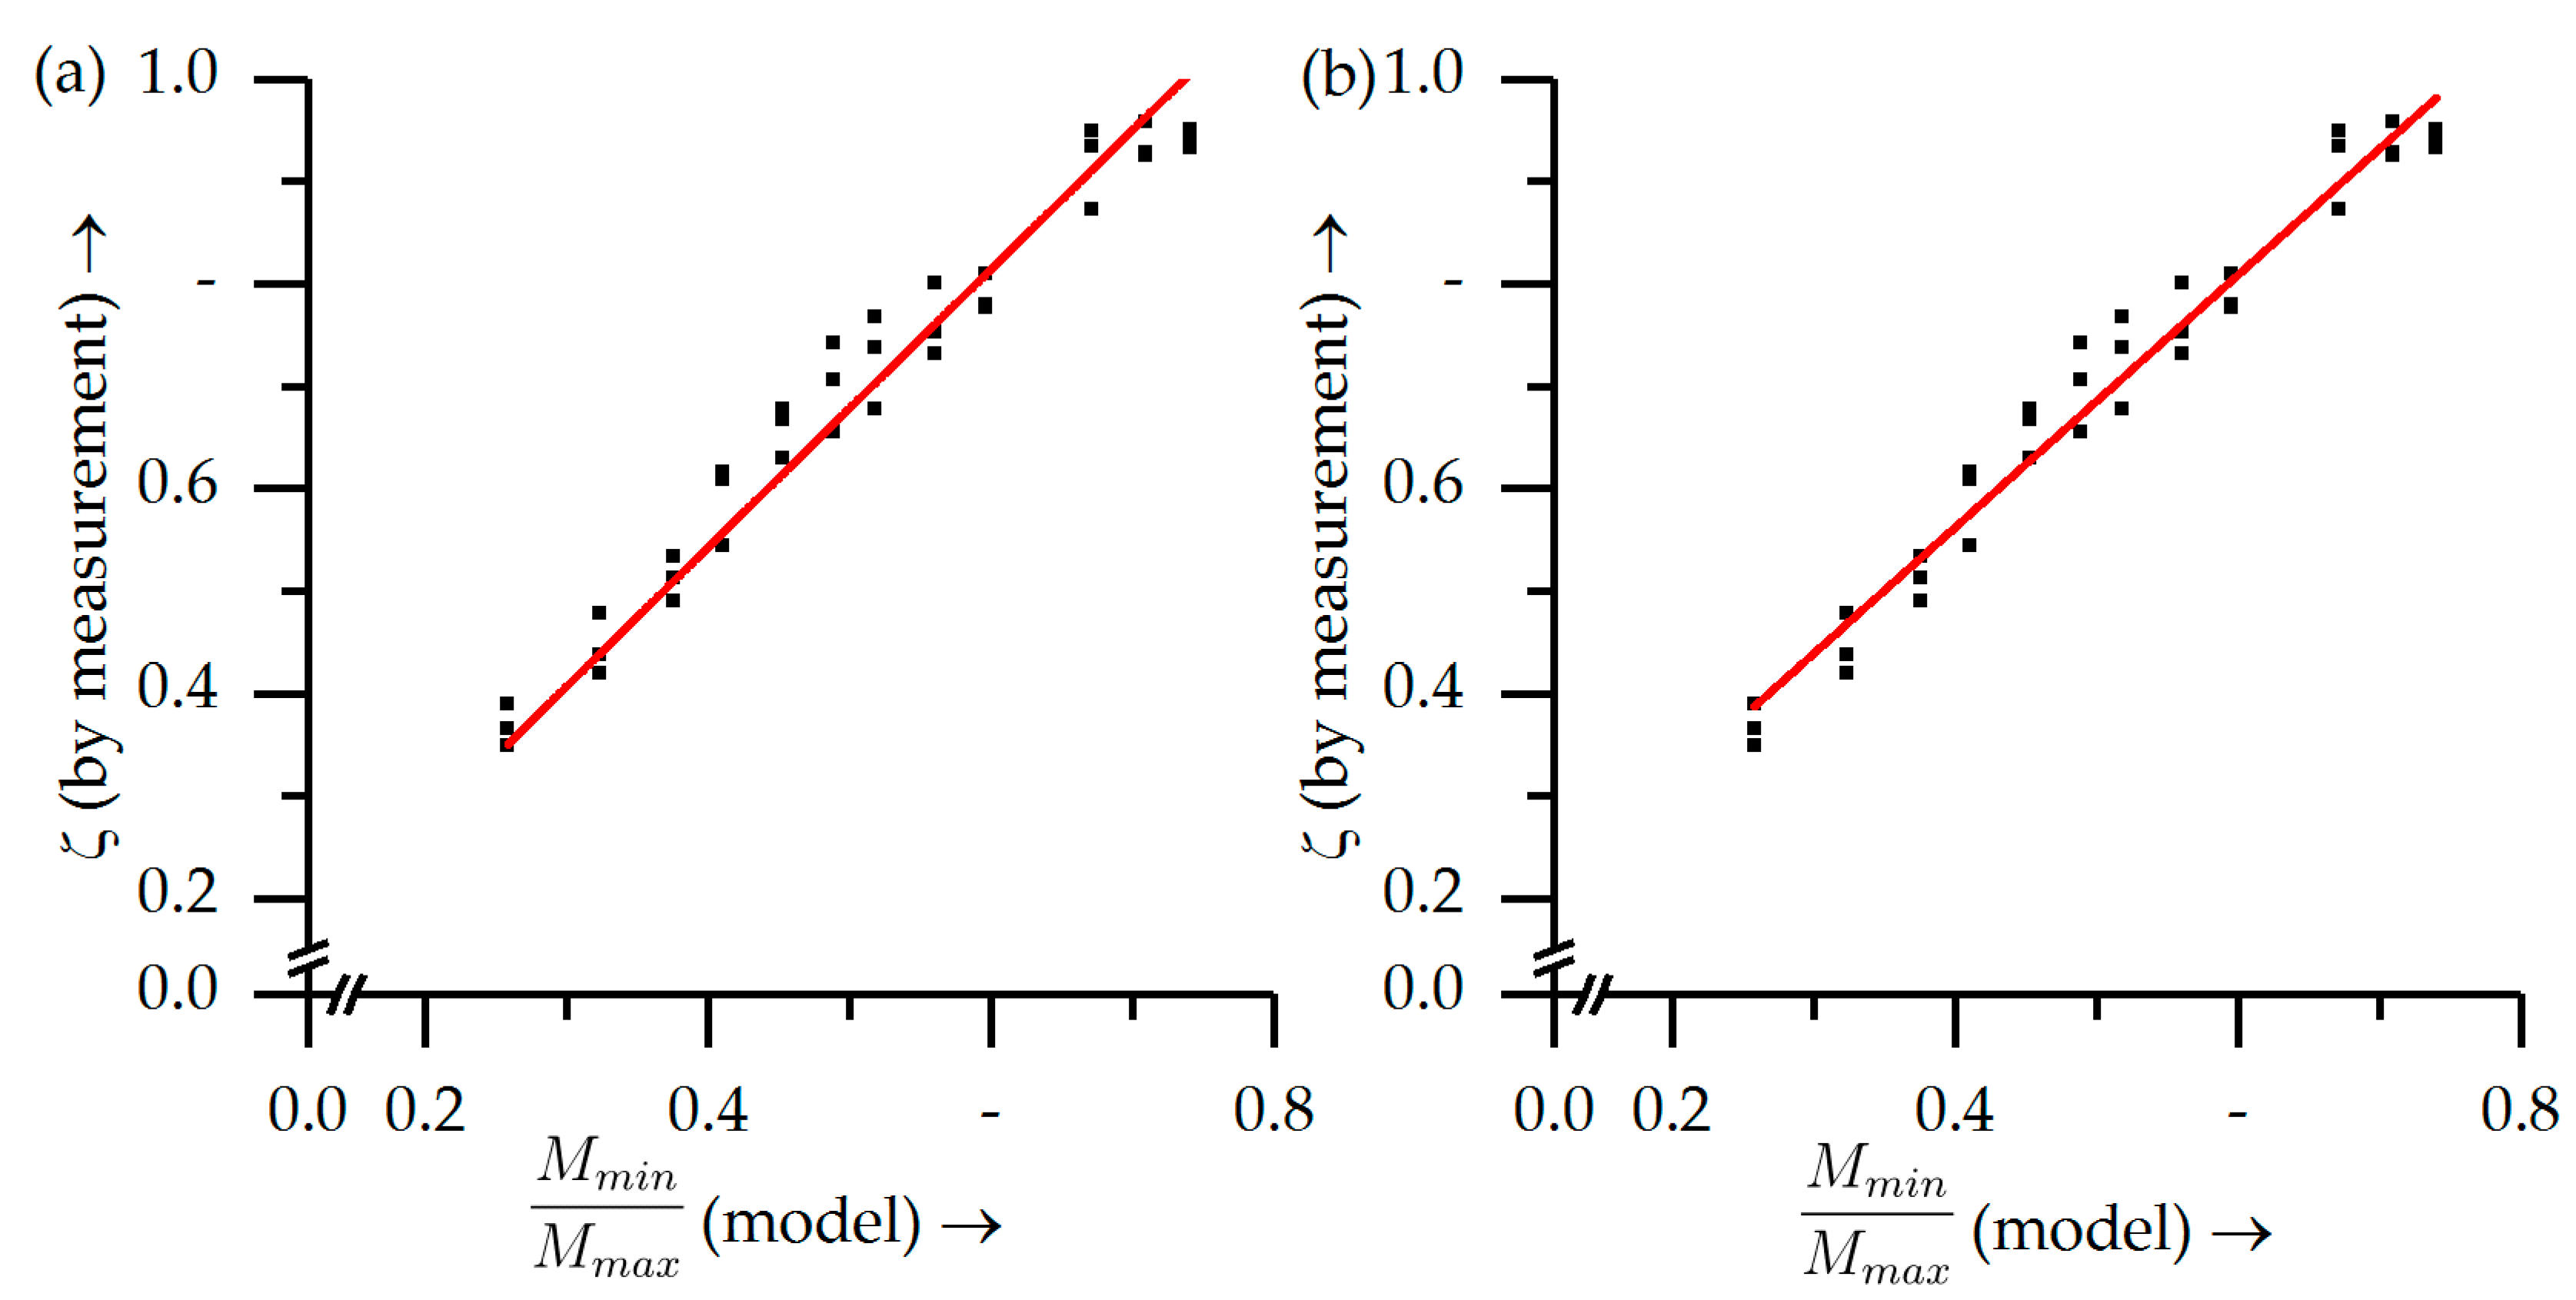
The model was validated by comparing the error linearity factor
determined via measurement with the fictitious moment ratio derived from the model. In order to calculate
in Equation (1), the surface profile in the middle of the plates was analyzed regarding the maximal deviation
and deviation at the top edge
from the nominal dimension
(
Figure 2b). The fictitious bending moments were calculated following Equations (2)–(18). Using a linear regression model, Equation (19) was confirmed: A directly proportional relation (
Figure 4a) yielded a marginally larger error compared to the linear fit (
Figure 4b), as shown in
Table 2. The experimental results also confirmed the assumption that the feed per tooth
did not directly influence the error linearity factor
. The divergence in the measurement values with varying
laid within the range of repeat measurements with identical parameters. However, the absolute values of the dimensional deviation were higher with increasing feed per tooth
. The maximal measured deviations among the workpieces ranged from 46
to 332
. In
Figure 4, all data point triplets are comprised of one value for each
, which cover the spread of all measured values.
The error linearity factor
serves as a means of estimating the residual error after adjusting the tool path by changing the angle of attack. The adjustment necessary for an optimal error compensation can be determined from measurement data, as shown for example in
Figure 5, or via a process simulation, which will be addressed in future work.
For any such surface error profile, a linear approximation can be found that leaves a minimal residual error
when the tool axis is adjusted accordingly (
Figure 5a). This means the approximated error is “mirrored” by tilting the tool in the opposite direction. Following the definition of the error linearity factor
and considering the small-angle approximation, minimal residual error
can be estimated as:
Figure 5b depicts the error profile of a workpiece that was machined with identical process parameters as the workpiece shown in
Figure 5a while applying the experimentally determined tool path adjustment. In doing so, the maximal surface error
was reduced by about 80%, which falls in line with the estimation from Equation (21). Adjusting the angle of attack also changes the effective cutting width
towards the top edge of the workpiece. In case of large surface errors, this effect becomes quite significant and the error mitigation less effective. When using a process simulation, the issue is addressed by iteratively modifying the effective cutting width within a feedback loop.
It must be noted that the simplified model expects a single local error maximum, and therefore is no longer valid for undulated surface errors. The effect has been described as being a result of tool deflections [
9] when milling comparably rigid workpieces. When a low remaining wall-thickness is combined with a large cutting depth, it potentially causes the occurrence of significant local workpiece deformations around the contact line of each cutting edge, which results in a similar effect. However, that would require plates with extremely low rigidity, which normally causes workpiece chatter before this effect occurs. Workpieces machined with a cutting depth
exhibit visible chatter marks across the parameter spectrum. The effect described above was not observed on any of the machined workpieces. The dimensional accuracy addressed by the proposed model is only relevant for stable or at least marginally unstable processes. As the occurrence of undulated surface errors is very unlikely in that case, the model can be assumed as valid within its field of application.
4. Discussion
It has been shown that the degree of linearity of the error profile can be estimated based on process parameters and milling geometry. By using the estimation model, a pre-selection of process parameters and tools can be made based directly on the moment ratio provided by the model. This approach requires no experimental effort and provides a valuable estimation of what form error characteristic is to be expected. However, due to the implicit simplifications of the model, the degree of linearity will be underestimated. In practice, the maximal bending moment is lowered more significantly by the deflecting workpiece and tool than the minimal bending moment. To increase the model accuracy, the error linearity factor has been introduced, which must be determined using experimental data. In doing so, a correlation function can be found that accurately describes the relation between the error linearity factor and the calculated moment ratio for a specific parameter range. It has been shown by the use of a large data set that the correlation is in a good approximation directly proportional. This minimizes the experimental effort, as only one constant needs to be determined.
The error linearity factor also allows for the estimation of the minimal residual error that is to be expected after employing an appropriate tool-path adjustment. This directly serves as a quality criterion for measuring the potential for improvement by applying the pursued compensation strategy. The main condition to obtain an error linearity factor of , and thus an almost linear error profile, is a contact ratio of . An error mitigation of about can be achieved when values of are realized. For the studied parameter spectrum, this equates to a ratio of the fictitious minimal and maximal moment of approximately . While the cutting depth and the cutting width both have their influence, the simplest way to increase the error linearity factor is by using slender end mills with an increased number of flutes. Thereby, the general milling strategy remains unaltered while the potential error mitigation can be significantly improved by adjusting the tool path.
As stated above, the model is potentially no longer valid for extremely thin structures with a high cantilever length. However, such structures are prone to workpiece chatter, which must first be addressed before considering any compensation of form errors caused by regular deflections. The problem of workpiece chatter is also crucial for the machining quality of thin-walled parts, and will be addressed in future work with regard to the general approach for error compensation introduced in this paper.
5. Conclusions
In this paper, a general approach to mitigating surface errors during the peripheral milling of thin-walled aluminum workpieces is introduced. It is aimed towards aerospace applications and employs an analytical model for the estimation of surface error characteristics in order to avoid unnecessary and costly process simulations. The analytical estimation model, which is presented in detail, describes the characteristics of the remaining form error after the finishing process in a simplified manner.
The proposed estimation model allows one to efficiently evaluate whether the expected error can be compensated via simple tool-path adjustments or requires a complex and costly redesign of the manufacturing process. No cost-intensive experiments need to be carried out, nor do elaborate numerical models have to be created beforehand. The analytical model gives a good estimation of the form error based only on process parameters and the simplified milling geometry. By determining a single constant, the prediction accuracy can be further increased for a specific range of process parameters. The amount of data required for the calibration can be obtained from as little as one measurement.
To verify the model, an extensive experimental study was performed in which more than 200 workpieces were machined. It also has been shown that an error mitigation of is achievable by determining an adjusted tool path directly from measurements without considering the influence of those adjustments on effective cutting parameters (e.g., the cutting width). Complex tool trajectories that lead to increased machining times are avoided. While one key application of the estimation model is to avoid unnecessary modeling and time-consuming simulations, it is not limited to this purpose. As shown in this paper, a significant reduction of the surface error can already be achieved by simple tool-path adjustments derived from measurement results. The selection of appropriate end mills and cutting parameters can be made based on the results provided by the estimation model, without the requirement of any investments or expertise in numerical methods.


