3D Printing Cellulose Hydrogels Using LASER Induced Thermal Gelation

 , , , and
Abstract
:
1. Introduction
2. Materials and Methods
2.1. Chemicals
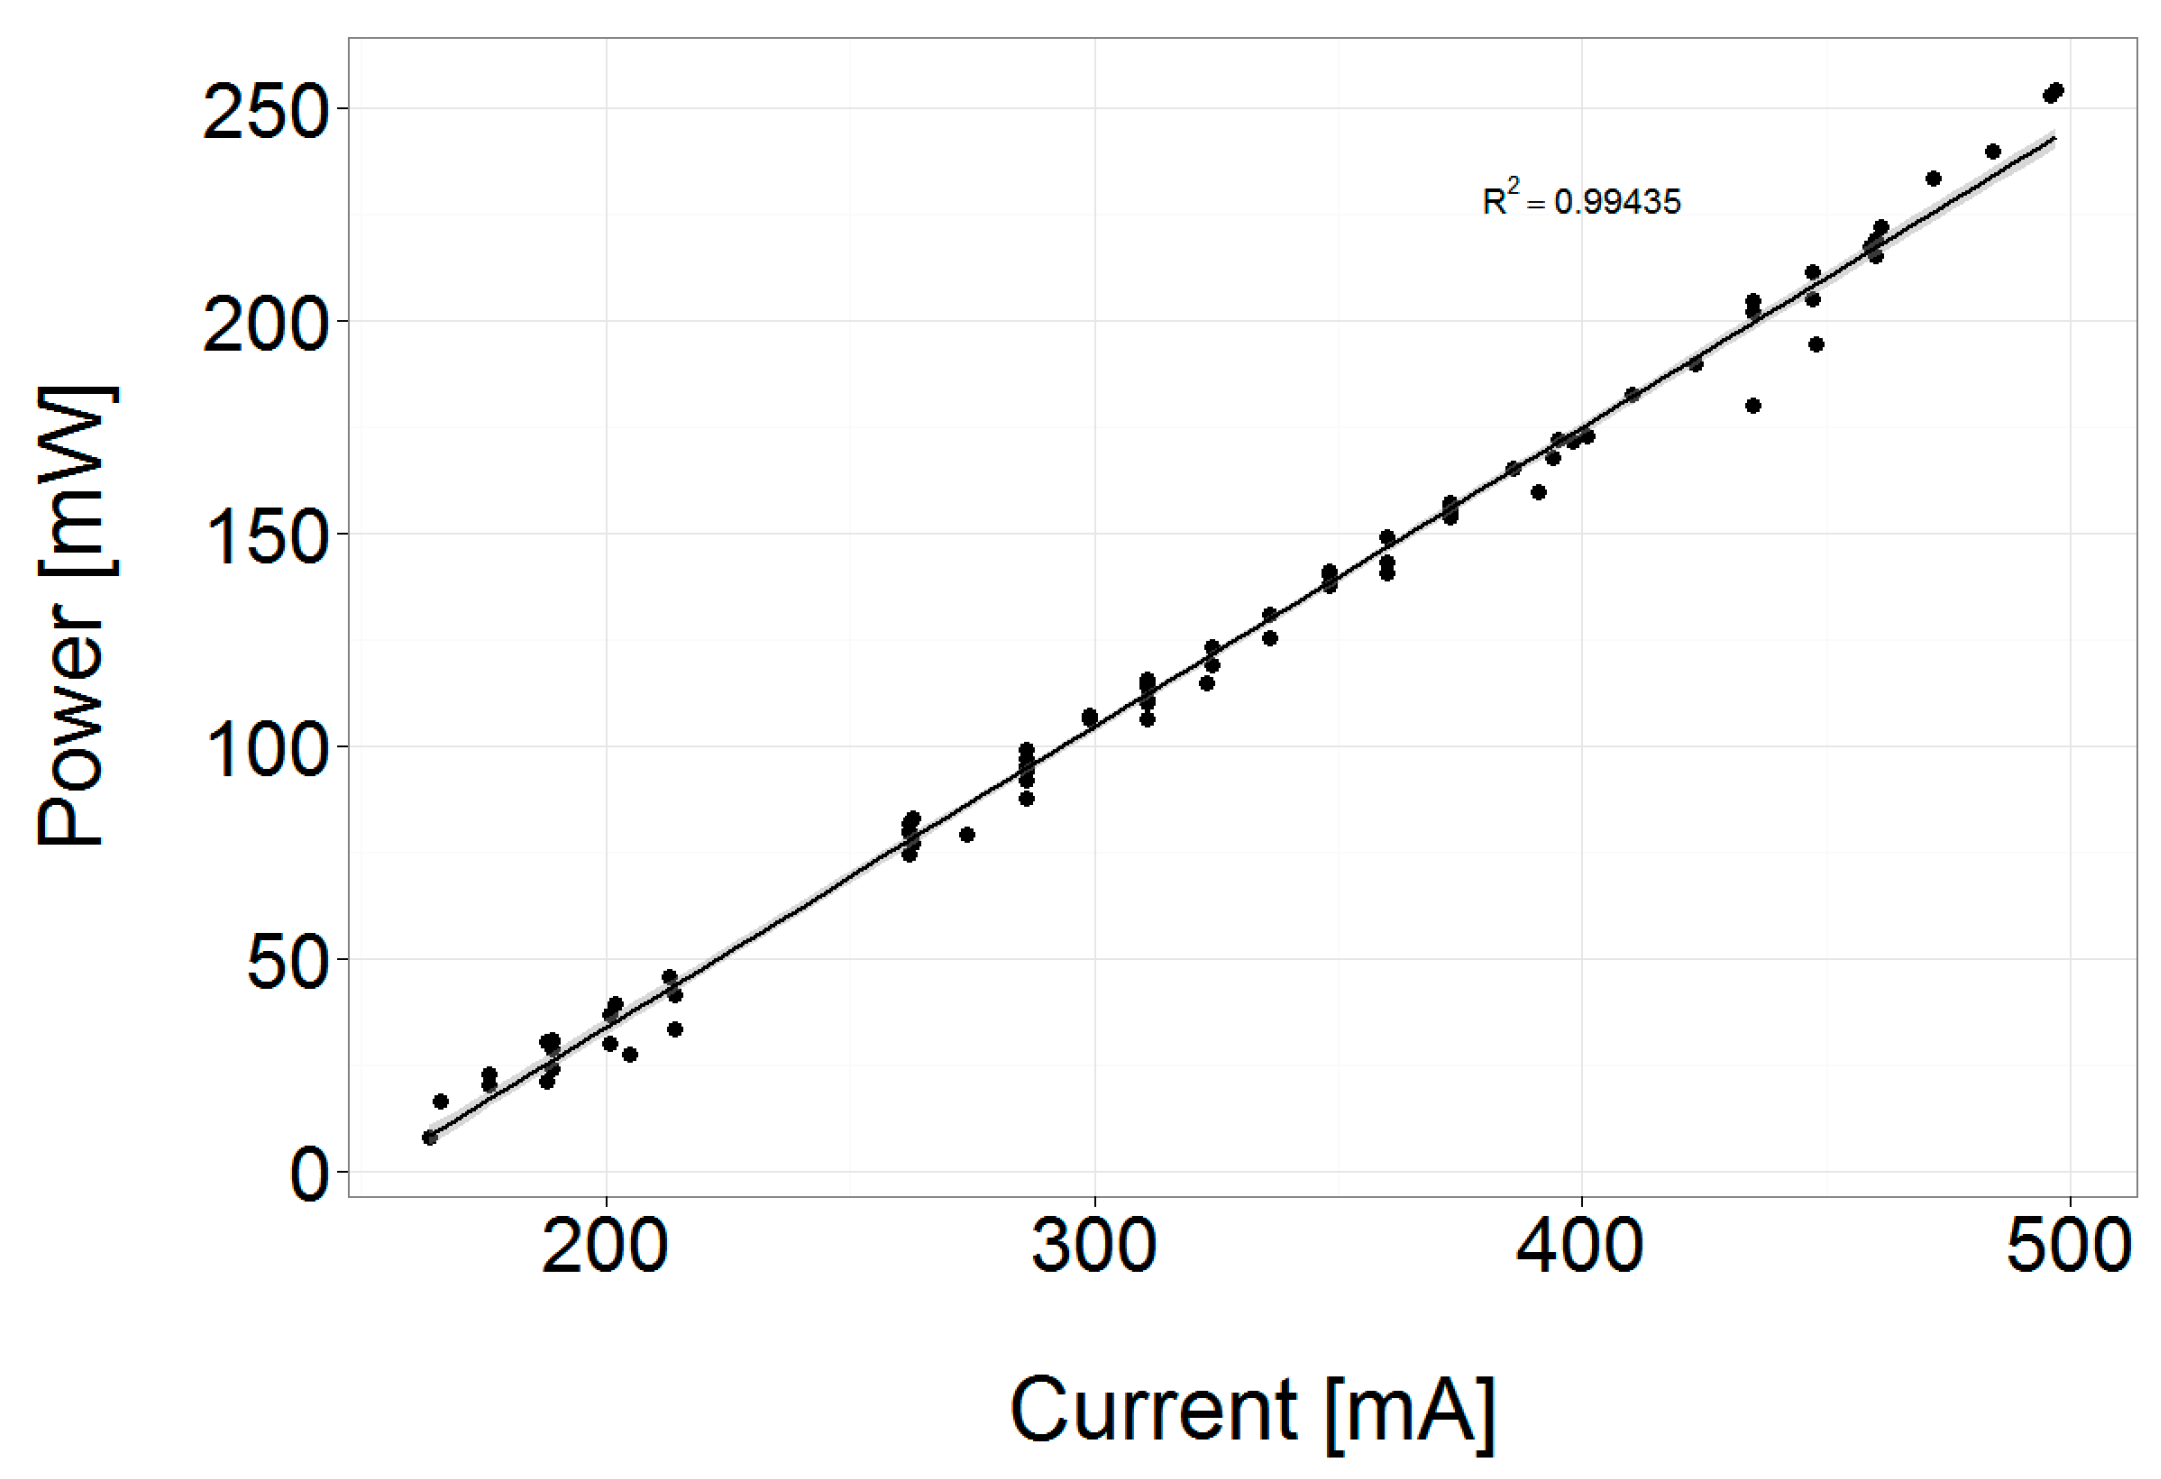
2.2. Laser Optics
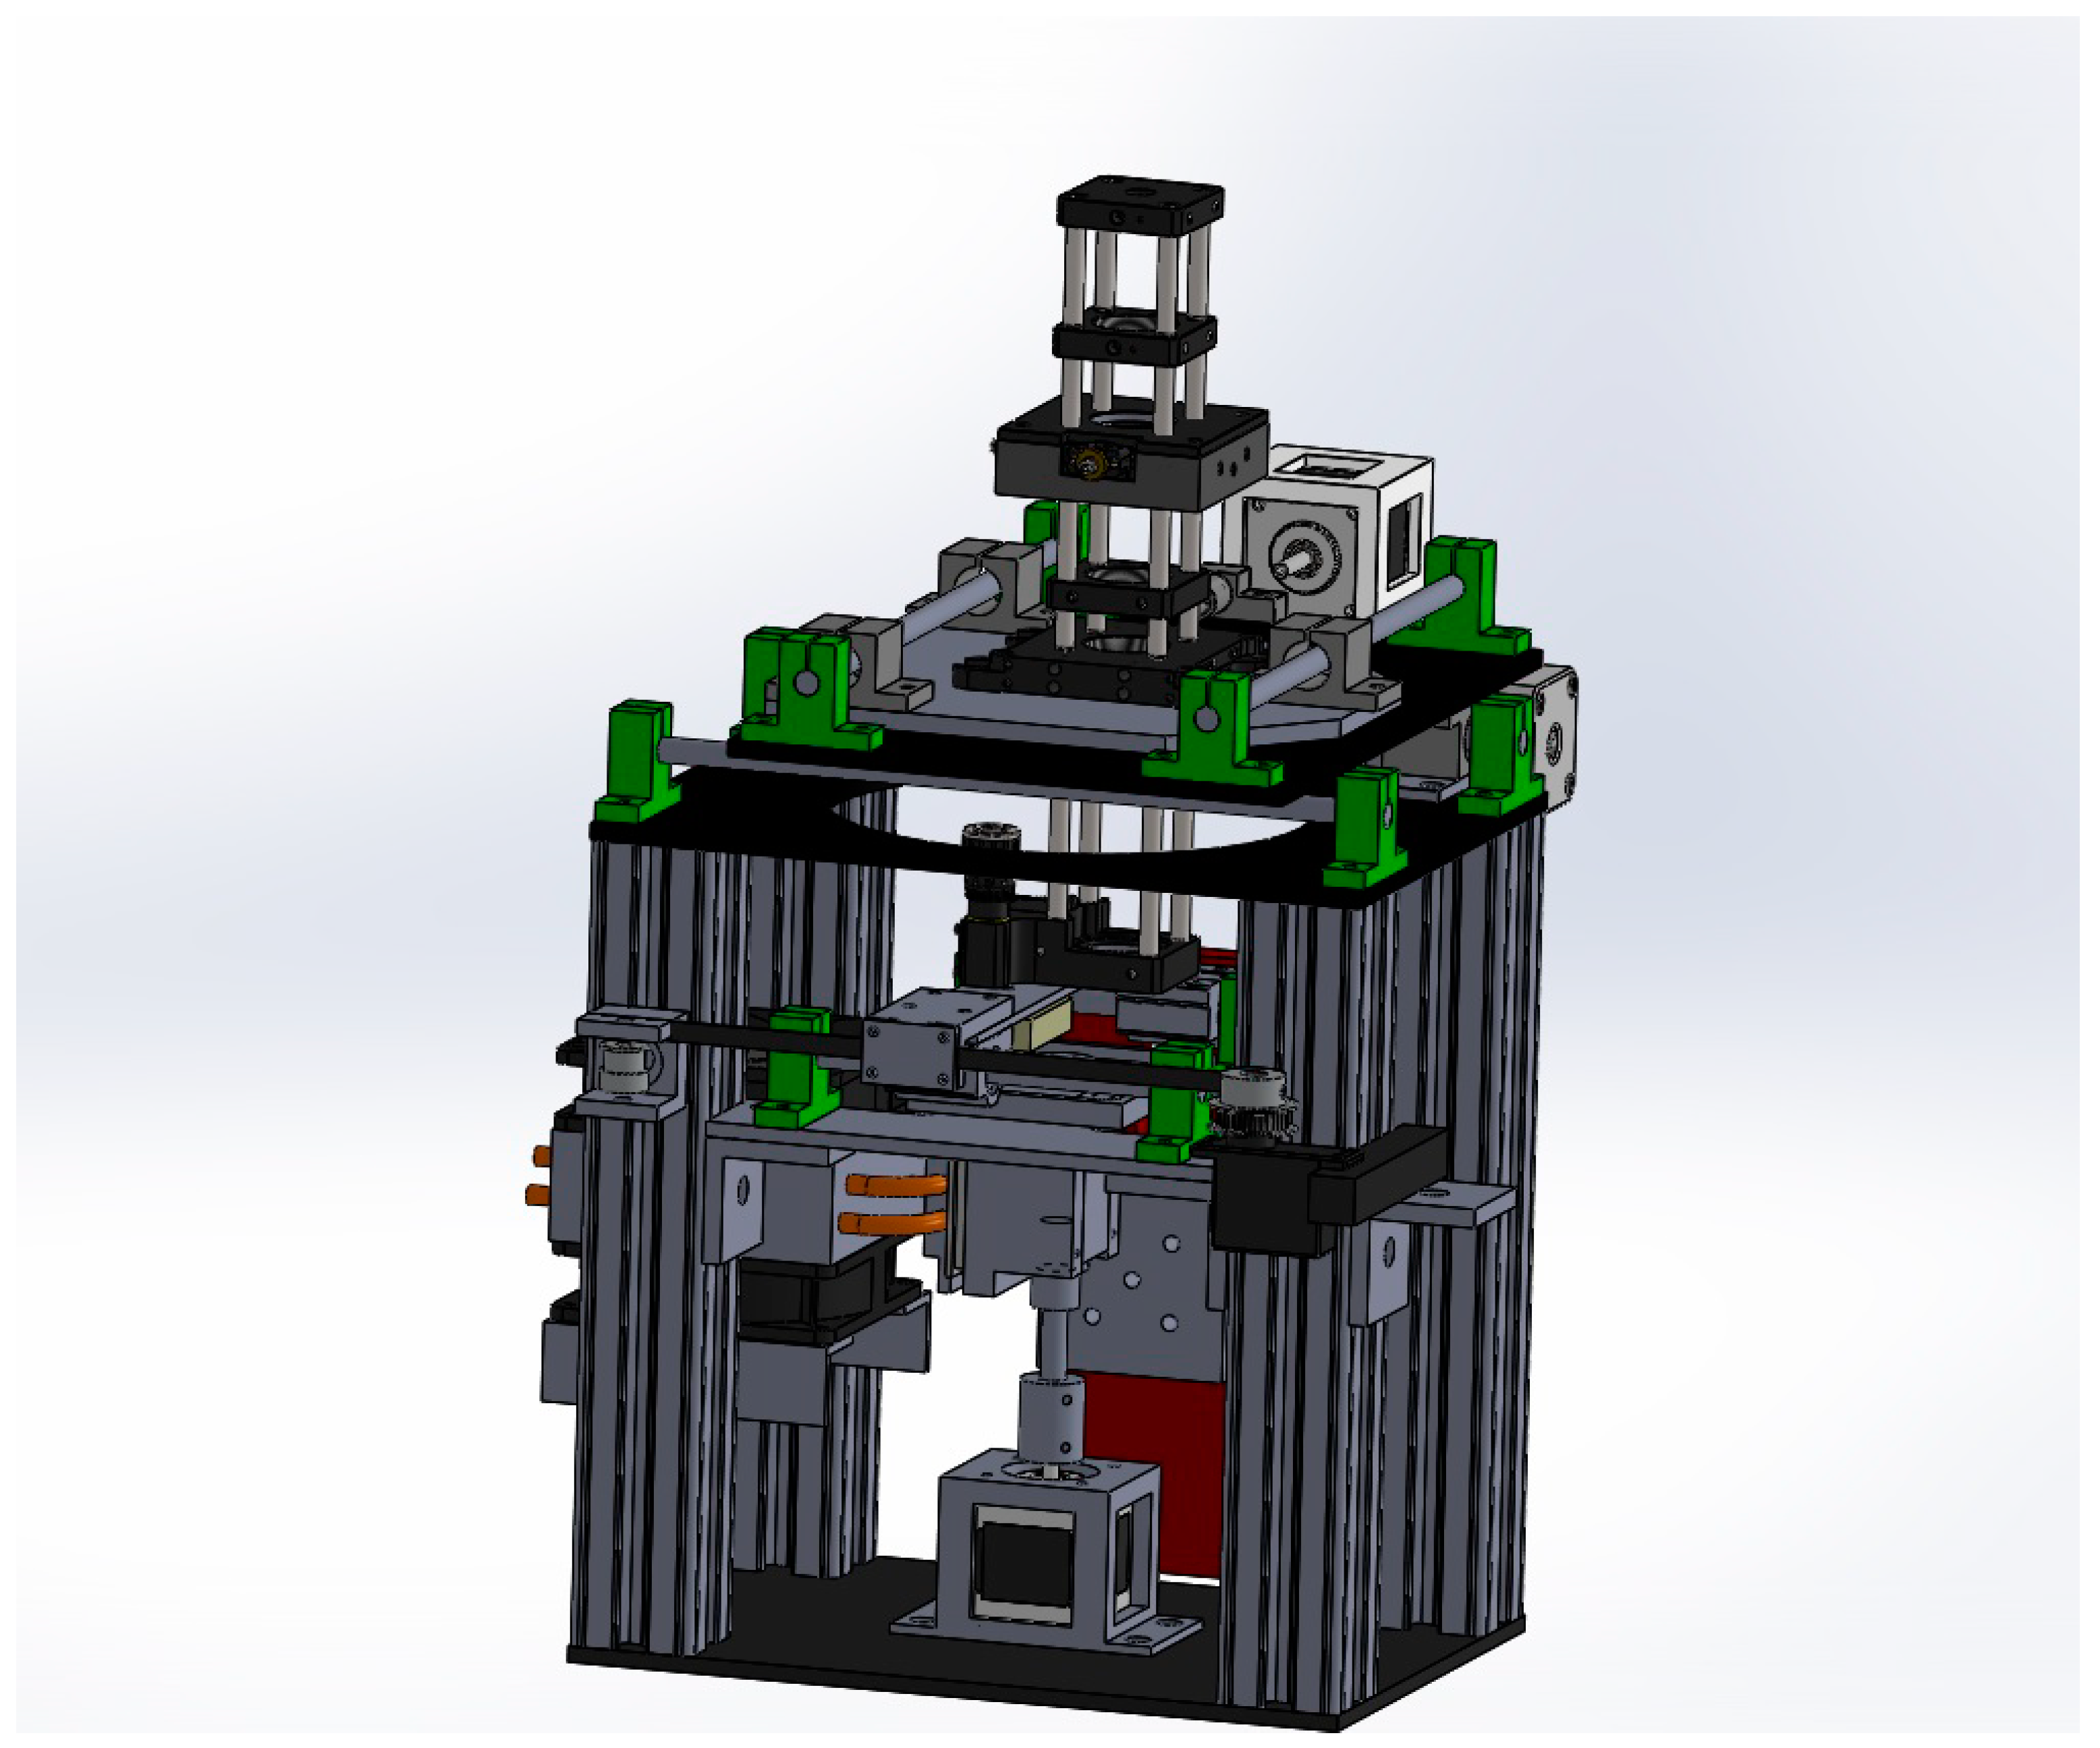
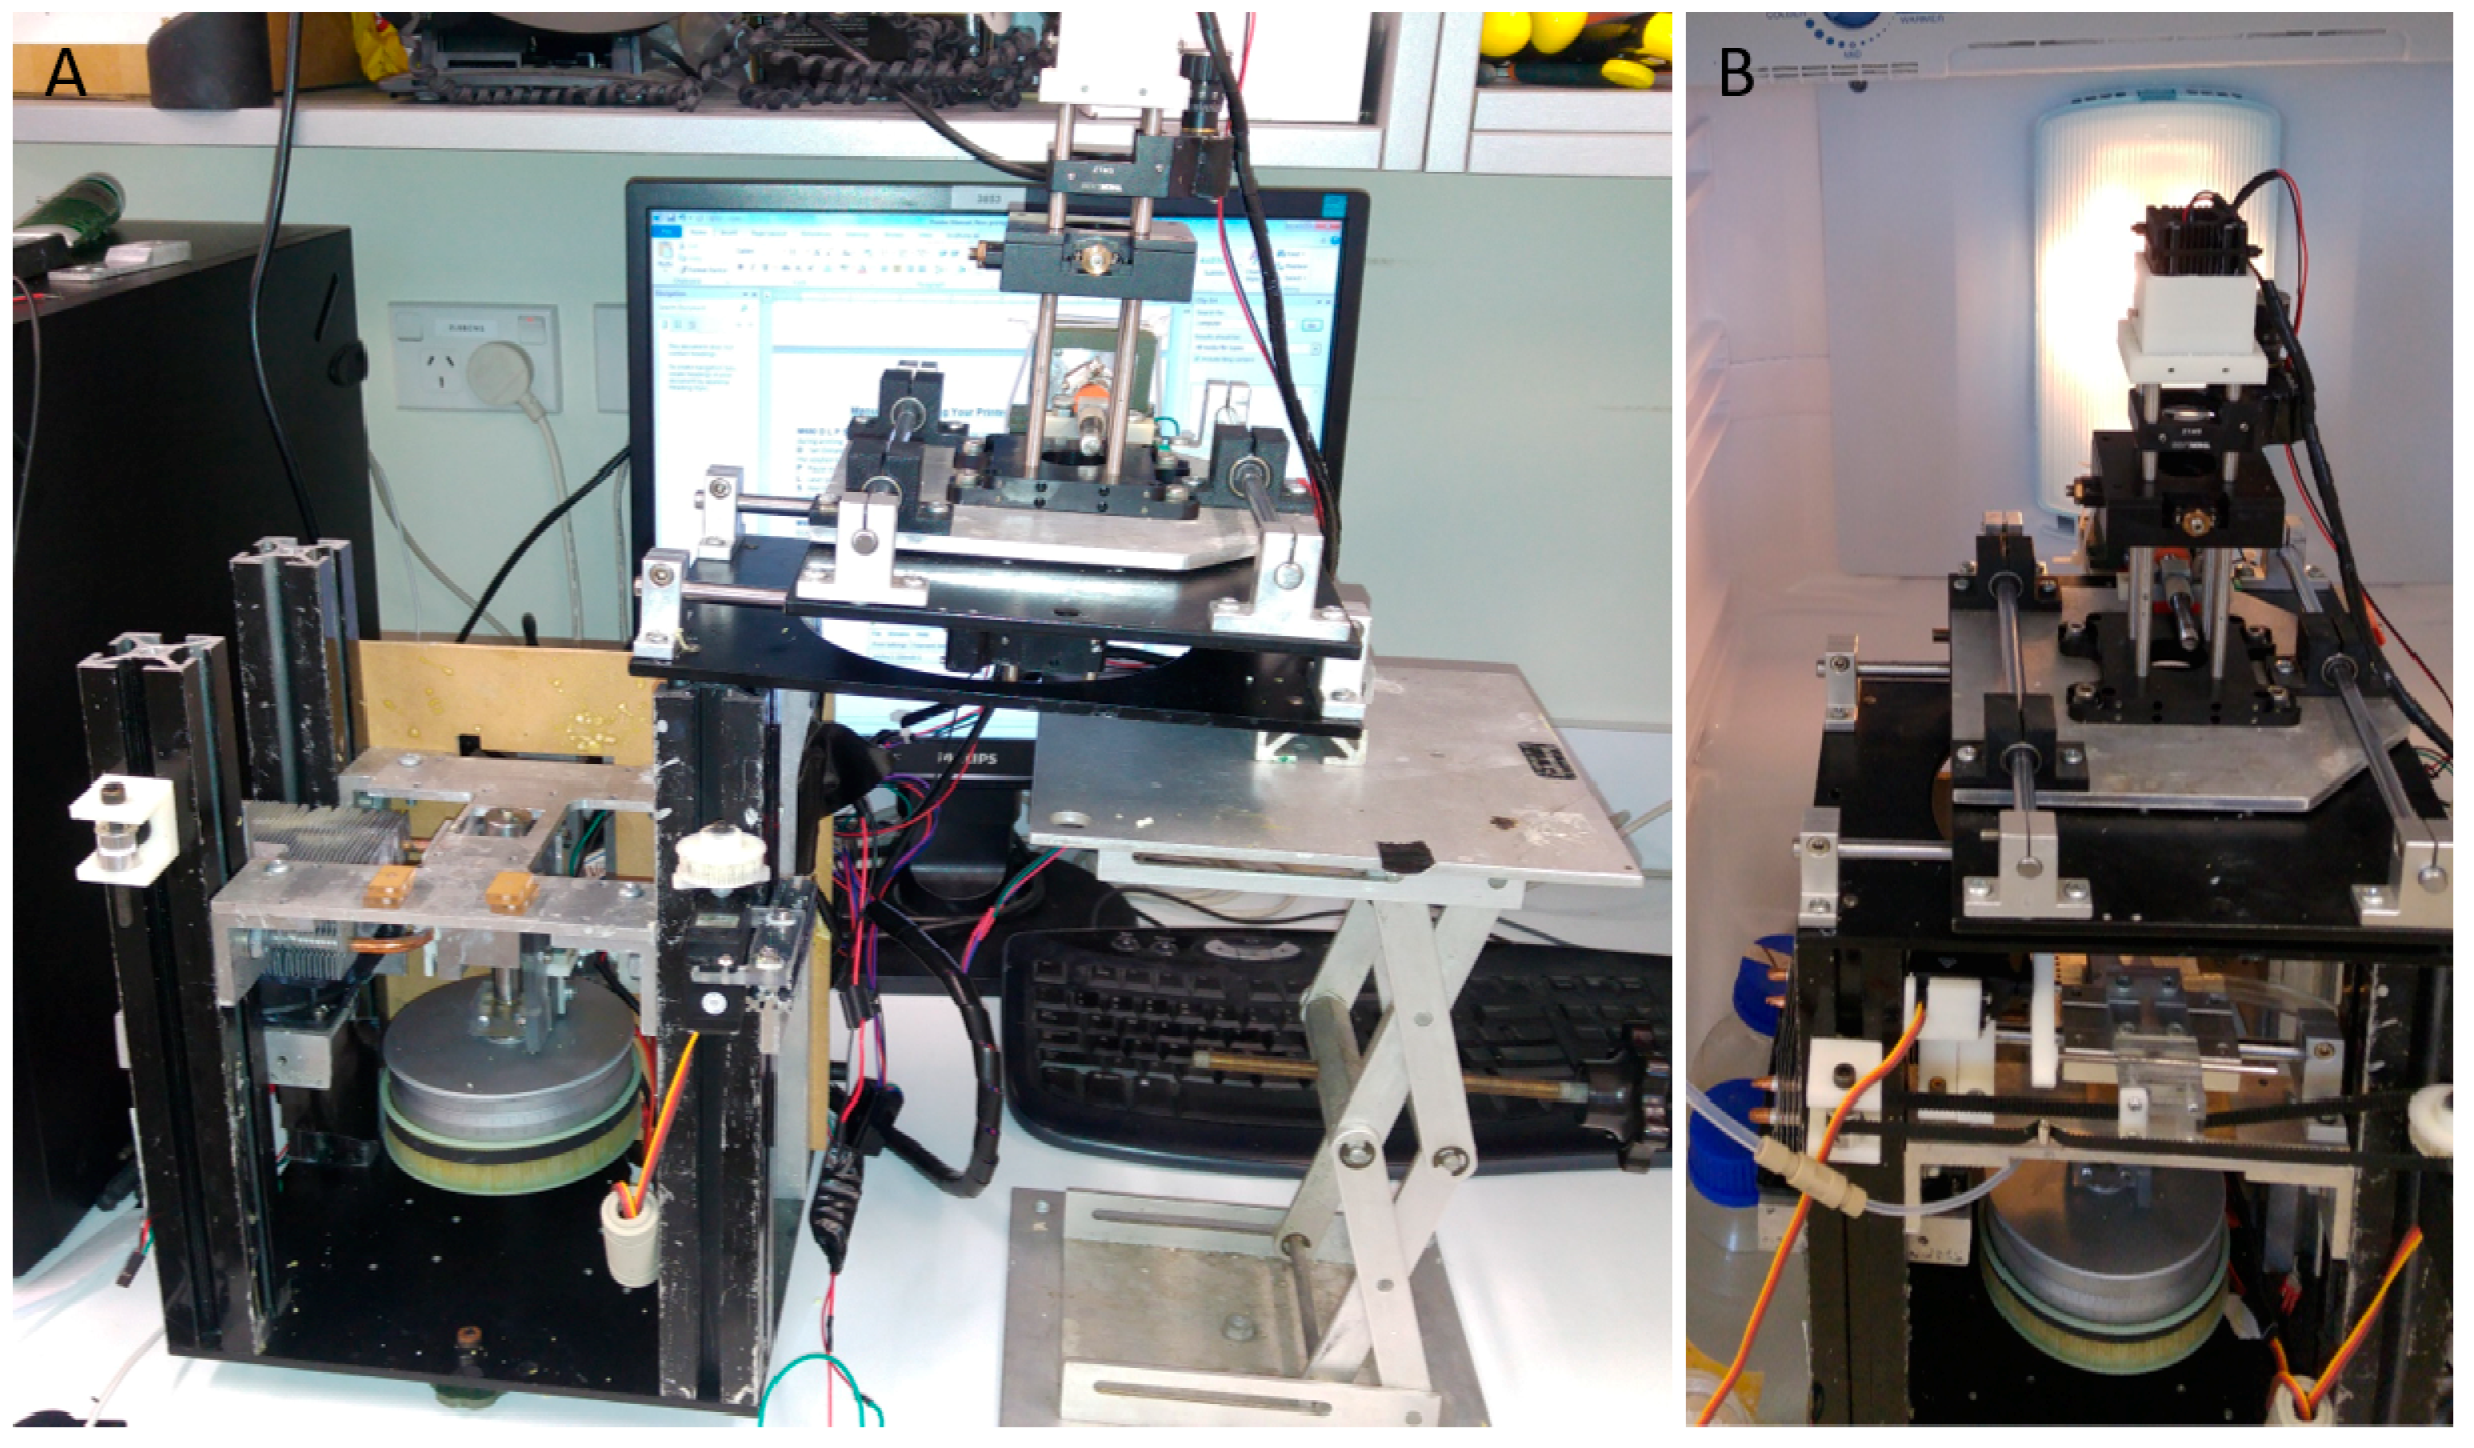
2.3. Printer Design and Construction
2.4. Preparation of the Cellulose Solutions and Gels
2.5. Rheology
2.6. Mechanical Testing
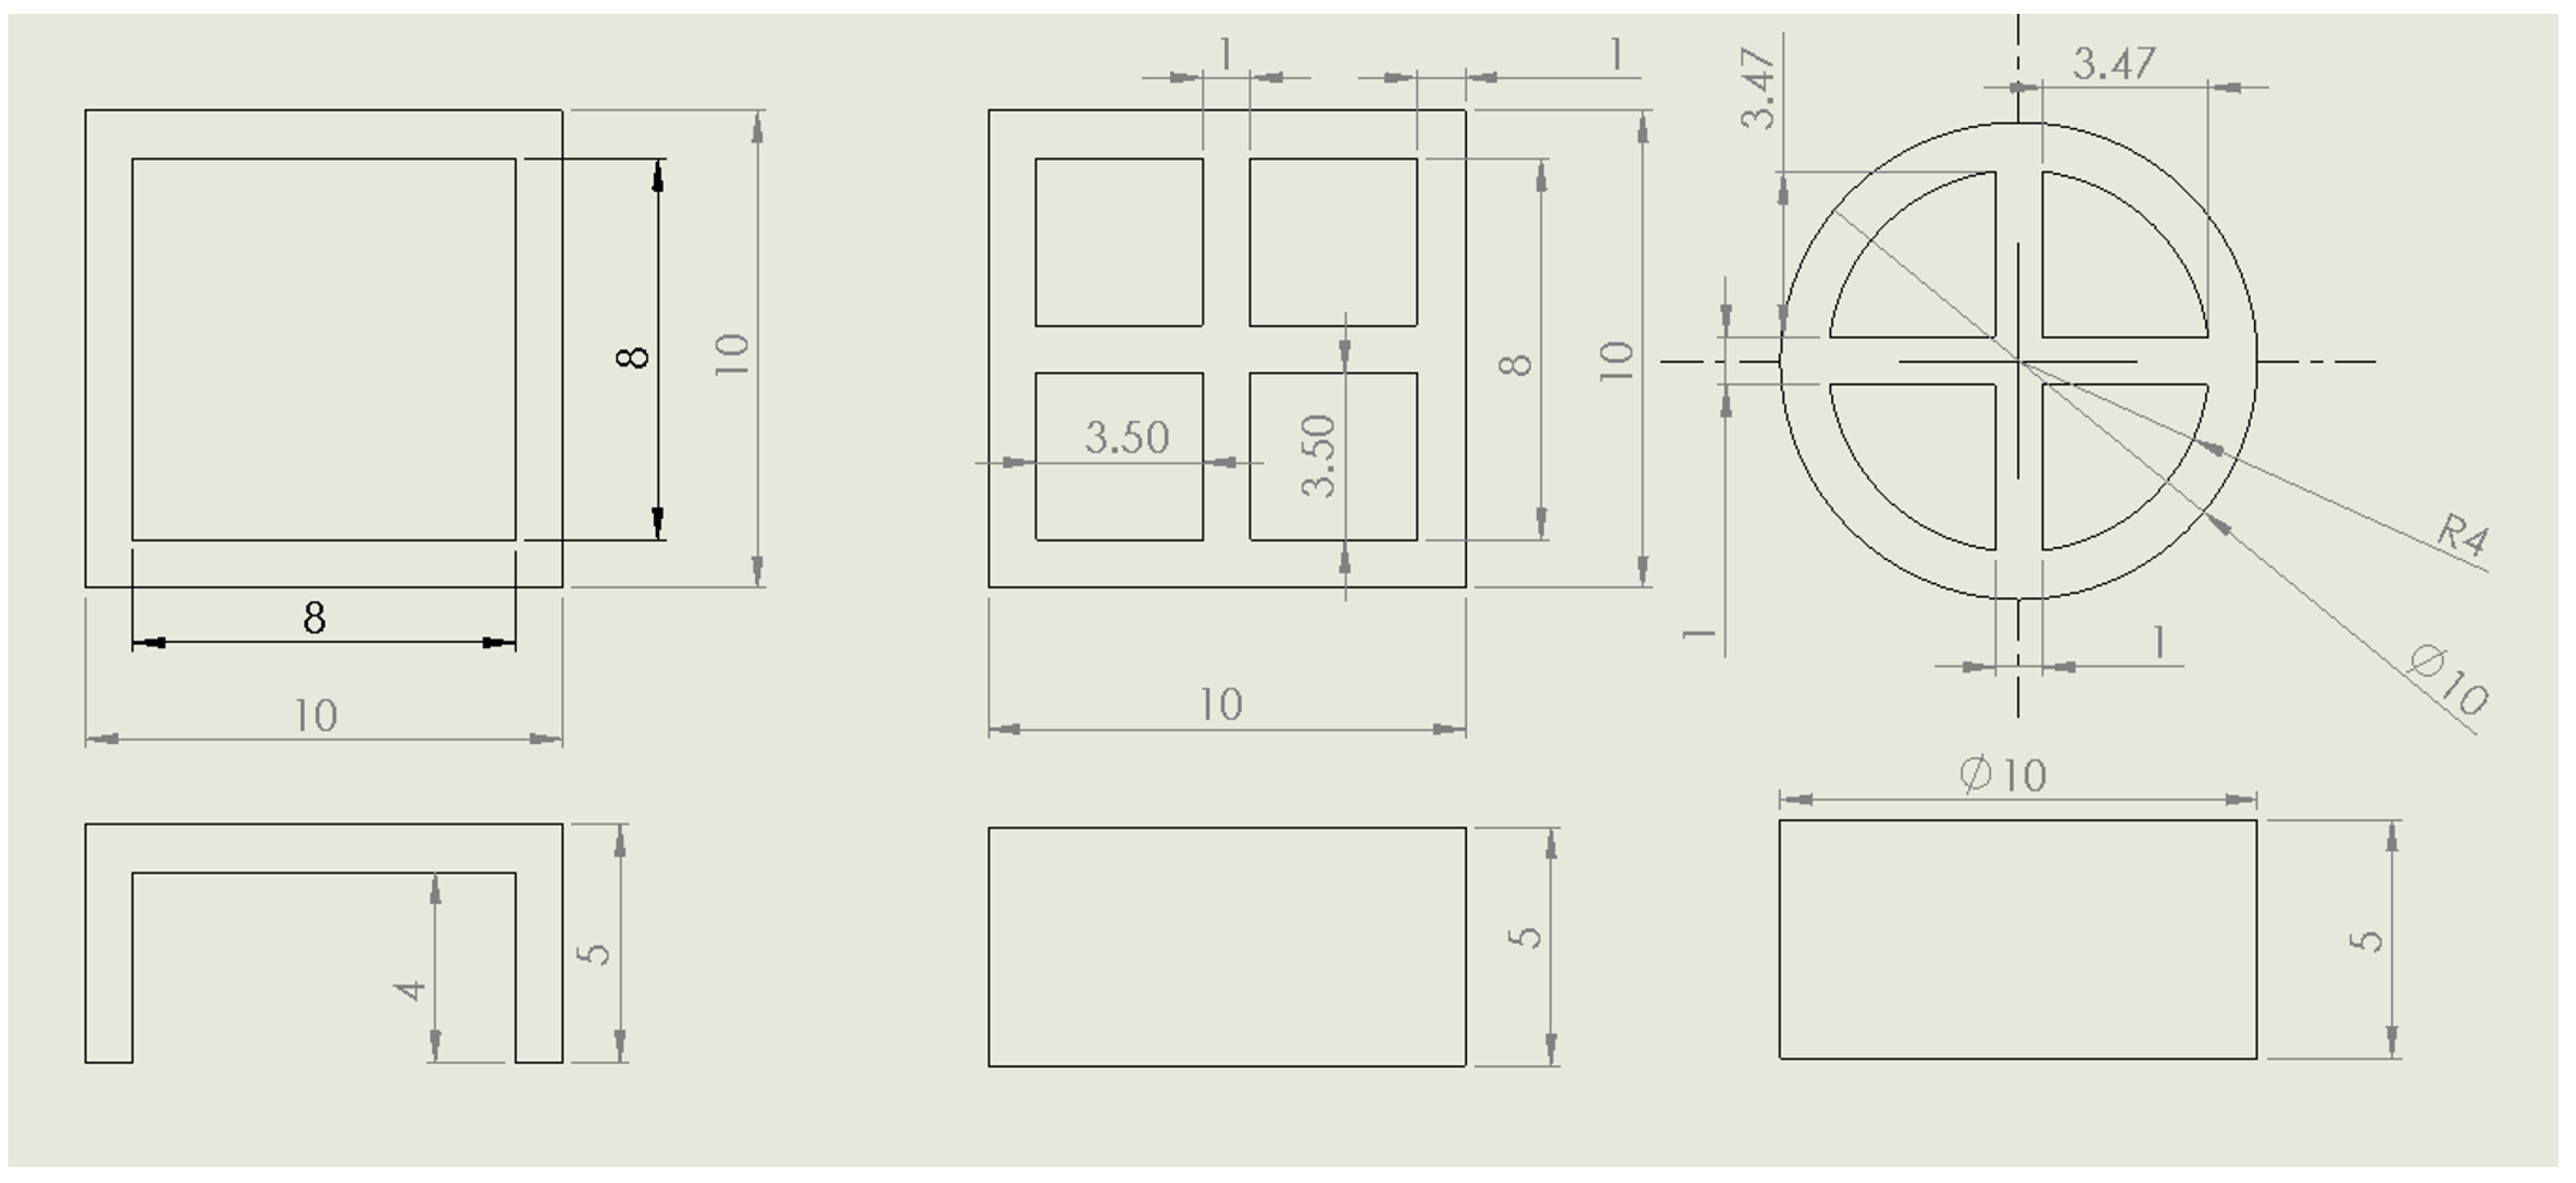
2.7. Print Analysis
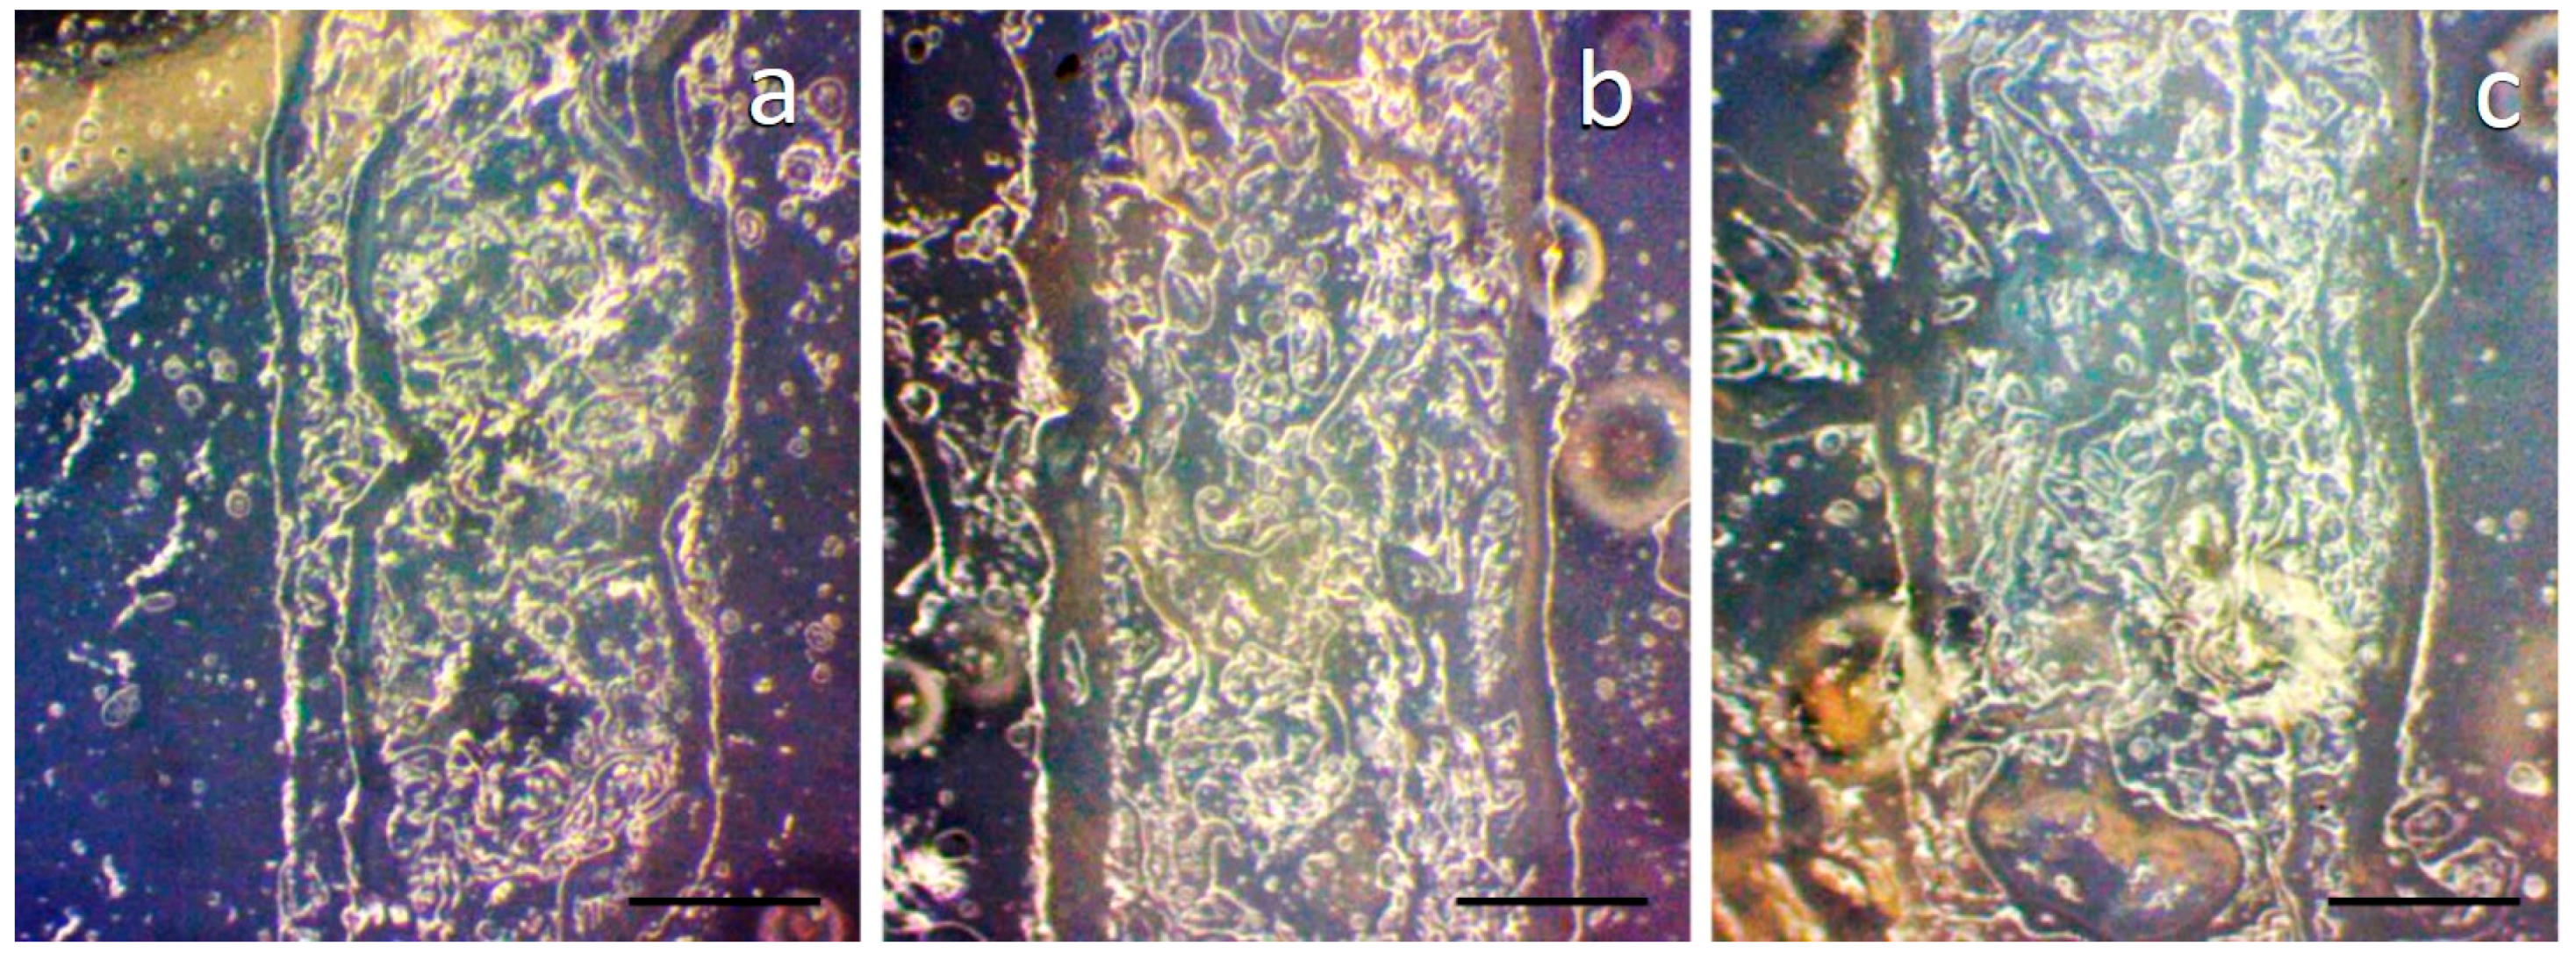
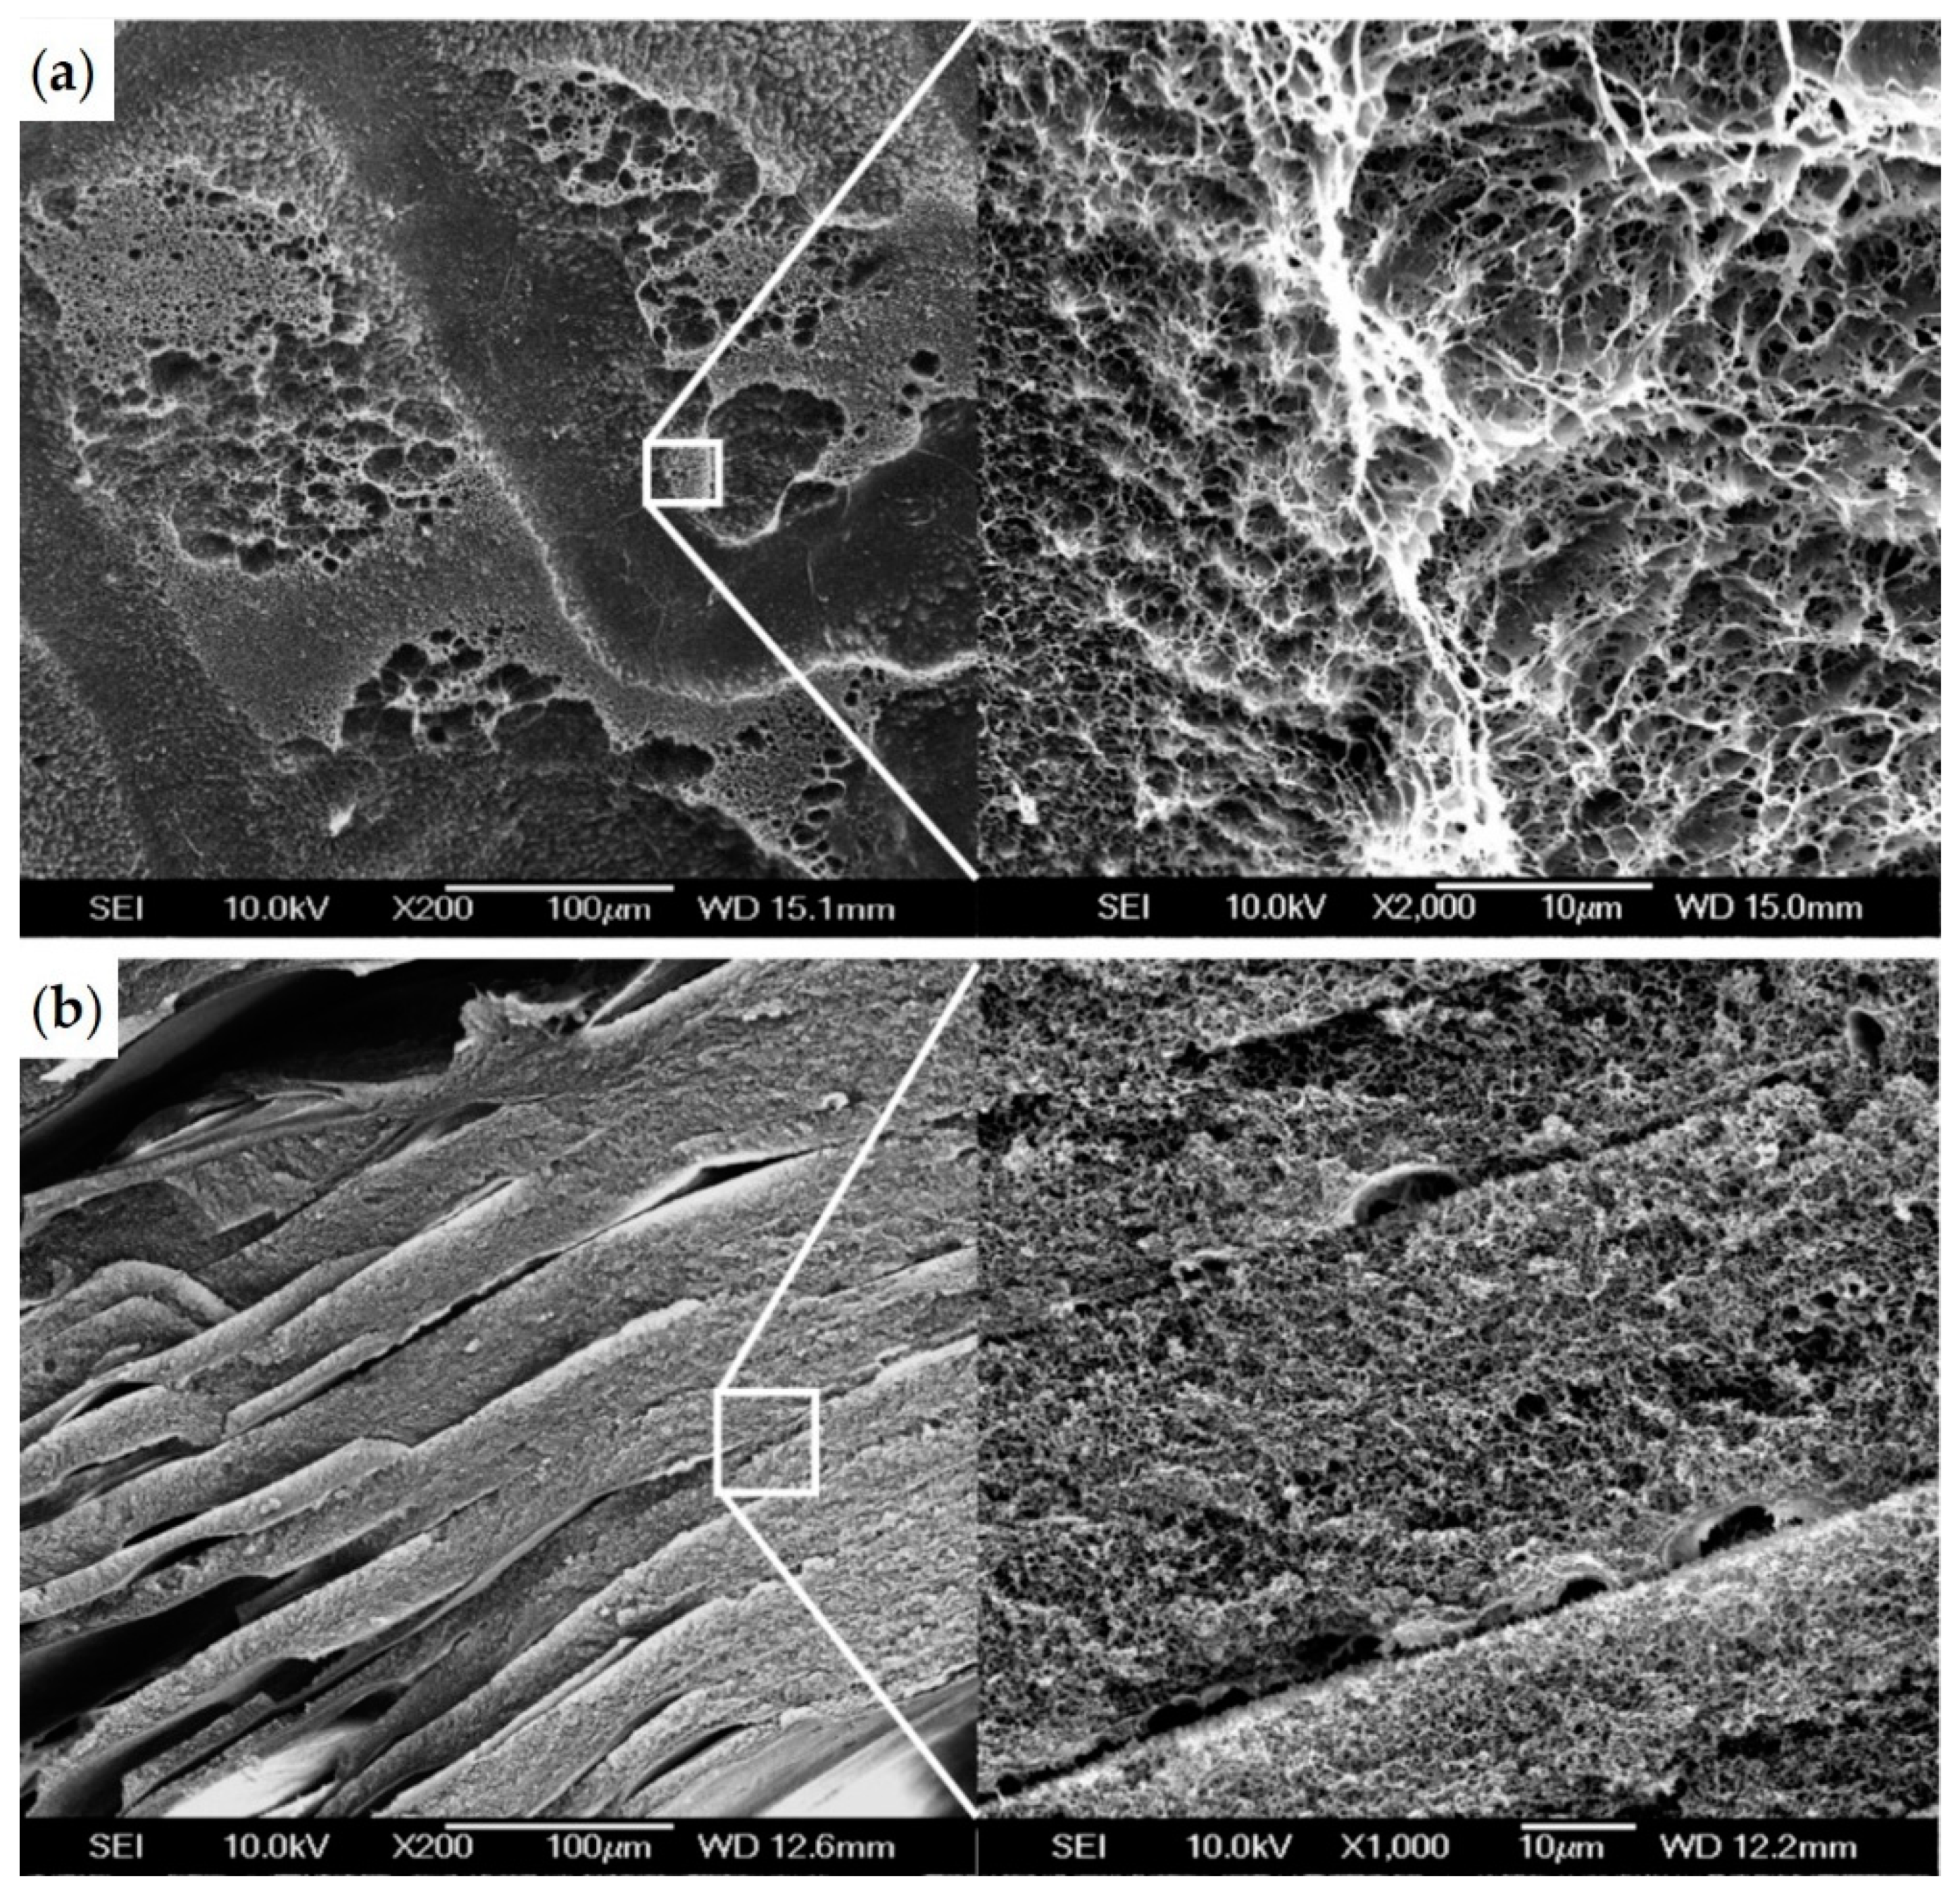
2.8. Field Emission Scanning Electron Microscopy
2.9. Theoretical Considerations of Laser Based Gelling
3. Results
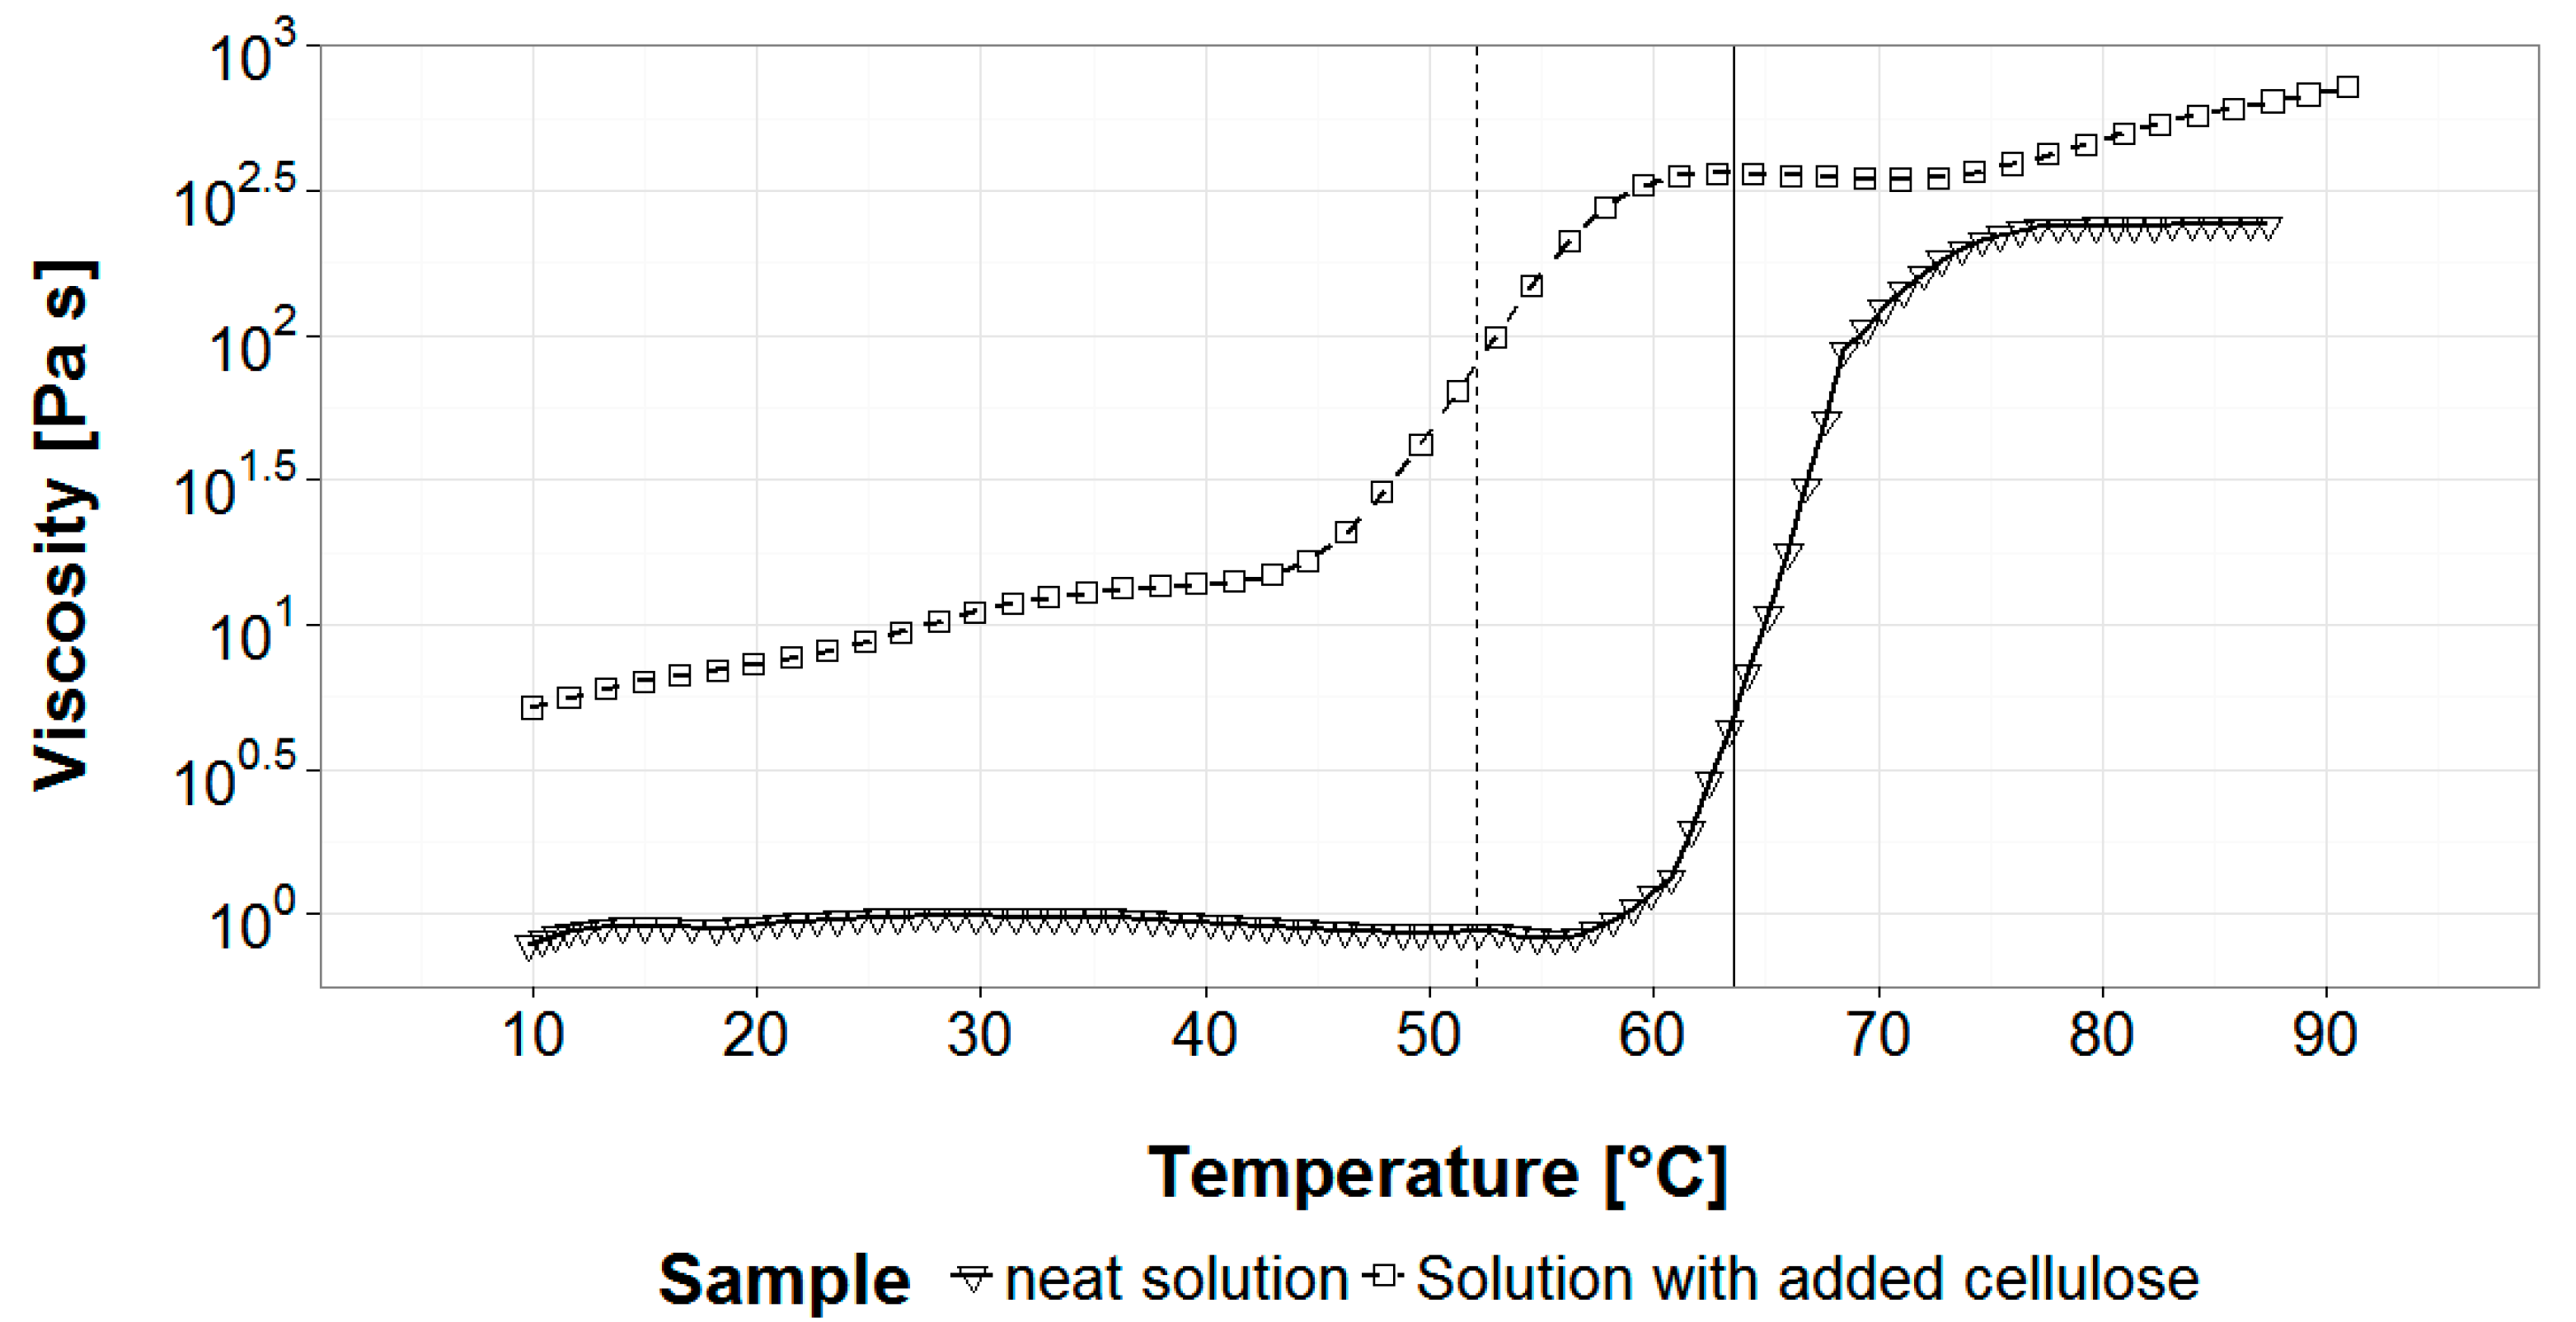
3.1. Gelation Temperature and Solution Viscosity
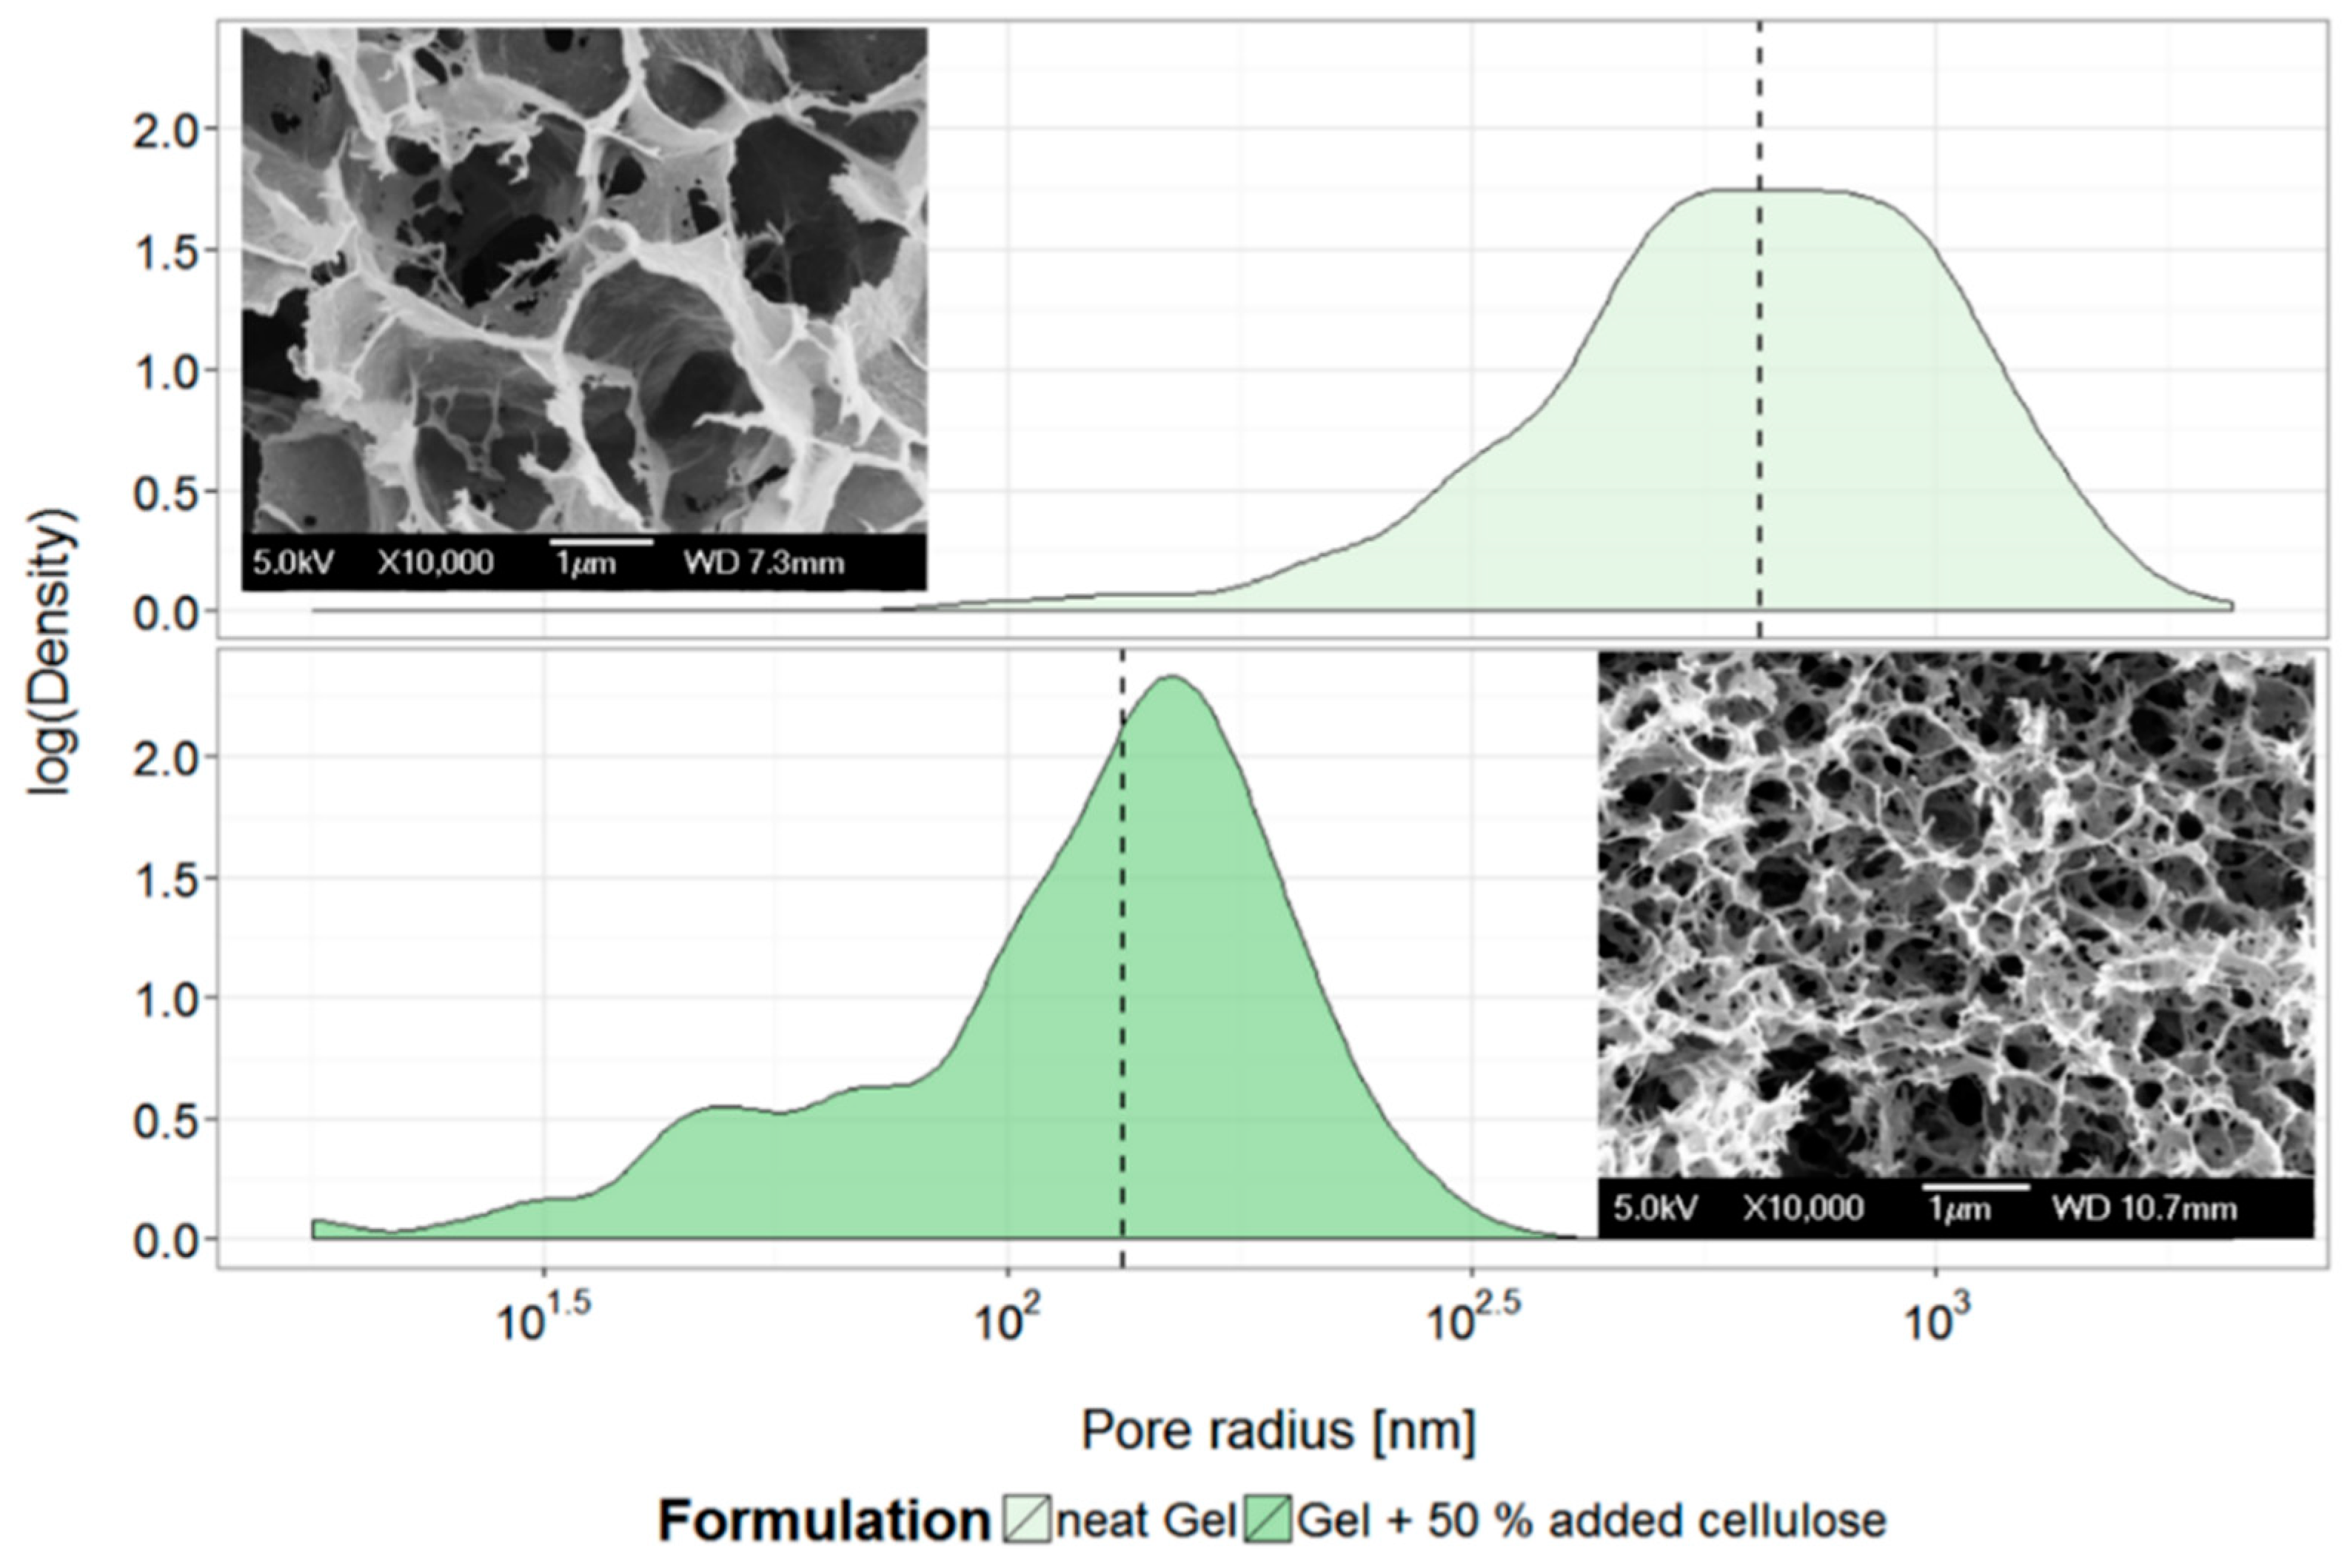
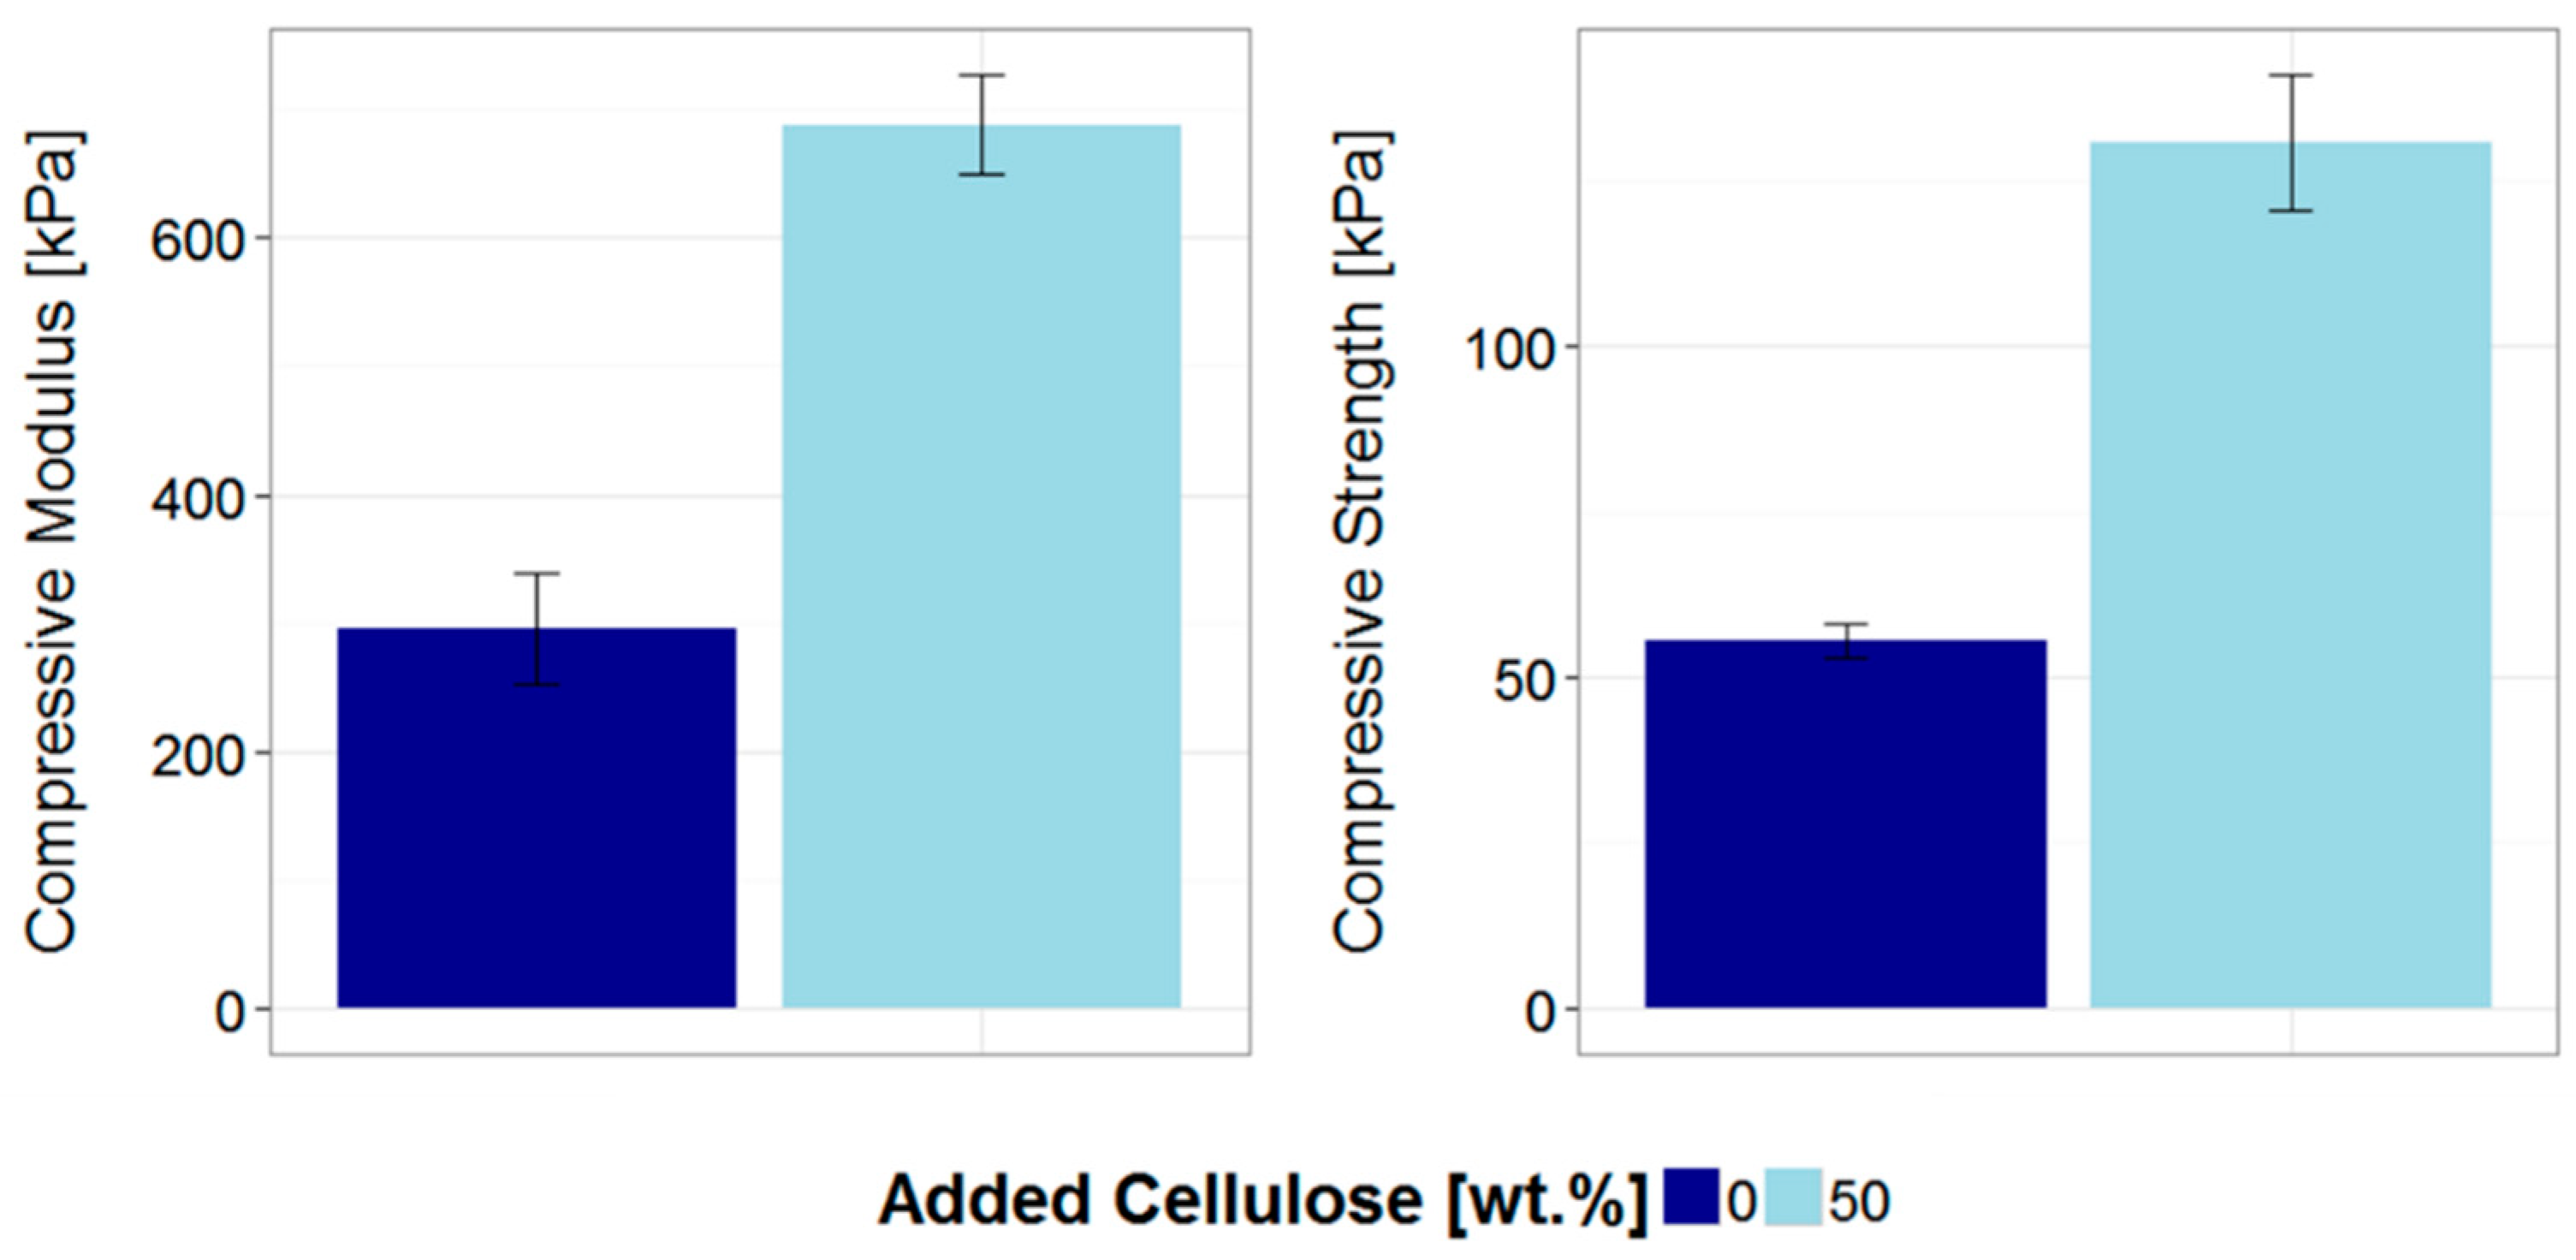
3.2. Gel Microstructure and Mechanical Properties
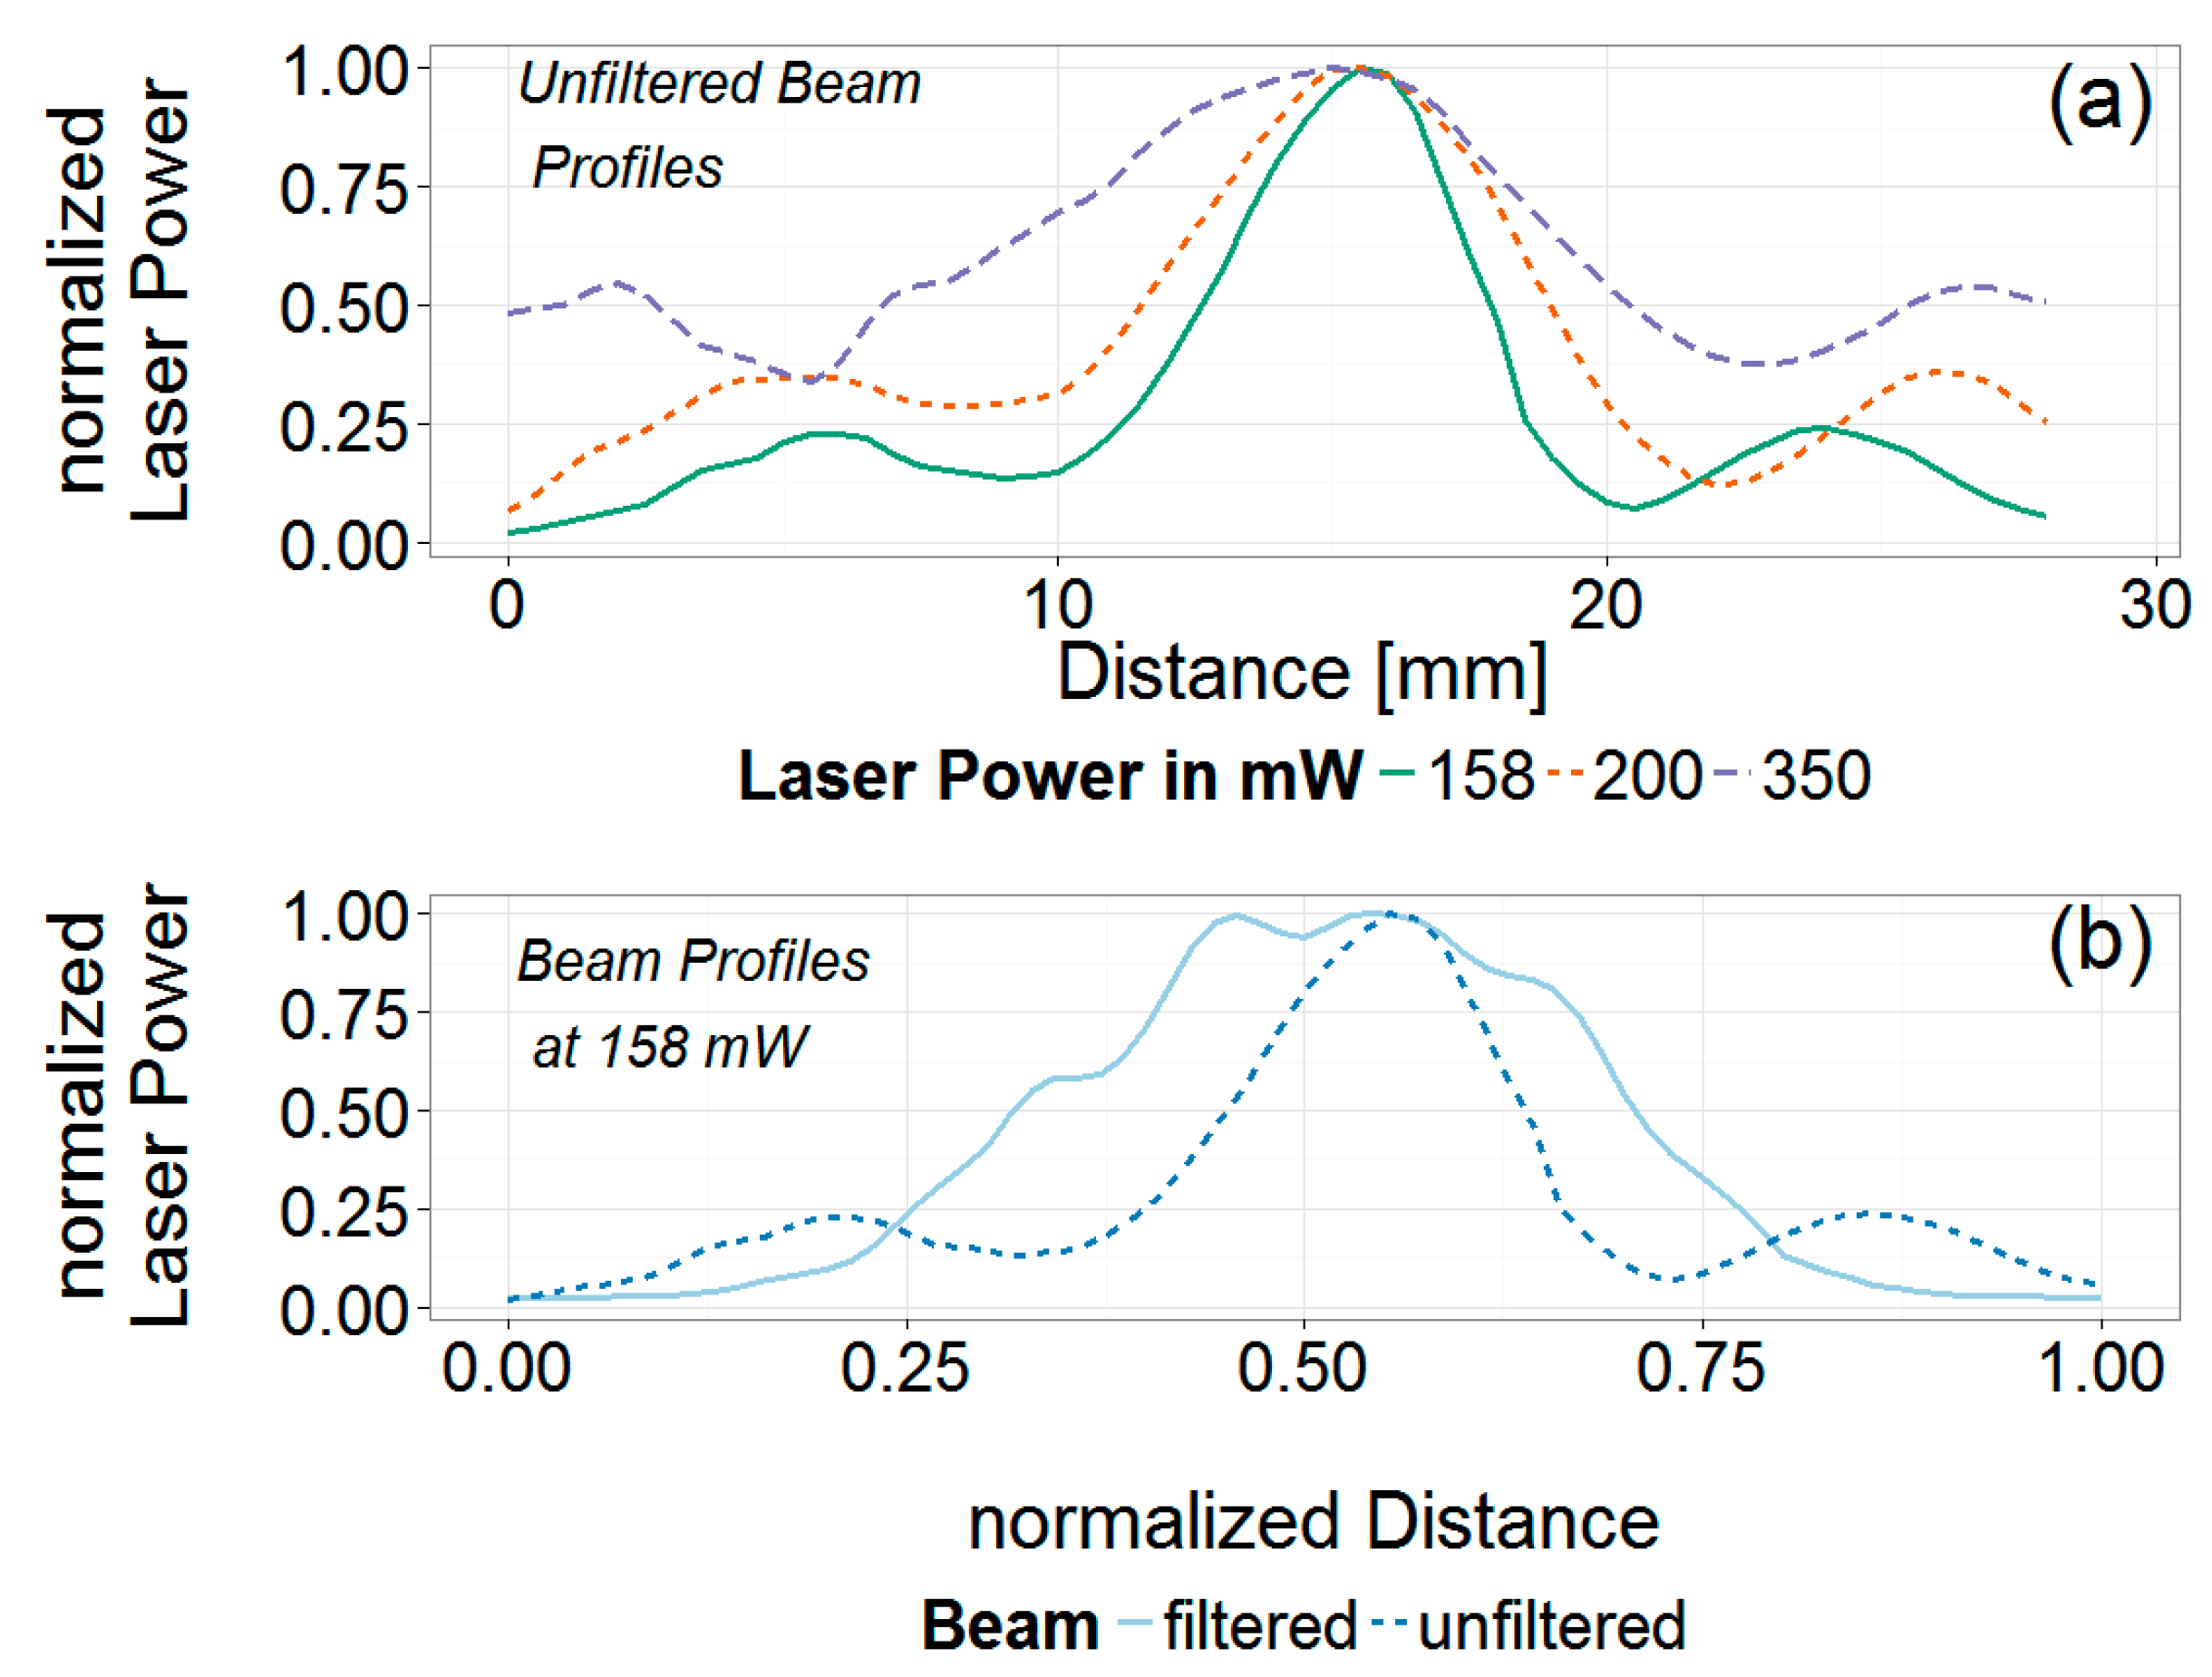
3.3. Analysis of the Laser Spatial Profile and Filtering
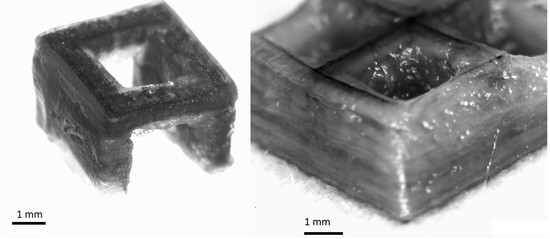
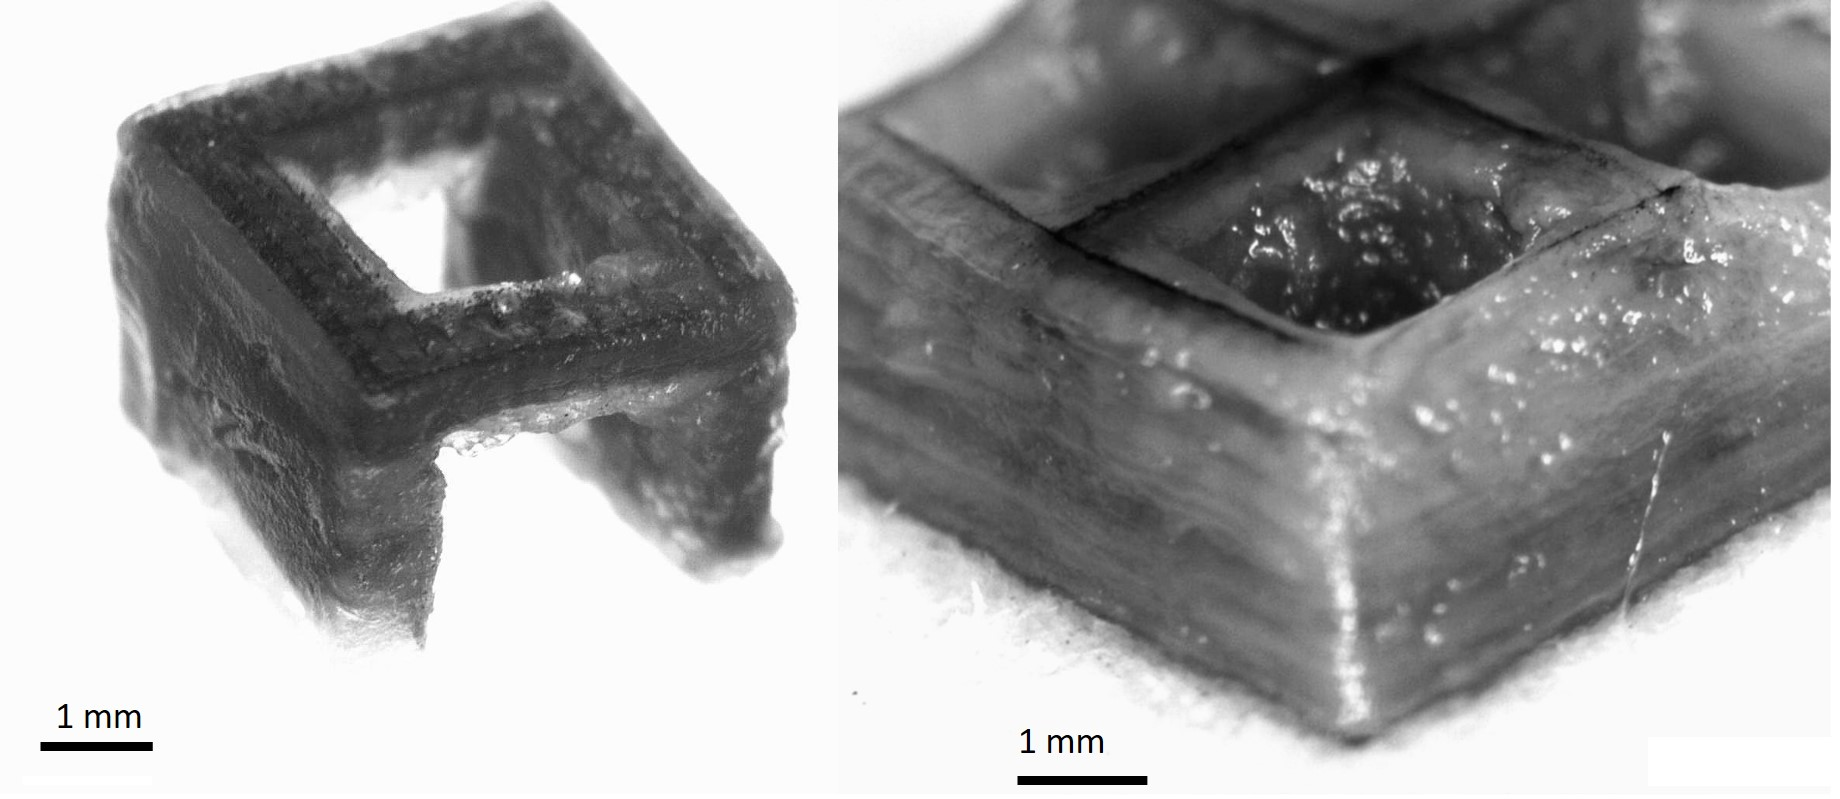
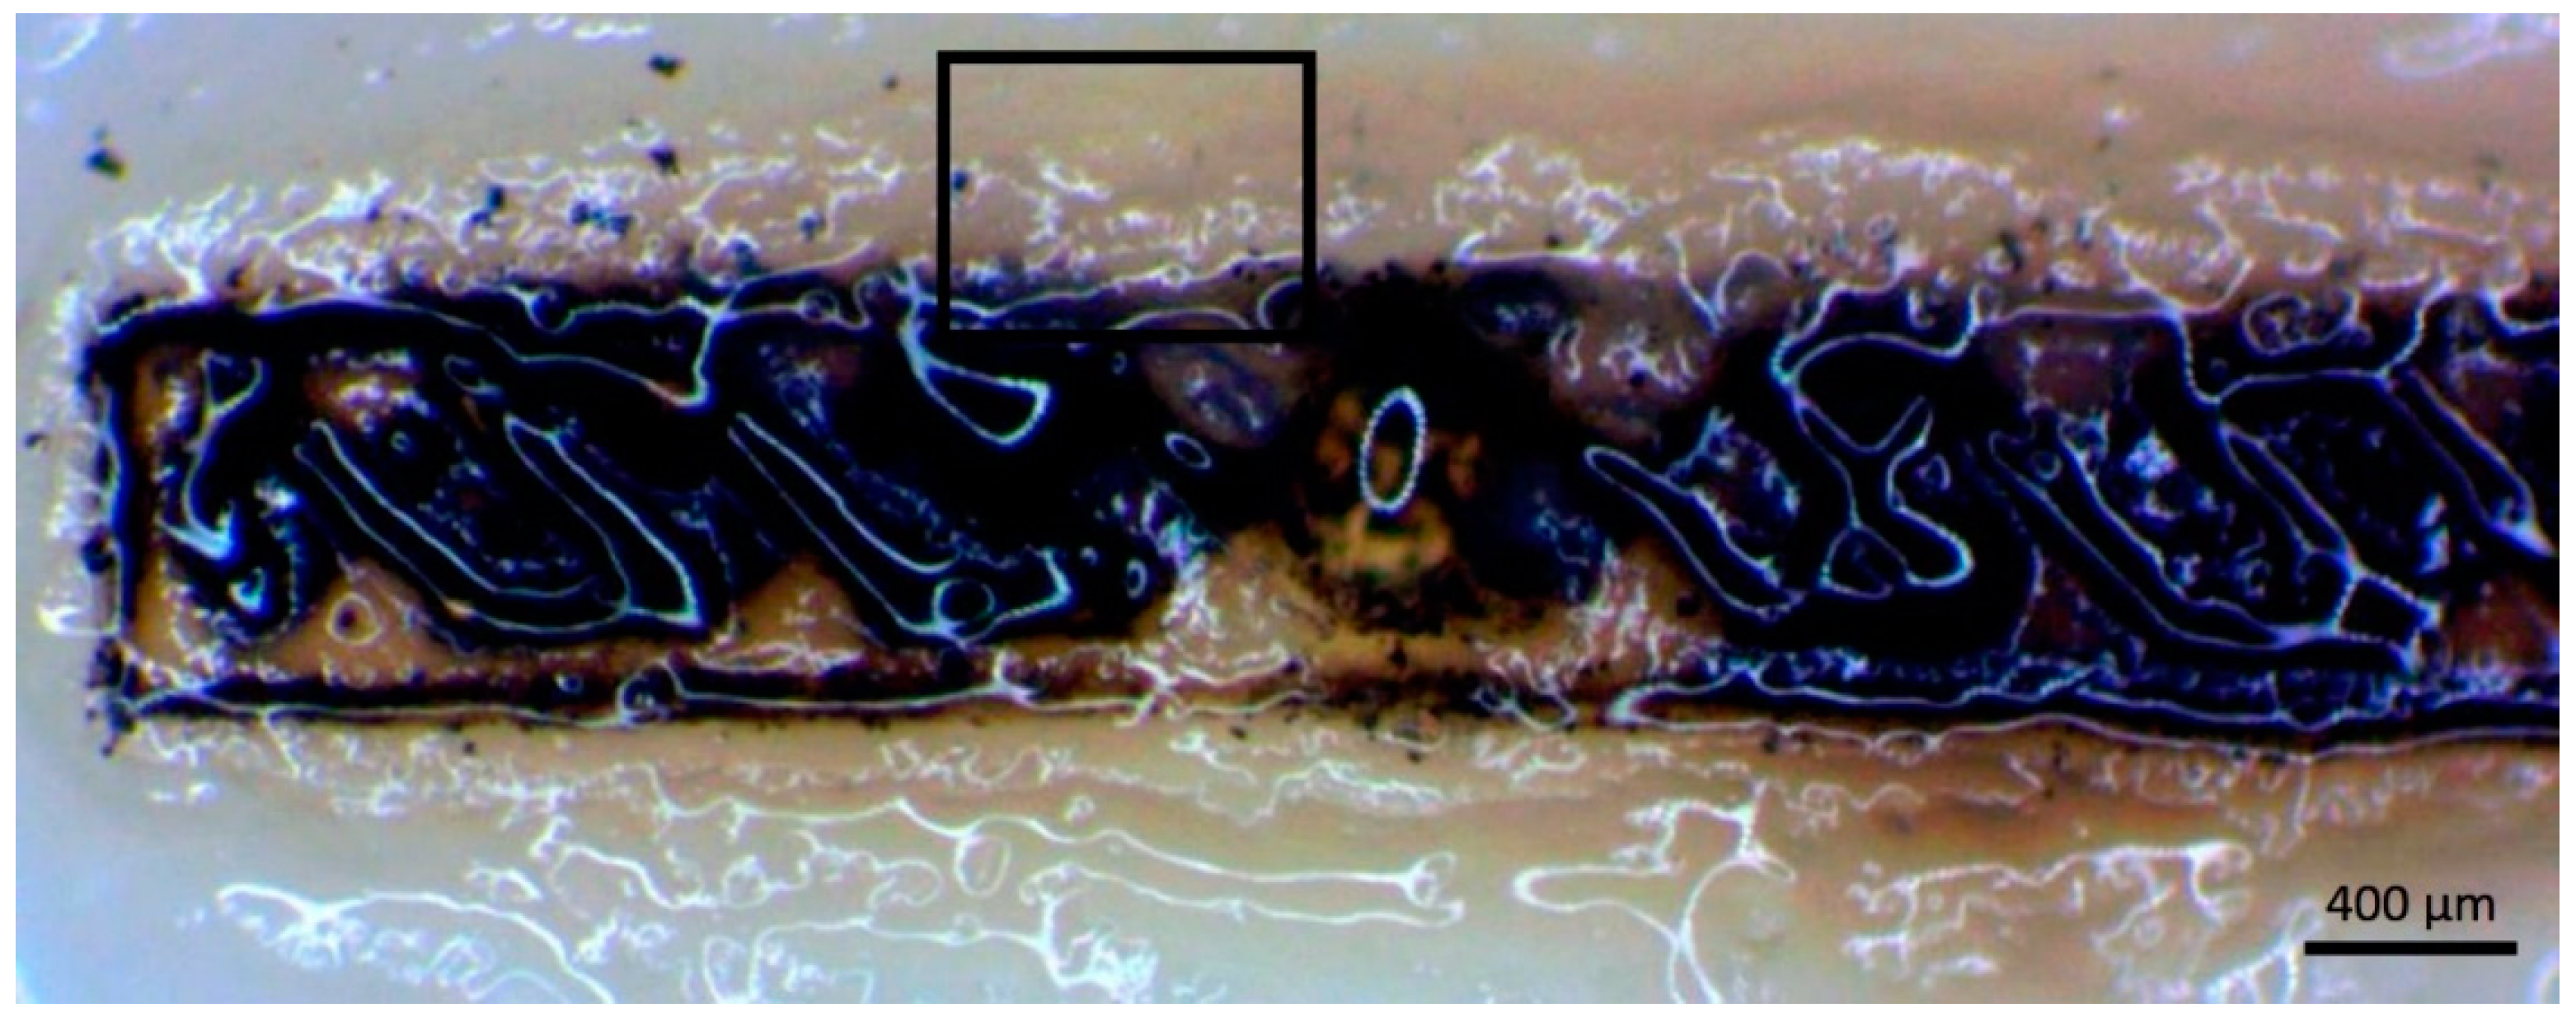
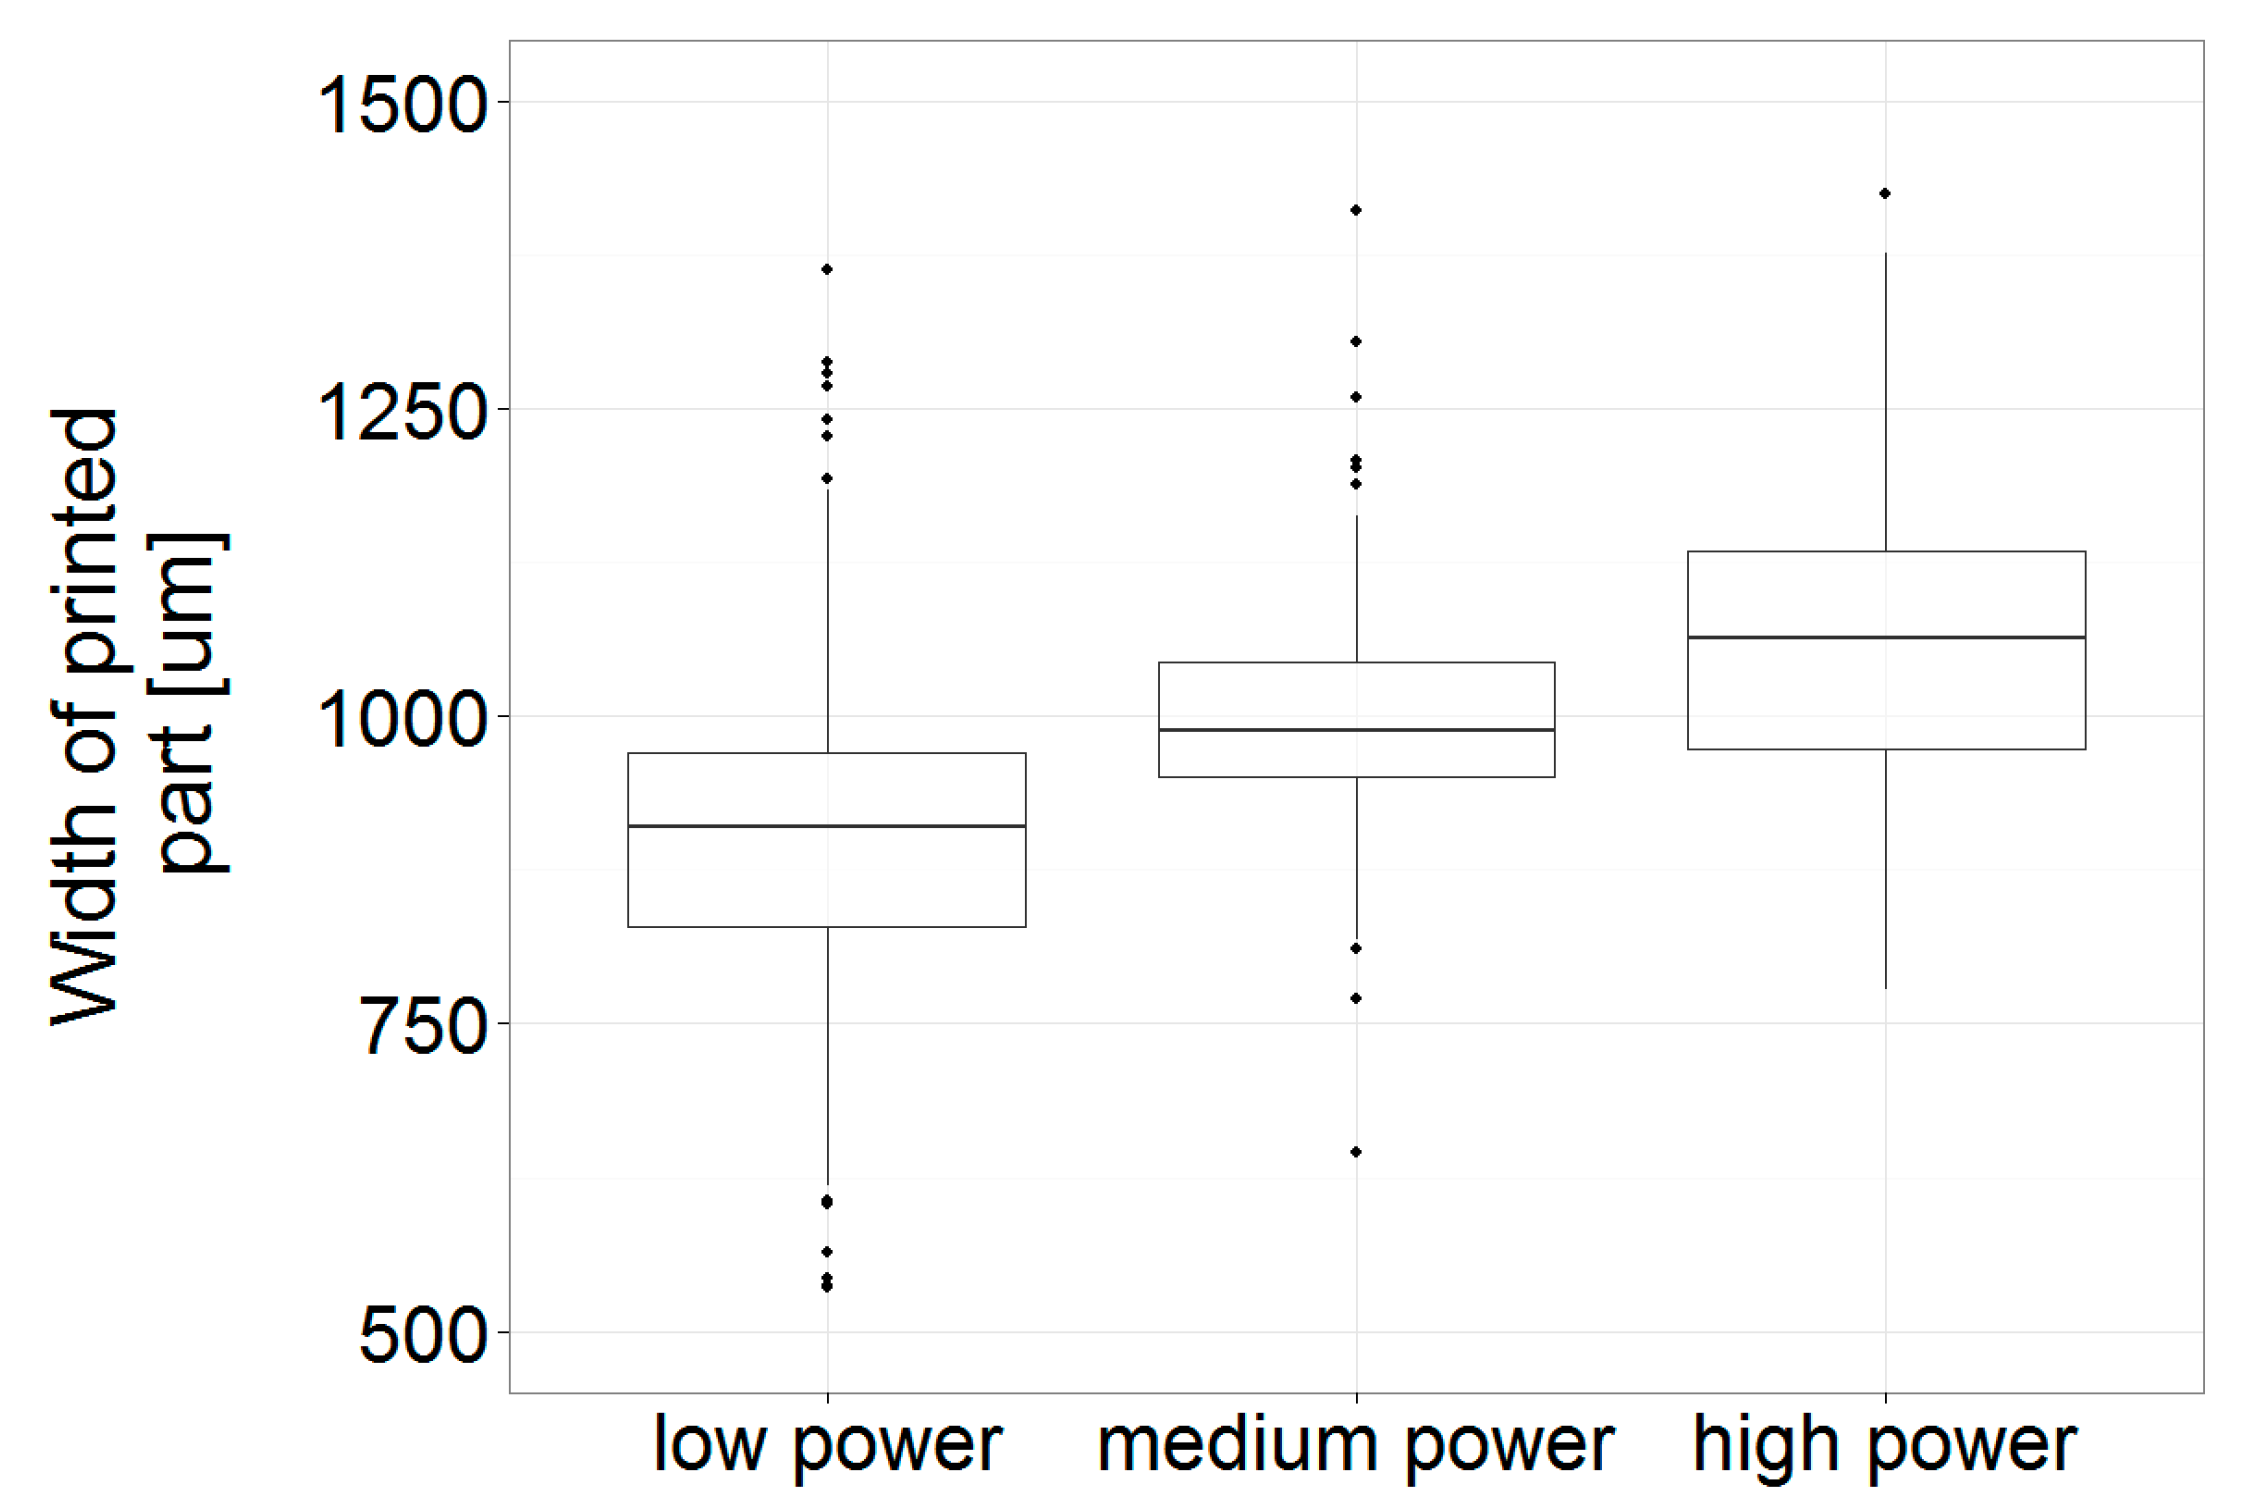
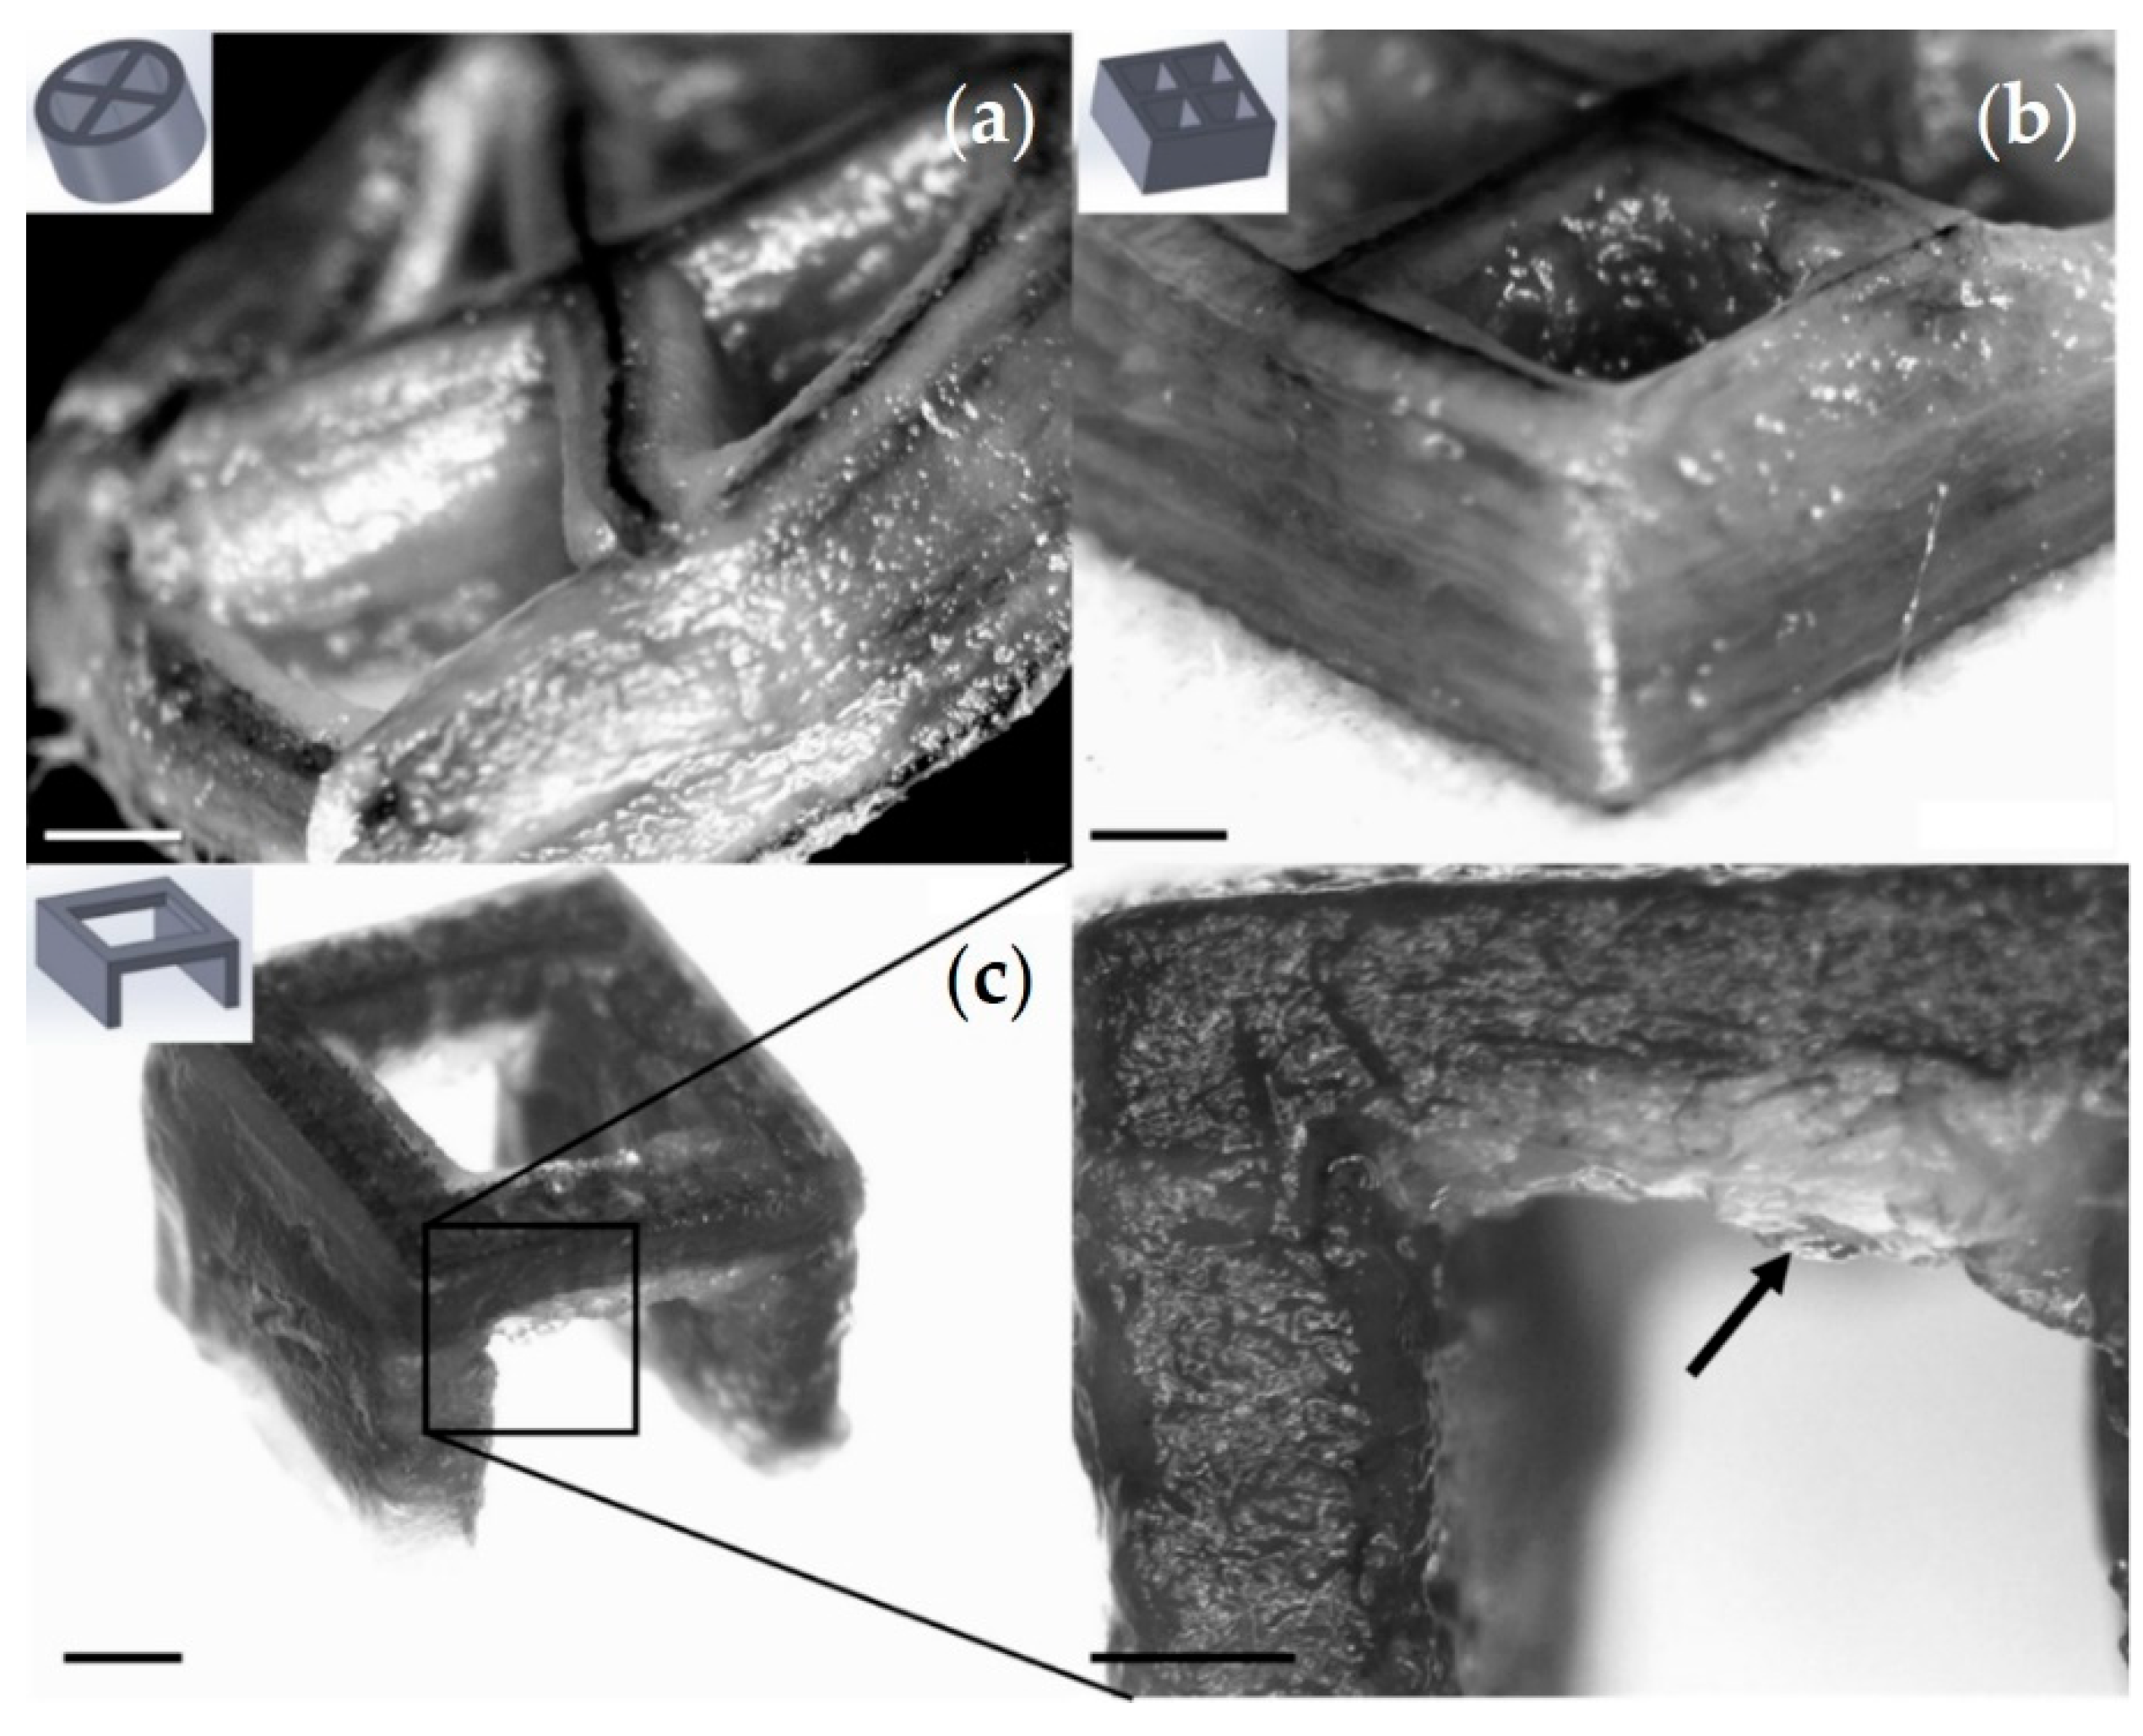
3.4. Print Analysis
4. Discussion
5. Conclusions
Supplementary Materials
Author Contributions
Acknowledgments
Conflicts of Interest
Appendix A
COMPONENTRY
- Arduino Mega2560 + RepRap Arduino Mega Pololu Shield, (RAMPS 1.4) Control boards
- ○
- The Funduino Mega2560 is a clone of the Arduino Mega 2560. It features an Atmel ATmega2560 processor. It has 54 digital input/output pins and 16 analog input pins. 14 of the output pins can be used as pulse width modulated (PWM) outputs.
- ○
- The R3 features a couple of improvements over the original 2560 and R2. The reset circuit has been improved and the USB communications is done with a 16U2 chip instead of the 8U2. There are also a few extra pins available.
- ○
- Sockets for up to 5 Pololu style stepper drive modules. X, Y, and Z axes and 2 extruders.
- ○
- 3 channels of temperature sensing using 100 k thermistors (not included) for heated bed, and 2 extruders.
- ○
- 3 channels of MOSFET switched output for controlling extruder heating, hot bed heating and cooling fan speed. Includes Heat sink for the heated bed MOSFET.
- NEMA 17 Stepper motors 58oz-in 0.9°/step:
- ○
- 2-phase with 4-wire bipolar windings.
- ○
- Shaft Diameter: 5 mm without flat face
- ○
- Step Angle: 0.9° (400 step/rev)
- ○
- Motor Length: 48 mm
- ○
- Rated Current: 1.7 Amps per phase
- ○
- Phase Resistance: 1.65 ohms
- ○
- Phase Inductance: 4 mH
- ○
- Holding Torque: 58 oz-in/41 N·cm/4.2 kg·cm
- ○
- Detent Torque: 220 g·cm
- ○
- Rotor Inertia: 68 g·cm2
- ○
- Weight: 358 g
- Stepper motor drivers: A4988 Pololu
- Servo Motor: Standard 6 V with Metal Gear-11 kg, for the wiper.
- Limit switch: Roller level miniature microswitch
- Thermistor: Thermistor EPCOS B57560G104F
- Connectors: Jumper 2, 3 and 4 pins Dupont 70 cm
- Power supply: Benchtop power supply 16 A 13.5 V VDC
- Regulated power supply: Powertech DC regulated power supply-MP3086
- Mechanical parts
- Linear shafts: Linear shaft 8 mm
- Linear bearing: Linear bearing Bush LM8UU
- Shaft support: SK8 shaft support for 8mm shaft
- Coupling: Flex coupling 5–8 mm
- Pulley: Pulley GT2 16, 20 tooth
- Belt: Timing belt GT2 6 mm black neoprene rubber
- Threated rod: M8 threated rod stainless steel (304)
- Openbeam: Profile 40 × 40 SlotPro Standard Extrusion, Autoline 1.0404.4.SPSS
- Laser
- ○
- Laser diode: Roithner Laser diode 450 nm, 1.6 W, ref: LD-450-1600MG
- ○
- Cage System
- ▪
- Vertical cage mount
- ▪
- Cage rods: 152.4 mm, 101.6 mm, 76.2 mm
- ▪
- 30 mm Cage plate
- ○
- Pinhole, 100 μm:
- ▪
- Bi-convex 50 mm lens:
- ▪
- Bi-convex 25.4 mm lens:
- ▪
- Bi-convex 75 mm lens
- ▪
- Bi-convex 150 mm lens
- ▪
- Threaded cage plate
- ▪
- Z-axisTranslation Mount, 30 mm Cage compatible
Wiring
- Servo motors wiring
- The servo motors are powered by an external 6 V power supply and controlled by plugging their signal wire onto the RAMPS (see the servo motor P0 & P1 on the RAMPS).
- P0 Servo motor controls the horizontal moves of the wiper and the P1 servo motor controls the lift of the wiper.


Sofware
- Repetier-Host Windows 2.0.5
- Marlin G-Code:Marlin Firmware runs on the 3D printer’s main board, managing all the real-time activities of the machine. It coordinates the heaters, steppers, sensors, lights, LCD display, buttons, and everything else involved in the 3D printing process.
- SlicingSlicer prepares a solid 3D model by dividing it up into thin slices (layers). In the process, it generates the G-code that tells the printer in minute detail how to reproduce the model.
CAD Models for Printing

References
- Sannino, A.; Demitri, C.; Madaghiele, M. Biodegradable cellulose-based hydrogels: Design and applications. Materials 2009, 2, 353–373. [Google Scholar] [CrossRef]
- Shen, X.; Shamshina, J.L.; Berton, P.; Gurau, G.; Rogers, R.D. Hydrogels based on cellulose and chitin: Fabrication, properties, and applications. Green Chem. 2016, 18, 53–75. [Google Scholar] [CrossRef]
- Wang, S.; Lu, A.; Zhang, L. Recent Advances in Regenerated Cellulose Materials. Prog. Polym. Sci. 2016, 53, 169–206. [Google Scholar] [CrossRef]
- Mahmoud Nasef, M.; El-Hefian, E.A.; Saalah, S.; Yahaya, A.H. Preparation and properties of non-crosslinked and ionically crosslinked chitosan/agar blended hydrogel films. J. Chem. 2011, 8, S409–S419. [Google Scholar] [CrossRef]
- Rodriguez, R.; Alvarez-Lorenzo, C.; Concheiro, A. Interactions of ibuprofen with cationic polysaccharides in aqueous dispersions and hydrogels: Rheological and diffusional implications. Eur. J. Pharm. Sci. 2003, 20, 429–438. [Google Scholar] [CrossRef] [PubMed]
- Song, H.; Luo, Z.; Zhao, H.; Luo, S.; Wu, X.; Gao, J.; Wang, Z. High tensile strength and high ionic conductivity bionanocomposite ionogels prepared by gelation of cellulose/ionic liquid solutions with nano-silica. RSC Adv. 2013, 3, 11665–11675. [Google Scholar] [CrossRef]
- Wang, T.; Turhan, M.; Gunasekaran, S. Selected properties of pH-sensitive, biodegradable chitosan-poly (vinyl alcohol) hydrogel. Polymer International. Polym. Int. 2004, 53, 911–918. [Google Scholar] [CrossRef]
- Billiet, T.; Vandenhaute, M.; Schelfhout, J.; Van Vlierberghe, S.; Dubruel, P. A review of trends and limitations in hydrogel-rapid prototyping for tissue engineering. Biomaterials 2012, 33, 6020–6041. [Google Scholar] [CrossRef] [PubMed]
- Sannino, A.; Pappada, S.; Madaghiele, M.; Maffezzoli, A.; Ambrosio, L.; Nicolais, L. Crosslinking of cellulose derivatives and hyaluronic acid with water-soluble carbodiimide. Polymer 2005, 46, 11206–11212. [Google Scholar] [CrossRef]
- Acikara, Ö.B. Ion-Exchange Chromatography and Its Applications. In Column Chromatography; Martin, D.F., Martin, B.B., Eds.; Intech: London, UK, 2013. [Google Scholar] [CrossRef] [Green Version]
- Luo, X.; Zhang, L. Creation of regenerated cellulose microspheres with diameter ranging from micron to millimeter for chromatography applications. J. Chromatogr. A 2010, 1217, 5922–5929. [Google Scholar] [CrossRef] [PubMed]
- Du, K.F.; Yan, M.; Wang, Q.Y.; Song, H. Preparation and characterization of novel macroporous cellulose beads regenerated from ionic liquid for fast chromatography. J. Chromatogr. A 2010, 1217, 1298–1304. [Google Scholar] [CrossRef] [PubMed]
- Fee, C.; Nawada, S.; Dimartino, S. 3D printed porous media columns with fine control of column packing morphology. J. Chromatogr. A 2014, 1333, 18–24. [Google Scholar] [CrossRef] [PubMed]
- Lee, J.Y.; Tan, W.S.; An, J.; Chua, C.K.; Tang, C.Y.; Fane, A.G.; Chong, T.H. The potential to enhance membrane module design with 3D printing technology. J. Membr. Sci. 2016, 499, 480–490. [Google Scholar] [CrossRef]
- Kosan, B.; Schwikal, K.; Meister, F. Solution states of cellulose in selected direct dissolution agents. Cellulose 2010, 17, 495–506. [Google Scholar] [CrossRef]
- Kim, G.; Son, J.; Park, S.; Kim, W. Hybrid process for fabricating 3D hierarchical scaffolds combining rapid prototyping and electrospinning. Macromol. Rapid Commun. 2008, 29, 1577–1581. [Google Scholar] [CrossRef]
- Kim, M.; Kim, G. 3D multi-layered fibrous cellulose structure using an electrohydrodynamic process for tissue engineering. J. Colloid Interf. Sci. 2015, 457, 180–187. [Google Scholar] [CrossRef] [PubMed]
- Pattinson, S.W.; Hart, A.J. Additive Manufacturing of Cellulosic Materials with Robust Mechanics and Antimicrobial Functionality. Adv. Mater. Technol. 2017, 2. [Google Scholar] [CrossRef]
- Li, L.; Zhu, Y.; Yang, J. 3D Bioprinting of Cellulose with Controlled Porous Structures from NMMO. Mater. Lett. 2018, 210, 136–138. [Google Scholar] [CrossRef]
- Markstedt, K.; Escalante, A.; Toriz, G.; Gatenholm, P. Biomimetic Inks Based on Cellulose Nanofibrils and Cross-Linkable Xylans for 3D Printing. ACS Appl. Mater. Interf. 2017, 9, 40878–40886. [Google Scholar] [CrossRef] [PubMed]
- Palaganas, N.B.; Mangadlao, J.D.; de Leon, A.C.C.; Palaganas, J.O.; Pangilinan, K.D.; Lee, Y.J.; Advincula, R.C. 3D Printing of Photocurable Cellulose Nanocrystal Composite for Fabrication of Complex Architectures via Stereolithography. ACS Appl. Mater. Interf. 2017, 9, 34314–34324. [Google Scholar] [CrossRef] [PubMed]
- Tenhunen, T.-M.; Moslemian, O.; Kammiovirta, K.; Harlin, A.; Kääriäinen, P.; Österberg, M.; Tammelin, T.; Orelma, H. Surface tailoring and design-driven prototyping of fabrics with 3D-printing: An all-cellulose approach. Mater. Des. 2018, 140, 409–419. [Google Scholar] [CrossRef]
- Chua, C.K.; Yeong, W.Y.; An, J. Special Issue: NextGen Materials for 3D Printing. Materials 2018, 11, 555. [Google Scholar] [CrossRef] [PubMed]
- Muzzarelli, R.A.; Boudrant, J.; Meyer, D.; Manno, N.; DeMarchis, M.; Paoletti, M.G. Current views on fungal chitin/chitosan, human chitinases, food preservation, glucans, pectins and inulin: A tribute to Henri Braconnot, precursor of the carbohydrate polymers science, on the chitin bicentennial. Carbohydr. Polym. 2012, 87, 995–1012. [Google Scholar] [CrossRef]
- Geckil, H.; Xu, F.; Zhang, X.; Moon, S.; Demirci, U. Engineering hydrogels as extracellular matrix mimics. Nanomedicine. Future Med. 2010, 5, 469–484. [Google Scholar]
- Li, R.; Wang, S.; Lu, A.; Zhang, L. Dissolution of cellulose from different sources in an NaOH/urea aqueous system at low temperature. Cellulose 2015, 22, 339–349. [Google Scholar] [CrossRef]
- Qin, X.; Lu, A.; Zhang, L. Gelation behavior of cellulose in NaOH/urea aqueous system via cross-linking. Cellulose 2013, 20, 1669–1677. [Google Scholar] [CrossRef]
- Cai, J.; Zhang, L. Unique gelation behavior of cellulose in NaOH/urea aqueous solution. Biomacromolecules 2006, 7, 183–189. [Google Scholar] [CrossRef] [PubMed]
- Jin, H.; Zha, C.; Gu, L. Direct dissolution of cellulose in NaOH/thiourea/urea aqueous solution. Carbohydr. Res. 2007, 342, 851–858. [Google Scholar] [CrossRef] [PubMed]
- Wang, Y.; Chen, L. Impacts of nanowhisker on formation kinetics and properties of all-cellulose composite gels. Carbohydr. Polym. 2011, 83, 1937–1946. [Google Scholar] [CrossRef]
- Loth, F.; Philipp, B. The macroporous network of “bead cellulose” and its response to crosslinking with epichlorohydrin. Makromol. Chem. Macromol. Symp. 1989, 30, 273–287. [Google Scholar] [CrossRef]
- Isobe, N.; Sekine, M.; Kimura, S.; Wada, M.; Kuga, S. Anomalous reinforcing effects in cellulose gel-based polymeric nanocomposites. Cellulose 2011, 18, 327–333. [Google Scholar] [CrossRef]
- Abdelaal, O.A.; Darwish, S.M. Review of rapid prototyping techniques for tissue engineering scaffolds fabrication. In Characterization and Development of Biosystems and Biomaterials; Springer: Berlin, Germany, 2013; pp. 33–54. [Google Scholar]
- Sun, J.; Zhou, W.; Huang, D.; Fuh, J.Y.; Hong, G.S. An overview of 3D printing technologies for food fabrication. Food Bioprocess Technol. 2015, 8, 1605–1615. [Google Scholar] [CrossRef]
- Kwan, J.G. Design of Electronics for a High-Resolution, Multi-Material, and Modular 3D Printer. Ph.D. Thesis, Massachusetts Institute of Technology, Cambridge, MA, USA, 2013. [Google Scholar]
- Brown, M.S.; Arnold, C.B. Fundamentals of laser-material interaction and application to multiscale surface modification. In Laser Precision Microfabrication; Springer: Berlin, Germany, 2010; pp. 91–120. [Google Scholar]
- Qin, X.; Lu, A.; Cai, J.; Zhang, L. Stability of inclusion complex formed by cellulose in NaOH/urea aqueous solution at low temperature. Carbohydr. Polym. 2013, 92, 1315–1320. [Google Scholar] [CrossRef] [PubMed]
- Huber, T.; Starling, K.; Cen, W.S.; Fee, C.; Dimartino, S. Effect of Urea Concentration on the Viscosity and Thermal Stability of Aqueous NaOH/Urea Cellulose Solutions. J. Polym. 2016, 2016. [Google Scholar] [CrossRef]
- Han, D.; Yan, L. Preparation of all-cellulose composite by selective dissolving of cellulose surface in PEG/NaOH aqueous solution. Carbohydr. Polym. 2010, 79, 614–619. [Google Scholar] [CrossRef]
- Ruan, D.; Lue, A.; Zhang, L. Gelation behaviors of cellulose solution dissolved in aqueous NaOH/thiourea at low temperature. Polymer 2008, 49, 1027–1036. [Google Scholar] [CrossRef]
- Zhang, L.; Ruan, D.; Gao, S. Dissolution and regeneration of cellulose in NaOH/thiourea aqueous solution. J. Polym. Sci. Part B Polym. Phys. 2002, 40, 1521–1529. [Google Scholar] [CrossRef]
- Hoepfner, S.; Ratke, L.; Milow, B. Synthesis and characterisation of nanofibrillar cellulose aerogels. Cellulose 2008, 15, 121–129. [Google Scholar] [CrossRef]
- Yang, J.; Han, C.; Xu, F.; Sun, R. Simple approach to reinforce hydrogels with cellulose nanocrystals. Nanoscale 2014, 6, 5934–5943. [Google Scholar] [CrossRef] [PubMed]
- Huber, T.; Müssig, J.; Curnow, O.; Pang, S.; Bickerton, S.; Staiger, M.P. A critical review of all-cellulose composites. J. Mater. Sci. 2012, 47, 1171–1186. [Google Scholar] [CrossRef]
- Di Martino, A.; Sittinger, M.; Risbud, M.V. Chitosan: a versatile biopolymer for orthopaedic tissue-engineering. Biomaterials 2005, 26, 5983–5990. [Google Scholar] [CrossRef] [PubMed]
- Kuo, C.K.; Ma, P.X. Ionically crosslinked alginate hydrogels as scaffolds for tissue engineering: Part 1. Structure, gelation rate and mechanical properties. Biomaterials 2001, 22, 511–521. [Google Scholar] [CrossRef]
- Lohfeld, S.; Tyndyk, M.; Cahill, S.; Flaherty, N.; Barron, V.; McHugh, P. A method to fabricate small features on scaffolds for tissue engineering via selective laser sintering. J. Biomed. Sci. Eng. 2010, 3, 138. [Google Scholar] [CrossRef]
- Wang, X.; Laoui, T.; Bonse, J.; Kruth, J.-P.; Lauwers, B.; Froyen, L. Direct selective laser sintering of hard metal powders: experimental study and simulation. Int. J. Adv. Manuf. Technol. 2002, 19, 351–357. [Google Scholar] [CrossRef]
- Li, V.C.-F.; Dunn, C.K.; Zhang, Z.; Deng, Y.; Qi, H.J. Direct Ink Write (DIW) 3D Printed Cellulose Nanocrystal Aerogel Structures. Sci. Rep. 2017, 7, 8018. [Google Scholar] [CrossRef] [PubMed]
- Kimura, M.; Shinohara, Y.; Takizawa, J.; Ren, S.; Sagisaka, K.; Lin, Y.; Hattori, Y.; Hinestroza, J.P. Versatile Molding Process for Tough Cellulose Hydrogel Materials. Sci. Rep. 2015, 5, 16266. [Google Scholar] [CrossRef] [PubMed] [Green Version]
- Sultan, S.; Mathew, A.P. 3D printed scaffolds with gradient porosity based on a cellulose nanocrystal hydrogel. Nanoscale 2018, 10, 4421–4431. [Google Scholar] [CrossRef] [PubMed]
- Leppiniemi, J.; Lahtinen, P.; Paajanen, A.; Mahlberg, R.; Metsä-Kortelainen, S.; Pinomaa, T.; Pajari, H.; Vikholm-Lundin, I.; Pursula, P.; Hytönen, V.P. 3D-Printable Bioactivated Nanocellulose-Alginate Hydrogels. ACS Appl. Mater. Interfaces 2017, 9, 21959–21970. [Google Scholar] [CrossRef] [PubMed]


© 2018 by the authors. Licensee MDPI, Basel, Switzerland. This article is an open access article distributed under the terms and conditions of the Creative Commons Attribution (CC BY) license (http://creativecommons.org/licenses/by/4.0/).
Share and Cite
Huber, T.; Clucas, D.; Vilmay, M.; Pupkes, B.; Stuart, J.; Dimartino, S.; Fee, C. 3D Printing Cellulose Hydrogels Using LASER Induced Thermal Gelation. J. Manuf. Mater. Process. 2018, 2, 42. https://doi.org/10.3390/jmmp2030042
Huber T, Clucas D, Vilmay M, Pupkes B, Stuart J, Dimartino S, Fee C. 3D Printing Cellulose Hydrogels Using LASER Induced Thermal Gelation. Journal of Manufacturing and Materials Processing. 2018; 2(3):42. https://doi.org/10.3390/jmmp2030042
Chicago/Turabian StyleHuber, Tim, Don Clucas, Mathieu Vilmay, Birte Pupkes, James Stuart, Simone Dimartino, and Conan Fee. 2018. "3D Printing Cellulose Hydrogels Using LASER Induced Thermal Gelation" Journal of Manufacturing and Materials Processing 2, no. 3: 42. https://doi.org/10.3390/jmmp2030042