Abstract
This paper describes the collection of a large dataset (6930 measurements) on dimensional error in the fused deposition modeling (FDM) additive manufacturing process for full-density parts. Three different print orientations were studied, as well as seven raster angles (, , , , , , and ) for the rectilinear infill pattern. All measurements were replicated ten times on ten different samples to ensure a comprehensive dataset. Eleven polymer materials were considered: acrylonitrile butadiene styrene (ABS), polylactic acid (PLA), high-temperature PLA, wood-composite PLA, carbon-fiber-composite PLA, copper-composite PLA, aluminum-composite PLA, high-impact polystyrene (HIPS), polyethylene terephthalate glycol-enhanced (PETG), polycarbonate, and synthetic polyamide (nylon). The samples were ASTM-standard impact-testing samples, since this geometry allows the measurement of error on three different scales; the nominal dimensions were mm thick, mm long, and mm wide. This dataset is intended to give engineers and product designers a basis for judging the accuracy and repeatability of the FDM process for use in manufacturing of end-user products.
Dataset: Attached with manuscript
Dataset License: CC-BY
1. Introduction
The sustainability of manufacturing processes has been a topic of much discussion in recent years, especially with the rise of “mass customization” culture. Manufacturing one-off end-user products with traditional processes, many of which were refined for mass-production, can be very expensive and wasteful of energy and resources. The emergence of “additive manufacturing” (AM) technologies has promised to mitigate this to a large degree, as waste can be minimized, energy consumption is relatively low, and the production of specialized tooling is mostly eliminated [1,2,3,4]. Questions remain about the maturity of the technology, but it is becoming increasingly feasible to use AM as an end-user manufacturing process for in some industries. With this in mind, it is increasingly important to consider the impact of their use on engineering design methods. In contrast with more traditional subtractive and formative processes, AM produces geometry by depositing the raw material in layers and fusing those layers together using some mechanism (typically heat or chemical reaction) [5,6,7]. There are numerous processes available, divided roughly into seven families [6,7] based on the state of the raw material, the method of producing layers, and the method of layer fusion. There are many benefits to using AM processes in manufacturing of end-user parts, including the ability to produce extremely complex geometry directly from digital models [8,9] and the freedom from formal tooling requirements [2,10]. Various AM methods can process a wide variety of polymer, metal, and ceramic materials; some hybrid processes have recently emerged [11,12,13,14,15] which can use more than one class of material in the same part and process.
However, there are some limitations and problems that need to be considered and addressed when using AM, dimensional accuracy [16,17], process and geometric repeatability [18,19,20], and material defects [21,22,23] being the primary considerations. While all are important considerations, the most essential from the perspective of engineering design are the dimensional accuracy and repeatability of the final parts. It was observed that most of the problems with the dimensional accuracy in AM are due to the material behavior [16,24,25,26] and to the limitations and mechanics of the processing equipment [27,28,29]. Since most AM processes involve heating the material past the melting temperature, shrinkage of the material is a concern as it cools in layers; this shrinkage can both destroy the dimensional integrity of the part and introduce residual stresses, potentially reducing the material fatigue life as well. Thermal curing methods exist to overcome this problem, but defects introduced during processing itself can still be a major source of problems when using the developed parts. Vibration and mechanical compliance are the primary sources of error from the processing equipment, but the effects of this vary significantly from process-to-process.
One of the most common and important AM processes for processing polymer and polymer-composite materials is the extrusion-based fused deposition modeling (FDM) process. Originally developed for prototyping, it has seen much development and growth in recent years and has become suited for manufacturing of end-user products in some industries. FDM works by selectively extruding a bead of molten or near-molten material to build up the part in layers (Figure 1). The raw material is put into the machine in the form of a filament, the layering is done via the deposition from the extruder, and the fusion is done by polymerization reaction as the deposited material cools onto the previous layer and its neighboring lines [30,31,32,33,34,35]. The digital model of the part to be printed is converted into g-code (a defined series of sequential tool-path movements); this is similar to the method used for computer-controlled milling, except that the movements describe the position of the extruder instead of a tool [32,35].
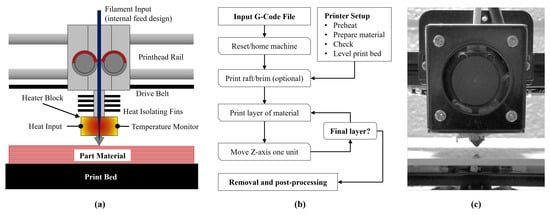
Figure 1.
Fused deposition modeling (FDM) (a) process, (b) work-flow, and (c) extruder carriage example [30].
Due to the mechanics of the process, FDM is potentially subject to several sources of error from vibration and mechanical compliance in the machine. This can be mitigated somewhat by ensuring that the machine is in good mechanical condition, with good-quality drive belts and bearings, and by using control settings which reduce the effect of vibration. One of the most important parameters which is often not discussed in the current literature is the effect of the jerk setting; the jerk is defined as the minimal difference (typically expressed in mm/s) between a current and desired printhead velocity for which the drive motor (typically a stepper motor) will ramp up its torque instead of applying it all at once. Below this setting, the motor will apply torque fully, causing the printhead to “jerk” into the desired position. A high jerk setting (>20 mm/s in the experience of the authors) will increase the print speed significantly, but will also cause the printhead to snap and overshoot during processing, introducing errors. Conversely, a very low jerk setting (<1 mm/s ) will prevent the printhead from moving smoothly and may cause inconsistencies with the melt-pool of the extruded material since the material will extrude very slowly. After extensive experimentation, the authors have found that an average jerk setting of 8 mm/s provided a good balance and therefore was used to produce the samples in this study. The actual optimization of this parameter has not yet been explored in-depth in the literature, but is something that should be examined further in future work.
It was observed that a dimensional error as low as could be accomplished for FDM with the correct settings [16,36,37,38,39,40,41,42,43], but this is highly dependent on the size of the samples in question; smaller samples showed a much higher error. In terms of raw dimensional error, most studies showed the capability to build parts with an error under mm regardless of the specimen size. While most studies reported the error as a percentage of the sample dimensions, it is clear from the data presented that the error is related more to the raw dimensions, and so different sample sizes will show different percentage errors for the same material and parameters.
To further study the aspects of FDM dimensional accuracy and repeatability, a large dataset of observed dimensional errors for various materials and printing parameters was collected using a large number of relatively simple identical parts; the summary, major considerations, and the collection procedure are discussed in the proceeding sections. This dataset is intended to assist designers and process engineers in evaluating the feasibility of FDM as an end-product manufacturing process. Interpretation of the data was not part of this study, as this work focused on collecting useful data which can be used to guide the solutions to a wide variety of design and manufacturing problems. A number of factors were considered for their influence on the two main variables for a large number of materials, so this dataset can be used to study correlations between the parameters, the material properties, and accuracy/repeatability of FDM. Each datapoint was repeated ten times, so reliable values of the sample mean and variance can be found easily, allowing the calculation of probability distributions for various sections of the dataset. This data will also be useful as a training input for finite element analyses, for optimization algorithms, and for machining learning processes that evaluate FDM.
2. Data Description
2.1. Overview and Experiment Considerations
Previous FDM dimensional accuracy studies and design approaches [16,30,31,32,33,34,35,36,37,38,39,40,41,42,43] have mainly focused on establishing the dimensional integrity of complex features; these are very useful studies for predicting the accuracy relative to process parameters and for one-off complex parts. However, as FDM begins to be a viable option for end-product manufacturing, a large dataset derived from relatively simple specimens is needed, one that can be used for statistical analysis to determine the expected accuracy and repeatability over many parts. Such a dataset could be especially useful in the establishment of tolerance constraints on parts during design, as well as finding correlations between the basic process parameters and the accuracy/repeatability. A subset of the possible process parameters can be considered (the exact values of these parameters are given in Section 3) most important for the study presented in this report:
- Print Orientation: Print orientations corresponding to the three Cartesian axes were used
- Density: All parts were printed full-density (100% infill) for all materials; all gaps in the mesostructure were set to zero in the processing g-code for the samples.
- Infill pattern: A standard rectilinear infill pattern was used
- Print velocity: Printing velocity was set at a standard value, unless a lower setting was necessitated by material behavior
- Jerk: The print jerk was fixed at the same value for all specimens and materials
- Processing temperatures: Appropriate extruder and build plate temperatures were used for each of the materials
- Nozzle: Some materials were printed using standard brass nozzles, but others required one made from tool steel; all nozzles used were identical in size
- Enclosure: Some materials that were sensitive to warping, emitted odors, or were sensitive to humidity were printed inside of an enclosure, while the rest were printed on a standard open-bed machine in a conditioned environment
- Layer resolution: All samples for all materials used the same layer resolution
- Bed interface: All samples were printed using rafts on heated glass or polycarbonate build plates, as appropriate for the material
- Experimental environment: All samples were manufactured and tested in a stable and air-conditioned environment away from direct sunlight at least 40 h before measuring, as recommended by several ASTM standards for testing polymeric materials
Even though eleven different materials were used in this study, the difference in material was not considered to be an experimental factor; different materials required different printing parameters and had different reactions on cooling after the processing. Some materials were very stable and some were not; the difference between materials in this was obvious in the collected data, as presented later in this paper. With this in mind, it is difficult to justify considering material choice as a factor and therefore, each material is considered to be a separate experiment with the same variables. In each case, the raster angle (due to the rectilinear print pattern; see Figure 2) and print orientation were considered as the variables, while all other parameters were fixed. The fixed parameters varied somewhat between materials due to the optimal printing parameters needed for each material. Only commercially available raw material and processing equipment built and calibrated by the authors were used for this study to be able to take the maximum amount of control during processing.
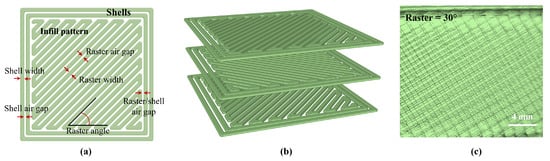
Figure 2.
Rectilinear infill pattern for (a) a single layer, (b) multiple layers, and (c) observed in a manufactured sample at a raster angle of and 100% density.
All print nozzles, relevant belts and bearings, extruder tubes, and printer firmware were updated or replaced before making the samples to ensure that these things did not introduce unnecessary error into the specimens; the purpose of this was to isolate the observed error sources to material behavior and process mechanics. The bearings and belts were replaced at the beginning and midpoint of the sample production, while the firmware was replaced only at the beginning. The extruder tubes were replaced four times during printing and the nozzles were changed every 10 batches of prints (210 samples).
Varying the raster angle changed the position of the part relative to the motion of the extruder carriage, so any overshoot or position error in the mechanics should produce variability in the precision of the parts relative to orientation. It is clear from Figure 2 that the rectilinear pattern would be influenced by this, which in turn would influence the accuracy of the whole part due to the cycling of the extruder while infilling the part. Material behavior also plays a role in this, as materials that collect residual stresses or shrink on cooling would cause the infill to retract slightly, potentially deforming the shell (see Figure 2a) and causing dimensional error in the part. Changing this orientation under these material conditions would change the force pattern inside the material from stresses, which can be reasonably expected to affect the dimensional accuracy of the parts. Since orientation of the part or part sections may not be a controllable variable during manufacturing, it is vital that the designer can understand and plan for such variability in some materials.
While varying the raster angle is an effective way to study the influence of the infill on the dimensional accuracy, the influence of the part shell needs to be studied by varying the print orientation. There are three basic potential sources of error from the shell, namely the build direction, the distance from the build plate, and the ratio of the shell to infill for each layer. In FDM, all the layers are deposited parallel to the build plate, with the shell being the first and most vital section of the part slice to be deposited, so the percentage of each layer that is shell should have a large influence on accuracy. Similarly, the distance from the build plate affects the heat distribution in the part, as a taller part will be warmer on the bottom during processing than the top whenever a heated build plate is used. This is due mainly to the difference in heat transfer area relative to the top and bottom of the part (i.e., the contact area with the heated build plate is much larger than the contact area at any point of the nozzle on top) and the natural convection of heat away from the surface of the part. This heat differential can introduce residual stresses and initiate cracks and warping in the shell.
Eleven materials were studied, as shown in Table 1. The sample design was that of the standard specimen for ASTM polymer impact testing [44]; this was chosen so that three different dimension scales of the same type of “feature” could be studied for each case to give a better understanding of the dimensional error observed. As a secondary consideration, this design was selected so that the samples could be re-used for other studies after testing and not wasted; they were not damaged during measurement, so they were suited for re-use. The specimen geometry is shown in Figure 3a below, where the nominal dimensions [44] are:

Table 1.
Materials, composition, and source.
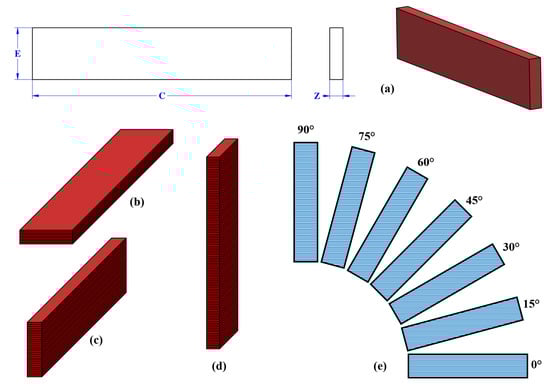
Figure 3.
Specimen configurations: (a) standard geometry, (b) flat printing orientation, (c) horizontal printing orientation, (d) vertical printing orientation, and (e) raster angles.
The three print orientations selected were flat (Figure 3b), horizontal (Figure 3c), and vertical (Figure 3d). Two shells were used for each part, with the ratio of infill to shell in each layer being approximately , while the infill-shell ratios of the horizontal and vertical cases were found to be about and , respectively. Also, for each material, a 90-degree sweep of raster angles in 15-degree increments was defined for the infill (Figure 3e). With the seven raster angles and three orientations, 21 unique combinations were produced. The decision was made to test each material case ten times to ensure a comprehensive dataset. This involved manufacturing and measuring 210 separate samples for each material, for a total of 2310 specimens and 6930 measurements. As with the parameter values, the measurement technique and assumptions are discussed in Section 3.
2.2. Calculation and Data Presentation
A summary of the results is presented in this report (Table 2, Table 3, Table 4, Table 5, Table 6, Table 7, Table 8, Table 9, Table 10, Table 11 and Table 12), but the entire dataset is attached as a supplement with this report and can be viewed and studied in its entirety. For the set of samples of each combination for each material, the three dimensions were measured, and the dataset was summarized into four basic measures (Table 2, Table 3, Table 4, Table 5, Table 6, Table 7, Table 8, Table 9, Table 10, Table 11 and Table 12):
Table 2.
Mean, , SE, MPE, and for ABS as a function of print orientation and raster angle.
Table 3.
Mean, , SE, MPE, and for PLA as a function of print orientation and raster angle.
Table 4.
Mean, , SE, MPE, and for HTPLA as a function of print orientation and raster angle.
Table 5.
Mean, , SE, MPE, and for HIPS as a function of print orientation and raster angle.
Table 6.
Mean, , SE, MPE, and for nylon as a function of print orientation and raster angle.
Table 7.
Mean, , SE, MPE, and for PETG as a function of print orientation and raster angle.
Table 8.
Mean, , SE, MPE, and for PC as a function of print orientation and raster angle.
Table 9.
Mean, , SE, MPE, and for APLA as a function of print orientation and raster angle.
Table 10.
Mean, , SE, MPE, and for CPLA as a function of print orientation and raster angle.
Table 11.
Mean, , SE, MPE, and for WPLA as a function of print orientation and raster angle.
Table 12.
Mean, , SE, MPE, and for CFPLA as a function of print orientation and raster angle.
- Sample mean : The average observed value of the dimension (sample size )
- Nominal error : The difference between the mean observed value and the nominal value
- Standard error : Standard error based on the sample size and the standard deviation
- Mean percent error : Mean percent error of the dataset
Each of these measures assesses an important aspect about the dimensional accuracy of the samples. The full (raw) dataset is attached with this manuscript and can be viewed by the reader on demand. For each combination of print orientation and raster angle, the nominal error was defined as the absolute value of the difference between the mean and the nominal value such that
where is the nominal value and is the mean of the n sample values. Next, the standard error was calculated as
where S is the standard deviation of the sample measurements and n is the number of measurements. Finally, the mean percent error was calculated as
where is the observed value and is the nominal dimension. After the set of measures were taken for each combination, a “combined” error measurement was taken for all three of the measured dimensions such that:
The purpose of the nominal error () calculation was to find the deviation of the mean observed value from the nominal value; note that this is an absolute value and is only a measure of the magnitude of the error. The standard error () measured the deviation from the sample mean and described the spread of the data, related to the observed values and not to the nominal values. Finally, the mean percent error () measured the average deviation from the nominal value on the level of each sample in the set; note that this measure is directional, noting both positive and negative errors.
2.3. Material 1: Acrylonitrile Butadiene Styrene (ABS)
This section gives the results for ABS in terms of three deliverables: a color image showing the 21 samples for one replication of the experiment (Figure 4), a set of plots showing and for each of the dimensional measurements (Figure 5), and a table summarizing the statistical measures described previously (Table 2). The full raw dataset collected from the ABS samples can be found in the attached supplemental materials.
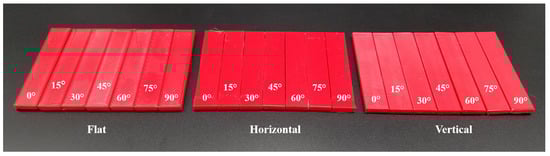
Figure 4.
ABS specimen set for one replication of measurements.
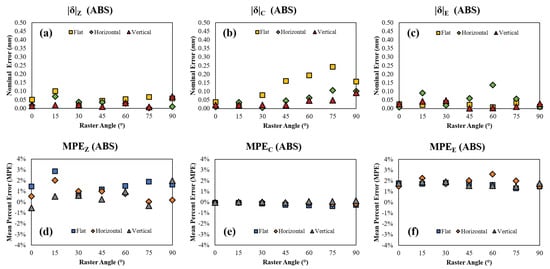
Figure 5.
ABS (a) nominal error in Z, (b) nominal error in C, (c) nominal error in E, (d) mean percent error in Z, (e) mean percent error in C, and (f) mean percent error in E with respect to raster angle and orientation.
2.4. Material 2: Polylactic Acid (PLA)
This section gives the results for PLA in terms of three deliverables: a color image showing the 21 samples for one replication of the experiment (Figure 6), a set of plots showing and for each of the dimensional measurements (Figure 7), and a table summarizing the statistical measures described previously (Table 3). The full raw dataset collected from the PLA samples can be found in the attached supplemental materials.
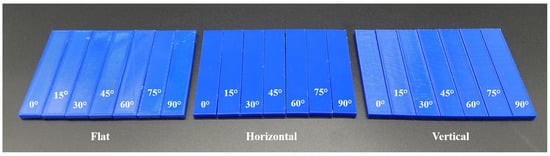
Figure 6.
PLA specimen set for one replication of measurements.
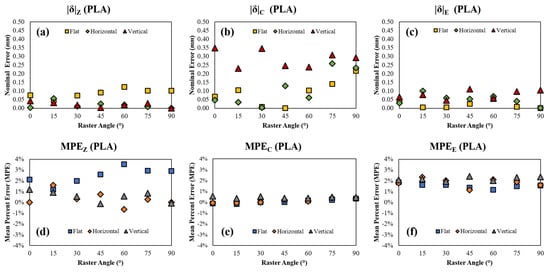
Figure 7.
PLA (a) nominal error in Z, (b) nominal error in C, (c) nominal error in E, (d) mean percent error in Z, (e) mean percent error in C, and (f) mean percent error in E with respect to raster angle and orientation.
2.5. Material 3: High-Temperature PLA (HTPLA)
This section gives the results for HTPLA in terms of three deliverables: a color image showing the 21 samples for one replication of the experiment (Figure 8), a set of plots showing and for each of the dimensional measurements (Figure 9), and a table summarizing the statistical measures described previously (Table 4). The full raw dataset collected from the HTPLA samples can be found in the attached supplemental materials.
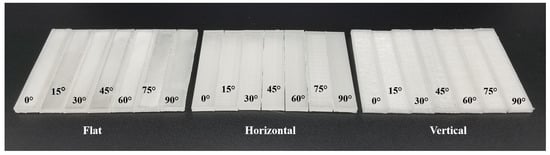
Figure 8.
HTPLA specimen set for one replication of measurements.
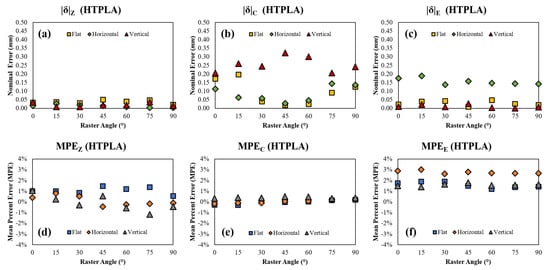
Figure 9.
HTPLA (a) nominal error in Z, (b) nominal error in C, (c) nominal error in E, (d) mean percent error in Z, (e) mean percent error in C, and (f) mean percent error in E with respect to raster angle and orientation.
2.6. Material 4: High-Impact Polystyrene (HIPS)
This section gives the results for HIPS in terms of three deliverables: a color image showing the 21 samples for one replication of the experiment (Figure 10), a set of plots showing and for each of the dimensional measurements (Figure 11), and a table summarizing the statistical measures described previously (Table 5). The full raw dataset collected from the HIPS samples can be found in the attached supplemental materials.
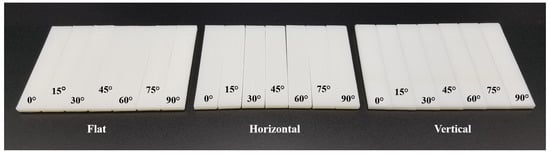
Figure 10.
HIPS specimen set for one replication of measurements.
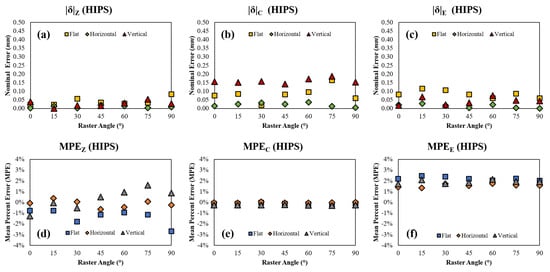
Figure 11.
HIPS (a) nominal error in Z, (b) nominal error in C, (c) nominal error in E, (d) mean percent error in Z, (e) mean percent error in C, and (f) mean percent error in E with respect to raster angle and orientation.
2.7. Material 5: Synthetic Polyamide (Nylon)
This section gives the results for nylon in terms of three deliverables: a color image showing the 21 samples for one replication of the experiment (Figure 12), a set of plots showing and for each of the dimensional measurements (Figure 13), and a table summarizing the statistical measures described previously (Table 6). The full raw dataset collected from the nylon samples can be found in the attached supplemental materials.
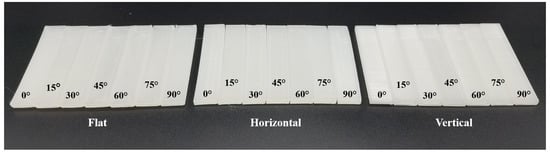
Figure 12.
Nylon specimen set for one replication of measurements.
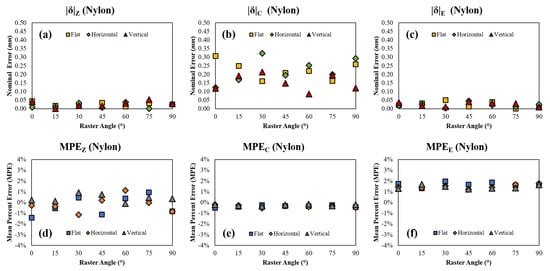
Figure 13.
Nylon (a) nominal error in Z, (b) nominal error in C, (c) nominal error in E, (d) mean percent error in Z, (e) mean percent error in C, and (f) mean percent error in E with respect to raster angle and orientation.
2.8. Material 6: Polyethylene Terephthalate Glycol-Enhanced (PETG)
This section gives the results for PETG in terms of three deliverables: a color image showing the 21 samples for one replication of the experiment (Figure 14), a set of plots showing and for each of the dimensional measurements (Figure 15), and a table summarizing the statistical measures described previously (Table 7). The full raw dataset collected from the PETG samples can be found in the attached supplemental materials.
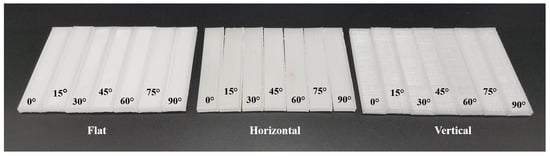
Figure 14.
PETG specimen set for one replication of measurements.
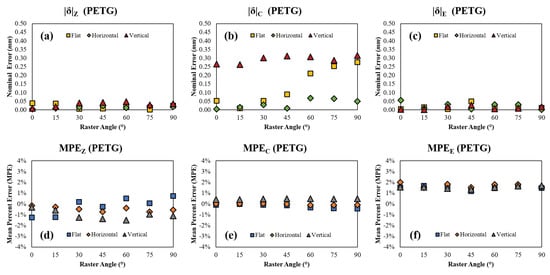
Figure 15.
PETG (a) nominal error in Z, (b) nominal error in C, (c) nominal error in E, (d) mean percent error in Z, (e) mean percent error in C, and (f) mean percent error in E with respect to raster angle and orientation.
2.9. Material 7: Polycarbonate (PC)
This section gives the results for PC in terms of three deliverables: a color image showing the 21 samples for one replication of the experiment (Figure 16), a set of plots showing and for each of the dimensional measurements (Figure 17), and a table summarizing the statistical measures described previously (Table 8). The full raw dataset collected from the PC samples can be found in the attached supplemental materials.
Figure 16.
PC specimen set for one replication of measurements.
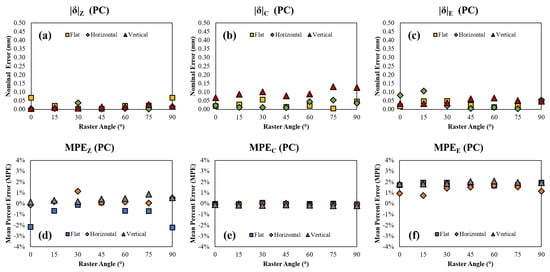
Figure 17.
PC (a) nominal error in Z, (b) nominal error in C, (c) nominal error in E, (d) mean percent error in Z, (e) mean percent error in C, and (f) mean percent error in E with respect to raster angle and orientation.
2.10. Material 8: Aluminum-Composite PLA (APLA)
This section gives the results for APLA in terms of three deliverables: a color image showing the 21 samples for one replication of the experiment (Figure 18), a set of plots showing and for each of the dimensional measurements (Figure 19), and a table summarizing the statistical measures described previously (Table 9). The full raw dataset collected from the APLA samples can be found in the attached supplemental materials.
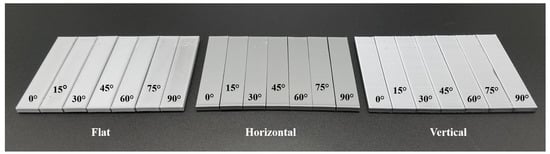
Figure 18.
APLA specimen set for one replication of measurements.
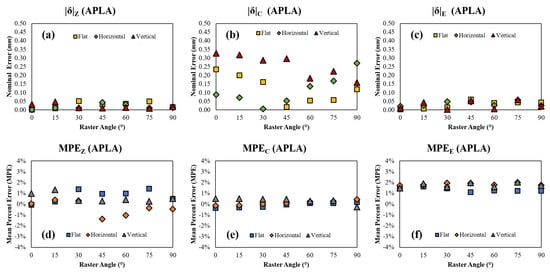
Figure 19.
APLA (a) nominal error in Z, (b) nominal error in C, (c) nominal error in E, (d) mean percent error in Z, (e) mean percent error in C, and (f) mean percent error in E with respect to raster angle and orientation.
2.11. Material 9: Copper-Composite PLA (CPLA)
This section gives the results for CPLA in terms of three deliverables: a color image showing the 21 samples for one replication of the experiment (Figure 20), a set of plots showing and for each of the dimensional measurements (Figure 21), and a table summarizing the statistical measures described previously (Table 10). The full raw dataset collected from the CPLA samples can be found in the attached supplemental materials.
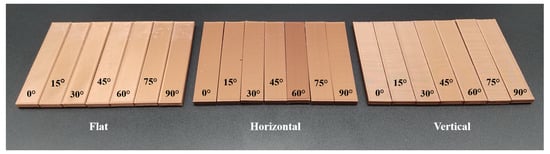
Figure 20.
CPLA specimen set for one replication of measurements.
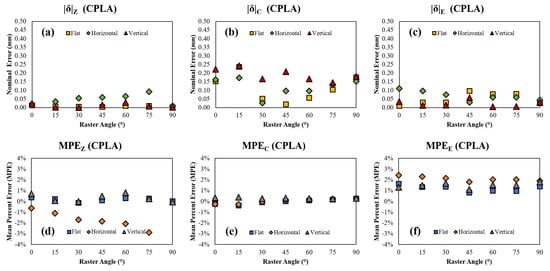
Figure 21.
CPLA (a) nominal error in Z, (b) nominal error in C, (c) nominal error in E, (d) mean percent error in Z, (e) mean percent error in C, and (f) mean percent error in E with respect to raster angle and orientation.
2.12. Material 10: Wood-Composite PLA (WPLA)
This section gives the results for WPLA in terms of three deliverables: a color image showing the 21 samples for one replication of the experiment (Figure 22), a set of plots showing and for each of the dimensional measurements (Figure 23), and a table summarizing the statistical measures described previously (Table 11). The full raw dataset collected from the WPLA samples can be found in the attached supplemental materials.
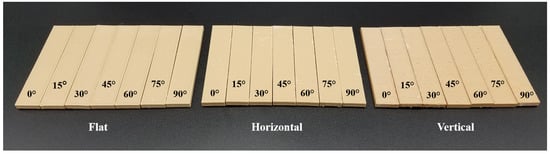
Figure 22.
WPLA specimen set for one replication of measurements.
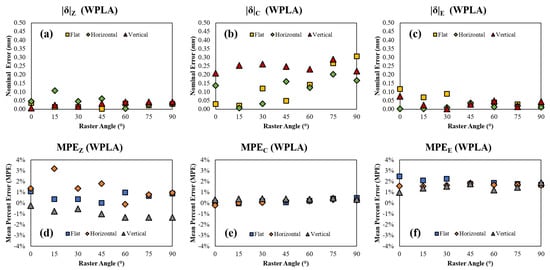
Figure 23.
WPLA (a) nominal error in Z, (b) nominal error in C, (c) nominal error in E, (d) mean percent error in Z, (e) mean percent error in C, and (f) mean percent error in E with respect to raster angle and orientation.
2.13. Material 11: Carbon-Fiber-Composite PLA (CFPLA)
This section gives the results for CFPLA in terms of three deliverables: a color image showing the 21 samples for one replication of the experiment (Figure 24), a set of plots showing and for each of the dimensional measurements (Figure 25), and a table summarizing the statistical measures described previously (Table 12). The full raw dataset collected from the CFPLA samples can be found in the attached supplemental materials.
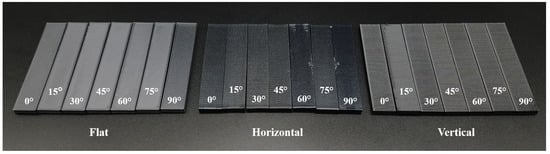
Figure 24.
CFPLA specimen set for one replication of measurements.
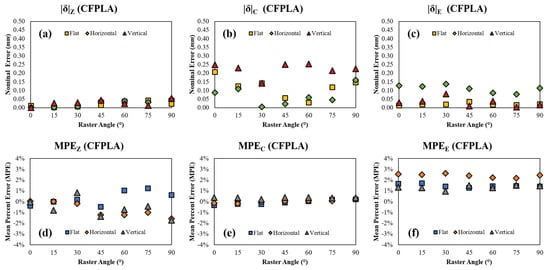
Figure 25.
CFPLA (a) nominal error in Z, (b) nominal error in C, (c) nominal error in E, (d) mean percent error in Z, (e) mean percent error in C, and (f) mean percent error in E with respect to raster angle and orientation.
3. Methods
3.1. Choice of Materials
The set of materials chosen for this study is given in Table 1 in Section 2. This is not an exhaustive set of materials that can be processed using FDM, but these are the most common “hard” (i.e., stiff enough to be used for manufacturing of end-user products) polymer materials used. Please note that all materials used were available commercially and were not proprietary blends; this was done to ensure that the composition of the material was known and that manufacturer infill and additives were not used. Two other materials were examined during initial setup of the experiment (polyvinyl alcohol (PVA), thermoplastic polyurethane (TPU)) but these were found to be too soft and flexible after printing to accurately be measured. Each of the materials in the set were chosen specifically, the main reasons being:
- ABS and PLA: These are the most commonly used FDM materials and therefore were the first two selected
- HTPLA: Standard PLA is quite sensitive to printing temperature and can be strengthened by printing at a higher temperature. However, standard PLA begins to burn and break down at a relatively low temperature above its melting point. Recently, high-temperature versions of the material have been in development; this has not been characterized in the literature yet, but the material appears to be about 20% tougher than standard PLA. It was selected because the authors believe it will become more widely used.
- HIPS: HIPS is a common construction material when molded; its primary use in AM is in the printing of support material. However, the authors have successfully used it as a standard AM material and it appears to have properties similar to ABS but with lower tendency to shrink and warp on cooling. It is a useful, if not common, material for FDM and was therefore included in the set.
- Nylon, PETG, and PC: These are becoming very common FDM materials, overtaking ABS and PLA for some applications. They are stronger and generally more stable for many uses, particularly those involving fracture and fatigue. They are standard materials that should be included in every large dataset for this reason.
- Composite PLAs: As the use of PLA expands, particularly in green production and medical devices, ways to improve its properties have been a topic of much recent research. There are a large number of composite PLAs available, and a subset of four that have different types of composite infill were selected for testing. The authors were particularly interested in metal-powder PLA (5% (CPLA) and 40% (APLA)), in soft material infill (WPLA), and in chopped fiber infill (CFPLA) cases.
3.2. Setup and Printing Parameters
The printing parameters for each of the materials are shown in Table 13 below. The authors are very experienced using all these materials and so used standard print settings for these materials. The settings recommended by the filament manufacturers were used at first and then adjusted to produce the best combination of part quality and print speed. Please note that these settings were developed over hundreds of parts for each material, so they are known to work well and produce the best possible results for each material used. The samples were printed in batches (Figure 26) to ensure that the minimal residual error possible was present and that all significant error observed came from material behavior and the mechanical behavior of the printers.
Table 13.
Specimen manufacturing parameters.
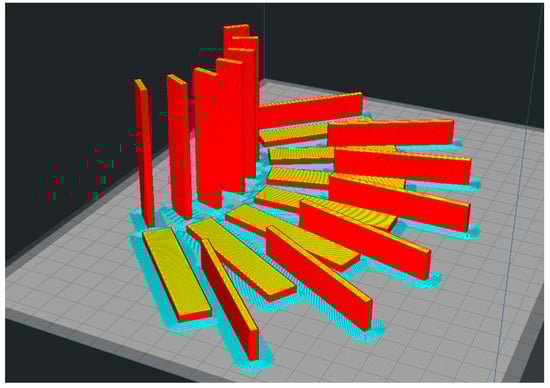
Figure 26.
Pre-processed batch of samples showing orientation, angle, and raft and layer settings; note the shell (red) and the infill (yellow) regions in the parts for the different orientations.
To ensure good knowledge of experimental conditions, the temperature and relative humidity for all the specimen manufacturing were noted each day of processing. They were observed to be approximately 23 C ± 2 C and , respectively. In addition, the true filament diameters and diameter consistency were measured to ensure that the correct settings could be used for each of the materials. The data, shown in Table 14 below, are based on five measurements from each spool with one meter of filament between each measurement.
Table 14.
Effective Filament Diameter and Consistency (nominal diameter mm).
As previously noted, some of the materials required a tool steel nozzle for processing due to flow and abrasion problems with the material. The PLA-based materials in particular needed this type of extruder. Some materials were also printed inside of an enclosure, as noted below. Two different printers were used for this study, an open-bed Prusa-frame machine built and tuned by the authors and a modified XYZPrinting DaVinci Pro 1.0 machine that used commercial filament and software to pre-process the materials. The pre-processing software used was Ultimaker Cura for the open-bed printer and an open-source version of XYZWare Pro for the DaVinci printer; both allowed complete control of the printing parameters shown in Table 13.
Layer thicknesses were set at mm for all samples; appropriate filament retraction settings were used to both avoid messy extruders and to avoid gaps and voids in the part infill. The acceleration was set at 300 mm/s and the non-printing travel speed at 90 mm/s. Four-layer rafts were used as well to ensure that the printing surface itself did not introduce error into the measurements. The Prusa-frame machine used a heated aluminum-polycarbonate build plate [30] and the DaVinci machine used a heated aluminum-glass build plate as a base. Tests were run on both printers before making the samples to ensure that the extruders and build plates were producing the correct temperatures; both a type-K thermocouple reader (AZ Instruments 88598 four-channel SD logger) and an infrared thermometer (Cen-tech 60725) were used.
3.3. Data Collection
Since the purpose of this study was to collect a large dataset on the overall dimensional accuracy and repeatability for FDM, the measurement of complex features and surface roughness were not needed. Therefore, the measurement process was very simple: all measurements were made using a set of good-quality Vernier calipers (Neiko 01407A) with a resolution of mm, as shown in Figure 27. The same environmental conditions (temperature and relative humidity) were present during measuring as during processing (previously described).
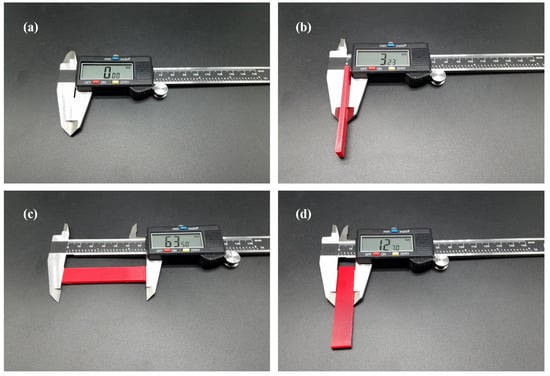
Figure 27.
Vernier calipers (a) tared before measuring, (b) measuring Z, (c) measuring C, and (d) measuring E of a sample.
4. Data Assumptions and User Notes
While the best effort was made to control sources of noise and error in the production and measurement of the specimens, some assumptions were required, as described in this section. The user of this dataset should note these assumptions to ensure that the dataset is appropriate for the problem under study. The intended use of this dataset is for the evaluation of the materials, raster angles, and orientations for macro-scale engineering design.
4.1. Nozzle Size and Quality
It was assumed that the printing nozzles used were of good quality and had true and consistent diameters from the manufacturer. If the nozzles are of poor consistency, they could wear unevenly or produce incorrect part shells. The nozzles used in this study were not directly measured before using, but they were inspected under a microscope to ensure that they were in good condition and did not have a large variance in the hole diameter. Examples of the nozzles used are shown in Figure 28. As previously stated, the nozzles were changed after each material (210 samples).
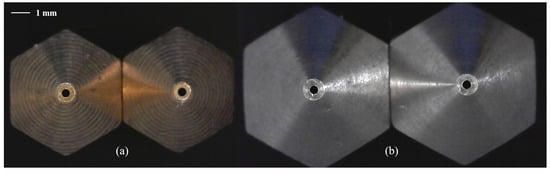
Figure 28.
Examples of (a) brass and (b) tool steel extrusion nozzles shown at the same scale.
4.2. Part Mass
The mass of the samples was not measured, as the aim and scope of this work was to evaluate the dimensional accuracy. Evaluation of impact of the raster angle and orientation on the part mass is a topic of future research.
4.3. Condition and Wear of Extruder Hardware
The extruder gear and bearings were not replaced at the beginning of the experiment, as these are typically long-lasting hardware that needed minimal maintenance. The gear and bearings were inspected prior to sample manufacture and were visually assessed to be in good condition. Therefore, it was assumed that no action was needed. Since both printers used Bowden extruders, it is important to consider the condition of the feed tube from the extruder to the extruder carriage. This was not directly inspected, but the tube and hardware on each printer were changed approximately every 500 parts to ensure that any wear did not influence the results.
4.4. Extrusion Efficiency
Since the true mean diameter of the filament was used in the pre-processing of the sample g-code and the nozzles were changed frequently, it was assumed that any over- and under-extrusion of the filament was too small to have any significant impact on the results of this study. No layer gaps, no dripping, and no extruder motor clicking (i.e., missed steps) were observed during the printing of the specimens, indicating the prints behaved as expected.
4.5. Slicer and Firmware
The impact of the slicer used to pre-process the samples and the printer firmware were not considered during this work. Even if there could be some minor impact from this, each material was segregated and considered on its own as a separate experiment; the print and infill patterns for each orientation and raster angle were identical across materials, so it was assumed that no major impact was present. The slicer used for each material is the default slicer for the software described in Section 3.2. The firmware was updated on each of the printers prior to beginning the work, where the enclosed printer used the XYZPrinting Pro firmware and the open-bed printed used Marlin firmware.
Supplementary Materials
Supplementary materials are available online at http://www.mdpi.com/2504-4494/3/1/6/s1.
Author Contributions
T.R.P., A.E.P., and S.L.M. conceived the idea for the dataset, T.R.P. and A.E.P. collected the data, M.L., A.E.P., and F.O.D. helped to organize and interpret the data and do the basic statistical analysis, F.O.D. and S.L.M. provided supervision and advice on the project, T.R.P. and A.E.P. manufactured the specimens, and S.L.M. provided raw materials. All authors assisted with writing and revising the manuscript. Author order was agreed by all authors prior to manuscript submission.
Funding
This work received no external funding.
Acknowledgments
The authors would like to thank the handling editor and the four anonymous reviewers for their many helpful comments and suggestions on this work.
Conflicts of Interest
The authors declare no conflict of interest. No external funding was used to perform the work described in this study. Opinions and conclusions presented in this work are solely those of the authors.
References
- Kellens, K.; Mertens, R.; Paraskevas, D.; Dewulf, W.; Duflou, J.R. Environmental Impact of Additive Manufacturing Processes: Does AM Contribute to a More Sustainable Way of Part Manufacturing? Procedia CIRP 2017, 61, 582–587. [Google Scholar] [CrossRef]
- Ford, S.; Despeisse, M. Additive manufacturing and sustainability: An exploratory study of the advantages and challenges. J. Clean. Prod. 2016, 137, 1573–1587. [Google Scholar] [CrossRef]
- Gebler, M.; Uiterkamp, A.J.S.; Visser, C. A global sustainability perspective on 3D printing technologies. Energy Policy 2014, 74, 158–167. [Google Scholar] [CrossRef]
- Wits, W.W.; García, J.R.R.; Becker, J.M.J. How Additive Manufacturing Enables more Sustainable End-user Maintenance, Repair and Overhaul (MRO) Strategies. Procedia CIRP 2016, 40, 693–698. [Google Scholar] [CrossRef]
- Gibson, I.; Rosen, D.; Stucker, B. Additive Manufacturing Technologies: 3D Printing, Rapid Prototyping, and Direct Digital Manufacturing; Springer: Berlin/Heidelberg, Germany, 2016. [Google Scholar]
- Guo, N.; Leu, M.C. Additive manufacturing: Technology, applications and research needs. Front. Mech. Eng. 2013, 8, 215–243. [Google Scholar] [CrossRef]
- ASTM. F2792-12a: Standard Terminology for Additive Manufacturing Technologies; ASTM Standard (Withdrawn): West Conshohocken, PA, USA, 2012. [Google Scholar] [CrossRef]
- Yang, S.; Zhao, Y.F. Additive manufacturing-enabled design theory and methodology: A critical review. Int. J. Adv. Manuf. Technol. 2015, 80, 327–342. [Google Scholar] [CrossRef]
- Yang, S.; Tang, Y.; Zhao, Y.F. A new part consolidation method to embrace the design freedom of additive manufacturing. J. Manuf. Process. 2015, 20, 444–449. [Google Scholar] [CrossRef]
- Tofail, S.A.; Koumoulos, E.P.; Bandyopadhyay, A.; Bose, S.; O’Donoghue, L.; Charitidis, C. Additive manufacturing: Scientific and technological challenges, market uptake and opportunities. Mater. Today 2018, 21, 22–37. [Google Scholar] [CrossRef]
- Falck, R.; Goushegir, S.; dos Santos, J.; Amancio-Filho, S. AddJoining: A novel additive manufacturing approach for layered metal-polymer hybrid structures. Mater. Lett. 2018, 217, 211–214. [Google Scholar] [CrossRef]
- Cunico, M.W.M.; de Carvalho, J. Development of additive manufacturing technology based on selective metal-polymer composite formation. Rapid Prototyp. J. 2018, 24, 52–68. [Google Scholar] [CrossRef]
- Khatri, B.; Lappe, K.; Noetzel, D.; Pursche, K.; Hanemann, T. A 3D-Printable Polymer-Metal Soft-Magnetic Functional Composite—Development and Characterization. Materials 2018, 11, 189. [Google Scholar] [CrossRef]
- Gonzalez-Gutierrez, J.; Cano, S.; Schuschnigg, S.; Kukla, C.; Sapkota, J.; Holzer, C. Additive Manufacturing of Metallic and Ceramic Components by the Material Extrusion of Highly-Filled Polymers: A Review and Future Perspectives. Materials 2018, 11, 840. [Google Scholar] [CrossRef] [PubMed]
- Silva, M.; Felismina, R.; Mateus, A.; Parreira, P.; Malça, C. Application of a Hybrid Additive Manufacturing Methodology to Produce a Metal/Polymer Customized Dental Implant. Procedia Manuf. 2017, 12, 150–155. [Google Scholar] [CrossRef]
- Lee, P.H.; Chung, H.; Lee, S.W.; Yoo, J.; Ko, J. Review: Dimensional Accuracy in Additive Manufacturing Processes. In Proceedings of the ASME 2014 International Manufacturing Science and Engineering Conference Collocated with the JSME 2014 International Conference on Materials and Processing and the 42nd North American Manufacturing Research Conference, Detroit, MI, USA, 9–13 June 2014; ASME: New York, NY, USA, 2014. [Google Scholar] [CrossRef]
- Guessasma, S.; Zhang, W.; Zhu, J.; Belhabib, S.; Nouri, H. Challenges of additive manufacturing technologies from an optimisation perspective. Int. J. Simul. Multidiscip. Des. Optim. 2015, 6, A9. [Google Scholar] [CrossRef]
- Kirsch, K.L.; Snyder, J.C.; Stimpson, C.K.; Thole, K.A.; Mongillo, D. Repeatability in Performance of Micro Cooling Geometries Manufactured with Laser Powder Bed Fusion. In Proceedings of the 53rd AIAA/SAE/ASEE Joint Propulsion Conference. American Institute of Aeronautics and Astronautics, Atlanta, GA, USA, 10–12 July 2017. [Google Scholar] [CrossRef]
- Rebaioli, L.; Fassi, I. A review on benchmark artifacts for evaluating the geometrical performance of additive manufacturing processes. Int. J. Adv. Manuf. Technol. 2017, 93, 2571–2598. [Google Scholar] [CrossRef]
- Zongo, F.; Tahan, A.; Aidibe, A.; Brailovski, V. Intra- and Inter-Repeatability of Profile Deviations of an AlSi10Mg Tooling Component Manufactured by Laser Powder Bed Fusion. J. Manuf. Mater. Process. 2018, 2, 56. [Google Scholar] [CrossRef]
- Taheri, H.; Shoaib, M.R.B.M.; Koester, L.W.; Bigelow, T.A.; Collins, P.C.; Bond, L.J. Powder-based additive manufacturing—A review of types of defects, generation mechanisms, detection, property evaluation and metrology. Int. J. Addit. Subtractive Mater. Manuf. 2017, 1, 172. [Google Scholar] [CrossRef]
- Günther, J.; Brenne, F.; Droste, M.; Wendler, M.; Volkova, O.; Biermann, H.; Niendorf, T. Design of novel materials for additive manufacturing—Isotropic microstructure and high defect tolerance. Sci. Rep. 2018, 8. [Google Scholar] [CrossRef]
- Gordeev, E.G.; Galushko, A.S.; Ananikov, V.P. Improvement of quality of 3D printed objects by elimination of microscopic structural defects in fused deposition modeling. PLoS ONE 2018, 13, e0198370. [Google Scholar] [CrossRef]
- Dimitrov, D.; van Wijck, W.; Schreve, K.; de Beer, N. Investigating the achievable accuracy of three dimensional printing. Rapid Prototyp. J. 2006, 12, 42–52. [Google Scholar] [CrossRef]
- Yaman, U. Shrinkage compensation of holes via shrinkage of interior structure in FDM process. Int. J. Adv. Manuf. Technol. 2017, 94, 2187–2197. [Google Scholar] [CrossRef]
- Schmutzler, C.; Zimmermann, A.; Zaeh, M.F. Compensating Warpage of 3D Printed Parts Using Free-form Deformation. Procedia CIRP 2016, 41, 1017–1022. [Google Scholar] [CrossRef]
- Agrawal, S.; Dhande, S.G. Analysis of mechanical error in a fused deposition process using a stochastic approach. Int. J. Prod. Res. 2007, 45, 3991–4012. [Google Scholar] [CrossRef]
- Bochmann, L.; Bayley, C.; Helu, M.; Transchel, R.; Wegener, K.; Dornfeld, D. Understanding error generation in fused deposition modeling. Surf. Topogr. Metrol. Prop. 2015, 3, 014002. [Google Scholar] [CrossRef]
- Lieneke, T.; Denzer, V.; Adam, G.A.; Zimmer, D. Dimensional Tolerances for Additive Manufacturing: Experimental Investigation for Fused Deposition Modeling. Procedia CIRP 2016, 43, 286–291. [Google Scholar] [CrossRef]
- Messimer, S.L.; Patterson, A.E.; Muna, N.; Deshpande, A.P.; Pereira, T.R. Characterization and Processing Behavior of Heated Aluminum-Polycarbonate Composite Build Plates for the FDM Additive Manufacturing Process. J. Manuf. Mater. Process. 2018, 2, 12. [Google Scholar] [CrossRef]
- Turner, B.N.; Strong, R.; Gold, S.A. A review of melt extrusion additive manufacturing processes: I. Process design and modeling. Rapid Prototyp. J. 2014, 20, 192–204. [Google Scholar] [CrossRef]
- Turner, B.N.; Gold, S.A. A review of melt extrusion additive manufacturing processes: II. Materials, dimensional accuracy, and surface roughness. Rapid Prototyp. J. 2015, 21, 250–261. [Google Scholar] [CrossRef]
- Mohamed, O.A.; Masood, S.H.; Bhowmik, J.L. Optimization of fused deposition modeling process parameters: A review of current research and future prospects. Adv. Manuf. 2015, 3, 42–53. [Google Scholar] [CrossRef]
- Mohamed, O.; Masood, S.; Bhowmik, J. Analytical Modelling and Optimization of the Temperature-Dependent Dynamic Mechanical Properties of Fused Deposition Fabricated Parts Made of PC-ABS. Materials 2016, 9, 895. [Google Scholar] [CrossRef]
- Sood, A.K.; Ohdar, R.; Mahapatra, S. Parametric appraisal of mechanical property of fused deposition modelling processed parts. Mater. Des. 2010, 31, 287–295. [Google Scholar] [CrossRef]
- Chang, D.Y.; Huang, B.H. Studies on profile error and extruding aperture for the RP parts using the fused deposition modeling process. Int. J. Adv. Manuf. Technol. 2010, 53, 1027–1037. [Google Scholar] [CrossRef]
- Saqib, S.; Urbanic, J. An Experimental Study to Determine Geometric and Dimensional Accuracy Impact Factors for Fused Deposition Modelled Parts. In Enabling Manufacturing Competitiveness and Economic Sustainability; Springer: Berlin/Heidelberg, Germany, 2011; pp. 293–298. [Google Scholar] [CrossRef]
- Sood, A.K.; Ohdar, R.; Mahapatra, S. Improving dimensional accuracy of Fused Deposition Modelling processed part using grey Taguchi method. Mater. Des. 2009, 30, 4243–4252. [Google Scholar] [CrossRef]
- Sahu, R.K.; Mahapatra, S.; Sood, A.K. A Study on Dimensional Accuracy of Fused Deposition Modeling (FDM) Processed Parts using Fuzzy Logic. J. Manuf. Sci. Prod. 2013, 13. [Google Scholar] [CrossRef]
- Equbal, A.; Sood, A.K.; Mahapatra, S. Prediction of dimensional accuracy in fused deposition modelling: A fuzzy logic approach. Int. J. Prod. Qual. Manag. 2011, 7, 22–43. [Google Scholar] [CrossRef]
- Pennington, R.C.; Hoekstra, N.L.; Newcomer, J.L. Significant factors in the dimensional accuracy of fused deposition modelling. Proc. Inst. Mech. Eng. Part E J. Process Mech. Eng. 2005, 219, 89–92. [Google Scholar] [CrossRef]
- Huynh, H.N.; Nguyen, A.T.; Ha, N.L.; Thai, T.T.H. Application of fuzzy Taguchi method to improve the dimensional accuracy of Fused Deposition Modeling processed product. In Proceedings of the 2017 International Conference on System Science and Engineering (ICSSE), Ho Chi Minh City, Vietnam, 21–23 July 2017; IEEE: Piscataway, NJ, USA, 2017. [Google Scholar] [CrossRef]
- Pérez, C.J.L. Analysis of the surface roughness and dimensional accuracy capability of fused deposition modelling processes. Int. J. Prod. Res. 2002, 40, 2865–2881. [Google Scholar] [CrossRef]
- ASTM. ASTM D256-10e1: Standard Test Methods for Determining the Izod Pendulum Impact Resistance of Plastics; ASTM International: West Conshohocken, PA, USA, 2018. [Google Scholar]
© 2019 by the authors. Licensee MDPI, Basel, Switzerland. This article is an open access article distributed under the terms and conditions of the Creative Commons Attribution (CC BY) license (http://creativecommons.org/licenses/by/4.0/).