1. Introduction
The Auditory Steady-State Response (ASSR) is a sustained electrophysiological response that is phase-locked to the steady component of the stimulus (either the amplitude modulation frequency or the repetition rate of the stimulus), which maintains amplitude and phase throughout the presentation of the stimuli [
1,
2]. It facilitates frequency-specific estimation of hearing thresholds. The ASSR has been introduced as a possible alternative to the Auditory Brainstem Response (ABR) to reduce test time and improve auditory diagnostic evaluations [
3]. The ASSR provides objective and ear-specific information essential for early and appropriate intervention, such as fitting hearing aids or cochlear implants. Tone-burst-evoked ABRs are the gold standard for estimating hearing thresholds in infants, yet the ASSR is one of the emerging technologies that has improved test efficiency [
3,
4]. The advantages of the ASSR over the tone burst ABR includes completely objective detection of responses and shorter overall test time due to the multiple stimulus presentations [
3,
4,
5,
6,
7]. The first-generation ASSRs using amplitude or mixed modulation stimuli with various carrier frequencies (500 Hz, 1000 Hz, 2000 Hz, and 4000 Hz) were implemented to reliably record ASSR responses [
1,
2,
5,
7,
8]. But, the early ASSR systems used a stimulus and detection paradigm that lacked sufficient sensitivity in finding low-amplitude responses, leading to large discrepancies between ASSR threshold and behavioral thresholds for individuals with normal hearing and lower degrees of hearing loss [
8,
9,
10,
11]. These large discrepancies led to reluctance in the routine use of ASSRs among clinicians.
However, the next-generation ASSR with a narrow-band CE-chirp stimulus presented at different repetition rates has offered promise with improved detection rates and a reduced test time [
3,
4,
12]. The commercial Eclipse system incorporates a multi-harmonic detector that analyzes the amplitude and phase of the fundamental frequency (repetition rate of the individual stimuli) and up to 12 higher harmonics of the ASSR. Through statistical analysis, it compares the response with residual noise levels to objectively determine the presence or absence of the ASSR. Further details about the algorithm for automatic detection can be found in the comprehensive review by Sininger et al. [
3].
In a retrospective study involving 667 patients, Ehrmann-Müller et al. [
13] reported highly promising results for the application of narrow-band chirp ASSR. They found a significant correlation between Puretone audiometry results and ASSR measurements across the patient population. Additionally, a recent study conducted by Vanaja and Kunjir [
14] focused on children aged 3 to 5 years. Their findings indicated that aided chirp ASSR can accurately predict aided behavioral thresholds. This provides further evidence for the use of ASSR in the hearing aid fitting and verification process. The use of next-generation ASSRs with narrow-band chirps shows great potential for assessing auditory function in both adult and pediatric populations, serving as a valuable diagnostic tool and aiding in hearing aid validation.
Test–retest reliability holds paramount importance in audiological monitoring as it ensures consistency and accuracy of measurements over time. This metric is commonly assessed by obtaining repeated measurements from the same individuals, which facilitates an evaluation of the extent to which a test produces consistent results under similar conditions. The ability to reliably measure and track changes in auditory conditions is crucial for clinicians to confidently interpret test results, monitor progressive hearing loss, and make informed decisions regarding diagnosis, treatment, and interventions.
To illustrate the significance of test–retest reliability in audiological monitoring, several examples can be considered. One such example is the monitoring of hearing changes associated with ototoxicity, which has been extensively reviewed by Campbell and Leprell [
15]. Patients undergoing treatment with life-saving drugs such as aminoglycoside antibiotics or platinum-based chemotherapies require regular evaluations, typically weekly to biweekly, to detect any potential hearing changes resulting from the administration of these medications. In such cases, the test administered must provide reliable results to differentiate between the hearing changes caused by the drugs and the inherent variability of the test itself. For a significant change in hearing threshold to be identified, the threshold shift must exceed the test–retest variability of the test. As Campbell and Leprell [
15] have noted, a shift greater than 10 dB is considered clinically significant.
Another example pertains to monitoring hearing changes in patients with progressive hearing loss. As highlighted by Barreira-Nielsen et al. [
16], it is crucial to track and measure changes in hearing thresholds over time to determine the progression of the condition accurately and tailor appropriate interventions accordingly.
A comprehensive literature review identified five studies examining the test–retest reliability of the 80 Hz old-generation ASSR using amplitude or mixed modulation stimuli with various carrier frequencies [
5,
17,
18,
19,
20]. Luts and Wouters [
5] and Kaf et al. [
18] explored the test–retest reliability of ASSR threshold estimation in normal-hearing and hearing-impaired adults, with Kaf et al. [
18] also considering participants with simulated sensorineural hearing loss. Additionally, Luts and Wouters [
5] compared two different systems, AUDERA and MASTER ASSR. Kim and Lee [
19] conducted an investigation into the test–retest reliability of bone conduction ASSR in both normal-hearing and hearing-impaired individuals. In a similar vein, Wilding et al. [
20] evaluated the repeatability of the ASSR amplitude through test–retest analysis in individuals with normal hearing and those with hearing impairment. Overall, these studies reported moderately strong to strong test–retest reliability for ASSR at carrier frequencies of 1000, 2000, and 4000 Hz, but moderate to weak reliability at 500 Hz. D’Haenens et al. [
17] and Wilding et al. [
20] highlighted high variability in the amplitude of the ASSR between test sessions, potentially affecting ASSR threshold consistency across sessions.
McFadden et al. [
21] measured the intersession reliability of the 40 Hz ASSR for click and white noise stimuli using both amplitude and phase analysis. Their findings revealed a significant correlation between sessions 1 and 2. The study highlighted that phase coherence analysis exhibited higher inter-session reliability compared to amplitude analysis. The authors reported that click-train stimuli demonstrated higher reliability than white noise stimuli. This can be attributed to the higher signal-to-noise ratio associated with click-train stimuli. It is important to note that the study by McFadden et al. [
21] focused specifically on click and white noise stimuli and did not consider tone burst or narrowband chirp stimuli in their assessment of inter-session reliability.
To date, no published reports have investigated the next-generation ASSR’s test–retest reliability, specifically as implemented in the Eclipse system. Therefore, the primary objective of this pilot study is to evaluate the test–retest reliability of the next-generation ASSR system, utilizing the multiple ASSR technique in the Eclipse system for air conduction stimulation among normal-hearing adults. Building upon findings from previous studies using the old-generation ASSR, we hypothesize that there will be strong test–retest reliability for ASSR thresholds across two sessions, with higher frequencies exhibiting greater reliability than lower frequencies. Additionally, we anticipate no significant relationship between differences in ASSR thresholds and residual noise levels.
2. Materials and Methods
2.1. Participants
Fifteen participants (12 females, 3 males) with a mean age of 28 years (range: 23–31 years) were recruited from both the Department of Communication Disorders at California State University, Los Angeles, and the local population. A total of 30 ears (right and left ears of 15 participants) were included in the study. The research protocol comprised two sessions: a test session and a retest session. All 15 participants successfully completed both sessions. To gather the required data, two separate one-hour test sessions were conducted for each participant, scheduled with a gap of 7 to 14 days between them. Informed consent was obtained from all participants in adherence to the protocol approved by the Institutional Review Board of California State University, Los Angeles.
2.2. Standard Inclusion and Clinical Procedures
The routine audiological test battery was conducted to determine the eligibility of participants for the study. The study employed the following criteria for inclusion: (1) the absence of recent hearing impairment or aural symptoms, (2) normal findings upon otoscopic examination, (3) normal behavioral audiometry, as defined by pure-tone thresholds no worse than 20 dB HL at each octave frequency ranging from 500 to 4000 Hz, utilizing the modified Hughson–Westlake procedure [
22], (4) normal middle-ear function, as confirmed by the presence of a normal 226 Hz tympanogram, and (5) the absence of a significant air–bone gap.
2.3. ASSR Stimuli
Multiple simultaneous dichotic narrow-band (NB) frequency-specific chirp stimuli presentations were utilized with center frequencies of 500, 1000, 2000, and 4000 Hz as implemented in the commercial Interacoustics Eclipse system (software version: 2.1.0). Claus Elberling (CE)-Chirp was designed to compensate for the delay induced by the basilar membrane’s traveling wave by presenting low-frequency energy before higher-frequency energy [
23]. This approach results in synchronized activation of auditory nerve fibers, leading to larger amplitude responses and lower thresholds [
24,
25]. The broadband CE-chirp stimulus (level independent) decomposed to a narrow-band (NB) stimulus centered at 500, 1000, 2000, 4000, and 8000 Hz (referred to as NB CE-chirp stimulus of that particular frequency). A newer level-specific (LS) CE-chirp stimulus was developed by modifying the temporal characteristics of the chirp stimulus based on observed level effects related to changes in the cochlear traveling wave delay and the upward spread of the excitation [
26]. Broadband CE-chirp LS decomposed to NB stimulus centered at 500, 1000, 2000, 4000, and 8000 Hz (referred to as a NB LS CE-chirp stimulus of that particular frequency). For this study, a dichotic stimulus presentation was chosen, involving the simultaneous delivery of eight stimuli (500 Hz CE-chirp LS, 1000 Hz CE-chirp LS, 2000 Hz CE-chirp LS, and 4000 Hz CE-chirp LS to each ear) through insert earphones (IP 30, RadioEar, Middelfart, Denmark). Each NB CE-chirp LS stimulus was presented at slightly different repetition rates around 90 Hz, ranging from 88 to 98 Hz, as utilized in the commercial Interacoustics Eclipse platform for ASSR recordings.
2.4. ASSR Recording
The ASSRs were collected and analyzed using the automated analysis feature of the Interacoustics Eclipse system. A two-channel recording setup was employed, with four surface electrodes used to record the responses. The non-inverting electrode was positioned on the high forehead at the hairline, while two inverting electrodes were placed on each ear lobe (A1 and A2). The ground electrode was placed on the forehead beneath the non-inverting electrode. Electrode impedance was maintained below 3 kOhms, with an inter-electrode impedance difference kept under 2 kOhms. The rejection level was set at 40 microvolts. Throughout the testing process, continuous monitoring of the EEG was carried out. In cases of excessive EEG noise due to patient movement or artifacts, the testing procedure was temporarily paused until the artifact was resolved.
The ASSRs were recorded using the accuracy-test method and the adult sleeping protocol implemented in the Eclipse software. The accuracy-test method priority considers the significance level of
p-value ≤ 0.01, indicating a 99% or higher confidence in the response. The algorithm employed for the automatic detection of ASSR in the Eclipse system is described in detail by Sininger et al. [
3], providing a comprehensive analysis of its functioning and effectiveness. In summary, the multi-harmonic detector analyzes the amplitude and phase of the fundamental frequency (repetition rate) and higher harmonics (up to 12 harmonics in the commercial Eclipse system) of the ASSR to determine the presence or absence of a response. Statistical analysis was conducted to compare the response with the residual noise levels and determine the presence or absence of the ASSR response. Within the accuracy-test method protocol, an ASSR response was considered present if the statistical comparison between the signal and noise yielded a
p-value of ≤0.01 (indicating a 99% confidence or higher). Conversely, an ASSR response was considered absent if the
p-value was >0.01 (less than 99% confidence). The adult sleeping protocol establishes the repetition rates of the stimuli used, employing fast repetition rates of around 90 Hz. During the testing sessions, participants were comfortably positioned on a recliner and instructed to relax, minimize movements, and be encouraged to sleep if possible. Two one-hour test sessions were conducted, scheduled 7 to 14 days apart for all participants, to collect the necessary data.
2.5. ASSR Threshold Estimation
The modified Michael and Jørgensen [
12] procedure, as depicted in
Figure 1, was employed for determining the ASSR threshold. The measurement procedure started at 40 dBnHL and used a descending technique with 10 dB steps until no ASSR response was detected. A level 5 dB above the no ASSR response was recorded to determine the ASSR threshold. The ASSR threshold was determined as the lowest level at which ASSR was present with 99% confidence (
p = 0.01), and a non-significant response (
p > 0.01) was observed 5 dB below this level. This 5 dB accuracy in ASSR threshold measurement allowed us to perform a comparison with pure-tone thresholds, which are clinically measured using a 5 dB step size. The initial recording duration for ASSR was set at 6 min. It was repeated once if the response curve reached 99% confidence within one minute. Detection curves that did not reach 99% confidence within the 6 min recording had stopping criteria: (1) residual noise levels ≤ 20 nV, or (2) response confidence curve < 50%. If the stopping criteria were not met at 6 min, the ASSR recording was extended by 3 more minutes. At a total of 9 min of recording, the stopping criteria were: (1) residual noise levels ≤ 20 nV, or (2) response confidence curve < 75%. If the stopping criteria were not met at the 9 min mark, the ASSR recording was further extended by a final 3 min. If the 99% response confidence was not achieved even at the 12 min mark, the ASSR response was considered absent. Thus, the maximum recording time for ASSR at any specific level was 12 min. If no response was measured at the starting level of 40 dBnHL, the presentation level was increased in 10 dB steps until a response was obtained. The same testing protocols were followed during both test sessions (test and retest).
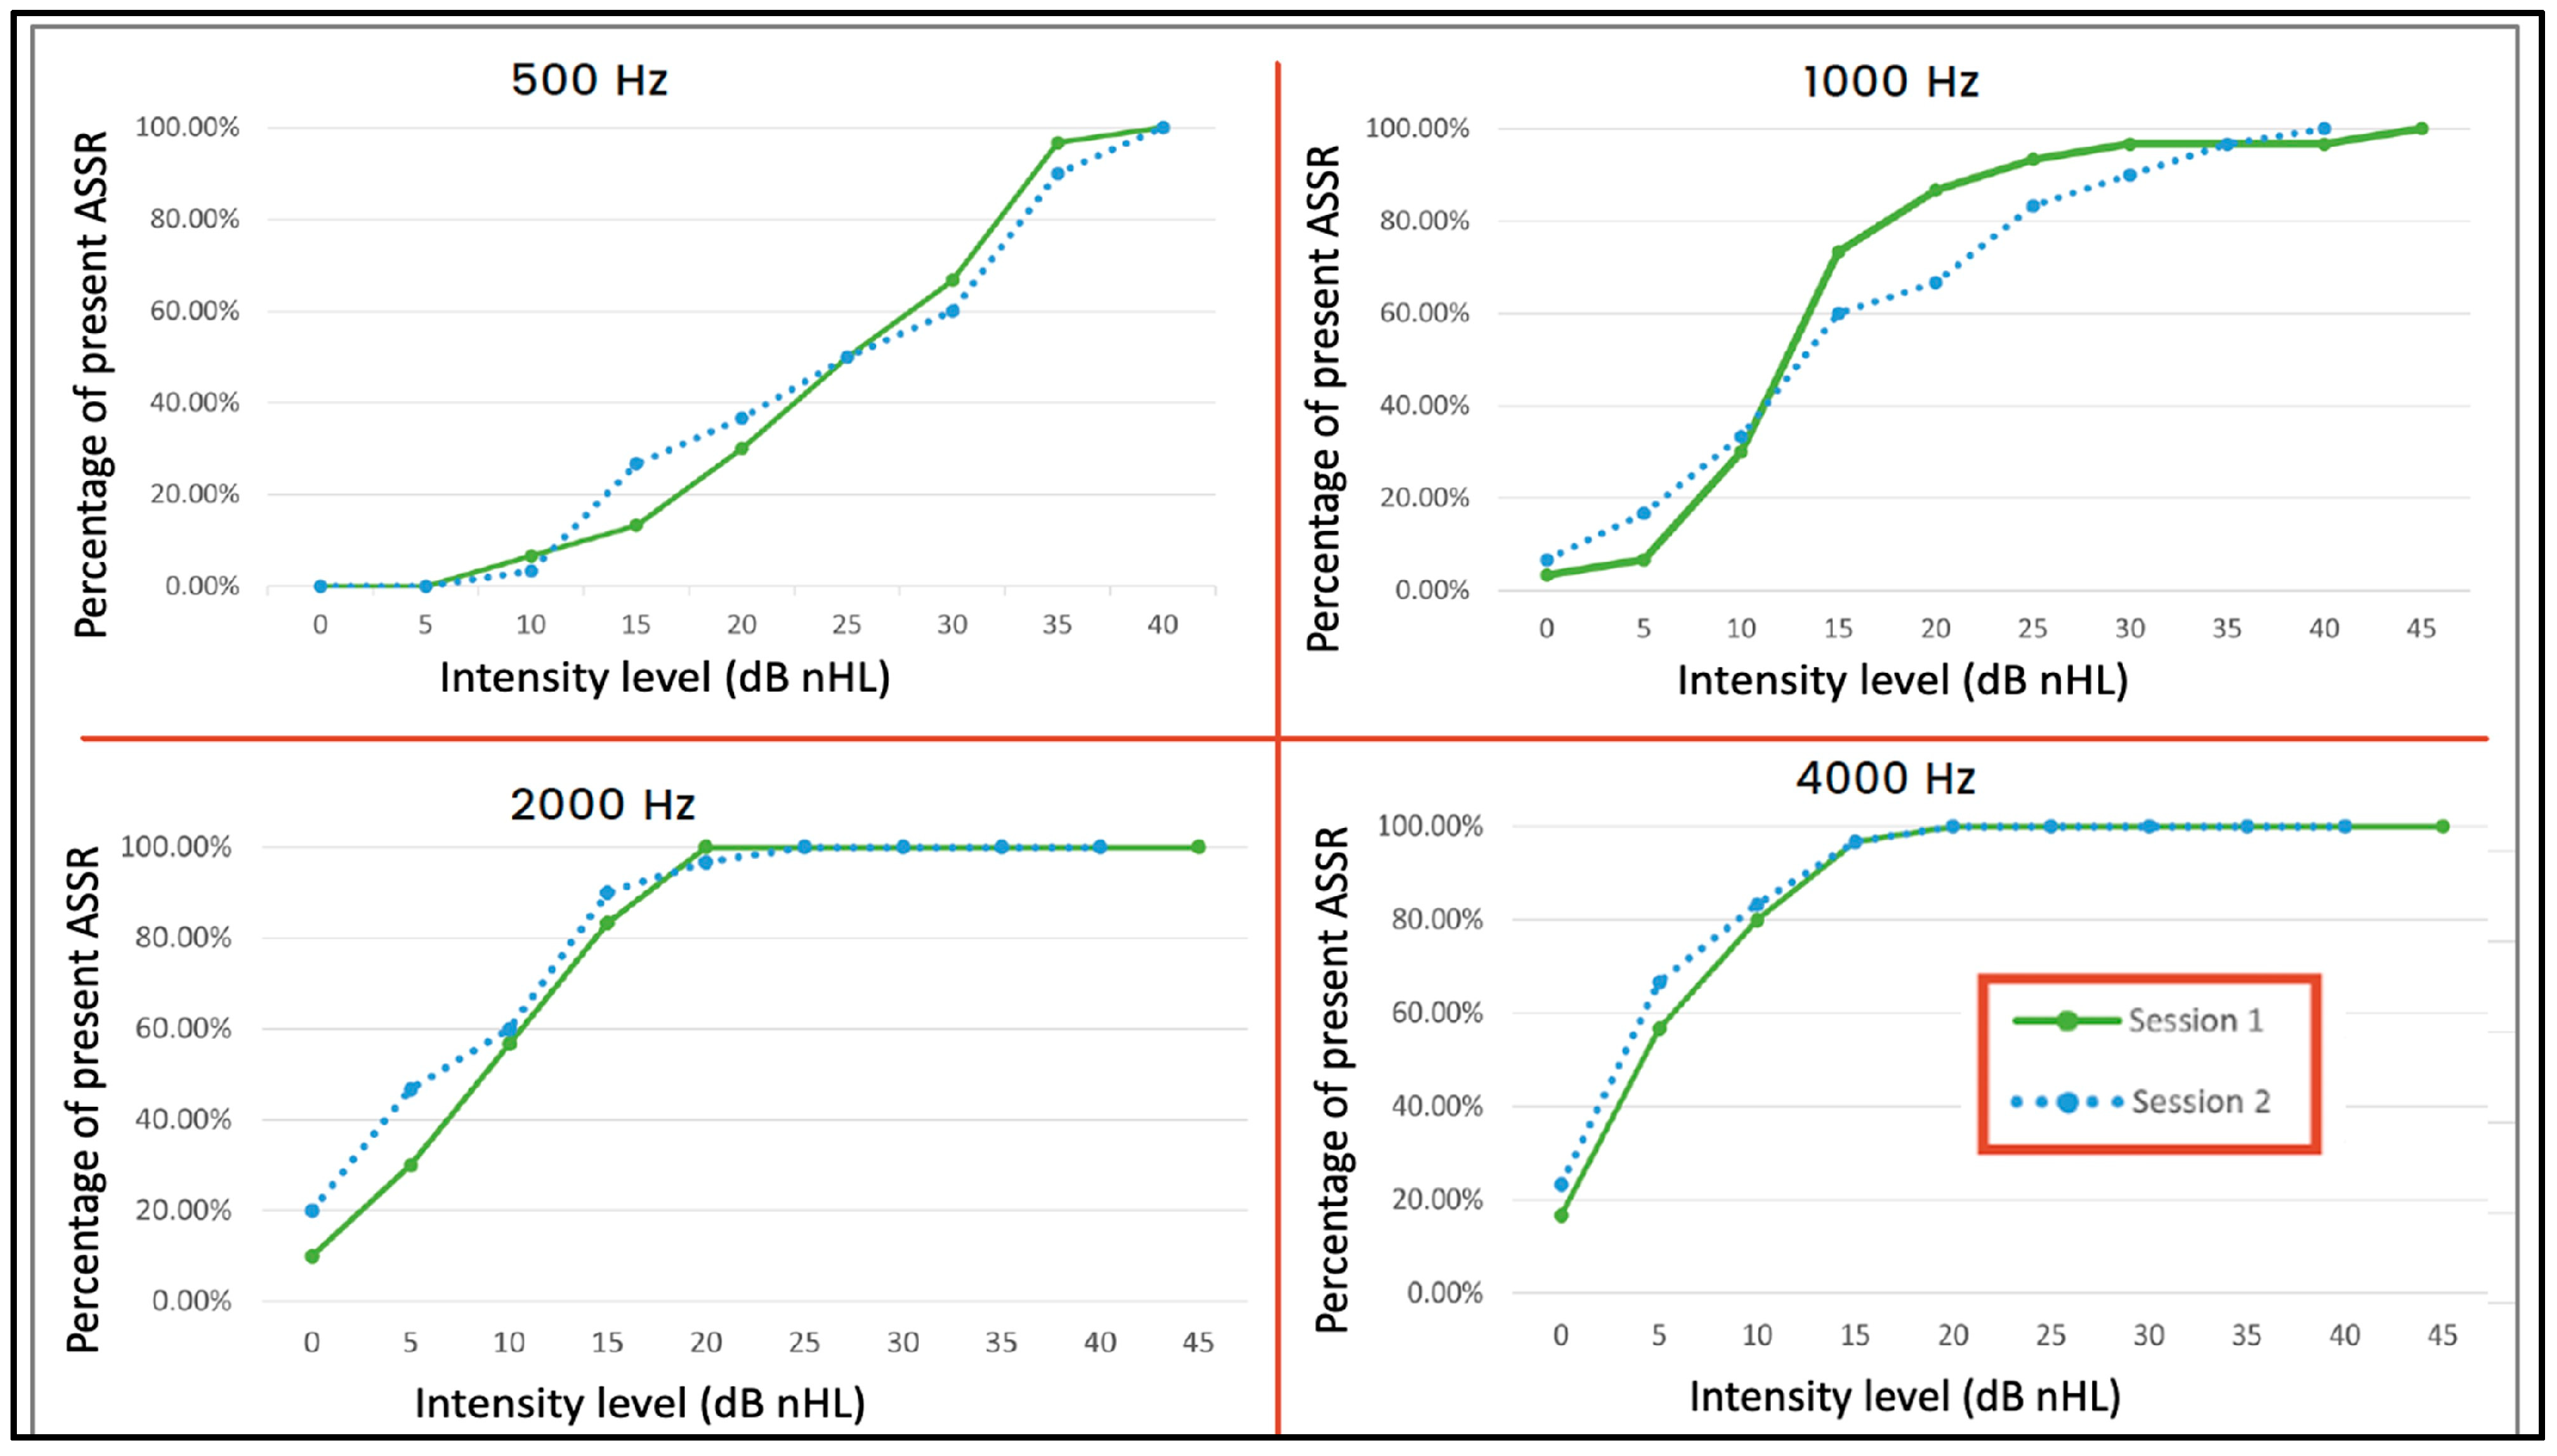
The Eclipse system presented narrow-band (NB) CE-chirp LS stimuli with different center frequencies and fast repetition rates around 90 Hz. For a 6 min recording at a 90 Hz repetition rate, a total of 32,400 stimuli presentations were administered (90 stimuli per second, resulting in 32,400 stimuli over 6 min). For a 9 min recording, it corresponded to 48,600 sweeps, and for the maximum duration of 12 min, the recording consisted of 64,800 stimuli. As the stimuli were presented in the order of tens of thousands, the determination was made to adhere to the accuracy setting to a p-value of ≤0.01. Also, an initial pilot study comparing the accuracy method (p ≤ 0.01) and the speed method (p ≤ 0.05) did not reveal any significant discrepancies, except for thresholds 5 dB lower with the accuracy method at a few individual frequencies.
2.6. Data Analysis
Statistical analyses were performed using Microsoft Excel and SPSS (version 27.0; Armonk, NY: IBM Corp). Pearson product-moment correlation was employed to assess the relationship between ASSR thresholds obtained during sessions 1 and 2, as well as the relationship between the difference in ASSR thresholds between sessions and the difference in residual noise levels at the threshold. To investigate the association between test–retest threshold measurements and frequency, three separate two-way (frequency x session) ANOVAs were performed on the ASSR threshold, behavioral pure-tone threshold, and the difference between the ASSR and behavioral thresholds. Additionally, a separate two-way ANOVA analysis was conducted to compare the differences in thresholds between sessions 1 and 2 for different testing methods (ASSR and behavioral pure-tone threshold) and frequencies. Before conducting statistical inference, the assumptions of normality and homogeneity of variance were assessed using Levene’s test and visual inspection of normality plots. The data were found to meet the assumptions of normality and homogeneity of variance, thereby fulfilling the requirements for statistical inference. For all post hoc multiple comparisons, a Bonferroni significance level was employed with α set at 0.05.
To determine the likelihood of a repeated measurement falling within a specific range, we use a measure called the standard error of measurement (SEM). The SEM provides an estimate of the standard deviation of test–retest measurements conducted on an individual [
27]. It is important to note that the SEM is distinct from the standard error of the mean (SE). Previous studies on the reliability of ASSR have also reported SEM values [
17]. To calculate the SEM, we divide the standard deviation of the differences observed between the test and retest sessions by the square root of 2. Typically, a range of ±1 SEM covers about 68% of the variability. Additionally, a range of ±1.96 SEM (referred to as “2 SEM” for simplicity) represents a 95% variability range. For instance, if the 2 SEM value is 5 dB, it means that there is a 95% chance that the test and retest values would fall within a 5 dB range. This information is highly valuable in clinical audiological monitoring.
4. Discussion
The primary objective of this pilot study was to evaluate the test–retest reliability of the next-generation ASSR system using the multiple ASSR technique in the Eclipse system among normal-hearing adults. The results indicated strong test–retest reliability for ASSR across all tested frequencies, including 500, 1000, 2000, and 4000. Notably, the highest reliability was observed at 500 Hz, which differs from previous studies that studied the test–retest reliability using the old-generation ASSR [
5,
17,
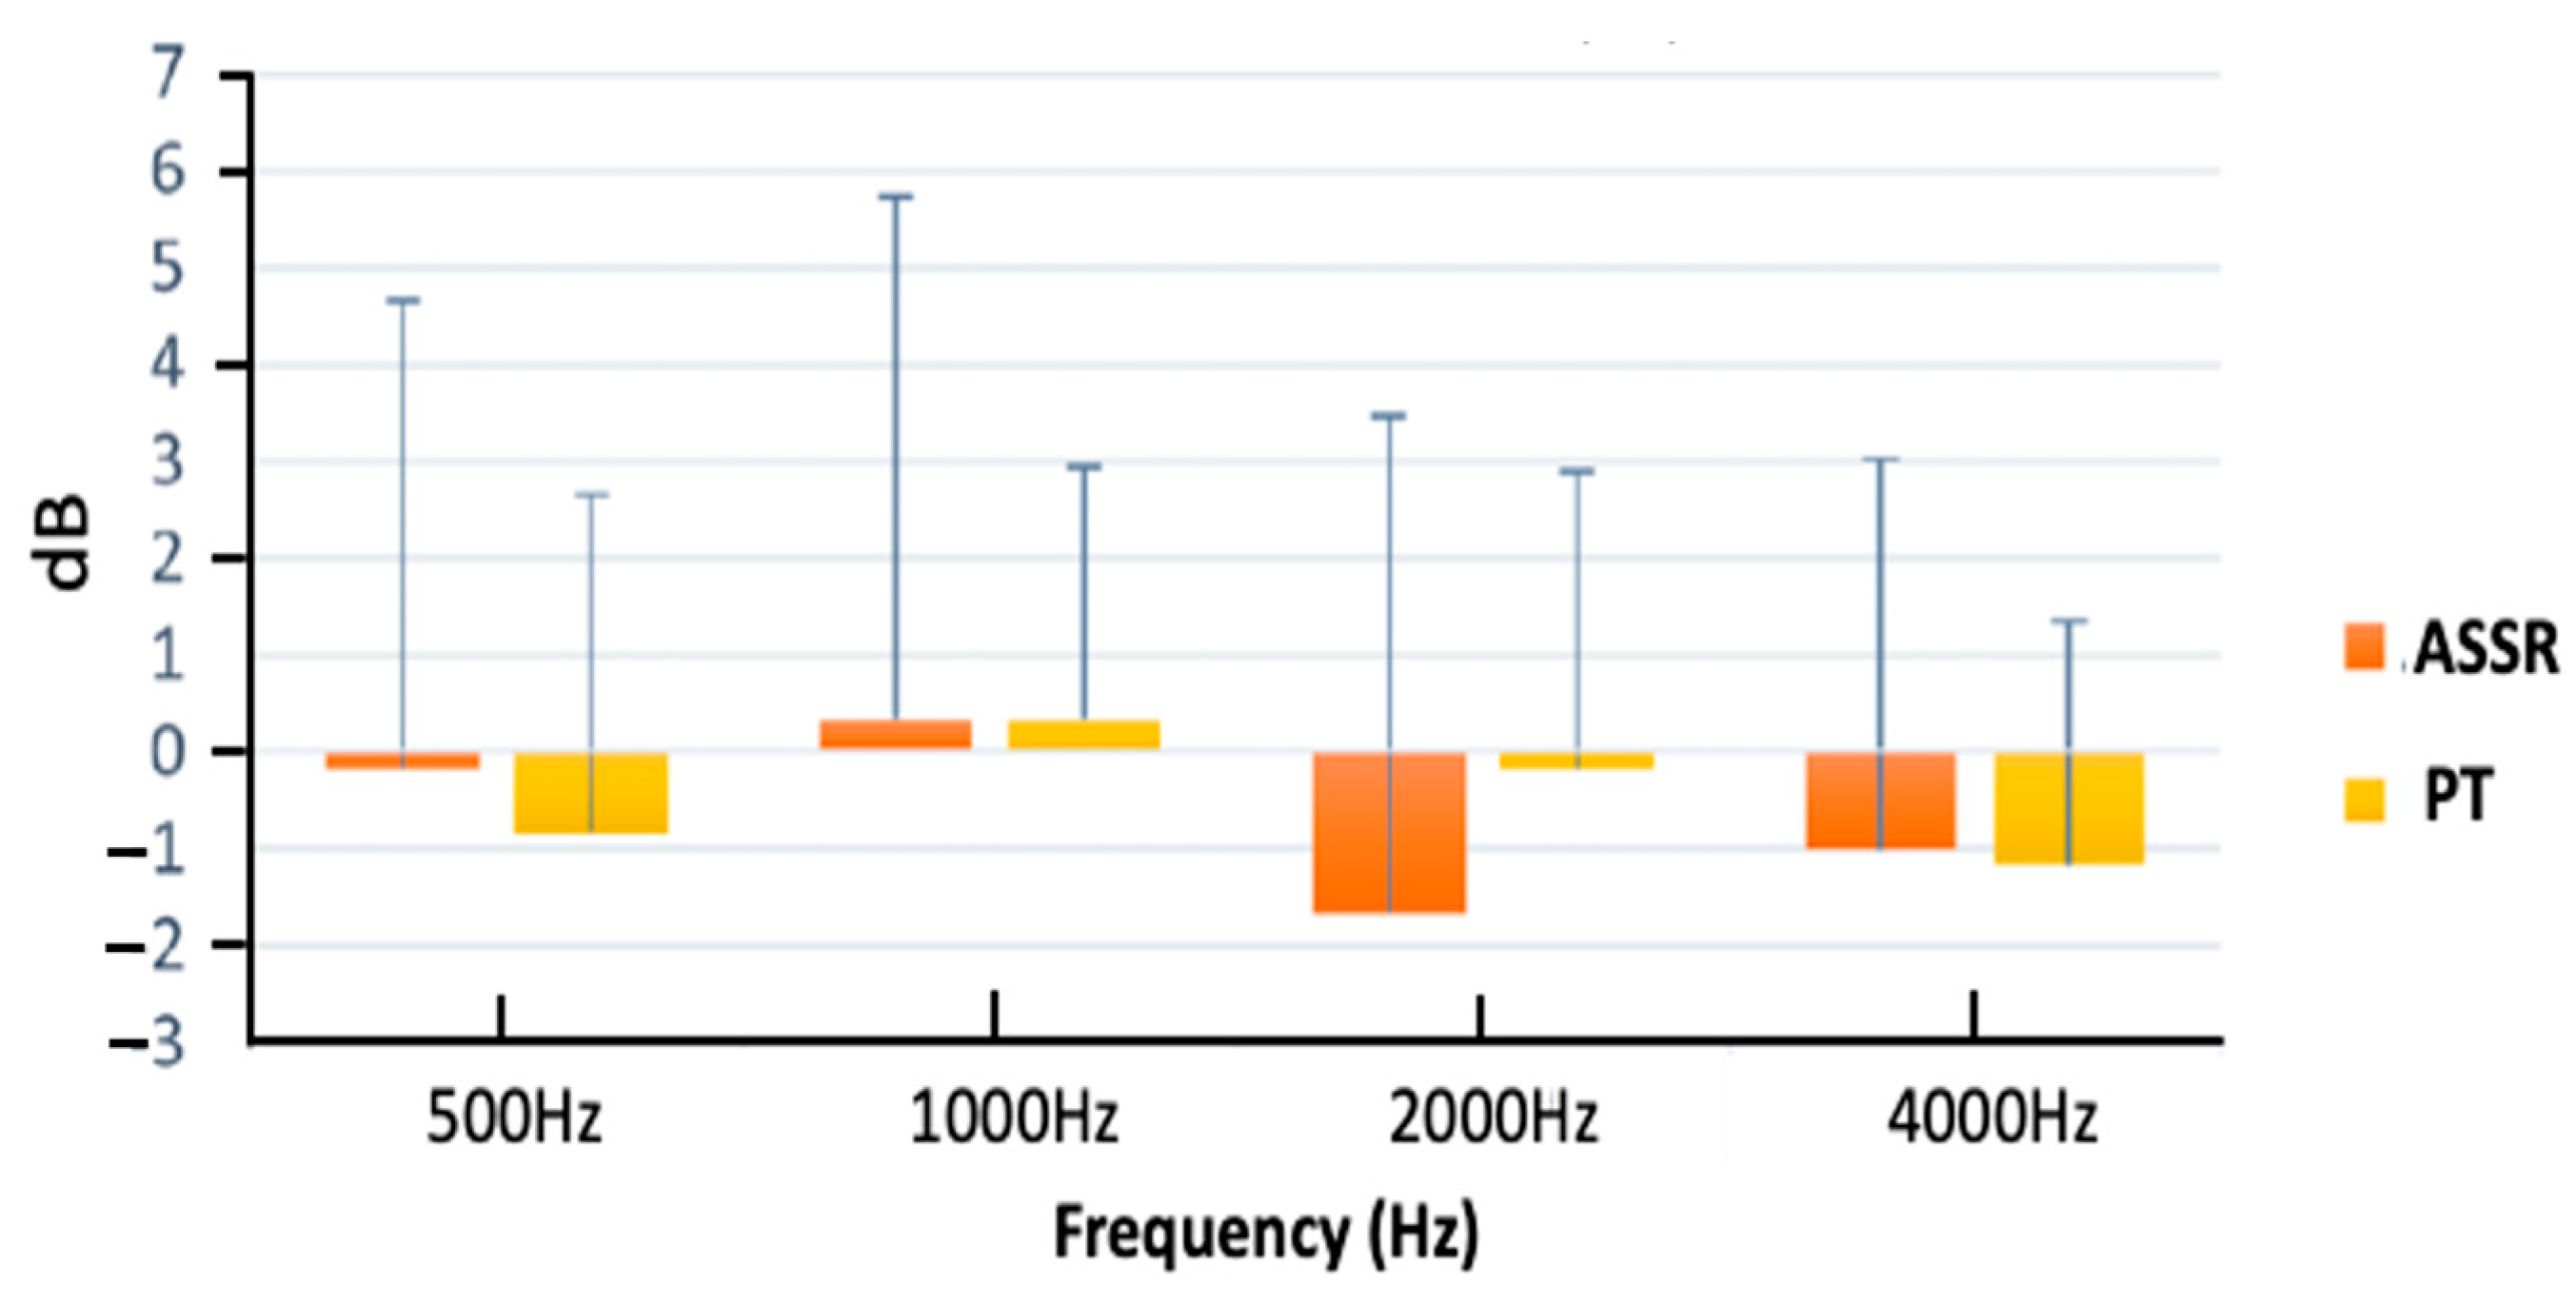
18]. Additionally, no significant correlation was found between the difference in ASSR residual noise levels at the threshold and the difference in ASSR thresholds between sessions across all frequencies. Although the mean test–retest variability of ASSR was similar to behavioral pure-tone thresholds, the ±2 SEM (95% probability that the threshold would be repeated within this range) values were within a range of 5 dB for behavioral pure-tone thresholds and 10 dB for ASSR thresholds, suggesting that the intra-subject variability is higher for ASSR than for pure-tone thresholds.
4.1. ASSR Test–Retest Reliability
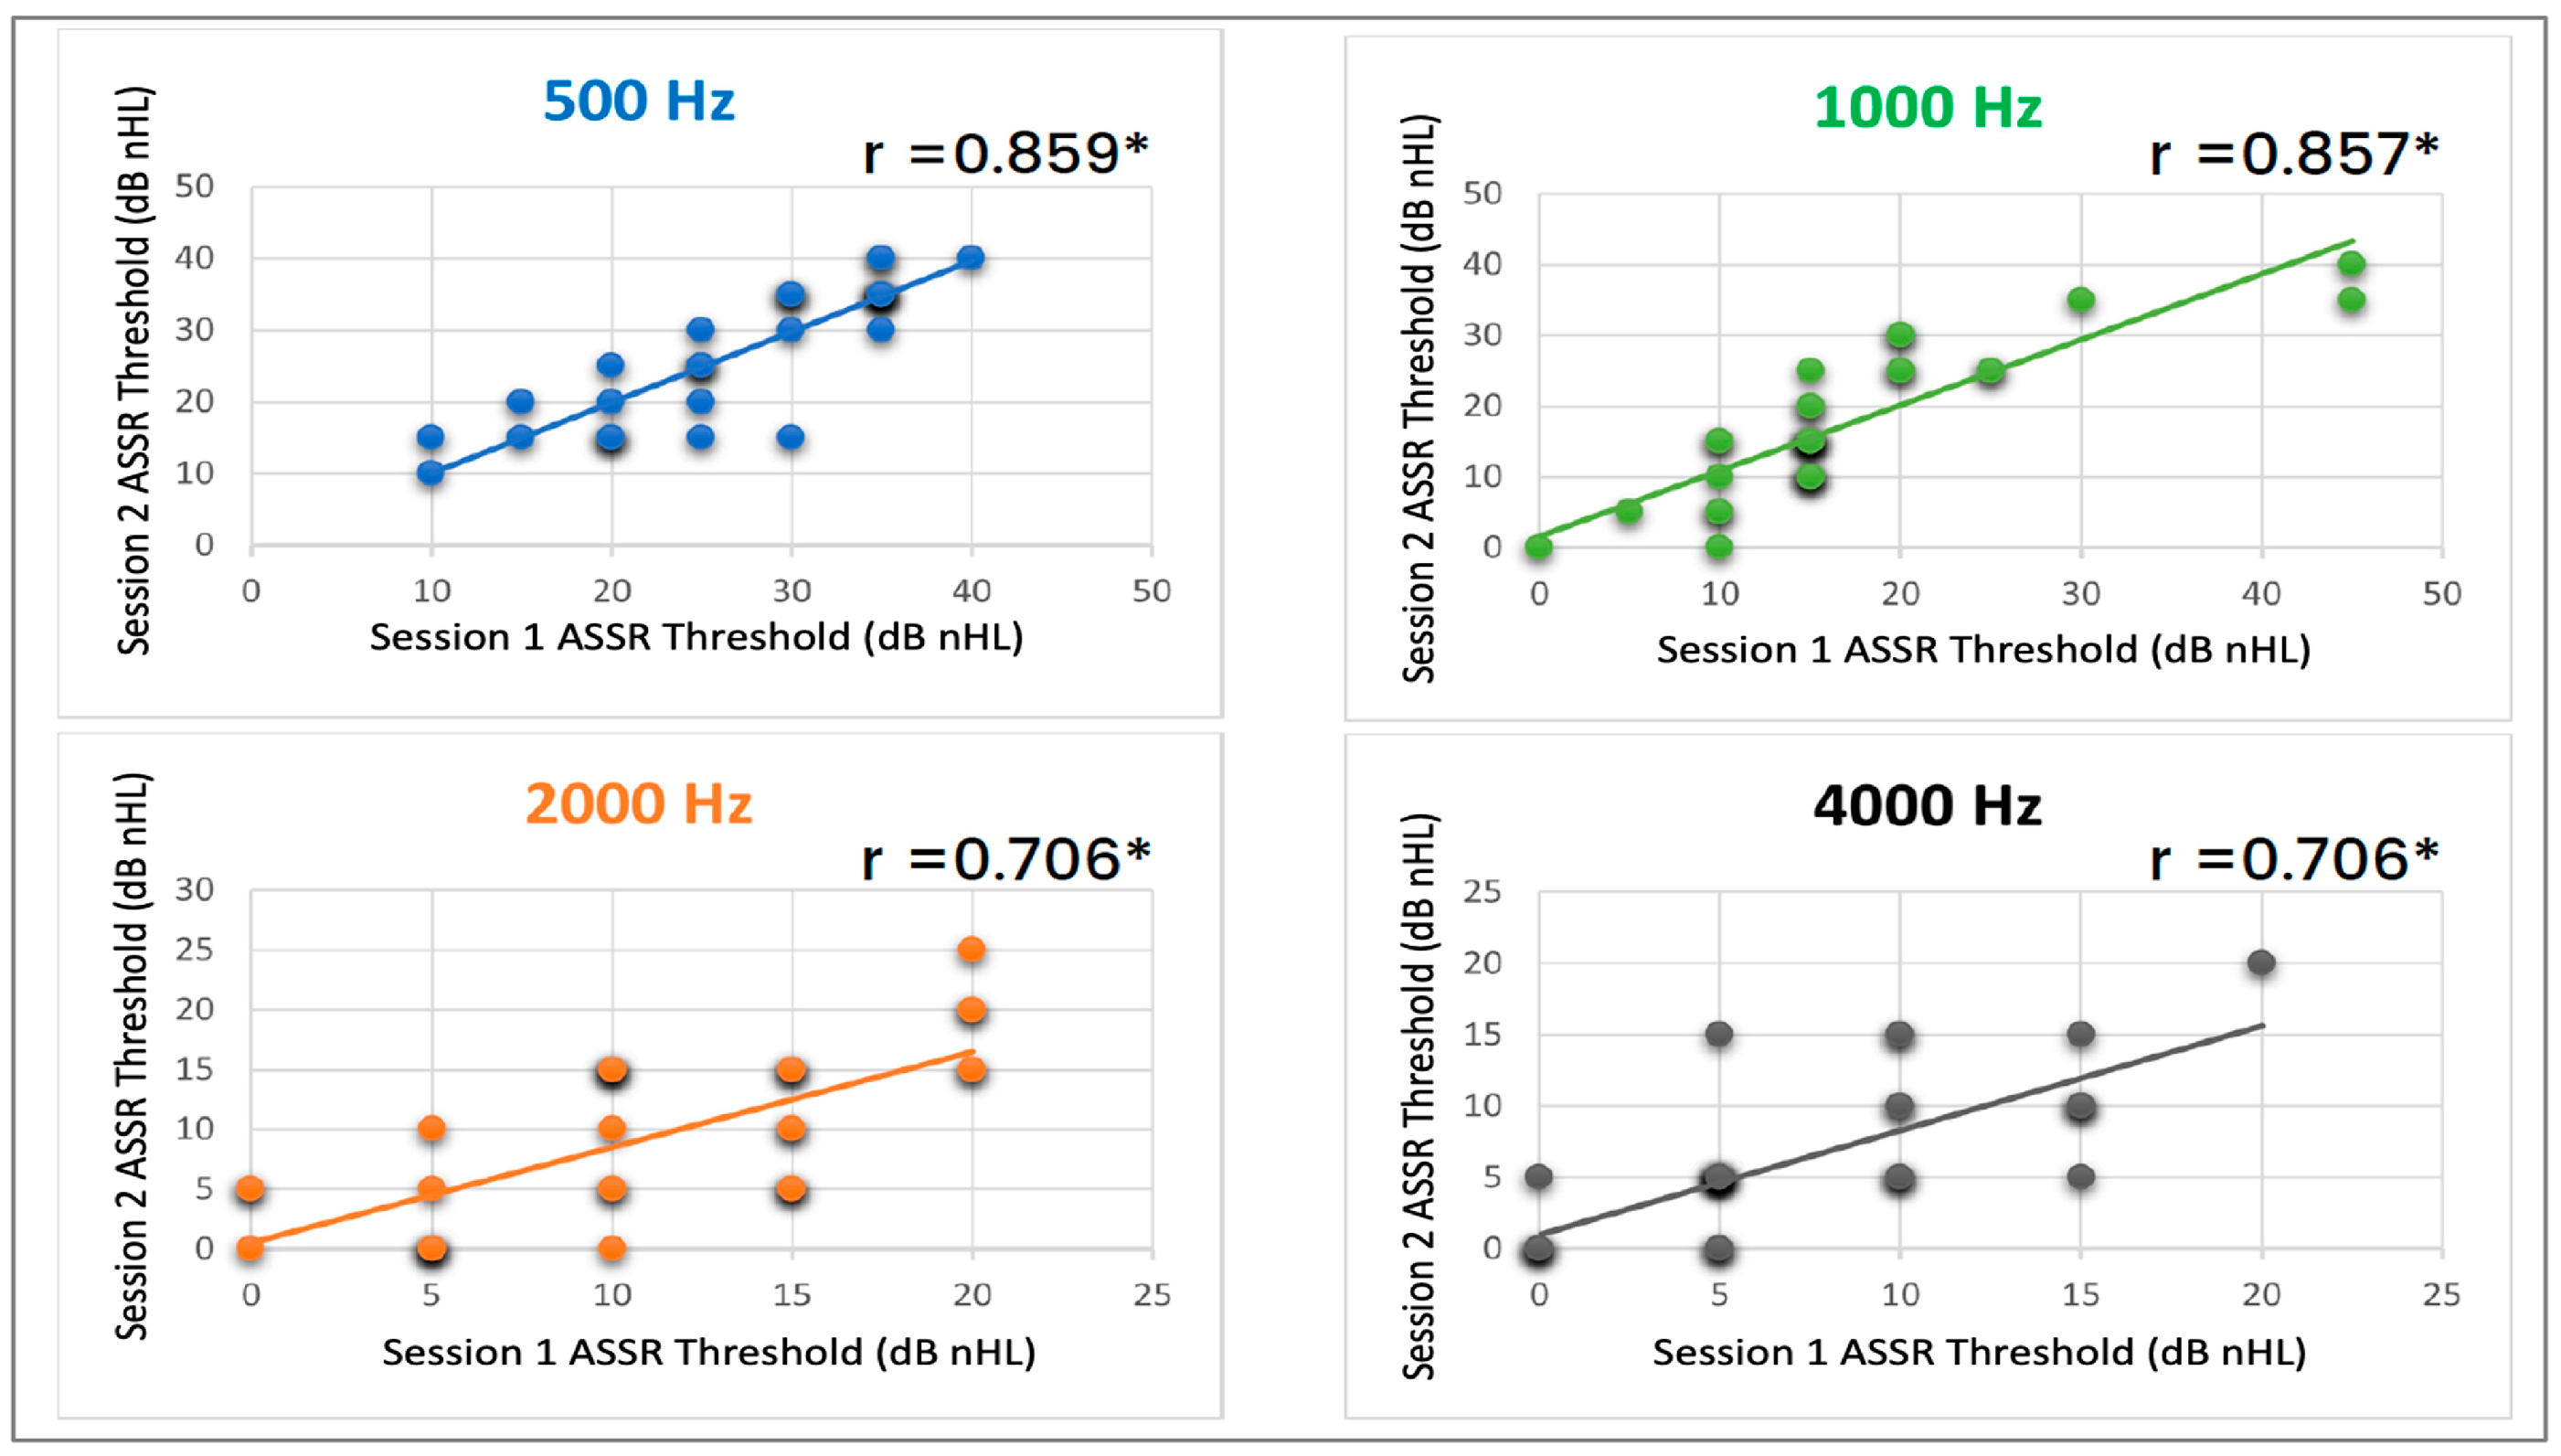
In the present study, the Pearson correlation coefficients for the air conduction ASSR thresholds ranged from 0.706 to 0.859 across the four center frequencies (500–4000 Hz), with 2000 Hz showing the weakest and 500 Hz showing the strongest correlation. The correlation between the test–retest ASSR thresholds was statistically significant across all frequencies. These findings indicate a strong relationship between the thresholds obtained in sessions one and two. Luts and Wouters [
5], Kaf et al. [
18], and D’haenens et al. [
17] reported moderately strong test–retest reliability for ASSR at 1000, 2000, and 4000 Hz and weaker test–retest reliability at 500 Hz. Overall, the findings of the current study are similar to previous studies using old-generation ASSR for 1000 Hz, 2000 Hz, and 4000 Hz, whereas improvement in test–retest reliability from weak to strong reliability is observed for 500 Hz.
The improved test–retest reliability observed with the new-generation ASSR can be attributed to several factors. Firstly, the utilization of a narrow-band CE-chirp stimulus in this new system generates larger amplitude responses even at lower intensity levels [
28,
29]. However, the Eclipse clinical system does not provide the amplitude of ASSR, preventing a direct comparison between the amplitudes of the old- and new-generation ASSR. Therefore, an interesting future investigation would involve comparing the amplitudes of ASSR using the old-generation amplitude or mixed modulated stimuli with the chirp family stimuli of the next-generation ASSR across different intensity levels. This data would provide insights into the contributing factors that lead to improved thresholds and test–retest reliability observed with the next-generation ASSR. A second contributing factor to the enhanced test–retest reliability lies in the differences in the nature of ASSR analysis between the old- and new-generation systems. The old-generation ASSR relied on amplitude or phase analysis solely at the modulation frequency [
1,
2], whereas the Eclipse system incorporates a multi-harmonic detector analysis that examines both the amplitude and phase of the fundamental frequency (repetition rate) as well as higher harmonics (up to 12 harmonics) [
3,
4]. This multi-harmonic statistical analysis likely contributes to a more reliable threshold determination between sessions.
The third factor pertains to the threshold determination criteria. Previous studies assessing ASSR test–retest reliability typically employed a criterion of
p ≤ 0.05 to determine the presence of ASSR [
5,
17,
18]. However, this study utilized a more stringent criterion of
p ≤ 0.01. This strict criterion may have led to reduced residual noise levels and a consistent ASSR threshold between sessions, thereby contributing to improved test–retest reliability.
4.2. Relationship between Residual Noise Levels at the Threshold and ASSR Threshold Difference between Sessions
The residual noise level in a recording is influenced by factors such as baseline EEG activity, muscle noise, and the test duration. Through the use of narrow-band filtering and spectral averaging techniques, background noise with components at all frequencies can be filtered out, leading to an improvement in the signal-to-noise ratio. To investigate whether residual noise levels recorded during the testing could be responsible for the observed test–retest differences, the differences in residual noise levels at the threshold between session two and session one was compared to the differences in thresholds between session two and session one for each carrier frequency. The data analysis revealed no significant correlation between the variability in residual noise levels and the variability in thresholds across sessions for frequencies ranging from 500 Hz to 4000 Hz. There are no directly comparable published data regarding the relationship between differences in residual noise levels and threshold differences. However, a previous study conducted by Wilding et al. [
20] compared the amplitude of the ASSR measured in dB levels referenced to adjacent noise bins. They reported high variability in the ASSR amplitude between test sessions, which affected test–retest consistency. Wilding et al. [
20] further discussed that the variability in the amplitude of the ASSR is related to the variability in noise levels, as the amplitude of the ASSR is computed with reference to the noise levels in adjacent bins. Based on the findings of this study, it can be concluded that the test–retest variability observed in ASSR thresholds is not influenced by variations in residual noise levels.
4.3. Test–Retest Reliability Comparison between Pure-Tone Thresholds and ASSR Thresholds
The findings of the current study suggest that the mean test–retest variability for ASSR and behavioral pure-tone thresholds is comparable. However, there is greater variability observed in ASSR thresholds compared to behavioral pure-tone thresholds. For behavioral pure-tone thresholds, the ±2 SEM range (representing a 95% probability that the threshold will fall within this range) is within ±5 dB HL, whereas for ASSR recordings, it is within ±10 dB nHL. These higher ±2 SEM values for ASSR compared to pure-tone threshold results align with the findings reported by D’haenens et al. [
17], although the comparison is not explicitly discussed in this study. The data from D’haenens et al. [
17] suggest similar mean test–retest variability between ASSR and behavioral pure-tone thresholds. However, there are differences in the ±2 SEM values between D’haenens et al. [
17] and the current study, with D’haenens et al. [
17] showing nearly double the values for both ASSR and behavioral pure-tone thresholds compared to the present research. The reasons for these higher ±2 SEM values of ±10 dB HL for behavioral pure-tone thresholds reported by D’haenens et al. [
17] are uncertain. It is possible that the higher ±2 SEM values of ±20 dB HL for ASSR, reported by D’haenens et al. [
17], could be attributed to the use of old-generation ASSR, which produces lower amplitude responses, and the utilization of amplitude at modulation frequency for analysis. Wilding et al. [
20] and Israelsson et al. [
10] have also reported such high variabilities in ASSR thresholds due to fluctuations in amplitude and noise levels of the ASSR responses.
It is widely acknowledged that pure-tone audiometry is considered the gold standard for assessing changes in hearing over time, and numerous research studies have attempted to study the test–retest reliability of regular and extended high-frequency pure-tone audiometry [
29,
30,
31,
32]. The SEM reported in this study is comparable to previous research [
29,
30,
31,
32]. The findings of the current study also indicate that ASSR can be a reliable alternative for populations that cannot provide reliable behavioral pure-tone thresholds. The results of this study have significant implications for clinicians and researchers who work with individuals with hearing impairments. The findings suggest that ASSR can be a valuable tool for monitoring hearing changes in individuals who cannot provide reliable behavioral responses, such as infants, young children, or patients with severe cognitive or motor disabilities. With the use of ASSR, clinicians, and researchers can potentially gain greater insight into the progression of hearing loss and develop appropriate intervention strategies to mitigate its effects. Overall, the study’s findings offer promising support for the use of ASSR in monitoring hearing changes over time. However, further research is needed to validate these results in a larger population of normal-hearing and hearing-impaired individuals.
4.4. Limitations and Future Research
The current pilot study had certain limitations that warrant consideration for future research. Firstly, the sample size of the study comprised only 15 adults (30 ears) with normal hearing. This falls below the recommended threshold of 40 participants for a test–retest study, as suggested by McMillan and Hanson [
33]. To gain a comprehensive understanding of the reliability of ASSR, future studies should include a larger and more diverse population, encompassing both individuals with normal hearing and those with hearing impairments. This would provide the opportunity for a broader assessment of the ASSR system’s performance across different hearing profiles.
Additionally, it is essential to investigate the differences between pediatric and adult populations to better understand the reliability of ASSR in each group. Children possess distinct physiological characteristics and developmental profiles, which may influence the reliability of ASSR measurements. One aspect to consider is the variance in baseline EEG levels between children and adults. Children’s baseline EEG levels may differ from those of adults. These variations could potentially impact the reliability of ASSR measurements, particularly when using the fast repetition rate ASSR implemented in the Eclipse system. Therefore, it is imperative to conduct future research specifically aimed at comparing the test–retest reliability of ASSR between pediatric and adult populations. By examining age-related differences, researchers can determine the influence of age-related factors on the reliability of ASSR measurements. Moreover, the adaptive properties of the auditory system may differ between children and adults, especially in response to the fast repetition rate utilized in the Eclipse system. Children’s auditory systems exhibit ongoing maturation and plasticity, which could affect their response to auditory stimuli and, subsequently, the reliability of ASSR measurements. Therefore, a focused investigation comparing the test–retest reliability of ASSR between pediatric and adult populations is warranted. This research would provide valuable insights into any age-related differences and enable a more accurate evaluation of the reliability of ASSR in each group.
Significant variations can be observed in the outcomes obtained from different commercially available ASSR acquisition systems, as pointed out by Hatzopoulos et al. [
34]. Consequently, it is crucial to conduct a comparative analysis between the results obtained from the next-generation ASSR implemented in Eclipse and the older-generation ASSR systems, as well as other commercially available systems. Another limitation of the study is the lack of availability of amplitude and phase coherence information for ASSR measurements in the Eclipse clinical system. This limitation prevented direct comparisons between the amplitudes and phase coherence information of the older and newer generation ASSR systems. To address this limitation, an intriguing avenue for future investigation would involve comparing the amplitudes of ASSR using the older-generation amplitude or mixed modulated stimuli with the chirp family stimuli of the next-generation ASSR across various intensity levels. Such research would provide valuable insights into the specific factors contributing to the improved thresholds and test–retest reliability observed with the next-generation ASSR.
In summary, future studies should aim to overcome the limitations of the current research by including larger and more diverse participant samples, exploring pediatric-adult differences, and conducting comparative investigations on the amplitude of ASSR using different stimuli. By addressing these areas, researchers can further enhance our understanding of the reliability and potential applications of the next-generation ASSR system.


