
Effective Vowel Stimuli for Measuring Occlusion Effect in the Pediatric Population


1
Department of Audiology, JSS Institute of Speech and Hearing, Mysuru 570004, Karnataka, India
2
Department of Speech-Language Pathology, JSS Institute of Speech and Hearing, Mysuru 570004, Karnataka, India
*
Author to whom correspondence should be addressed.
J. Otorhinolaryngol. Hear. Balance Med. 2023, 4(2), 7; https://doi.org/10.3390/ohbm4020007
Submission received: 19 June 2023
/
Revised: 8 August 2023
/
Accepted: 14 August 2023
/
Published: 17 August 2023
Abstract
:Past studies have reported that there are higher sound-pressure levels for each vowel in a child’s ear canal than those in adults due to reduced volume and a shorter ear canal. Furthermore, longer vocal tracts are associated with lower formant frequencies, and vice versa. The structural differences in this regard may reflect the difference in the occlusion effect. Thus, the present study compares the sound pressure levels (SPLs) and first formant frequencies of children and adults with normal hearing and determines the best vowel stimulus to assess the occlusion effect. A repeated measures research design was utilized to investigate the best stimulus with which to measure the occlusion effect among children and adults. Group 1 included ten children, and Group 2 comprised ten adults with normal hearing. The SPLs at frequencies between 200 Hz and 1000 Hz for three uttered vowels, with steps of 100 Hz, were measured using a hearing aid analyzer. The recorded vowels were saved in a ‘.wav’ format for formant frequency analysis. Furthermore, a paired comparison method was used to identify the vowel stimulus that most effectively induced the occlusion effect. A significantly higher SPL was observed for children compared to adults for each vowel. The formant frequency F1 value was higher for children than adults for each vowel, constituting a significant finding. In the paired comparison, the occlusion effect was reported to be significantly greater with respect to the vowel /u/ among adults, while it was reported to be greater in relation to the vowel /i/ among children. The vowel /u/ was the best stimulus with which to assess the occlusion effect among adults. The vowel /i/ was the best stimulus with which to assess the occlusion effect among children.
1. Introduction
The occlusion effect (OE) is a phenomenon caused by improved bone conduction of sound when the ear canal is blocked [1]. Authors have described the occlusion effect as the perception of an individual’s own voice when the ear canal is completely or partially occluded [2]. In occluded conditions, few people experience a significant increase in loudness with respect to self-generated sounds such as vocalization, chewing, and swallowing compared to unoccluded conditions [3]. During speaking, the vocal fold vibrations or speech output are delivered to the cartilaginous portions of the ear canal via bone conduction [4] through the skull bones [5]. The movement of articulators causes the air particles in the occluded ear canal to vibrate, especially at low frequencies [2], thereby amplifying the sound by 20 to 30 dB or more [6]. Authors have reported that closing the external auditory canal improves the hearing threshold by around 10 decibels [7].
The occlusion effect frequently creates problems, especially among hearing aid wearers with low-frequency hearing thresholds of less than 50 dB HL [4]. Low-frequency sounds have larger wavelengths, so they are trapped inside an occluded ear canal. These low-frequency sounds trapped inside the occluded ear canal are conducted into the bony portion of the ear canal and pass through the air-conduction path or directly stimulate the cochlea housed in the temporal bone via the vibration of the skull during speaking [8]. Hence, hearing aid wearers who experience the occlusion effect often describe their voice as hollow, booming, akin to speaking in a drum or a tunnel, and/or echo [9]. According to a previous literature review [10], most hearing aid users often complain about the unnatural sound quality of their voice and the presence of other vegetative sounds, such as chewing and swallowing. In one study, researchers reported that only 70% of hearing aid users were satisfied with the sound quality of their voices, and others reported discomfort with respect to wearing hearing aids due to the sound quality of their voices [11].
Researchers have demonstrated the disparities in the occlusion effect between different vowels. A lower-level occlusion effect was noted for the open vowel /a/. However, the retracted vowel /i/ and puckered /u/ vowel were associated with more significant occlusion effects. The vibrations produced in the jaw are relatively weak for open vowels like /a/ but intense for closed vowels such as /i/ and /u/ [6]. This difference is caused by the high back pressure created during vocalization; that is, the increased ear canal sound pressure level (SPL) during the occlusion effect was relatively more intense for /i/ (142 dB SPL) and /u/ (138 dB SPL) compared to /a/ (116 dB SPL) [6]. These differences in the occlusion effect can also be attributed to the differences in the formant frequencies between these three vowels. The first formant frequency variation is principally related to tongue height during vowel articulation [12,13,14]. The first formant frequency is relatively lower for the high vowels /i/ and /u/ than for the low vowel /a/ [15]; therefore, the lower formant frequencies of the vowels/i/ and /u/ can contribute to higher occlusion effects for these vowels compared to the vowel /a/. Authors have investigated the occlusion effect among adults using the vowels /e/ and /i/ and revealed that the maximum occlusion effect was 19.10 dB for the vowel /i/ [16].
Only a few studies measuring the occlusion effect among infants have been conducted. Researchers have reported the absence of an occlusion effect among infants younger than six months due to their smaller ear volume and shorter ear canal length. This difference is related to the increased low-frequency sound pressure when the ear canal is occluded [17]. A recent review reported that infants had lower middle ear compliance and higher middle ear resistance than adults, and they had much less power transfer into the middle ear when their ears were occluded. Further, an infant’s compliant ear canal wall may absorb low-frequency energy trapped in the occluded ear; thus, there is no net increase in energy to stimulate the cochlea [18]. All these factors might result in infants experiencing a less potent occlusion effect.
The occlusion effect is well understood among adults and infants. However, there is a great need to determine an effective vowel stimulus with which to assess the occlusion effect among children. On the other hand, vocal tract length has been considered the second largest source of formant frequency variability [19]. The relationship between the length of the vocal tract and the position of the formant or the formant frequencies has been well established. Longer vocal tracts are associated with lower formant frequencies, and shorter vocal tracts are associated with higher formant frequencies [14,20]. Therefore, children generally have a shorter vocal tract, with higher formant frequencies, whereas adults have comparatively longer vocal tracts and present lower formant frequencies than children [14]. Thus, it can be hypothesized that the occlusion effect for children might differ from that experienced by adults.
Therefore, the present study aimed to determine an effective vowel stimulus with which to assess the occlusion effect among children. The objectives of the present study were (a) to compare the sound pressure levels between children and adults with normal hearing at low frequencies (200 to 1000 Hz in steps of 100 Hz) generated in the ear canal with an otoblock condition when vowels are produced with normal vocal exertion (at 65 dB SPL intensity), (b) to compare the first formant frequencies (F1) between children and adults with normal hearing using the stimulus waveform captured in the ear canal with an otoblock condition when vowels are produced with a normal level of vocal effort, and (c) to ascertain the best stimulus (vowel) for producing an occlusion effect using a paired comparison method among both children and adults with normal hearing.
2. Materials and Methods
A repeated measures research design was utilized to investigate the best stimulus with which to measure the occlusion effect among children and adults with normal hearing.
2.1. Participants
Two groups of participants were included in the study. Group 1 included ten children with normal hearing sensitivity between five and nine years of age (mean age = 7.6 years and SD = 1.37). Group 2 comprised ten adult participants with normal hearing sensitivity (mean age = 19.5 years and SD = 3.43). All the participants had ear canals free from debris, foreign bodies, and ear wax. All the participants had normal middle ear statuses and were native speakers of Kannada. The study did not include participants with a physical deformity of the ear.
2.2. Experiment 1—Measuring the Sound Pressure Level and First Formant Frequency of Vowels
2.2.1. Instrumentation
A block diagram of the instruments used to record the sound pressure levels and the first formant frequencies of vowels is displayed in Figure 1. A hearing aid analyzer was used to record the sound pressure level from 200 to 1500 Hz in steps of 100 Hz in each participant’s ear canal. A probe microphone of the hearing aid analyzer (Trumpet, Inventis, Titusville, FL, USA) was inserted into each participant’s ear canal without causing discomfort for the participant. The probe microphone was calibrated. The stimulus in the hearing aid analyzer was set as none, and the reference microphone was deactivated. Further, the speech trainer’s microphone was positioned 12 cm away from the participant’s lips, and the speech trainer’s insert receiver (ER-3A) was placed in the participant’s ear canal to allow us to hear their voice and thus assess the occlusion effect. The output of the hearing aid analyzer was connected to a personal system with the Praat software (version 6.0.21) installed to record the vowels in ‘.wav’ format.
2.2.2. Procedure
Each participant was instructed to vocalize the vowel /a/ with normal vocal effort and an open mouth approach, while the speech trainer’s microphone was placed 12 cm away from the lips of the participant. An SLM was placed one meter from the participant’s position to monitor the intensity level at 65 dB SPL. The output of the speech trainer was delivered through an insert receiver, ER-3A, placed in the participant’s ear canal to listen to their voice. In addition, the probe microphone of the hearing aid analyzer was inserted into the participant’s ear canal to record vowel spectra. Further, the output of the hearing aid analyzer connected to the personal system running Praat software recorded the vowel in ‘.wav’ format. A similar procedure was performed to record the other analyzed vowels (/i/ and /u/).
Analysis: The sound pressure levels at frequencies between 200 and 1000 Hz, in steps of 100 Hz, were noted down from the hearing aid analyzer. . Further, the vowels recorded in the children’s and adult’s ear canals were saved in ‘.wav’ format and imported into the Praat software. The stable part of the vocalized vowel /a/ was selected, and then by choosing the ‘formant frequency’ option, the first formant frequency (F1) of the vowel /a/ was noted in Hz. A similar procedure was performed to extract the first formant frequency for the other analyzed vowels /i/ and /u/.
2.3. Experiment 2—Paired Comparison Method as Used to Determine the Best Vowel with Which to Assess the loudness Reflecting an Occlusion Effect
A paired comparison method was used to determine the optimum stimulus among vowels in terms of producing the occlusion effect. The paired comparison method was used to group the following vowel pairs (/a/ - /i/, /a/ - /u/, and /i/ - /u/). Each study participant was instructed to vocalize each vowel pair ten times using an open-mouth approach. The microphone of the speech trainer was kept at a distance of 12 cm from each participant’s lips [21]. The output of the speech trainer was delivered through the earphone inserted into the participant’s ear canal. The intensity of the articulated vowel was monitored using an SLM placed one meter away from the participant’s mouth. A constant intensity of 65 dB SPL was maintained throughout the vowel articulation process. The intensity in the SLM was displayed to the participant on a monitor to serve as visual feedback. The participant asked to repeat the vowel if the intensity of the vowel was beyond 65 ± 2 dB SPL. Each participant was instructed to report the vowel with the highest loudness between each pair.
Analysis: In some vowel pairs, the first vowel might be louder, while in others, the second vowel might be louder. For illustration, in the vowel pair /i/ and /a/, the first vowel will be relatively louder than the second vowel. However, in the vowel pair /a/ and /u/, the second vowel will be relatively louder than the first vowel. If the participant correctly identified the vowel with higher loudness between /i/ and /a/, a score of one was assigned (e.g., /i/ = 1 and /a/ = 0). As it was a paired alternative forced choice comparison method, both vowels in a vowel pair were never judged to be equally loud by the participants.
2.4. Statistical Analyses
The collected data were analyzed using SPSS software (version 21). MANOVA was performed to determine if there were any significant differences between the groups for each vowel in terms of spectral energy and F1. A similar statistical analysis was performed for each vowel. Repeated measures ANOVA was performed to check for any significant differences in the occlusion effect between vowels in each group.
3. Results
The present study aimed to investigate the best stimulus for measuring the occlusion effect in children and adults with normal hearing. The collected data were analyzed using SPSS software [22].
3.1. Determining the Sound Pressure Level in Each Participant’s Ear Canal
As it can be observed in Figure 2a,b, the results revealed that the sound pressure levels for all three analyzed vowels at most of the frequencies were higher in the children’s ear canals compared to the adults’ ear canals. Therefore, the sound pressure levels were assessed separately for each vowel analyzed.
3.1.1. The Sound Pressure Level of the Vowel /a/ in Participants’ Ear Canals
For the /a/ vowel, higher energy was detected in the children’s ear canals than in those of the adults at each frequency. A MANOVA was performed to determine if there were any significant differences between the groups in terms of spectral energy from 200 to 1000 Hz.
The results revealed a significant difference in the spectral energy of the vowel /a/ between groups from 500 to 1000 Hz in steps of 100 Hz (Table 1). Although the sound energy was higher in children than adults in a frequency range from 200 to 400 Hz, this difference was not statistically significant.
3.1.2. The Sound Pressure Level of the Vowel /i/ in the Participants’ Ear Canals
For the vowel /i/, at each frequency, a higher energy level was found in the children’s ear canals compared to that of the adults. Except for 400 Hz, the results of the MANOVA conducted revealed a significant difference in spectral energy for the vowel /i/ between the groups from 300 to 1000 Hz in steps of 100 Hz (Table 2). Although the sound energy was higher in children than adults in the 200 Hz and 400 Hz frequencies, this difference did not reach significance.
3.1.3. The Sound Pressure Level of the Vowel /u/ in the Participants’ Ear Canals
For the /u/ vowel, higher energy was found in the children’s ear canals than in those of the adults at each frequency. The MANOVA results showed a significant difference in spectral energy for the vowel /u/ between the groups. There was a significant difference between groups pertaining to the vowel /u/ from 300 to 1000 Hz in steps of 100 Hz (Table 3). Although the sound energy was higher in children than adults at a frequency of 200 Hz (100 Hz in step size), this difference did not reach significance.
3.2. Comparison of First Formant Frequencies of Vowels /a/, /i/, and /u/
The vowels recorded in the children’s and adults’ ear canals are displayed in Figure 3a and Figure 3b, respectively. As it can be noted from Figure 3a,b, there were differences in the F1 values of all three of the vowels in question between children and adults. The F1 was higher for children than adults for each vowel (/a/, /i/, and /u/). As can be noted by referring to Table 4, for the children, the F1 value was highest for the vowel /a/, followed by the vowel /u/ and the vowel /i/. A similar pattern was noted with regard to the adults. The MANOVA results revealed a significantly higher F1 frequency among children than adults for the vowel /i/ (F(1,18) = 18.747, p = 0.001). A similar result was seen for the vowel /u/ (F(1,18) = 6.949, p = 0.017). However, there were no significant differences in the F1 frequency between groups regarding the vowel /u/ (F(1,18) = 6.949, p = 0.017).
A paired comparison method was used to find the best vowel with which to measure the occlusion effect in children and adults.
As shown in Figure 4, among the adults, the greatest occlusion effect was observed for the vowel /u/, followed by the vowel /i/ and then the vowel /a/. A repeated measures ANOVA was performed to determine whether there were any significant differences in the perceived effect of occlusion between the vowels /a/, /i/, and /u/ for adults. The results revealed a significant difference in the occlusion effect between vowels (F(2,18) = 10.50, p = 0.001). To determine the vowel for which the occlusion effect was observed, a post hoc Bonferroni test was performed. It was noted that there were no significant differences in the occlusion effect between the vowel pairs /a/ and /i/ (p = 0.923) and /i/ and /u/ (p = 0.058) for adults. However, a significant difference in perceived occlusion was found between the vowel pair and /a/ and /u/ (p = 0.004) for adults.
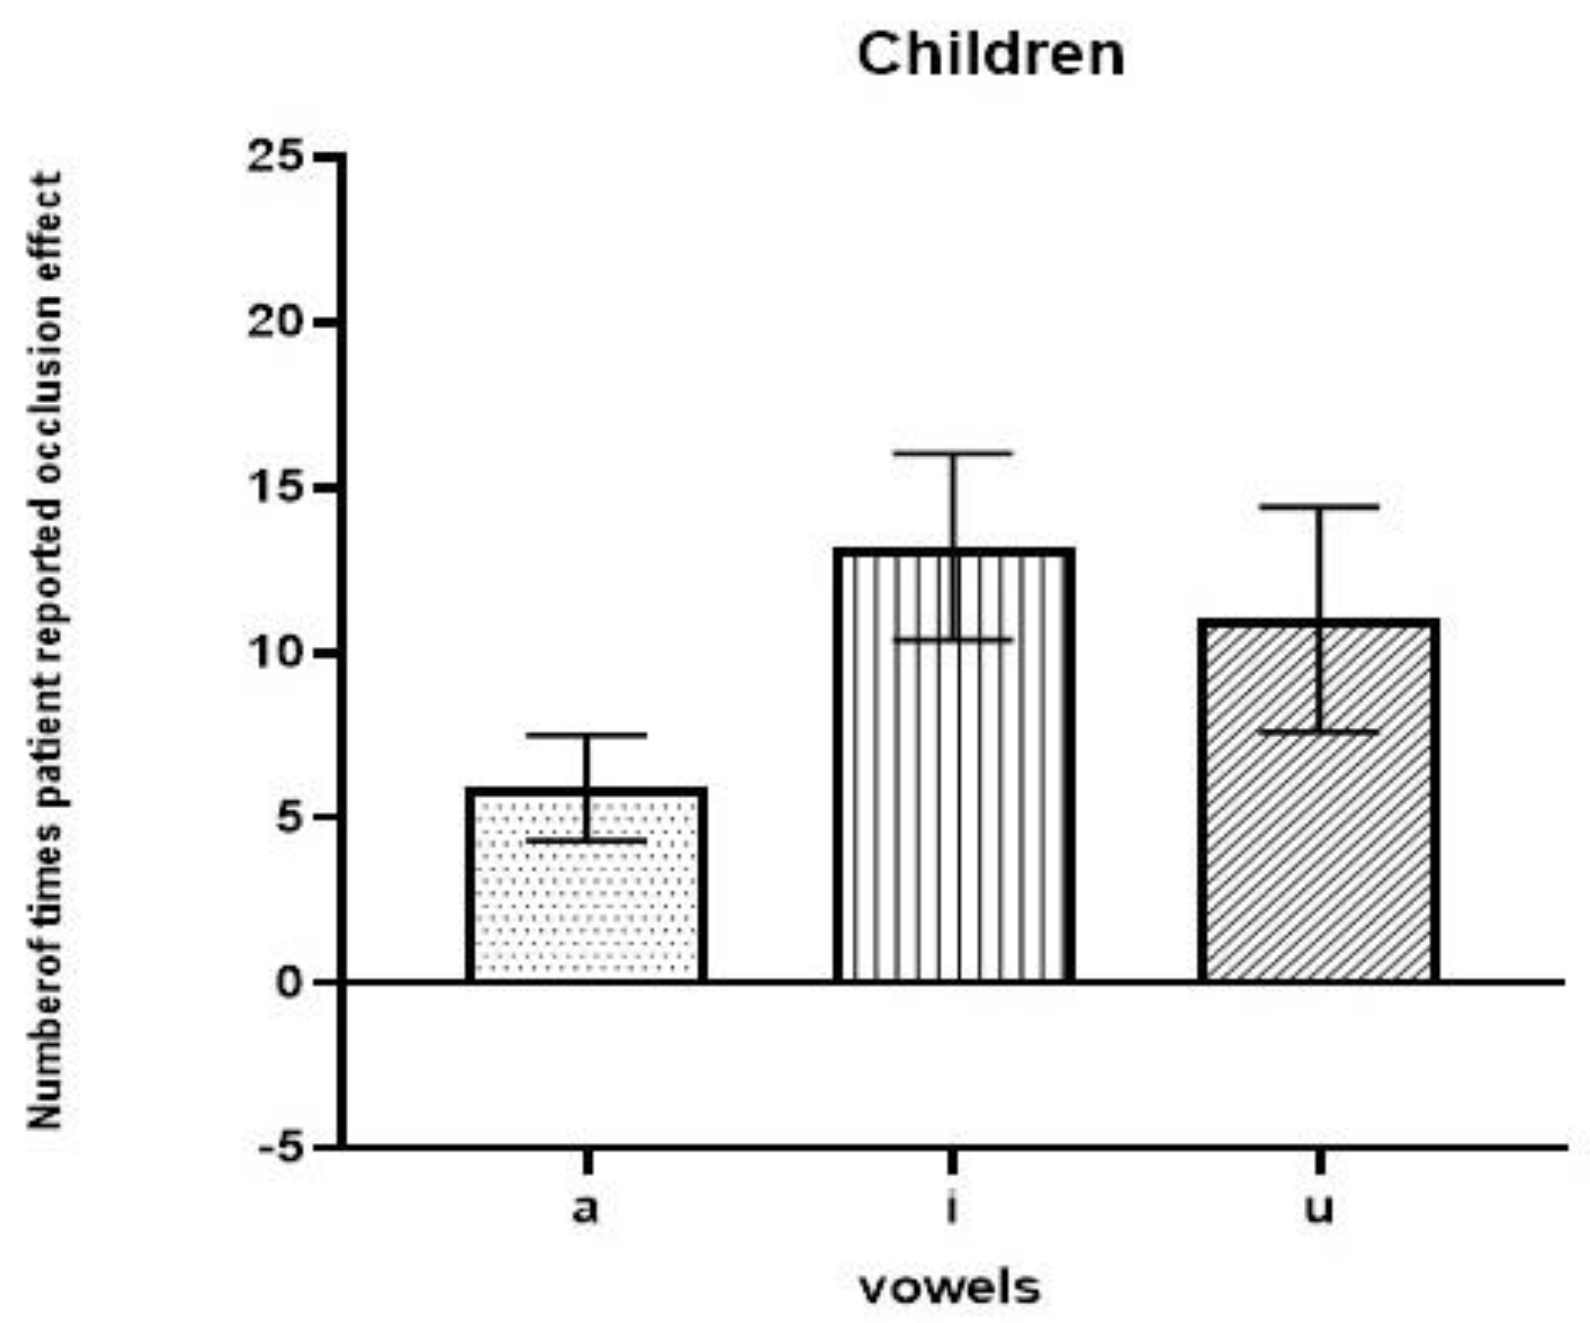
As can be observed in Figure 5, among children, the most intense occlusion effects were observed in relation to the vowel /i/, followed by the vowel /u/ and then the vowel /a/. The repeated measures ANOVA results revealed that there was a significant difference in the occlusion effect between vowels (F(2,18) = 12.763, p = 0.001). To determine the vowel for which the occlusion effect was observed, a post hoc Bonferroni test was performed. It was noted that there were no significant differences in the occlusion effect between the vowel pair /i/ and /u/ (p = 0.832). However, a significant difference in perceived occlusion was found between the vowel pairs /a/ and /i/ (p = 0.001) and /a/ and /u/ (p = 0.017) for children.
4. Discussion
The present study aimed to determine the best vowel stimulus with which to assess the occlusion effect among children and adults with normal hearing. Sound pressure levels and F1 values were measured for the vowels /a/, /i/, and /u/ in both groups. The paired comparison method was used to find the best vowel with which to measure the occlusion effect among the vowels /a/, /i/, and /u/ in each group.
As revealed via the paired comparison method, adults perceived more loudness when vocalizing the vowel /u/ followed by the vowel /i/. Among the three analyzed vowels, the lowest level of perceived loudness was noted for the vowel /a/. This was probably due to the lower F1 values for the vowels /u/ and /i/. In the present study, the lower mean value of F1 for the vowel /u/ was noted at 371 Hz, with a standard deviation of 150 Hz, while an F1 of 264 Hz with a standard deviation of 50 Hz was noted for the vowel /i/. The present study’s results are in accordance with the findings of Dillon (2012), who demonstrated that the occlusion effect was greatest for the vowels /i/ and /u/ as the first formant frequencies of the vowels /i/ and /u/ were near the maximum occlusion effect frequency, i.e., 300 Hz. This result was also supported by the research of a previous author who reported that the energy produced by the occlusion effect was at low frequencies, with the occlusion effect peak typically occurring in the 200 to 500 Hz range [23].
Furthermore, it was observed that the sound pressure levels for the vowels /i/ and /u/ were higher compared to those of the vowel /a/ in adults. According to the authors of [4], as the vowel /a/ is an open vowel, a reduced SPL is generated in the vocal tract during vocalization, whereas in the case of the closed vowels /i/ and /u/, a higher SPL is generated in the vocal tract during vocalization. The results of the present study support the findings of Dillion [4]. The mean value obtained for the vowel /a/ via the paired comparison method in the present study was 4, with a standard deviation of 5, indicating that the vowel /a/ might not be the best vowel stimulus with which to assess the occlusion effect among adults.
Higher energy was found in the children’s ear canals compared to those of the adults for the vowels /a/, /i/, and /u/ at each frequency. This study’s results are in accordance with the research reports from a previous study, which reported that the sound pressure levels developed in children’s ear canals were greater due to the smaller size of the ear canal in children compared to adults [24]. The F1 value was higher for children than adults for each vowel (/a/, /i/, and /u/). Further, as children have a shorter vocal tract, formant frequencies were comparatively higher among children compared to those observed among adults [14]. For children, the F1 value was highest for the vowel /a/, followed by the vowels /u/ and /i/. The results obtained using the paired comparison method revealed that children perceived the greatest occlusion effect when vocalizing the vowel /i/, followed by /u/ and then the vowel /a/. Among vowels, /i/ and /u/ are high vowels; they tend to have lower first formant frequencies than the vowel /a/, which is a low vowel [12,14]. Therefore, a higher SPL is generated in the vocal tract during the vocalization of the vowels /i/ and /u/ [4,10].
5. Conclusions
This study’s findings suggest that determining the best vowel stimulus can effectively aid the assessment of the occlusion effect in adults and children with normal hearing. The vowel /u/ was the best stimulus with which to assess the occlusion effect among adults. The vowel /i/ was the best stimulus for assessing the occlusion effect among children. Future research may be carried out on children with hearing impairment to determine the best vowel with which to assess the occlusion effect within this cohort, as the first formant frequency for vowels becomes more centralized among children with hearing impairment.
Author Contributions
H.N.S.: Conceptualization; Methodology; Formal Analysis; Investigation; Resources; Writing—Original Draft Preparation; Writing—Review and Editing; Visualization; Supervision; S.V.N.: Conceptualization; Methodology; Investigation; Resources; Writing—Original Draft Preparation; Writing—Review and Editing; S.M.: Methodology; Investigation; Data Curation; Project Administration. All authors have read and agreed to the published version of the manuscript.
Funding
This research received no external funding.
Institutional Review Board Statement
The xxx institutional ethics committee has approved the study (JSSISH/IEC/011222/31NCT/2022-23). Informed consent was obtained from each participant.
Informed Consent Statement
Informed Consent was obtained from the participants included in the present study.
Data Availability Statement
The data presented in this study are available on request from the corresponding author. The data are not publicly available due to ethical restrictions.
Conflicts of Interest
The authors declare no conflict of interest.
References
- Pohlman, A.G.; Kranz, F.W. The Influence of Partial and Complete Occlusion of the External Auditory Canals on Air and Bone Transmitted Sound. Ann. Otolaryngol. 1926, 35, 113–121. [Google Scholar]
- Zurbrügg, T.; Stirnemannn, A.; Kuster, M.; Lissek, H. Investigations on the physical factors influencing the ear canal occlusion effect caused by hearing aids. Acta Acust. United Acust. 2014, 100, 527–536. [Google Scholar] [CrossRef]
- Schweitzer, C.; Smith, D.A. Solving the “Occlusion Effect” Electronically. Hear. Instr. 1992, 43, 30–33. [Google Scholar]
- Dillon, H. Hearing Aids: Hearing Aid Earmoulds, Ear Shells and Coupling Systems; Boomerang Press: Sydney, Australia, 2013; p. 141. [Google Scholar]
- Khanna, S.M.; Tonndorf, J.; Queller, J.E. Mechanical parameters of hearing by bone conduction. J. Acoust. Soc. Am. 1976, 60, 139–154. [Google Scholar] [CrossRef] [PubMed]
- Killion, M.C. The “Hollow” Voice Occlusion Effect. In Proceedings of the 13th Danavox Symposium, Danavox, Denmark, 11–13 September 1988; Plural Publishing Inc.: Elk Grove Village, IL, USA, 1988; pp. 231–241. [Google Scholar]
- Von Békésy, G.; Peake, W.T. Experiments in Hearing. J. Acoust. Soc. Am. 1990, 88, 2905. [Google Scholar] [CrossRef]
- Homma, K.; Du, Y.; Shimizu, Y.; Puria, S. Ossicular resonance modes of the human middle ear for bone and air conduction. J. Acoust. Soc. Am. 2009, 125, 968–979. [Google Scholar] [CrossRef] [PubMed]
- Curran, J. A Forgotten Technique for Resolving The Occlusion Effect. Repr. Innov. 2012, 2, 35–40. [Google Scholar]
- MacKenzie, D.J. Open-canal fittings and the hearing aid occlusion effect. Hear. J. 2006, 59, 50–56. [Google Scholar] [CrossRef]
- Stender, T.; Appleby, R. Occlusion effect measures: Are they all created equal? Hear. J. 2009, 62, 21–25. [Google Scholar] [CrossRef]
- Hillenbrand, J.; Getty, L.A.; Clark, M.J.; Wheeler, K. Acoustic characteristics of American English vowels. J. Acoust. Soc. Am. 1995, 97, 3099–3111. [Google Scholar] [CrossRef] [PubMed]
- Nikita, F.; Nikitha, M.; Narasimhan, S.V. Vowel Space Area in Individuals with Parkinson’s disease. In Proceedings of the International Symposium Frontiers of Research on Speech and Music (FRSM), Kharagpur, India, 4–5 August 2016; Indian Institute of Technology: New Delhi, India, 2016. [Google Scholar]
- Peterson, G.E.; Barney, H.L. Control methods used in a study of the vowels. J. Acoust. Soc. Am. 1952, 24, 175–184. [Google Scholar] [CrossRef]
- Fulton, B.; Martin, L. Drilling a vent often fails to give relief from occlusion. Hear. J. 2006, 59, 40–45. [Google Scholar] [CrossRef]
- Jafari, M.; Rahbar, N.; Sameni, J.; Keihani, M.R. Comparison of occlusion effect in normal hearing subjects via real ear measurement and audiometric Bing test. Audiol. Internet 2009, 17, 16–24. Available online: http://ezproxy.uky.edu/login?url=http://search.ebscohost.com/login.aspx?direct=true&db=a9h&AN=43255946&site=ehost-live&scope=site (accessed on 20 May 2023).
- Small, S.A.; Hatton, J.L.; Stapells, D.R. Effects of bone oscillator coupling method, placement location, and occlusion on bone-conduction auditory steady-state responses in infants. Ear Hear. 2007, 28, 83–98. [Google Scholar] [CrossRef] [PubMed]
- Arehart, K.H.; Burns, E.M. Ear-canal impedance and reflection coefficient in human infants and adults. J. Acoust. Soc. Am. 1993, 94, 2617–2638. [Google Scholar]
- Turner, R.E.; Walters, T.C.; Monaghan, J.J.M.; Patterson, R.D. A statistical, formant-pattern model for segregating vowel type and vocal-tract length in developmental formant data. J. Acoust. Soc. Am. 2009, 125, 2374–2386. [Google Scholar] [CrossRef] [PubMed]
- Lee, S.; Potamianos, A.; Narayanan, S. Acoustics of children’s speech: Developmental changes of temporal and spectral parameters. J. Acoust. Soc. Am. 1999, 105, 1455–1468. [Google Scholar] [CrossRef] [PubMed]
- Švec, J.G.; Granqvist, S. Tutorial and guidelines on measurement of a sound pressure level in voice and speech. J. Speech Lang. Hear. Res. 2018, 61, 441–461. [Google Scholar] [CrossRef] [PubMed]
- IBM Corp. IBM SPSS Statistics for Windows Version 24.0; IBM Corp.: Armonk, NY, USA, 2016. [Google Scholar]
- MacKenzie, D.J.; Mueller, H.G.; Ricketts, T.A.; Konkle, D.F. The hearing aid occlusion effect. Hear. J. 2004, 57, 30. [Google Scholar] [CrossRef]
- Feigin, J.A.; Kopun, J.G.; Stelmachowicz, P.G.; Gorga, M.P. Probe-tube microphone measures of ear-canal sound pressure levels in infants and children. Ear Hear. 1989, 10, 254–258. [Google Scholar] [CrossRef] [PubMed]
Figure 1.
Block diagram of instruments used to record the vowels and their sound pressure levels in the participants’ ear canals.
Figure 1.
Block diagram of instruments used to record the vowels and their sound pressure levels in the participants’ ear canals.
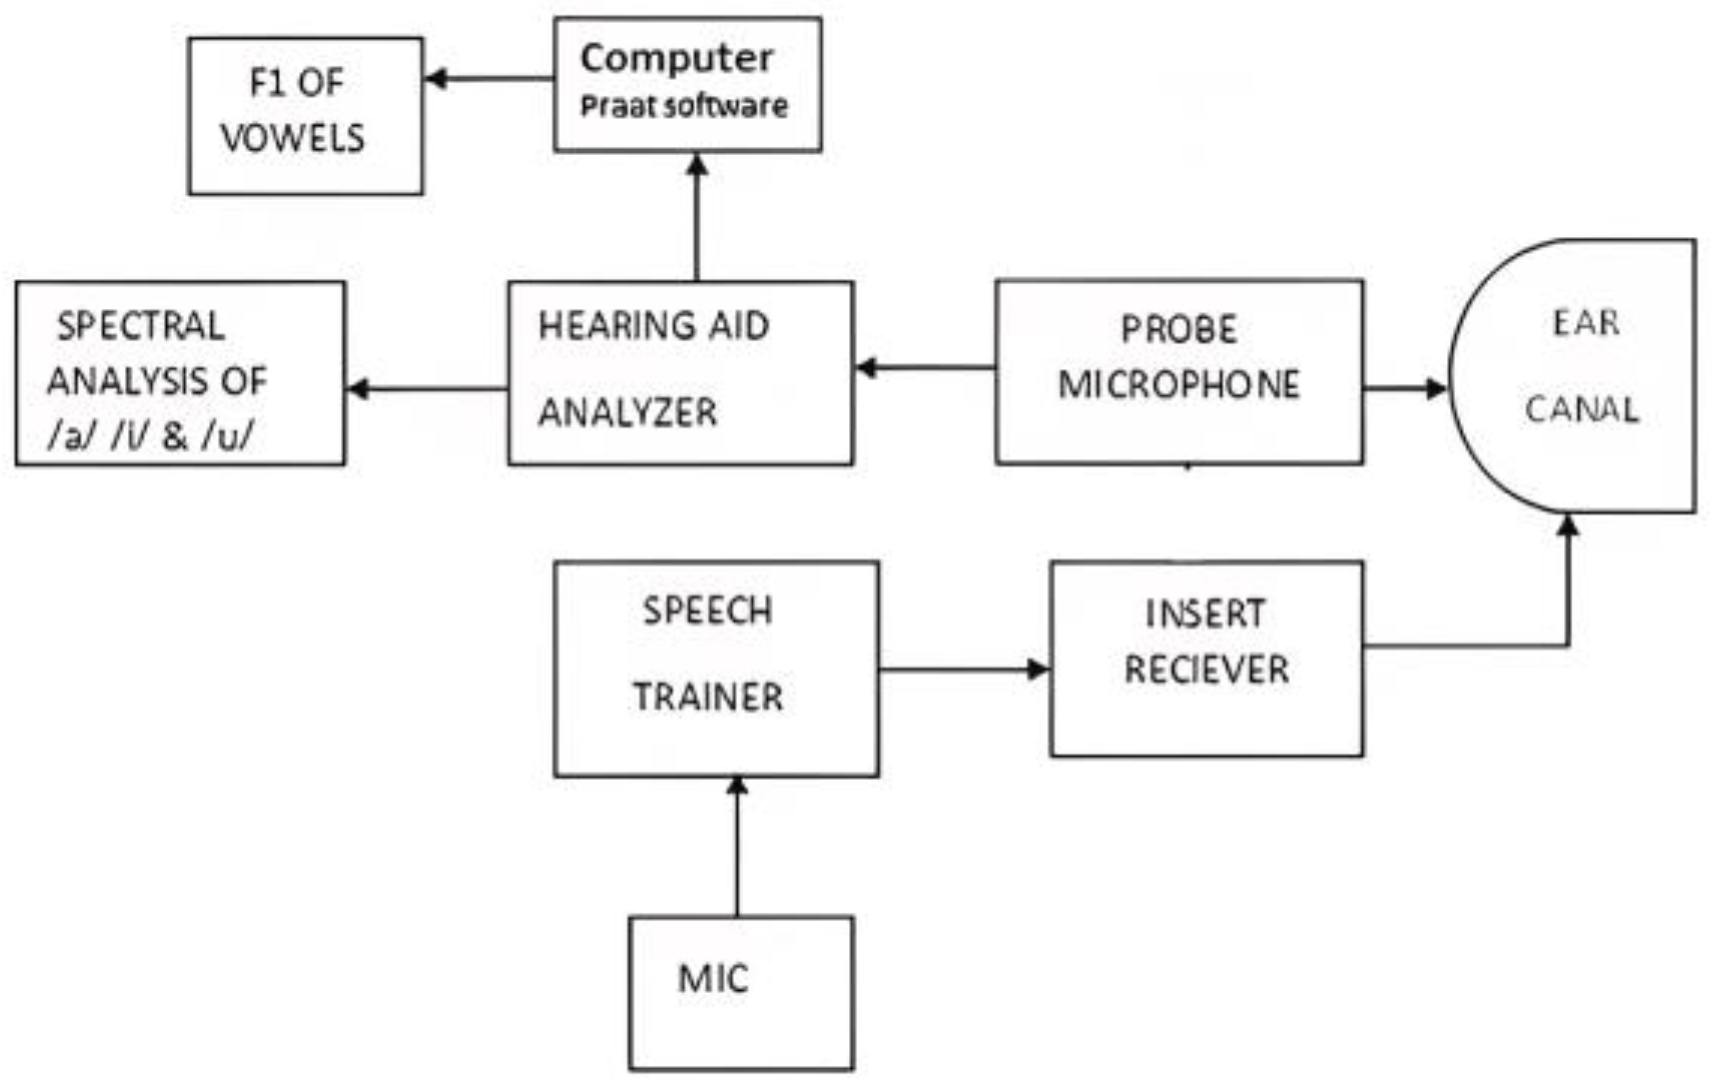
Figure 2.
(a,b) Spectra of vowels /a/, /i/, and /u/ articulated by (a) children and (b) adults (SPL—sound pressure level).
Figure 2.
(a,b) Spectra of vowels /a/, /i/, and /u/ articulated by (a) children and (b) adults (SPL—sound pressure level).
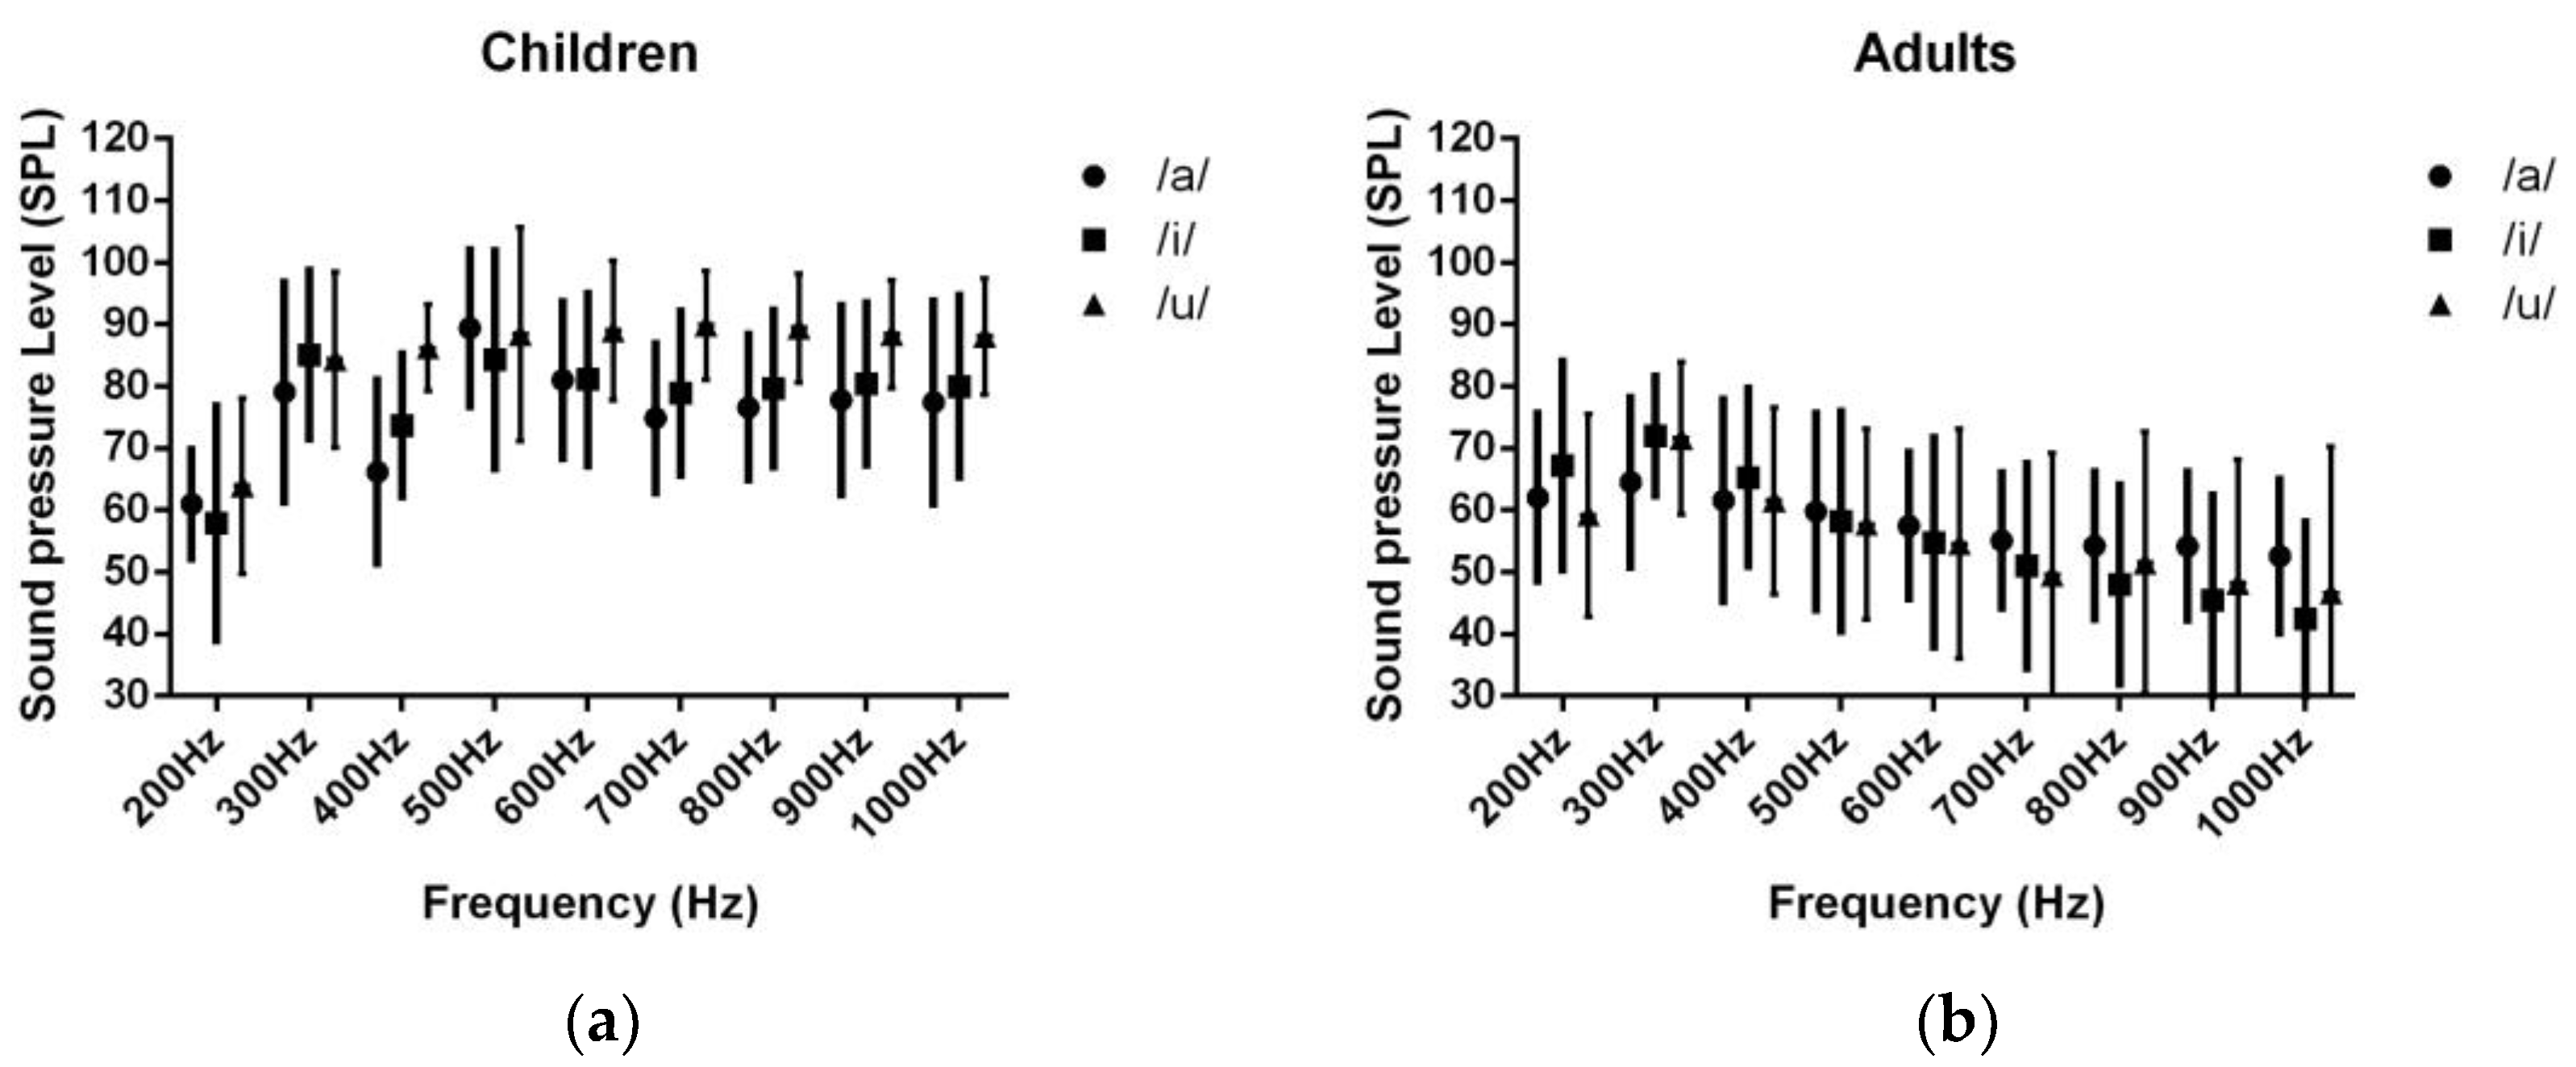
Figure 3.
(a,b) First formant frequency of vowels articulated by (a) children and (b) adults.
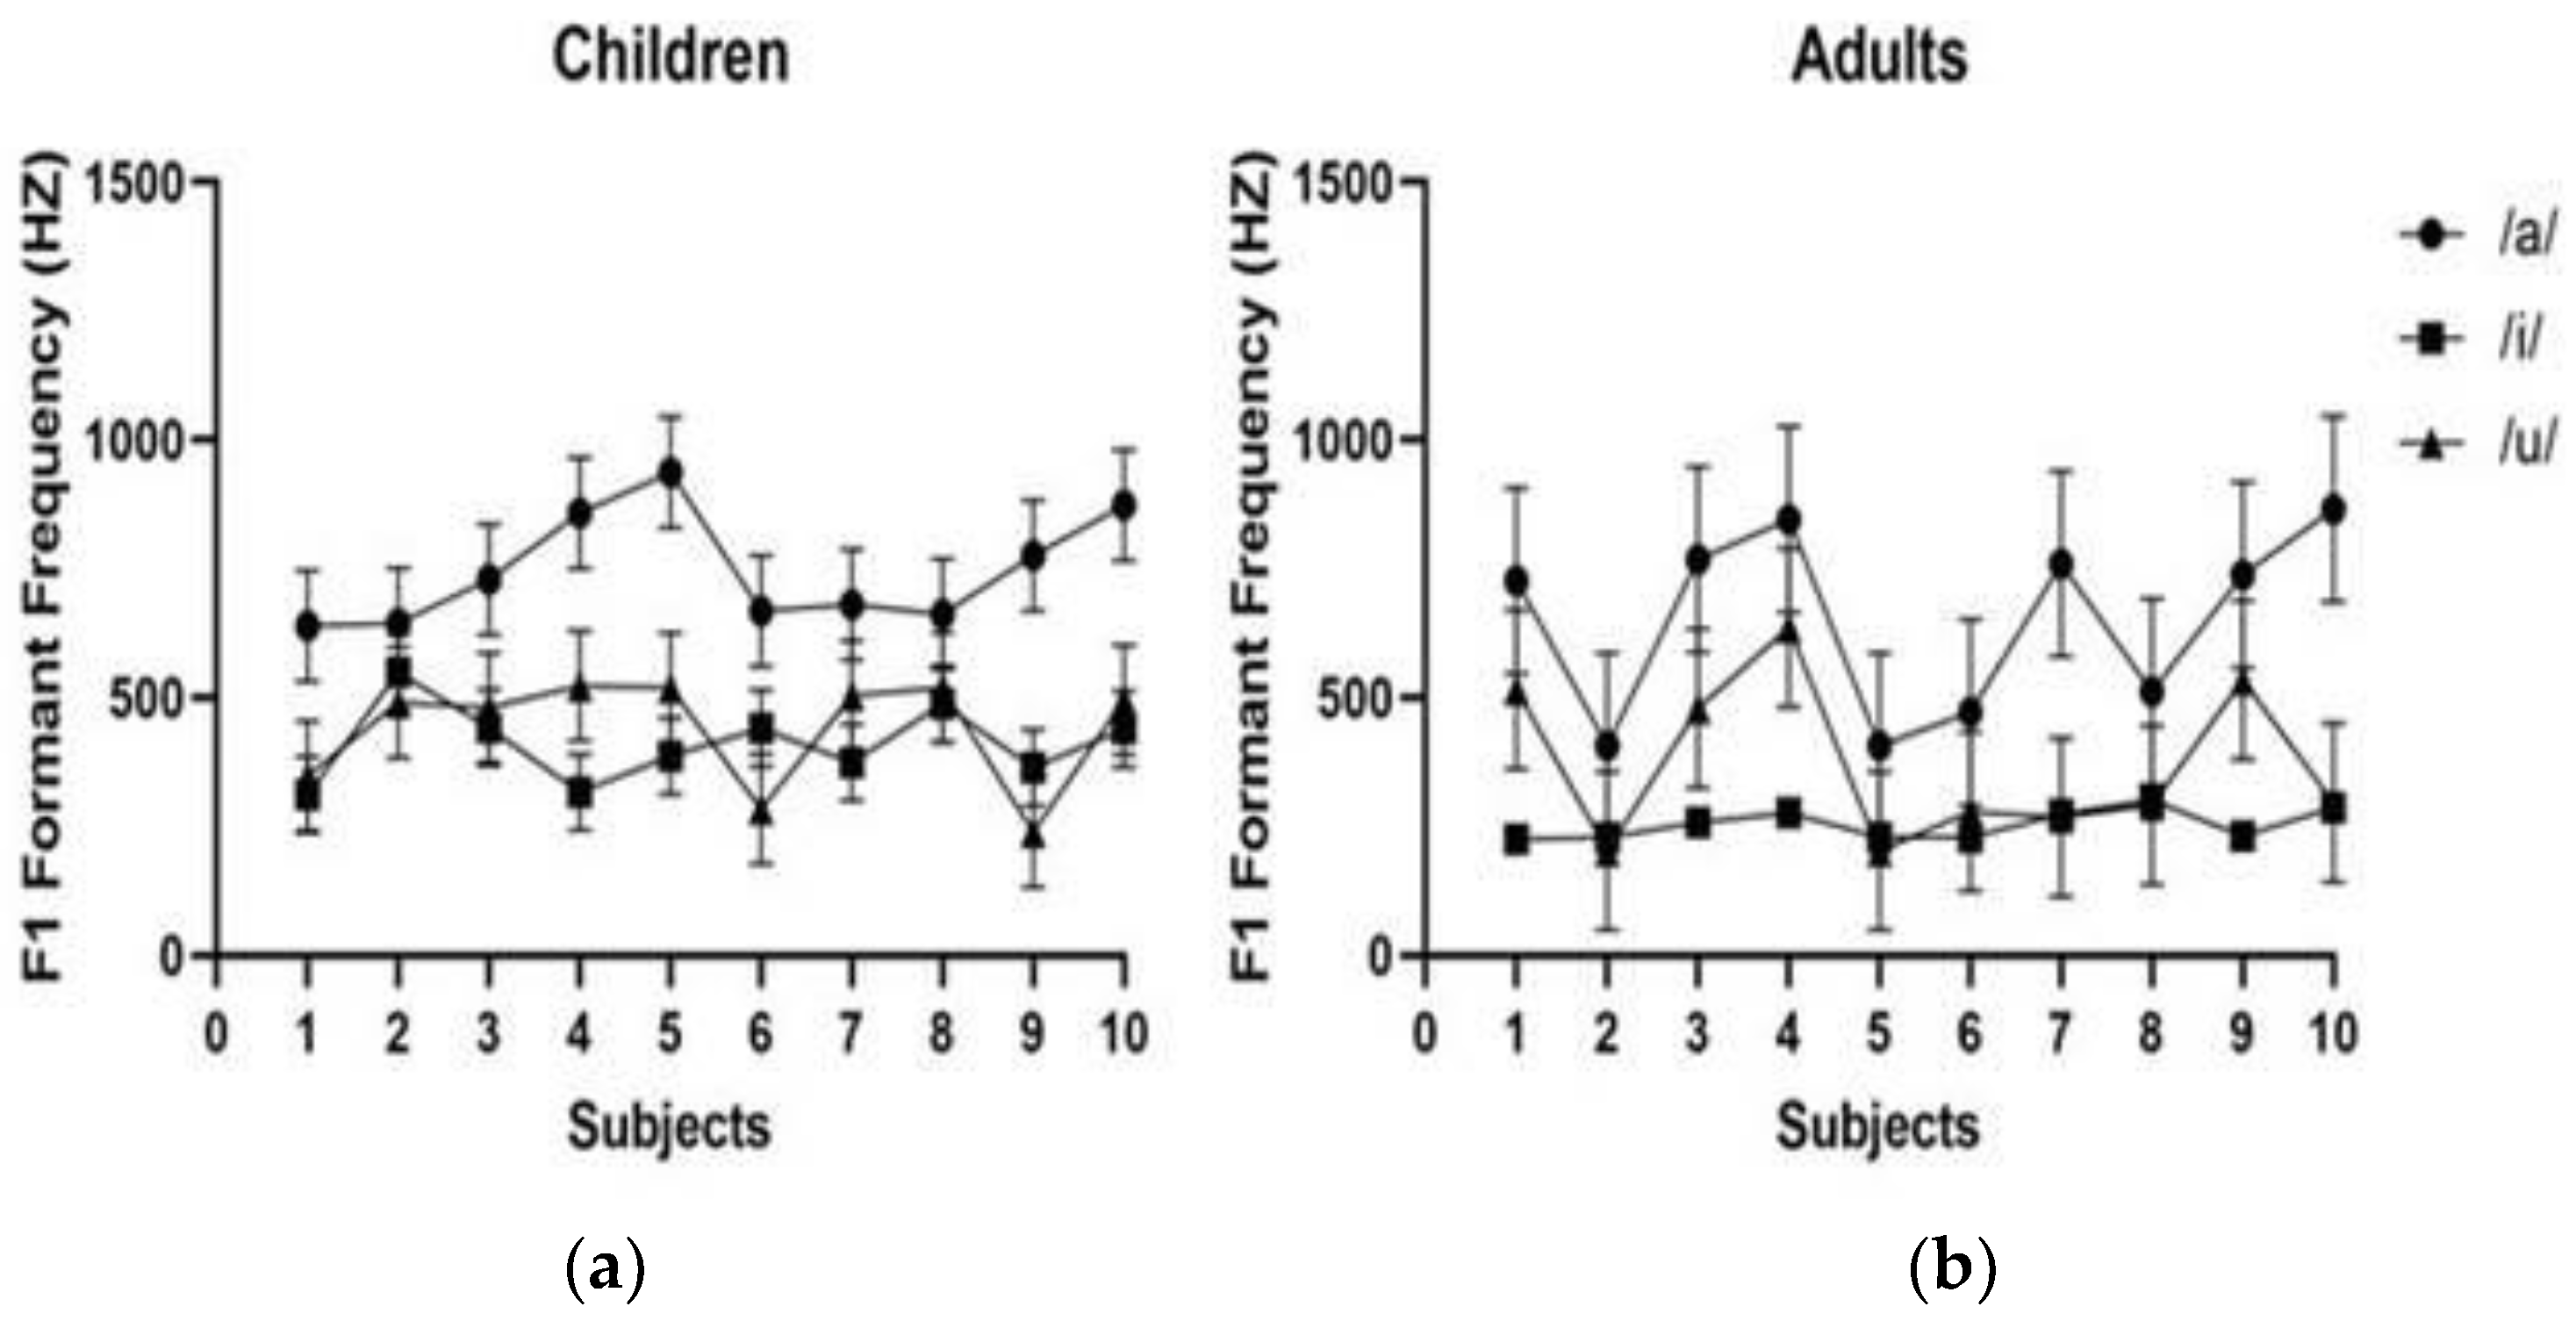
Figure 4.
The number of times the adults specified that each vowel gave rise to an occlusion effect as assessed using the paired comparison method.
Figure 4.
The number of times the adults specified that each vowel gave rise to an occlusion effect as assessed using the paired comparison method.
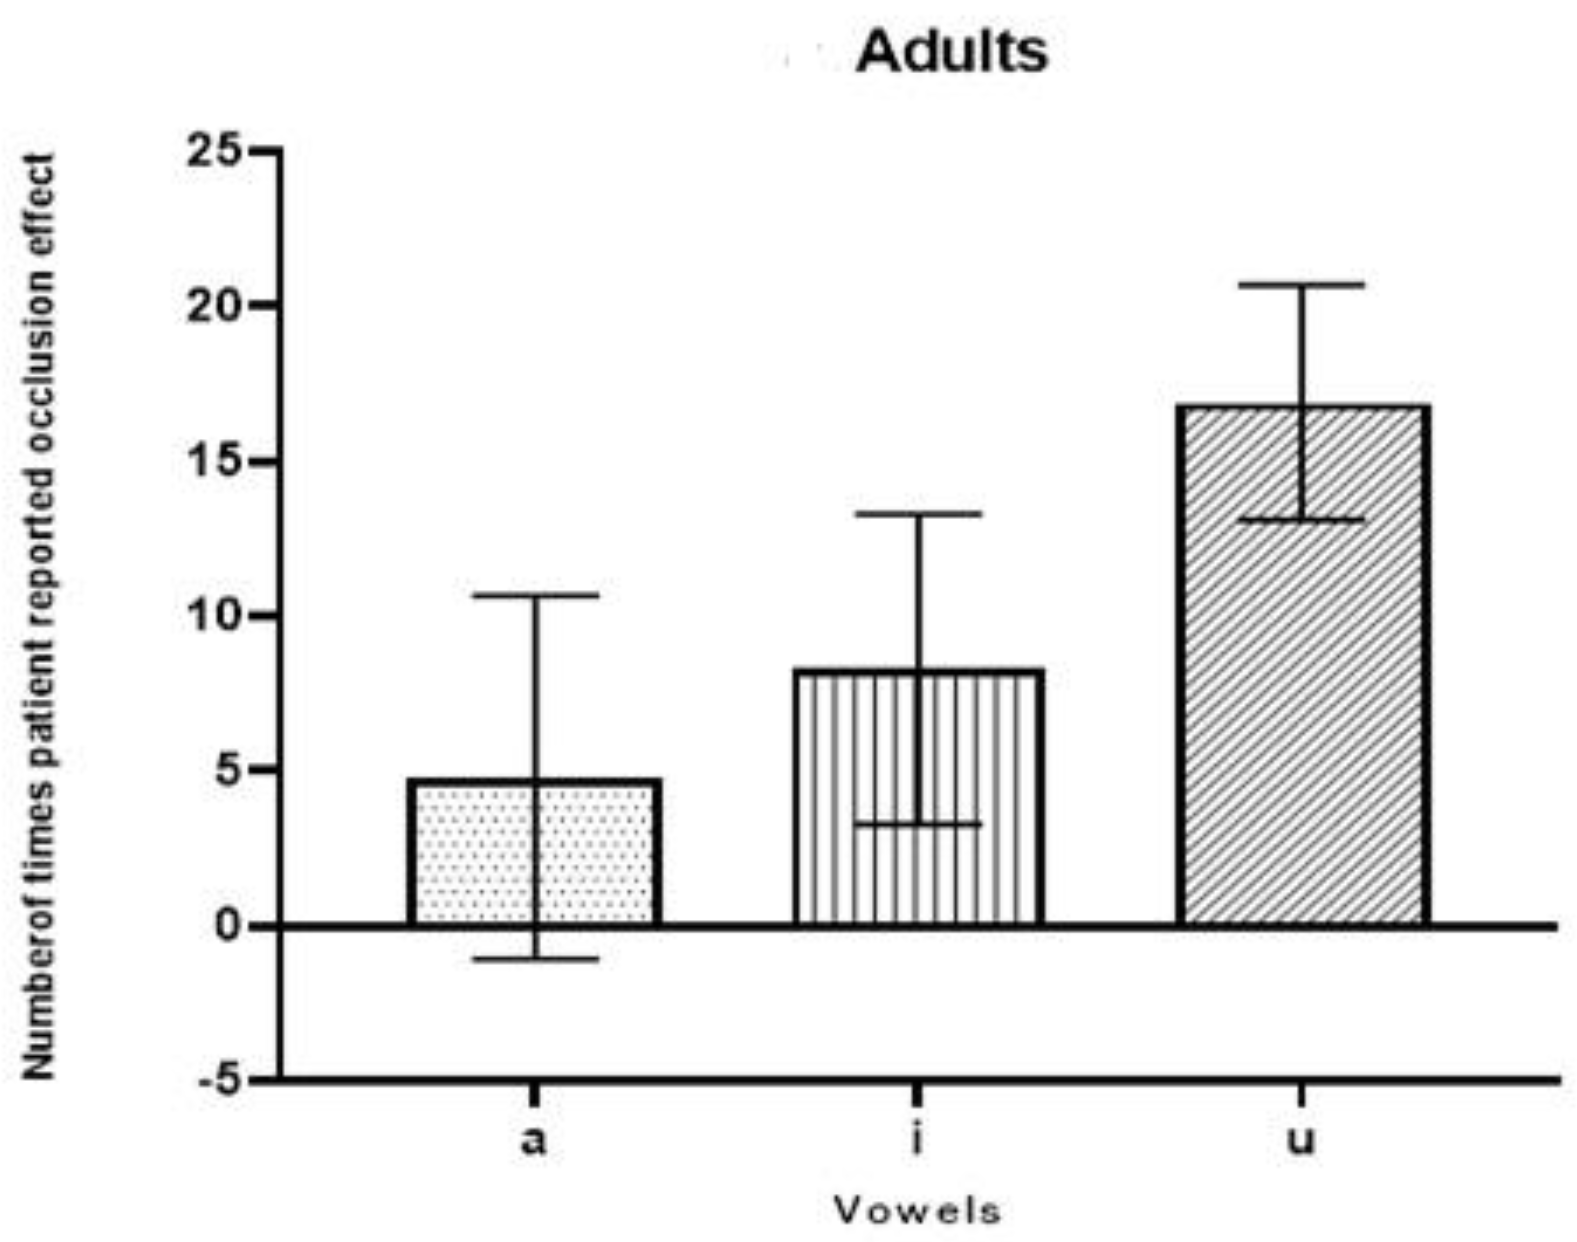
Figure 5.
Number of times the children specified that each vowel gave rise to an occlusion effect as assessed using the paired comparison method.
Figure 5.
Number of times the children specified that each vowel gave rise to an occlusion effect as assessed using the paired comparison method.


Table 1.
Energy level as a function of frequency with respect to vowel /a/ among children and adults, F values, and the p-values of MANOVA.
Table 1.
Energy level as a function of frequency with respect to vowel /a/ among children and adults, F values, and the p-values of MANOVA.
| Frequency | Children | Adults | F Value | p | ||
|---|---|---|---|---|---|---|
| Mean | SD | Mean | SD | |||
| 200 Hz | 61.0 | 8.756 | 62.10 | 13.57 | 0.04 | 0.832 |
| 300 Hz | 79.10 | 17.717 | 64.50 | 13.58 | 4.27 | 0.053 |
| 400 Hz | 66.20 | 14.741 | 61.60 | 16.25 | 0.43 | 0.516 |
| 500 Hz | 89.40 | 12.651 | 59.80 | 15.80 | 21.38 | 0.001 *** |
| 600 Hz | 81.0 | 12.667 | 57.50 | 11.73 | 18.52 | 0.001 *** |
| 700 Hz | 74.90 | 11.995 | 55.10 | 10.90 | 14.91 | 0.001 *** |
| 800 Hz | 76.60 | 11.711 | 54.30 | 11.86 | 17.89 | 0.001 *** |
| 900 Hz | 77.80 | 15.215 | 54.20 | 11.97 | 14.86 | 0.001 *** |
| 1000 Hz | 77.40 | 16.311 | 52.60 | 12.38 | 14.66 | 0.001 *** |
*** p < 0.001.
Table 2.
Sound pressure level as a function of frequency with respect to the vowel /i/ among both children and adults, F values, and the p values of MANOVA.
Table 2.
Sound pressure level as a function of frequency with respect to the vowel /i/ among both children and adults, F values, and the p values of MANOVA.
| Frequency | Children | Adults | F Value | p | ||
|---|---|---|---|---|---|---|
| Mean | SD | Mean | SD | |||
| 200 Hz | 57.9 | 18.94 | 67.2 | 16.87 | 1.34 | 0.262 |
| 300 Hz | 85.1 | 13.58 | 72 | 9.56 | 6.21 | 0.023 * |
| 400 Hz | 73.7 | 11.5 | 65.3 | 14.31 | 2.09 | 0.165 |
| 500 Hz | 84.3 | 17.56 | 58.2 | 17.67 | 10.97 | 0.004 ** |
| 600 Hz | 81.1 | 13.92 | 54.8 | 16.88 | 14.44 | 0.001 *** |
| 700 Hz | 78.9 | 13.18 | 51.0 | 16.54 | 17.38 | 0.001 *** |
| 800 Hz | 79.6 | 12.58 | 48.0 | 16.09 | 23.93 | 0.000 *** |
| 900 Hz | 80.4 | 13.08 | 45.4 | 17.03 | 26.56 | 0.000 *** |
| 1000 Hz | 80.0 | 14.67 | 42.4 | 15.72 | 31.20 | 0.000 *** |
* p < 0.05; ** p < 0.01; *** p < 0.001.
Table 3.
Sound pressure level as a function of frequency in relation to the vowel /u/ among children and adults. F values and p-values of MANOVA.
Table 3.
Sound pressure level as a function of frequency in relation to the vowel /u/ among children and adults. F values and p-values of MANOVA.
| Frequency | Children | Adults | F Value | p | ||
|---|---|---|---|---|---|---|
| Mean | SD | Mean | SD | |||
| 200 Hz | 63.90 | 14.14 | 59.2 | 16.33 | 0.47 | 0.500 |
| 300 Hz | 84.30 | 14.15 | 71.6 | 12.33 | 4.576 | 0.046 * |
| 400 Hz | 86.20 | 6.97 | 61.5 | 15.05 | 22.7 | 0.001 *** |
| 500 Hz | 88.40 | 17.28 | 57.7 | 15.39 | 17.8 | 0.000 *** |
| 600 Hz | 89.0 | 11.29 | 54.6 | 18.51 | 25.15 | 0.001 *** |
| 700 Hz | 89.9 | 8.78 | 49.5 | 19.79 | 34.79 | 0.001 *** |
| 800 Hz | 89.4 | 8.78 | 51.5 | 21.13 | 27.43 | 0.001 *** |
| 900 Hz | 88.4 | 8.72 | 48.2 | 19.93 | 34.12 | 0.001 *** |
| 1000 Hz | 88.1 | 9.36 | 46.6 | 23.69 | 26.52 | 0.001 *** |
* p < 0.05; *** p < 0.001.
Table 4.
Mean first formant frequency (F1) values recorded among children and adults measured in Hertz (Hz); F values; and p-values of MANOVA.
Table 4.
Mean first formant frequency (F1) values recorded among children and adults measured in Hertz (Hz); F values; and p-values of MANOVA.
| Vowels | Children F1 | Adults F1 | F | p | ||||
|---|---|---|---|---|---|---|---|---|
| Mean | Md | SD | Mean | Md | SD | |||
| /a/ | 746.77 | 704.92 | 108.38 | 650.33 | 732.53 | 180.27 | 2.102 | 0.164 |
| /i/ | 391.55 | 413.50 | 74.66 | 264.32 | 245.02 | 28.67 | 18.747 | 0.001 *** |
| /u/ | 520.40 | 492.88 | 107.41 | 371.14 | 295.04 | 154.82 | 6.949 | 0.017 * |
Md—Median; SD—Standard Deviation. * p < 0.05; *** p < 0.001
Disclaimer/Publisher’s Note: The statements, opinions and data contained in all publications are solely those of the individual author(s) and contributor(s) and not of MDPI and/or the editor(s). MDPI and/or the editor(s) disclaim responsibility for any injury to people or property resulting from any ideas, methods, instructions or products referred to in the content. |
© 2023 by the authors. Licensee MDPI, Basel, Switzerland. This article is an open access article distributed under the terms and conditions of the Creative Commons Attribution (CC BY) license (https://creativecommons.org/licenses/by/4.0/).
Share and Cite
MDPI and ACS Style
Shetty, H.N.; Narasimhan, S.V.; Mahanthesh, S. Effective Vowel Stimuli for Measuring Occlusion Effect in the Pediatric Population. J. Otorhinolaryngol. Hear. Balance Med. 2023, 4, 7. https://doi.org/10.3390/ohbm4020007
AMA Style
Shetty HN, Narasimhan SV, Mahanthesh S. Effective Vowel Stimuli for Measuring Occlusion Effect in the Pediatric Population. Journal of Otorhinolaryngology, Hearing and Balance Medicine. 2023; 4(2):7. https://doi.org/10.3390/ohbm4020007
Chicago/Turabian StyleShetty, Hemanth Narayan, Srirangam Vijayakumar Narasimhan, and Sharath Mahanthesh. 2023. "Effective Vowel Stimuli for Measuring Occlusion Effect in the Pediatric Population" Journal of Otorhinolaryngology, Hearing and Balance Medicine 4, no. 2: 7. https://doi.org/10.3390/ohbm4020007