1. Introduction
Synthetic speech generated by computers has been increasingly used in lieu of actual human voices in human–machine interfaces. Nearly all digital assistants, such as Amazon Alexa and Apple Siri, on contemporary mobile devices, personal computers, and consumer electronics interact with users using synthetic voices. GPS navigators also use synthetic voices to guide their users. However, the information exchange between humans and machines often takes place in non-ideal (e.g., noisy and reverberant) listening conditions. For example, drivers often hear the instructions given by the GPS mixed with surrounding sounds, such as engine, road, and wind noises. Therefore, speech intelligibility in similar scenarios is crucial, especially in safety-critical environments. Investigating the acoustic traits that indicate speech intelligibility has continued for decades; measuring and improving the intelligibility of synthetic speech has been heavily studied since the emergence of speech synthesizers [
1,
2]. In the past, it was found that synthetic speech was less intelligible than natural speech in quiet conditions [
2] and was even less so in non-ideal listening conditions [
3,
4]. As a public health concern, the intelligibility issue of synthetic voices in everyday life, especially for the hard-of-hearing population, has drawn considerable attention.
Enormous efforts have been devoted to designing novel algorithms for speech synthesis. The earliest speech synthesizers were developed from rule-based models that filter a source signal to resemble speech-to-data-based models that concatenate segments from recorded human voices [
5,
6]. However, speech generated by these synthesizers is highly unnatural, especially in the prosody domain. Statistical parametric synthesis (SPS) was proposed to address these problems [
7]. SPS and subsequently developed neural models directly synthesize speech waveforms instead of concatenating units from natural speech. A typical SPS pipeline includes three components: a text analyzer that extracts linguistic features from the text, an acoustic model that translates linguistic features to acoustic features, and a vocoder that outputs a waveform based on the acoustic features. The neural synthesizers that came later attempted to simplify the above pipeline and strove toward directly producing waveforms from the text. Synthetic voices generated by state-of-the-art neural synthesizers have demonstrated significantly better quality and naturalness compared to traditional SPS speech [
7,
8].
Concerning speech intelligibility in general, there have been many studies and investigations into which acoustic features are crucial to it and why. For clear speech, for instance, the speaking rate and vowel space are negatively and positively correlated with intelligibility, respectively [
9,
10]. Moreover, the speaking rate also has an impact on vowel space. Typically, as the speaking rate increases, speech intelligibility and vowel space decrease [
11]. The harmonics-to-noise ratio, a measure of voice quality, is also a strong predictor of speech intelligibility [
12,
13,
14].
Many studies have also been conducted on intelligibility in noise for both natural speech and synthetic speech. When speaking in noise, humans spontaneously make articulatory changes to produce speech adapted to the listening environment, known as “Lombard speech” [
15]. Lombard speech has been extensively studied, and it is often more intelligible than ordinary speech produced in quiet. Compared to ordinary speech, Lombard speech typically has increased intensity and fundamental frequency (F0), prolonged vowel duration, and an upward shift of energy towards the middle or higher frequencies [
16,
17]. These acoustic changes are understood to help speech sounds better overcome the masking effect of noise. In the early 1980s, the intelligibility of speech generated by two rule-based synthesizers and that of a natural voice in white noise were compared. Although the intelligibility of some phonemes was statistically similar for all three voices, the advantage of natural speech was evident [
2]. A more recent study evaluated the intelligibility of algorithmically-modified natural speech and SPS speech in a series of noise conditions. Some of the synthesizers were particularly adapted to produce synthetic speech with the acoustics properties of Lombard speech. Results showed that natural speeches with spectral modification and reduced dynamic range could outperform Lombard speech in noise. Synthetic speech was, however, always less intelligible than natural speech in noise [
4]. Further investigation showed that enhancing important regions (e.g., formants) in the spectral envelope and using Lombard-adapted duration and excitation for synthesis could improve the intelligibility of synthetic speech [
18]. However, it was also noted in [
18] that the improvement of intelligibility in noise due to acoustic modifications came at the cost of naturalness and sound quality of the speaker’s voice when perceived in quiet. Nevertheless, speech with better intelligibility tends to be rated of higher quality by listeners in noise [
19].
Until recently, the intelligibility of synthetic voices was mostly assessed on normal hearing (NH) listeners. A handful of studies investigated the intelligibility of synthetic speech to hearing-impaired (HI) listeners. In the early 1990s, one of the earliest studies of this kind suggested that the intelligibility of synthetic speech varied, but some synthesizers could reach similar intelligibility of natural speech for HI listeners in
quiet environments [
20,
21]. A more recent study [
22] suggested that the degree of hearing loss at high frequencies (>8 kHz) for listeners was negatively correlated with synthetic speech’s intelligibility. There is also evidence that, for listeners with cochlear implants, synthetic speech with a slow speaking rate was significantly more intelligible than that with a normal rate, which was understandably more intelligible than that with a fast rate [
23]. After synthesis techniques rapidly advanced for over a decade, the intelligibility of synthetic speech by the most recent synthesizers has hardly been reported. It is particularly meaningful to know whether the improvement in the quality and naturalness of synthetic speech seen in recent years could lead to intelligibility gain in non-ideal conditions for both NH and HI listeners.
This study aimed to systematically evaluate the intelligibility of synthetic voices generated by modern commercial speech synthesizers in a series of noise conditions for NH and HI listeners. Six acoustic properties, including speaking rate, F0, harmonic-to-noise ratio, vowel-to-consonant duration ratio, spectral tilt, and vowel space, were measured for the voices and further analyzed to discover and understand how they affected the intelligibility of synthetic speech for the two cohorts of listeners. The main findings and implications were further discussed.
3. Listening Experiments
3.1. Participants
Ten native Mandarin Chinese speakers (6 females, 4 males, average age = 23.5 years with s.d. = 2.3 years) with self-reported NH were recruited. All the participants were undergraduate or graduate students at the University of Illinois at Urbana-Champaign. The recruitment and testing methods were approved by the Institutional Review Board of the university. All the participants were compensated financially or via course credit for their time. A post-experiment hearing screening was conducted on all the participants using standard clinical audiometric procedures with an audiometer (Interacoustics AS608e). Their hearing levels (HL) were measured as pure-tone average (PTA6) over the six octave frequencies (250, 500, 1000, 2000, 4000, and 8000 Hz). The results showed that one female participant had subtle hearing loss with a PTA6 above 20 dB HL, leading to her data being excluded from further analysis.
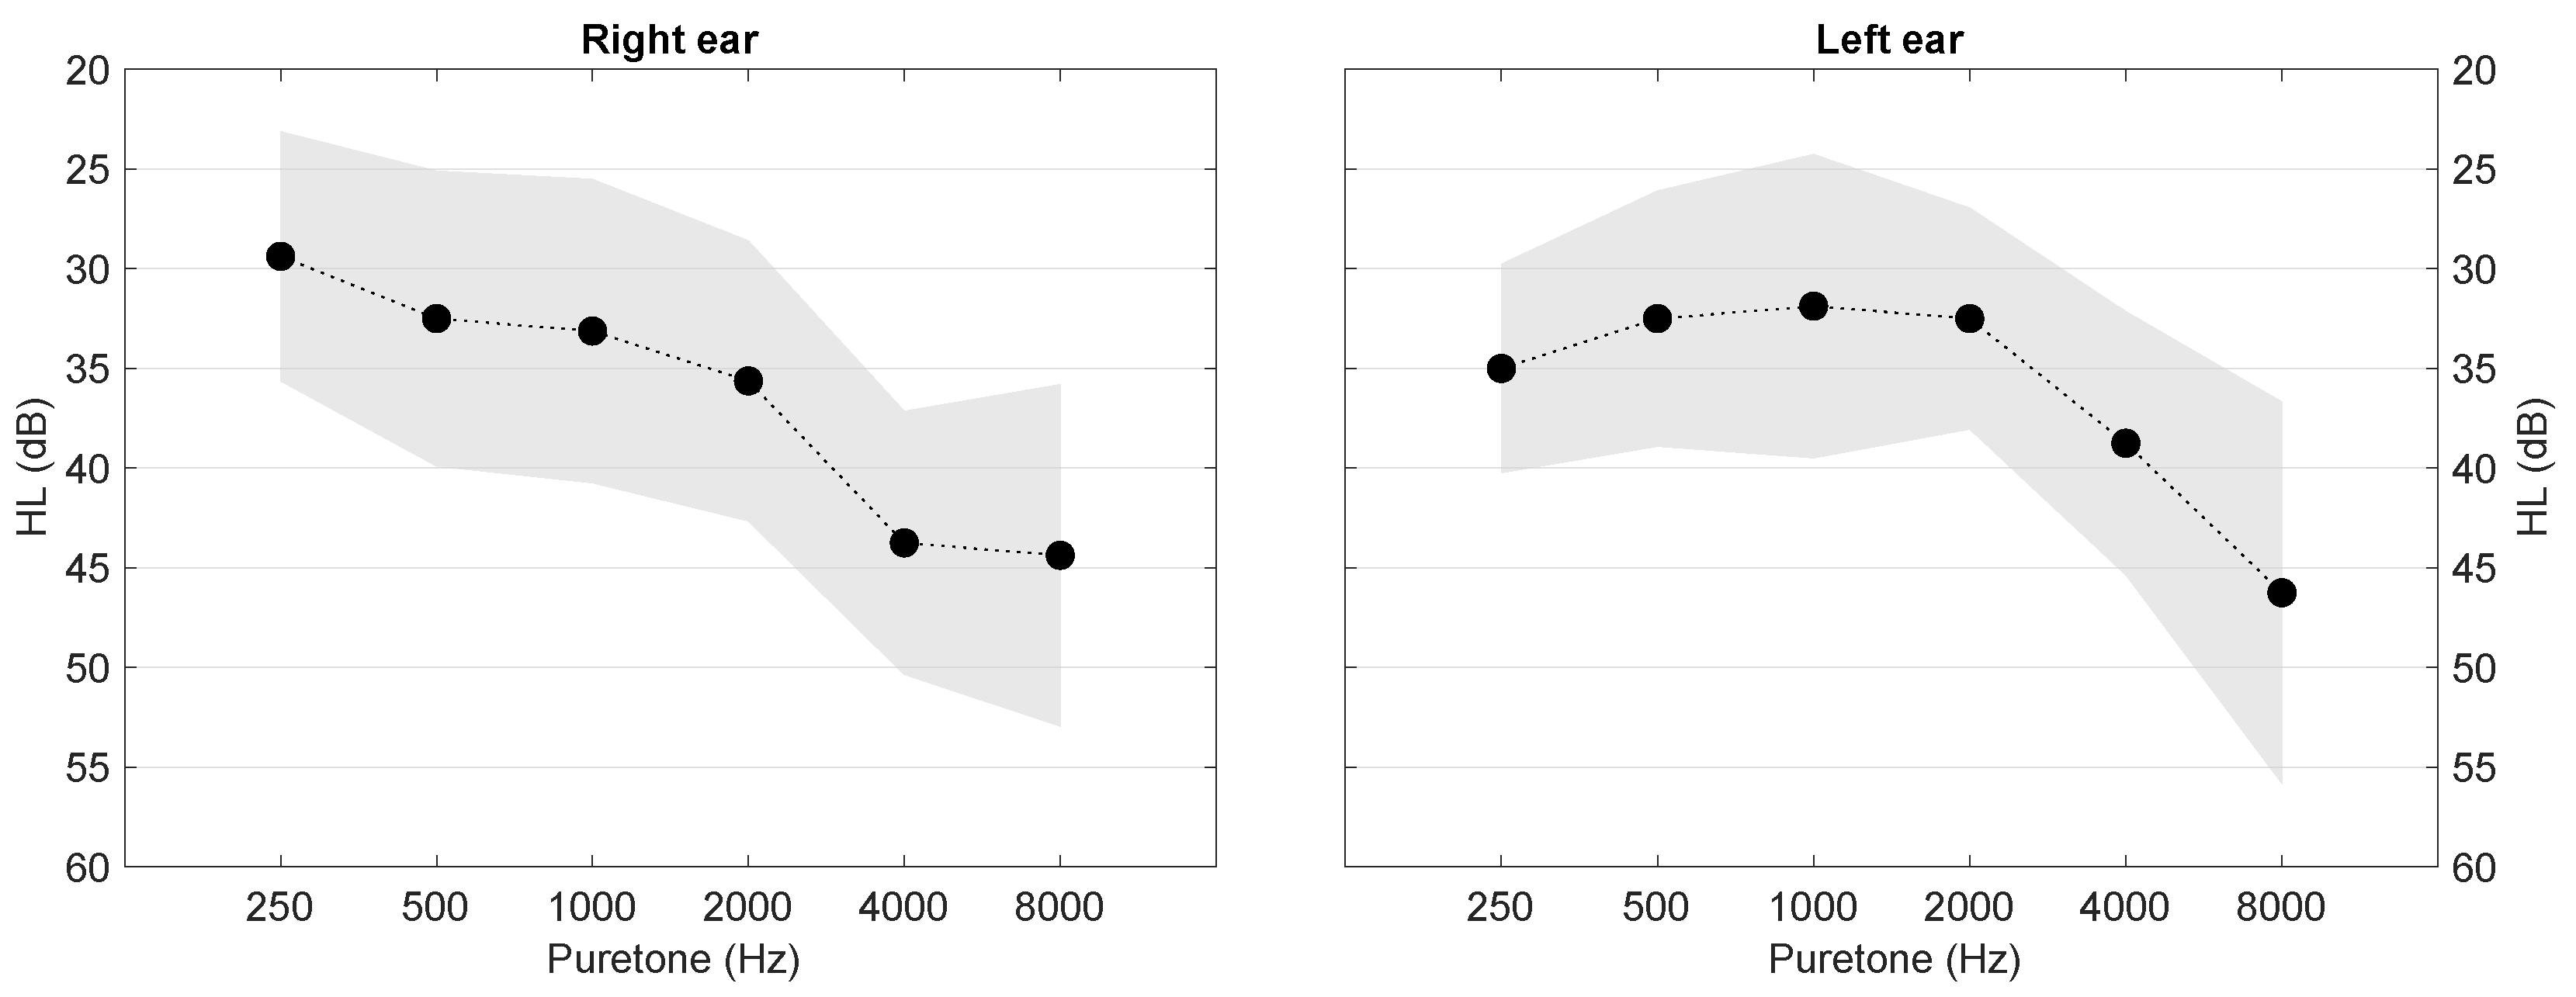
Eight native Mandarin Chinese speakers (5 females, 3 males, average age = 57.6 years with s.d. = 6.4 years) with symmetrical sensorineural hearing loss also participated in this experiment in Jiangsu, China. Of the eight participants, four were daily hearing aid users. Their HLs were measured using the same equipment and procedure as for the NH cohort. The PTA6 across the eight symmetrical cases was 36 dB HL for both the left and right ears, with an interaural difference below 3 dB. The mean HLs in PTA6 for the HI cohort are presented in
Figure 3.
3.2. Procedure
A pool of 2400 stimuli (4 voices × 2 noise maskers × 3 SNRs × 100 sentences) was created. In each stimulus, the clean speech was buffered with 300-ms silences at the beginning and the end before mixing with the noise. This allowed listeners’ hearing to adapt to the background noise and reduce the effect of non-simultaneous masking [
32]. The actual SNR was calculated only from where the target speech was present.
Given the 4 voices, 2 noise maskers, and 3 SNRs, this design led to a total of 24 conditions. In each condition, a listener heard 4 random sentences, resulting in 96 unique sentences screened throughout the test. As some sentences may be more intrinsically intelligible than others, sentences were randomly drawn without placement from the pool for each condition, in order to minimize such an effect. The sampling was also validated to make sure none of the 96 sentences was heard twice by the same listener in different conditions. During the test, sentences were blocked by noise-SNR conditions. Within each block, the order of the sentences was randomized; the order of the noise-SNR blocks was also randomized.
For NH listeners, the experiments took place in the same sound-treated audio booth where the natural voice was recorded, as described in
Section 2.2. The stimuli were presented to listeners over a pair of Sennheiser HD 660S open-back headphones, pre-amplified by the same audio interface used in recording. The presentation level of speech was calibrated and fixed to approximately 69 dB SPL—the normal conversational level [
33]; the noise level was then adjusted to meet the desired SNRs. Stimulus playback was administered by a computer program. After a stimulus was played, participants were instructed to type what they heard from the sentence in Chinese characters using a computer keyboard. Listeners were not allowed to replay any stimulus. Responses were recorded and saved automatically as the experiment progressed. Participants were able to complete the test within 40 min.
Although the HI listeners were recruited at a different site, the experiments were conducted in an audio booth that had similar acoustic specifications as the one for NH listeners. All the experiment materials, design, setup, and equipment strictly followed those for NH listeners, except for the following. All HI listeners wearing hearing aids were instructed to remove their hearing devices and tested with bare ears. Instead of using a fixed presentation level for target speech, all participants in this group were allowed to adjust the speech intensity to a comfortable level (average level = 76.1 dB SPL with s.d. = 5.7 dB) before the experiment started; they could not adjust the level during the test. As the participants in this group had a significantly greater age than the NH group, and some participants were unable to use computers; therefore, the participants responded to stimuli by orally repeating what they heard after each sentence, which was recorded simultaneously by a digital audio recorder.
The intelligibility of the four voices was measured as listener character recognition rate (CRR) in percentages. As Chinese characters have no predictable pattern to their corresponding pronunciations, it is possible that a participant will hear the sound correctly but type a character with the same pronunciation that mismatches the meaning. Thus, both responses and keys were converted to Hanyu Pinyin (the phonetic symbols for Chinese characters) before comparing, in order to take homophones into account. The correctness of the lexical tones in Mandarin Chinese was not taken into account, so the syllables with the same phonemes as the answer but different tones were still considered to be correct. Responses of NH listeners were scored automatically using a computer script, while a manual transcribing and scoring procedure had to be used for HI listeners due to their responses being saved in audio.
4. Results
Figure 4 and
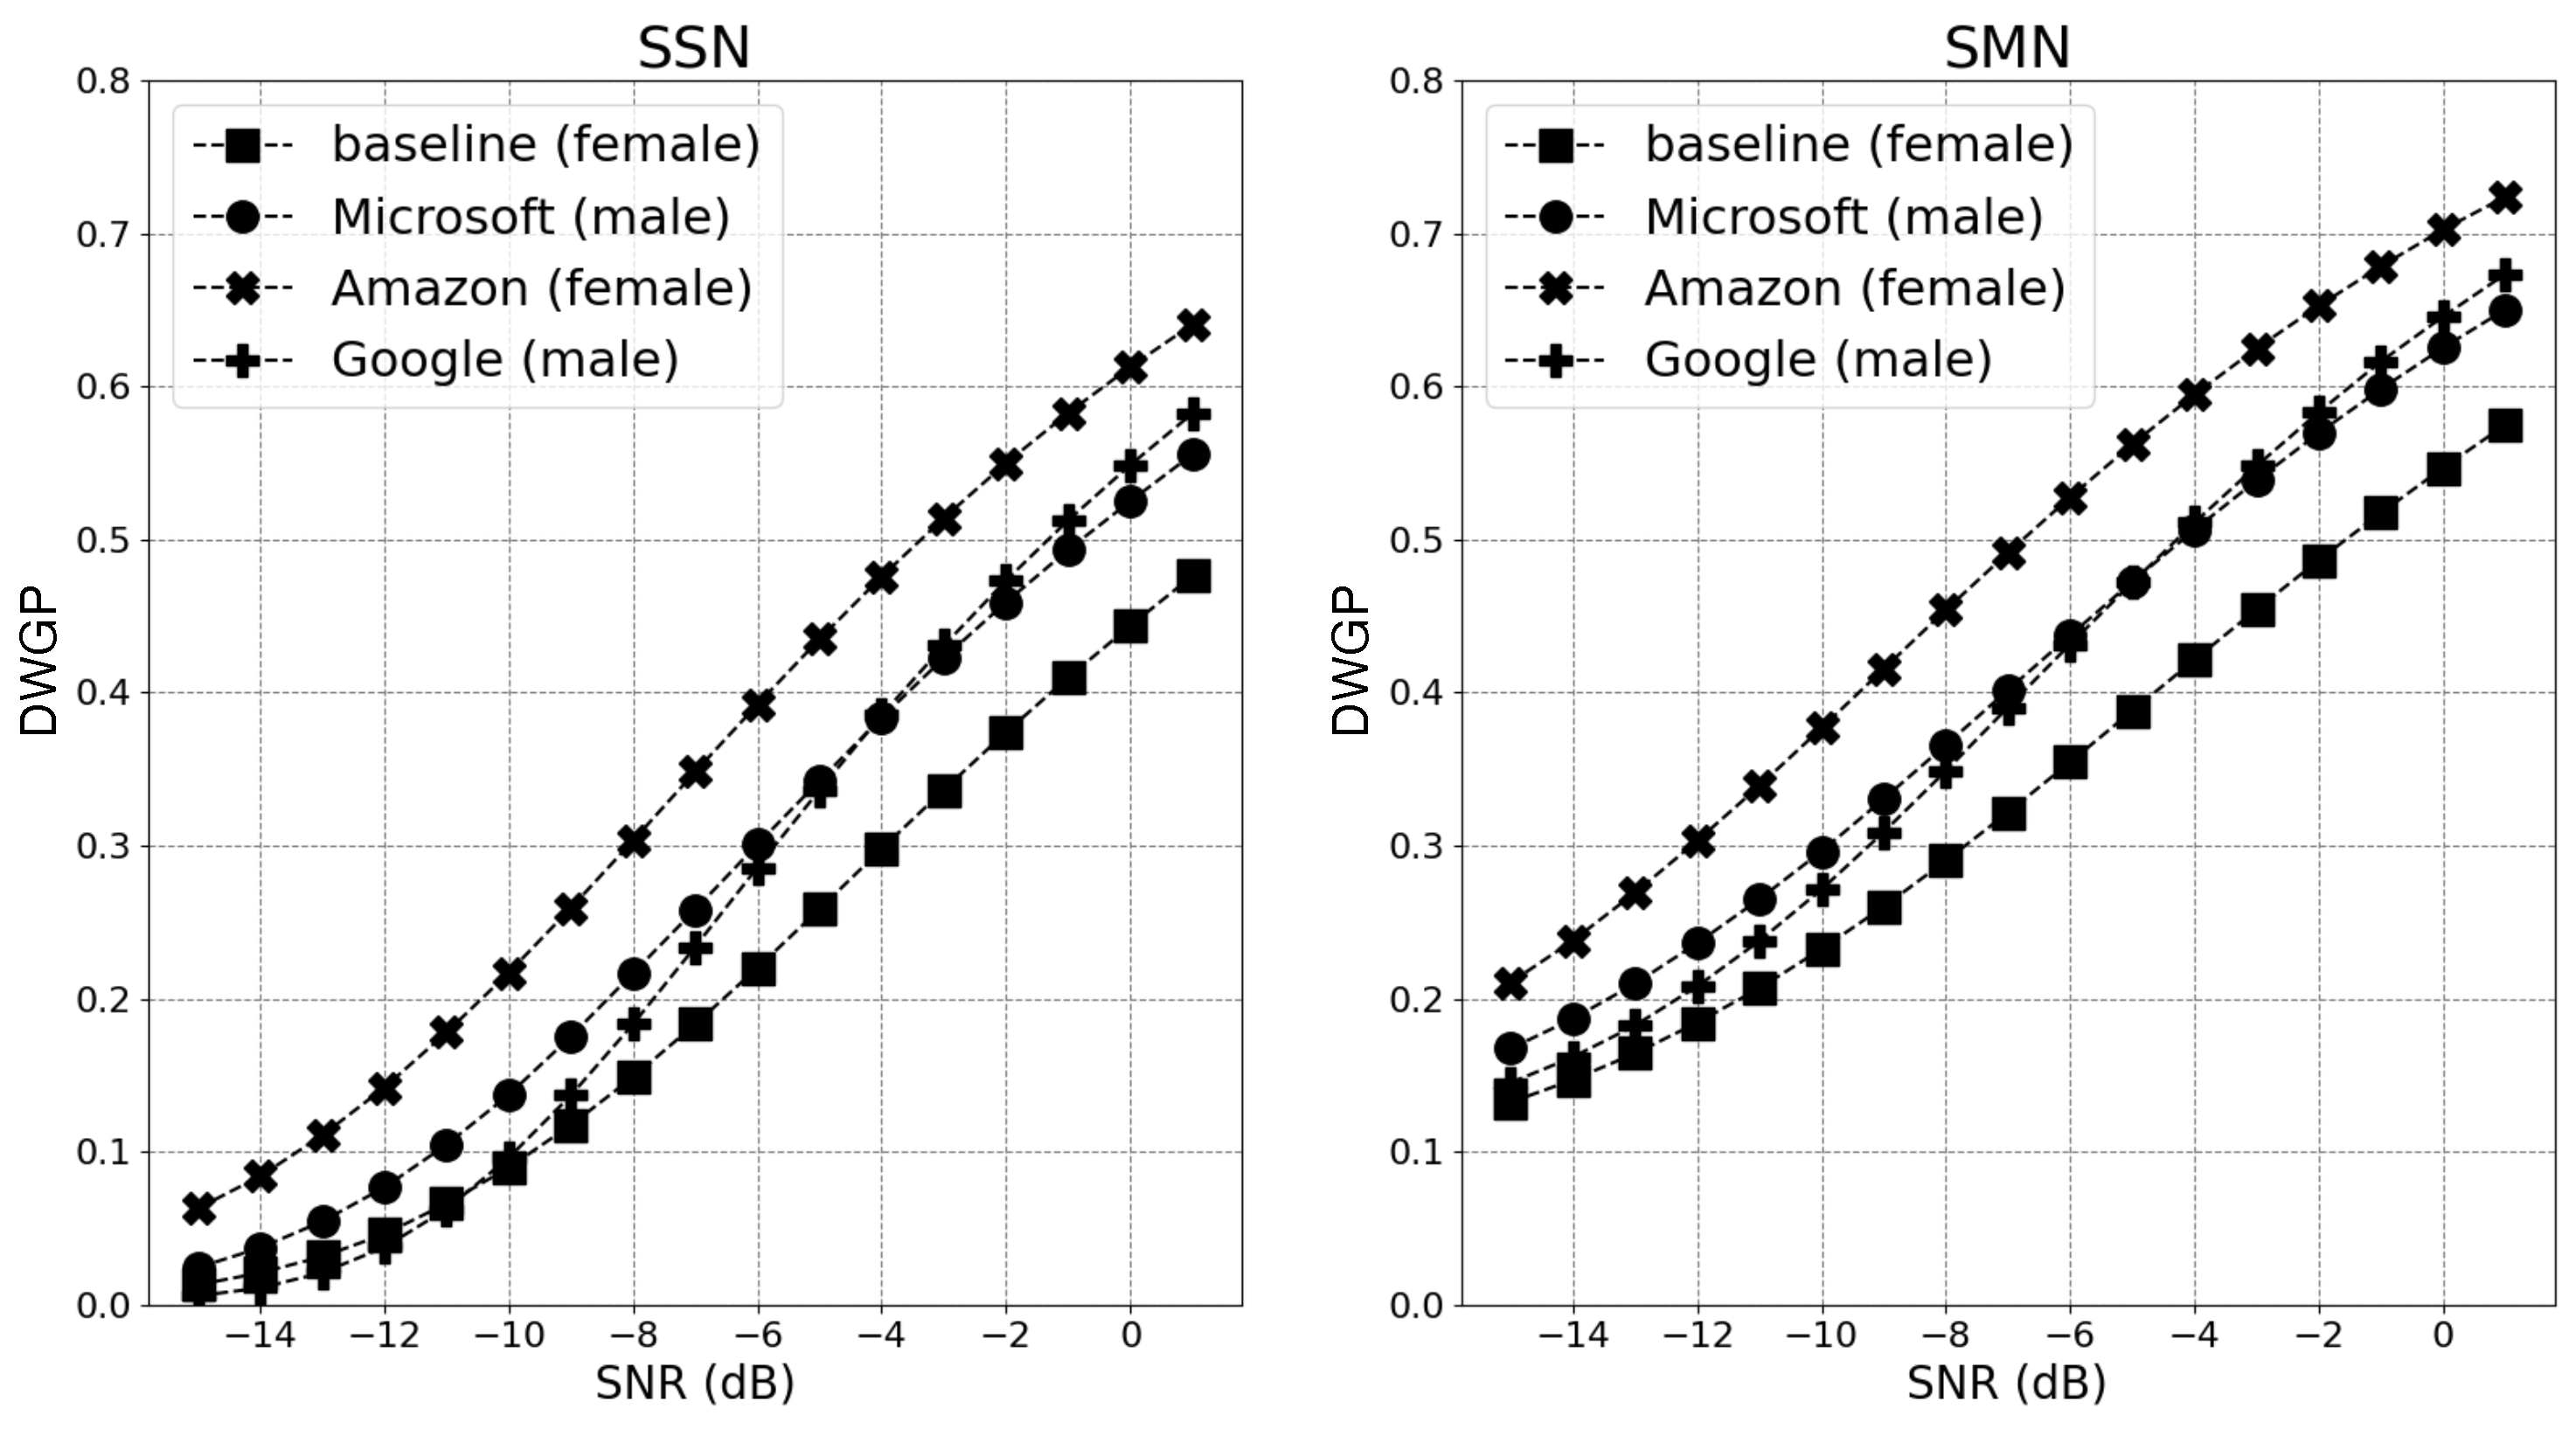
Figure 5 show the average CRRs of participants for the four voices in different noise conditions for NH and HI listeners. For NH listeners, in SSN, “baseline” appears to be the least intelligible at the low and mid SNRs, with CRRs of 4% and 38%. This is broadly consistent with DWGP predictions in
Section 2.4. “Amazon”, on the other hand, leads to noticeably higher intelligibility (38%) than “Microsoft” (13%) and “Google” (8%) at low SNR. “Amazon” (85%) is also more intelligible than “Microsoft” (55%) at the mid SNR, but it no longer outperforms “Google” (86%). At the high SNR, all voices lead to CRRs of no lower than 83%, with “Microsoft” being the worst (83%) and “Google” being the best (98%). In SMN, which has a much stronger fluctuation in amplitude than SSN, “Microsoft” is seen to be the least intelligible instead of “baseline” at all SNRs. The advantage of “Amazon” (54%) over other voices (“Google” (47%) and “baseline” (33%)) at the low SNR is less evident than in SSN; the same pattern can also be observed at the mid SNR.
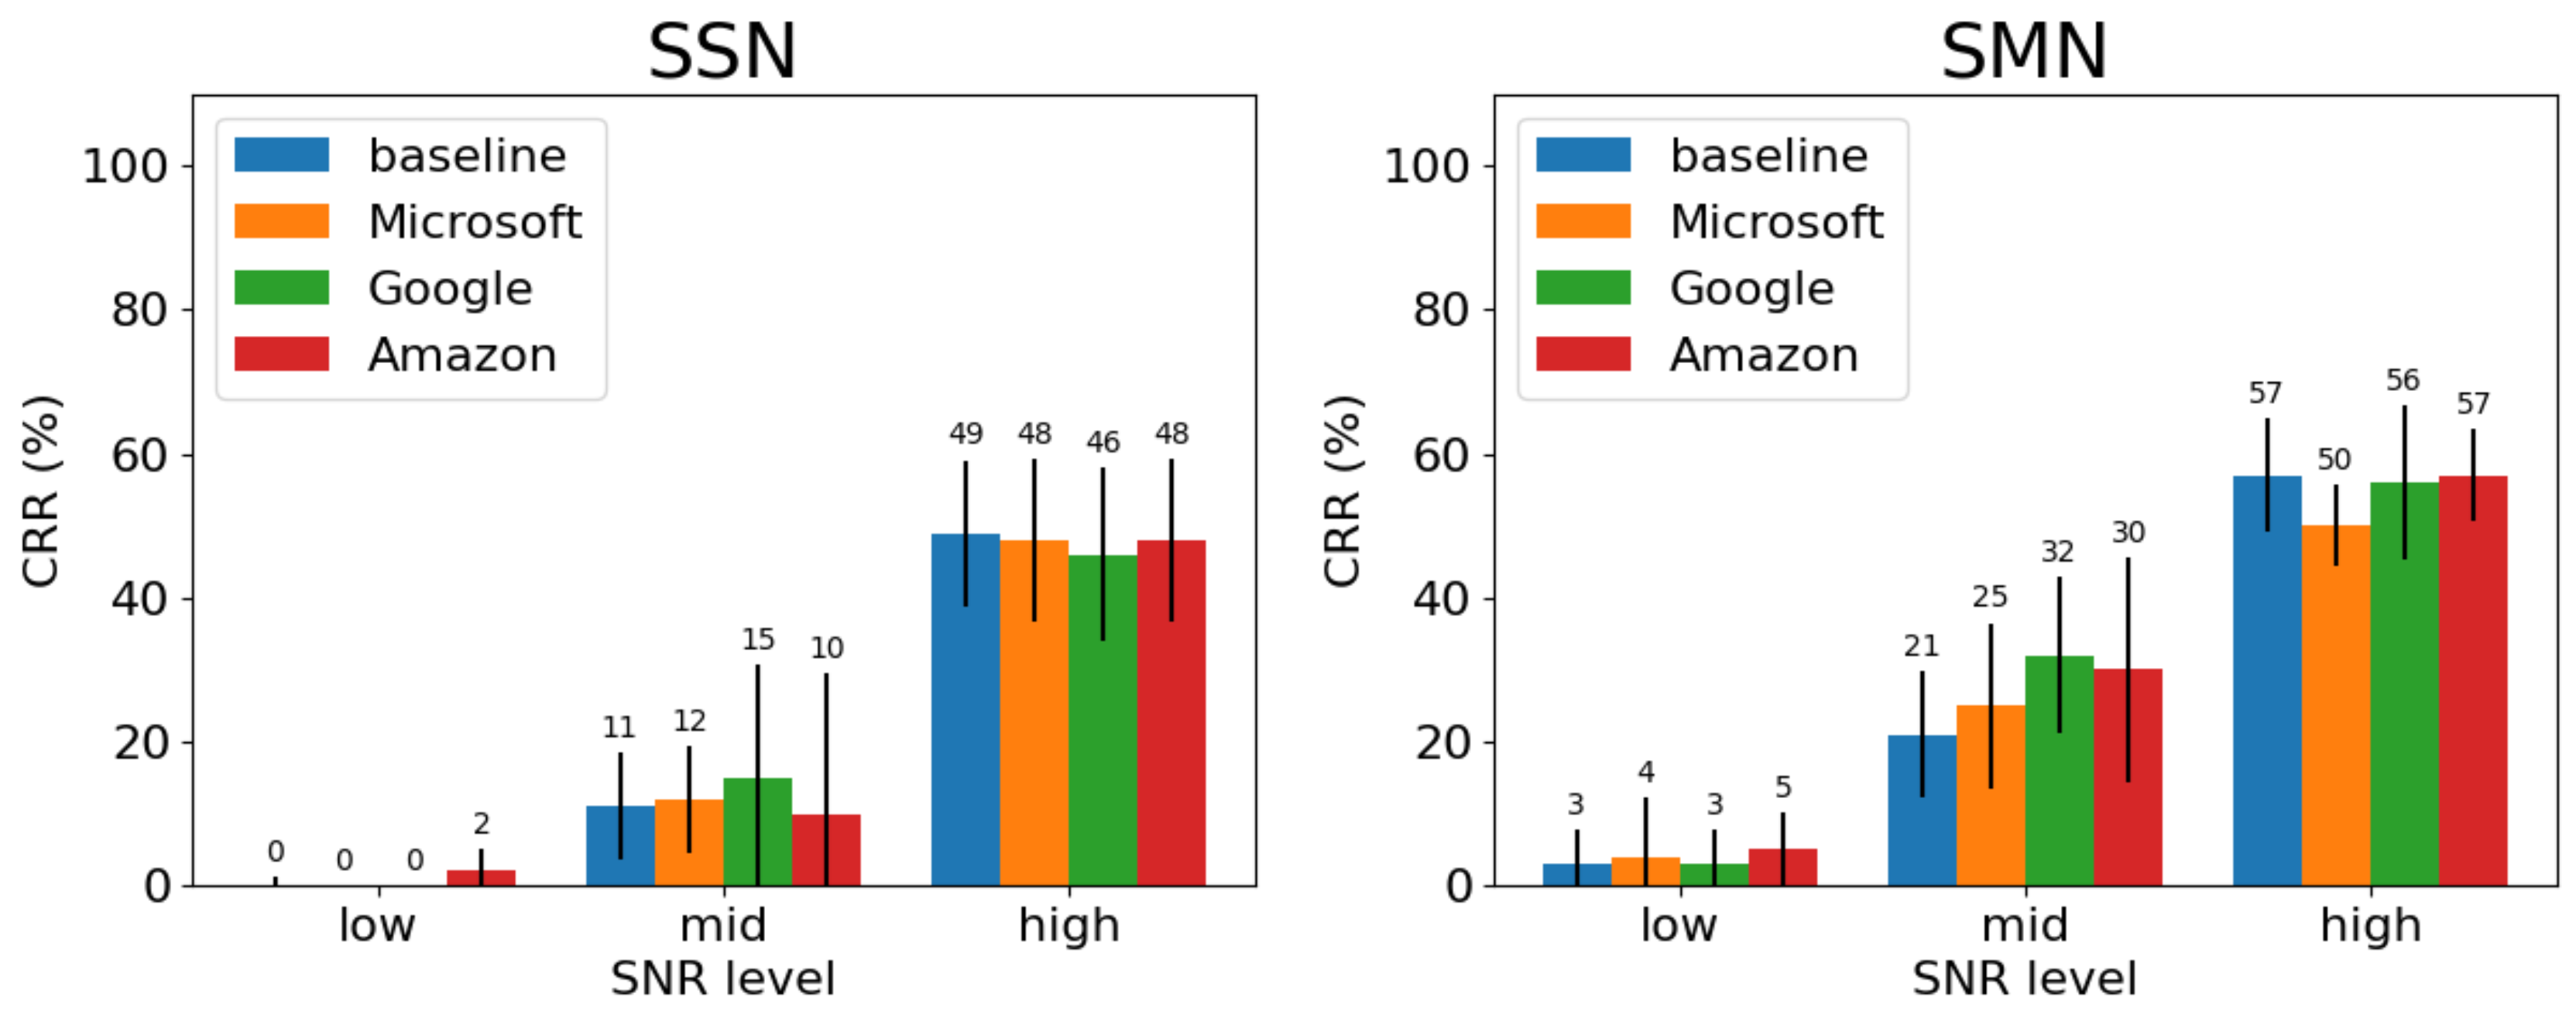
For HI listeners, the intelligibility of all voices is unsurprisingly lower than that of their NH counterpart in all conditions, with average decreases of 37.4 percentage points (ppts) in SSN and 38.3 ppts in SMN across SNRs and voices. The variance in performance also tends to be greater in several conditions as indicated by the extended error bars, as exhibited in
Figure 5. Interestingly, HI listeners did not benefit from “Amazon” or “Google” as much as their NH counterparts did at the low and mid SNRs in both noise maskers. Compared to “baseline” in SSN, the CRR gain of “Amazon” is merely 2 and −1 ppts for HI listeners at the two lower SNRs, respectively, down from 34 and 47 ppt for the NH cohort in the corresponding conditions. The advantage of synthetic voices over “baseline” further diminishes, with the largest intelligibility gain of only 8 ppts achieved by “Google” at the mid SNR.
Listener performance in CRR of both NH and HI groups was further analyzed together using a multi-level linear mixed effects model (LMM) to account for the within-group and between-group variability. The LMM was implemented using the “lme4” package [
34] in R [
35], with CRR as the dependent variable and subject variability as the random effect. The four independent variables—group (“NH” and “HI”), noise type (“SSN” and “SMN”), SNR (“low”, “mid”, and “high”) and voice (“Amazon”, “Google”, “Microsoft”, and “baseline”)—and their interactions were included as fixed effects. Since all independent variables were categorical, a dummy coding scheme was employed, with group: “NH”, noise type: “SSN”, SNR: “low”, and voice: “baseline” being the reference level in each variable.
A series of linear models was built using a step-wise sequential approach with a forward direction, where the independent variables and their interactions were added incrementally, starting with only the random effect.
Table 2 shows the models whose fitting significantly improved over previous models. The results suggested that all independent variables (group, noise, SNR, and voice) had a significant impact on listeners’ CRR performance
. Most of the two-way and three-way interactions between the independent variables were also significant
, and so was their four-way interaction
. The final LMM, therefore, included 12 terms, as shown in
Table 2.
The significant four-way interaction, i.e., group × noise type × SNR × voice, indicates that the voices varied in intelligibility at different SNRs in the two noise maskers between NH and HI listeners. Contrasts were used to break down this interaction in order to gain better insights into the data. All the significant contrasts and their parameters for this interaction are listed in
Table 3 and
Table 4, respectively. Contrast 1 shows that the intelligibility gain from “Amazon” over “baseline” was different at the mid SNR in the two noise maskers for NH and HI listeners. For “Microsoft”, while it was more intelligible than “baseline” at the low SNR in SSN, its intelligibility was lower than “baseline” at the same SNR in SMN for NH cohorts; the difference in intelligibility between the two voices was, however, less sizable for HI listeners. A similar relationship was also observed at the mid SNR in the two maskers for “Microsoft”, but the overall intelligibility level of this voice was higher than that at the lower SNR, as suggested by Contrasts 2 and 3. Contrast 4 indicates a similar result for “Google” at the mid SNR in the two noise maskers for the two cohorts of listeners as for Contrast 1 for “Amazon”.
Post hoc pairwise comparisons with the Bonferroni adjustment conformed with the visual impressions received from
Figure 4 and
Figure 5. In the temporarily-stationary noise (i.e., SSN), at the low and mid SNRs, “Amazon” is substantially more intelligible than “baseline” and “Microsoft” for NH
. “Google” is also more intelligible than “baseline” and “Microsoft” for NH
at the mid SNR. In the fluctuating noise (i.e., SMN), at the low SNR, “Microsoft” is the least intelligible voice compared to other voices
for NH, but not at the mid SNR, where its intelligibility is comparable to “baseline”
but worse than “Google”
and “Amazon”
. In both noise maskers, all the voices are similarly intelligible at the high SNR
for NH, where intelligibility reaches the ceiling. For HI, listener performance shows that there are no voices significantly more intelligible than the others at all SNRs
.
5. Acoustic Analyses
The acoustics of the speech signals were analyzed to explain the listeners’ different performances when perceiving the four voices. Speaking rate, fundamental frequencies, harmonic-to-noise ratio, vowel–consonant duration ratio, spectral tilt, and vowel space were analyzed for sentences in each voice. The Montreal Forced Aligner [
36] was used to generate phoneme- and word-level speech segments from the WAV files, followed by further manual checking and adjustment of the segment boundaries.
- –
Speaking rate. The speaking rate was measured as the count of spoken syllables per second. As each sentence in this corpus consists of seven words (syllables), the speaking rate for a sentence was calculated by dividing the duration of speech in seconds by seven. Measurements for the four voices are shown in
Figure 6a. Pairwise comparisons using the Bonferroni method suggest that the voices significantly differ in speaking rate
, with the difference between “baseline” and “Amazon” being the smallest
.
- –
Fundamental frequency (F0). F0 for each sentence was calculated as the mean F0 over all vowels in the sentence. As a tonal language, the F0 for a syllable in Mandarin can fluctuate greatly and take a sharp upturn, downturn, or both. In order to take tone differences into account, F0s were measured at the beginning, middle, and end of each vowel; the F0 for the vowel was calculated as the mean of F0s at these three points. Since every sentence contains seven monosyllabic vowels, the F0s of the vowels were further averaged and computed as the F0 for the sentence. As shown in
Figure 6b, all the voices differ from each other in F0
. Since “baseline” and “Amazon” are female voices, their mean F0s are significantly higher than those of “Microsoft” and “Google”
, which are male voices.
- –
Harmonic-to-noise ratio (HNR). HNR is the ratio of periodic to non-periodic components in a voiced segment of speech in decibels (dB). It is usually used to show the hoarseness and breathiness of a voice; it is also measured as one aspect of voice quality. For each sentence, the HNR was computed as the mean HNR of the seven monosyllabic vowels. The measurements are shown below in
Figure 6c. The comparisons suggest that all the voices also differed in HNR
. Interestingly, “baseline”—the natural voice—had significantly better HNR than all synthetic voices.
- –
Vowel–consonant (VC) ratio. The VC ratio for each sentence was measured by dividing the total duration of all vowels by the total duration of all consonants in the sentence. The statistics are shown below in
Figure 6d. It appears that the VC ratio varies greatly across sentences, as suggested by the expanded confidence intervals. While “Microsoft”, “Google”, and “Amazon”, the three synthetic voices, see no significant difference in VC ratio
, “baseline” has a significantly lower VC ratio than “Amazon”
, but not than “Microsoft”
or “Google”
.
- –
Spectral tilt. Spectral tilt is one way to quantify how rapidly energy decreases as frequency increases in a speech signal. For analysis in this study, it was measured as the decrease in energy per unit frequency (dB/Hz); that is, the energy difference between the first formant (F1) and the second formant (F2) over the frequency difference between F1 and F2 on the long-term average spectrum of the signal. Therefore, it was the slope of the straight line connecting the two data points of F1 and F2 on the spectrum. The flatter the slope is, the more energy there is at high frequencies relative to that at low frequencies. From “baseline” to “Google” in
Figure 6d, spectral tilt increases successively with significant changes
. Consistent with the visual intuition also, the spectral tilt of “Amazon” is evidently the lowest among the four voices
.
- –
Vowel space. The vowel spaces and their visualizations for the voices were calculated and drawn using the R package “phonR” [
37]. The vowel spaces were calculated by plotting three corner vowels on an F1–F2 chart and finding the smallest polygon that covers the vowels. The three corner vowels are [i], [a], and [u]. These three vowels are frequently supplied as corner vowels in vowel space drawing [
11,
38] and are all present in Mandarin as monophthongs. These graphs are shown in
Figure 7. The vowel space areas (VSAs) of “Amazon”, “Microsoft”, “baseline”, and “Google” are 1,365,952, 1,195,746, 1,096,042, and 981,738, respectively, in descending order. A greater VSA may indicate better speech-motor control and more distinctive articulatory positions for different sounds. To further measure the quality of individual vowels and their overlaps, between- and within-vowel dispersions and their ratios were also measured from the three groups of sound for the four voices. The greater the between-vowel dispersion, the further the different sounds are from each other, hence the less likely they would be confused by the listeners. Meanwhile, a smaller within-vowel dispersion suggests fewer variations for the same vowel, hence a more robust and consistent pronunciation of the vowel. As illustrated in
Figure 7 and further confirmed by
Table 5, the three vowels in “baseline” were most distinctive from each other (the largest between-vowel dispersion) and were pronounced most consistently (the smallest within-vowel dispersion), followed by “Amazon”. The between-within-vowel dispersion ratio, on the other hand, showed that “Google” had the lowest vowel quality, which is in line with its smallest VSA.
Figure 6.
Speaking rate (a), F0 (b), HNR (c), VC ratio (d), and spectral tilt (e) of the natural and three synthetic voices. Error bars show 95% confidence intervals of the means.
Figure 6.
Speaking rate (a), F0 (b), HNR (c), VC ratio (d), and spectral tilt (e) of the natural and three synthetic voices. Error bars show 95% confidence intervals of the means.
Figure 7.
Vowel spaces for the “Amazon”, “Microsoft”, “Google”, and “baseline” voices.
Figure 7.
Vowel spaces for the “Amazon”, “Microsoft”, “Google”, and “baseline” voices.
Two general linear models (GLMs) were fitted on the NH and HI data separately to inspect how well speaking rate, F0, HNR, VC ratio, and spectral tilt as independent variables predicted listener performance in the four voices. The measurements of vowel spaces were not included because, instead of at the sentence level, they were derived at the corpus level for each voice. The values of each predictor were centered to have a mean of zero, further scaled by their standard deviation. For NH listeners, the predictions made by the GLM had a significant correlation with the intelligibility in CRR
. The linear coefficients of the predictors,
, and their SLs displayed in
Table 6 suggest that speaking rate, F0, and spectral tilt played significant roles in estimating the intelligibility of the voices, but including HNRs and VC ratios did not significantly improve the model performance. For HI listeners, the chosen predictors together, however, were unable to make predictions significantly correlated with the CRR
, although including F0, HNR, and spectral tilt, but not others, still significantly improved the model fitting, as indicated by their
values in
Table 7.
6. Discussion
This study examined the intelligibility of speech generated by three commercial synthesizers for NH and HI listeners in different noise conditions. The results were somewhat unexpected but encouraging when compared to listeners’ performance in CRR on natural speech produced by a female speaker, as initially predicted by the DWGP model [
]. Previously, the intelligibility of natural speech was substantially better than that of synthetic speech in noise for NH listeners [
2,
3,
4]. Listener performance in our experiments, however, showed that the natural voice was the least intelligible among the four voices evaluated in many conditions, especially in the stationary masker (speech-shaped noise or SSN), suggesting that, in the last decade, deep learning-based synthetic speech has improved tremendously in terms of its quality [
7] and intelligibility over that which previously used concatenation, a vocoder, and statistical models. In the temporally-fluctuating noise masker (speech-modulated noise or SMN), the advantage of the synthetic voices over “baseline” was noticeably reduced at the low and mid SNRs. Speech temporal modulation is known to be important to intelligibility. One possibility is that the interference due to the masker’s modulation on the target temporal envelope cancelled some benefits from other aspects (see below) and that synthetic modulation could be more susceptible to noise than that of natural speech. “Microsoft” is an example of this, as it appeared to be more intelligible than “baseline” at the low and high SNRs in SSN, but was significantly less intelligible than “baseline” at the low SNR in SMN. Further modulation analysis on the signals may help with understanding this issue better.
For the HI cohort, the correlation between DWGP estimations and listeners’ performance [] was much lower than that for their NH counterpart. This is not surprising because DWGP makes predictions using parameters, e.g., the outer-ear transfer function and the HL, for NH listeners. Notably, HI listeners’ speech understanding did not benefit from any of the state-of-the-art synthesizers as NH did. Nevertheless, it is worth remarking that their intelligibility did not suffer from synthetic speech either compared to natural speech. This shows that modern speech synthesizers are already capable of producing speech sounds that may replace the natural human voice without compromising intelligibility, at least for listeners with normal or even mild hearing loss. Since all hearing aid users were tested without their hearing devices, it is unclear if they could achieve better listening performance with their hearing aids on. Often, hearing devices are fitted to a listener’s hearing profile in order to maximize their performance. Therefore, there could also be a possibility that synthetic sounds interact with their hearing devices acoustically, e.g., overly boost or attenuate certain frequencies, leading to the processed sounds having mismatching frequencies for the listener, hence reduced intelligibility.
Further acoustic analyses revealed that speaking rate was one of the significant factors that explained the NH listeners’ intelligibility in this study. It was suggested that NH listener performance benefited from a lower speaker rate
in general, but this was not the case for HI listeners
. This finding is consistent with what was observed in [
23] for NH. With a lower speaker rate, listeners may have more time to process and decode the information conveyed by the sounds, especially when perceiving speech in noise, which usually demands higher cognitive loads [
39]. This may partly explain the benefit of “Amazon” to listener intelligibility (
Figure 4 and
Figure 6a). Among the four voices, the lowest speaking rate was approximately 4.12 syllables/s, which is consistent with the normal speaking rate—4.08 syllables/s [
40]—for native Mandarin Chinese speakers. It appears that the speaking rates tested in this study were too high for HI listeners to benefit from. Cognitive decline associated with aging, e.g., [
41] of the HI group (average age = 57.6 yrs) might be another factor contributing to their reduced acuity in speech perception. F0 alone was not seen to be correlated with listener intelligibility for NH
or HI
, but including it in the GLMs improved the model prediction. There is no direct evidence showing that solo F0 changes have a significant impact on intelligibility for NH [
42,
43] or HI listeners [
44]. For Lombard speech, which is often produced when a listener speaks in noise and is understood to be more intelligible than speech produced in quiet, increased F0 was indeed observed together with many other acoustic changes, such as reduced spectral tilt and elongated vowel sounds [
45], in relevant studies. Therefore, it is possible that F0’s contribution to intelligibility is only manifested in the presence of other prominent acoustic correlates. Meanwhile, it is well-documented that solely reducing spectral tilt can lead to improved speech intelligibility for NH listeners, e.g., [
17,
46], which is also observed in the current study
, especially for “Amazon”. In the GLM, it also indicates that intelligibility is proportional to spectral tilt
. Despite the significant effect in the GLM model for HI, like F0, spectral tilt was not correlated with intelligibility for HI
. In SSN and SMN, which have a similar spectrum as speech signals, voices with reduced spectral tilt often stand a better chance of escaping from masking since more energy is located at high frequencies of speech. NH listeners can exploit the unmasking at high frequencies for better intelligibility. As shown in
Figure 3, the majority of HI participants in this study had more severe hearing loss at high frequencies, which led to them not being able to take as much of an advantage as NH listeners did.
VSA and vowel quality were not found to have an evident correlation with intelligibility in this study. In general, “Google” was the second most intelligible voice after “Amazon” across all conditions and sometimes appeared to be even better than “Amazon” (
Figure 4 and
Figure 5). However, the VSA, between-vowel dispersion, and between-within-vowel dispersion ratio of “Google” were the smallest among the four voices. The findings in terms of the relationship between VSA and its pertinent measures and intelligibility are mixed. While expanded VSA was reported in some studies on clear speech, e.g., [
10,
47], and on Lombard speech compared to normal speech, e.g., [
10], reduced VSA was also found in Lombard speech in other studies [
48,
49]. Therefore, the current findings lean towards the conclusion that VSA and vowel quality do not have a direct impact on the intelligibility of synthetic speech, despite the plausible speculation that little overlap between sounds and consistent pronunciation may reduce confusion between sounds.
This study has a few limitations. First, only six acoustic features were analyzed. There are several other properties that also correlate with intelligibility, including emphasis and prosody [
50,
51]. Two acoustic measures that can indicate emphasis are F0 contour and maximum intensity of the signals [
52], as they give strong cues to listeners of what to expect in the speech. On the same note, the DWGP model predicted intelligibility well, implying that there could be other acoustic aspects accounted for by the DWGP model but not analyzed in this study. For example, no evidence was found to explain the intelligibility ranking for “Google”, which led to comparable intelligibility as “Amazon” in several conditions but considerably differed in acoustic measurements analyzed in this study. Second, only a limited number of synthetic voices was evaluated. Including more voices could exhibit different intelligibility and analytical results. Third, the number of participants in both groups was relatively small, which might lead to weak statistical power in the analyses.


