Biomechanical Modeling of Wounded Skin

1
Department of Bioengineering, University of Pittsburgh, Pittsburgh, PA 15213, USA
2
Department of Aerospace Engineering and Mechanics, University of Alabama, Tuscaloosa, AL 35401, USA
3
Department of Surgery, University of Minnesota, Minneapolis, MN 55455, USA
*
Author to whom correspondence should be addressed.
J. Compos. Sci. 2018, 2(4), 69; https://doi.org/10.3390/jcs2040069
Submission received: 22 November 2018
/
Revised: 12 December 2018
/
Accepted: 12 December 2018
/
Published: 14 December 2018
Abstract
:Skin injury is the most common type of injury, which manifests itself in the form of wounds and cuts. A minor wound repairs itself within a short span of time. However, deep wounds require adequate care and sometime clinical interventions such as surgical suturing for their timely closure and healing. In literature, mechanical properties of skin and other tissues are well known. However, the anisotropic behavior of wounded skin has not been studied yet, specifically with respect to localized overstraining and possibilities of rupture. In the current work, the biomechanics of common skin wound geometries were studied with a biofidelic skin phantom, using uniaxial mechanical testing and Digital Image Correlation (DIC). Global and local mechanical properties were investigated, and possibilities of rupture due to localized overstraining were studied across different wound geometries and locations. Based on the experiments, a finite element (FE) model was developed for a common elliptical skin wound geometry. The fidelity of this FE model was evaluated with simulation of uniaxial tension tests. The induced strain distributions and stress-stretch responses of the FE model correlated very well with the experiments (R2 > 0.95). This model would be useful for prediction of the mechanical response of common wound geometries, especially with respect to their chances of rupture due to localized overstraining. This knowledge would be indispensable for pre-surgical planning, and also in robotic surgeries, for selection of appropriate wound closure techniques, which do not overstrain the skin tissue or initiate tearing.
1. Introduction
Skin wounds are caused due to rupture of one or more layers of the skin [1]. Figure 1 shows the three layers of the skin, namely the epidermis (outermost layer), dermis (middle layer) and hypodermis (bottom layer) and a dermal skin wound. Bleeding occurs mainly due to the rupture of blood vessels which extend from the hypodermis through some parts of the dermis. Wounds may be classified broadly as shallow (epidermal and dermal) and deep (dermal and hypodermal). Typically, deep wounds require surgical intervention and suturing for timely healing [2]. To date, suturing is based on a surgeon’s experience and there is a wide variation in suturing techniques from one surgeon to another [3]. Better understanding and characterization of the biomechanics of wounds may help in valuable improvements in wound healing and also provide benchmarks and guidelines for robotic surgeries involving wound closure with sutures.
In literature, the mechanics of wound closure has been studied using computational modeling [4]. One of the earliest numerical wound closure models was developed by Danielson and Natarajan et al. [5], which involved the estimation of maximum and minimum stress zones using the tension field theory. The first 2D finite element (FE) model of wound closure was developed by Larrabee et al. [6] in 1986. Cavicchi et al. [7] incorporated the skin pre-stress effect in an FE model for the first time. Skin pre-stress which occurs due to the natural tension of the skin has been observed to affect skin wrinkling and wound closure significantly [8]. Cavicchi et al. [7] considered the skin as a 2D surface with isotropic material property and investigated the effect of equi-biaxial pre-stress on two cases of circular wounds (small and large). From the analyses, it was observed that maximum stress around the large circular wound was approximately 200 kPa higher than that of the small circular wound. It was concluded that the wound size also affects the stresses around the wounds. Flynn et al. [9] in 2010 developed an FE model to quantify the wound closure force requirements for symmetric wound geometries. A skin pre-stress of 10 kPa (x-axis) and 5 kPa (y-axis) was applied for four wound geometries namely circular, fusiform, elliptical and lazy S-plasty. From the analyses, the elliptical geometry was found to have the lowest wound closure force requirement. Capek et al. [10] in 2012 further extended the study on wound closure force estimation of elliptical wounds with varying sizes, with and without skin pre-stress effect. It was observed that the wound closure force requirements had a strong dependence on both the size of the elliptical wound and skin pre-stress. Feng et al. [11] investigated the impact of neck incision location on total laryngectomy procedure outcome, using FE analysis. Two separate neck incision models namely low-neck apron (involving the tracheostoma) and mid-neck apron (not involving the tracheostoma), were investigated under different neck loading conditions. From the study, the mid-neck apron model was observed to result in up to 11 times lower von Mises stresses compared to the low-neck apron model, which complied with clinical observations. Chanda et al. [12,13] in 2017 developed a novel 3D computational model of a multilayer skin. A symmetric dermal wound was created and sutures were placed using a novel suture pulling technique, and in the presence of biaxial skin pre-stress. A seven-step interrupted suturing process was simulated and force requirement for each suture were estimated. A mathematical relation was also developed relating the wound flap displacement and suture force requirement, which is applicable to a range of symmetric wound geometry and sizes.
A few experimental studies have been conducted in literature to model wound closure and suture. Melis et al. [14] in 2001 conducted suturing experiments on 9 cm × 9 cm rectangular wounds created on skin samples of piglets, and manually estimated suture force requirements. From the study, a mean tensile force of 22.66 N was recorded for sutures with the maximum at the center suture. Freck et al. [15] in 2001 investigated suturing on sheep skin. The average axial force estimated for suture was 1.9 N. Subcuticular suturing was performed by Cacou et al. [16,17] on human skin specimens with different wound geometries. It was concluded from the study that the wound closure force has strong dependence on wound geometry, with elliptical geometry leading to lowest suture force requirements. Corr et al. [18] reviewed studies on the similarities and differences in mechanical properties of scar tissue and uninjured skin. Stress-relaxation experiments and tensile failure testing were found to indicate the changes in the directional properties of the tissue in healthy state versus in injured state. Specifically, compared with uninjured skin, the scar tissue was observed to exhibit similar high-load stiffness, significantly less resistance to failure, lower low-load compliance, and changes in the material directionality. Chanda et al. [19] in 2017 also developed a biofidelic human skin tissue phantom material and created different wound geometries to study the effect of wound geometry and size on the average skin response in a tensile test. Actual sutures were placed to close the wounds, and the average stress-strain responses were compared with the mechanical behavior of wounded specimens without sutures. It was observed from the experiments that, with sutures, the average skin response is similar to unwounded skin. Local changes around the wounds were not quantified and the influence of geometrical parameters of the wound on the surrounding skin straining was not characterized.
To date, there is a lack of knowledge on localized straining of skin wounds. This inhibits the understanding of localized overstraining and possibilities of rupture in wounds during skin surgeries. To address this key gap in literature, a novel experimental framework was developed to study skin straining due to common wound geometries, using uniaxial mechanical testing and Digital Image Correlation (DIC). A biofidelic skin phantom [20,21,22,23] was employed, and common wound geometries and sizes were simulated, to characterize the induced local strains. Additionally, a biofidelic computational model was developed to simulate the experimental results. This model would be valuable for prediction of localized overstraining and skin ruptures for common wound geometries in surgeries. Additionally, this knowledge may not only guide the development of better pre-surgical planning techniques, but can also be applied to robotic surgeries for selection of wound closure techniques which inhibit skin tissue overstraining and rupture. Section 2 will discuss the materials and methods of the experimental and DIC modeling framework, along with the development of the computational model. Section 3 will discuss the various results followed by conclusions in Section 4.
2. Materials and Methods
2.1. Test Specimen Fabrication and Digital Image Correlation (DIC) Framework
Two-part silicone material with a shore hardness of 30A (Mold Star 30 from Smooth-On, Inc., Macungie, PA, USA) was mixed in a 1:1 ratio by weight to fabricate biofidelic human skin phantoms [19,24,25,26,27,28,29,30,31]. Ten test coupons were generated with 50 mm length, 9 mm width and 2.5 mm depth. Common elliptical wound geometries [10] of varying dimensions were created using a scalpel and regular scissors on 5 out of 10 coupons (Figure 2a). The direction along the length of the coupon was considered as the y-axis and the orthogonal direction along the width of the coupon was considered the x-axis. The wounds were classified based on their aspect ratios (AR, ratio of width along x-direction and length along y-direction, see Figure 2a) along the axes as Wound 1 (AR = 0.20, symmetric-short), Wound 2 (AR = 1.50, symmetric-long), Wound 3 (AR = 0.14, asymmetric-wide), Wound 4 (AR = 0.16, asymmetric-thin), and Wound 5 (AR = 0.07, transverse) respectively to study the effect of wound dimension on the strain fields.
In literature, DIC techniques have been used especially in micro and nano scale mechanical testing applications to understand the localization of strains in a material under varying loading conditions [32]. Especially, DIC have been used to understand crack initiation and propagation in hard composite materials [33]. Recently, DIC was used to understand anisotropic local skin tissue deformation [34]. However, to date, DIC has not been used to study soft materials under damage conditions.
In this work, a certain set of steps were followed to conduct the DIC experiments. Spray paint (KILZ White Interior/Exterior paint from Home Depot, Tuscaloosa, AL, USA) was dispersed on the surface of the test coupon in such a way that the speckle patterns are fine, dissimilar, and densely populates the surface to be studied (Figure 2b). This process was repeated six times to obtain the desired speckle pattern [32]. A high-quality camera (20.1 Mega Pixel Sony DSC-H400 Single-Lens Reflex (SLR) camera, Tokyo, Japan) was used on a tripod to record the tensile tests. The videos were run through a video-to-image conversion software to obtain 12–14 images from each test. The average length of the videos recorded was 48 s. Each test was conducted and recorded three times to ensure repeatability.
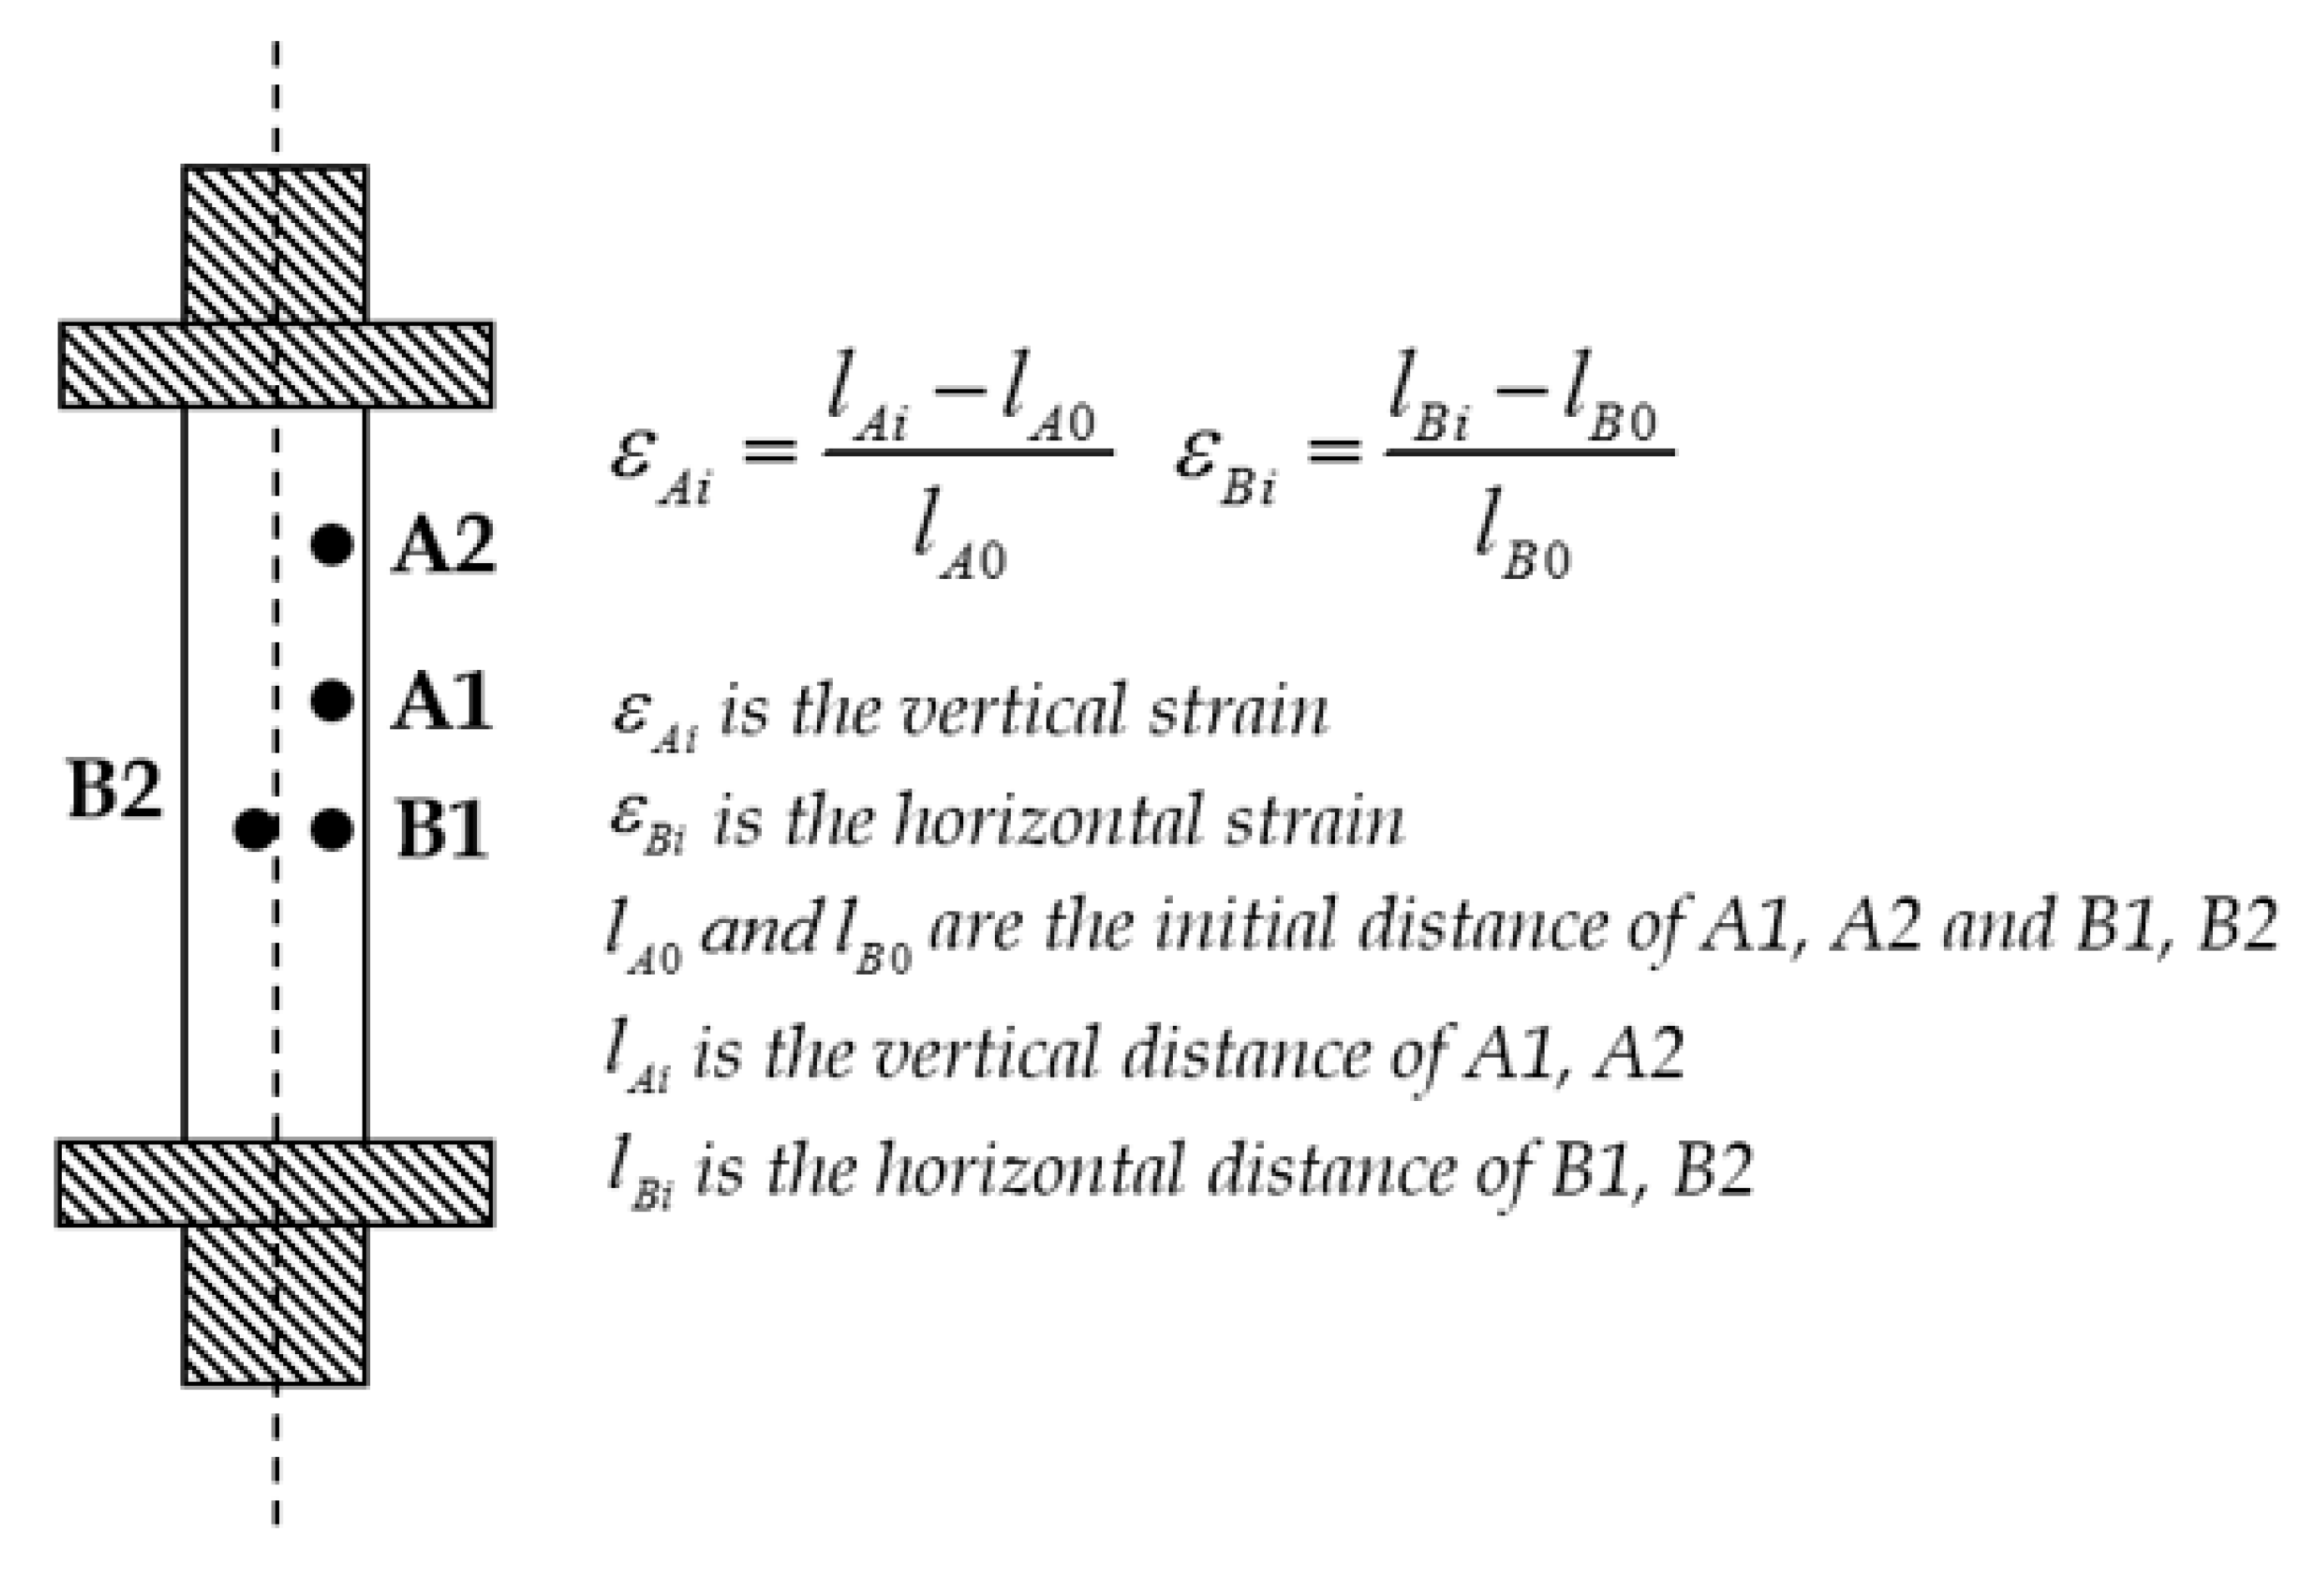
Visual Image Correlation (VIC) 2D software (from Correlated Solutions Inc., Columbia, SC, USA) [32] was used for post processing of the image sets from the tensile tests. VIC-2D analyses subtle differences between two images taken before and after the deformation by a solid-state digital camera. Strains are calculated based on the spray particle displacements measured by VIC-2D throughout the different deformation phases during the tensile test. According to Bruck et al.’s numerical model of the deformations observed in a DIC study [32], the strain calculations along the length and width of a tensile test coupon is estimated using the equations presented in Figure 3.
2.2. Mechanical Tensile Testing
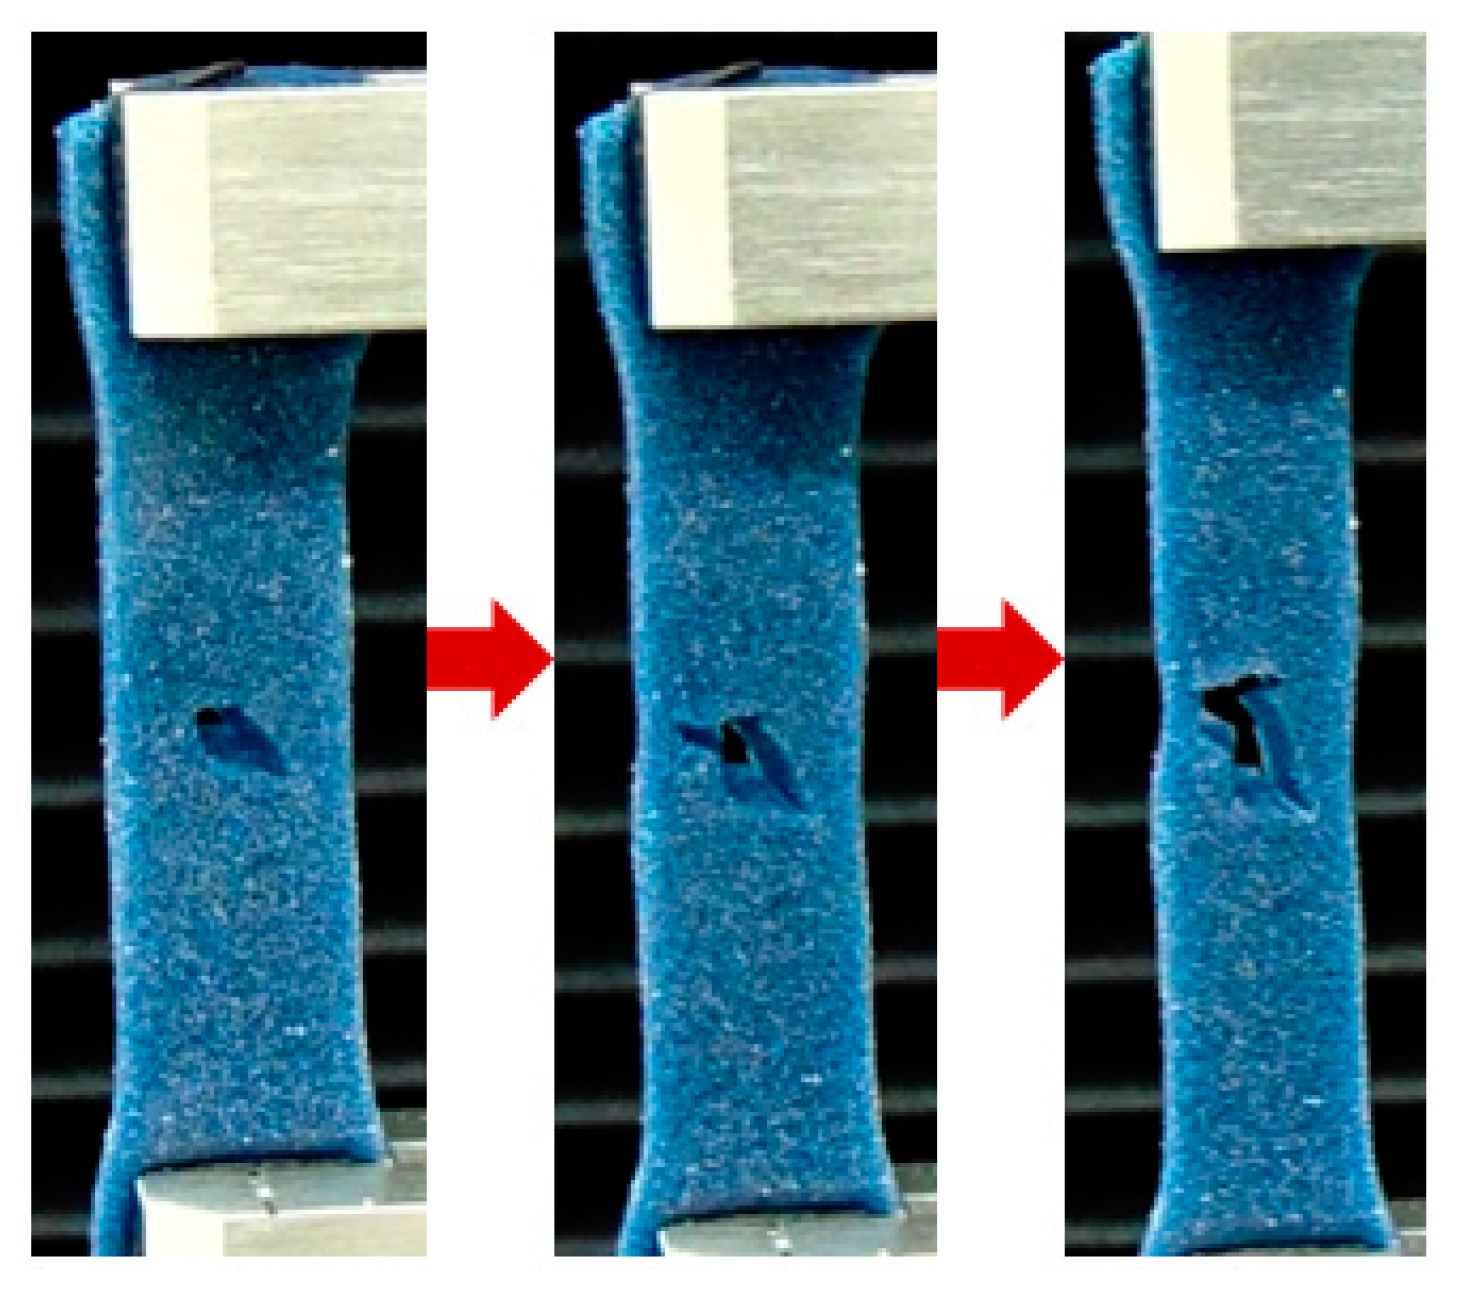
Uniaxial mechanical testing was conducted on all biofidelic human skin phantoms using a universal testing machine (MTS Criterion Model 42, Eden Prairie, MN, USA) to measure the load versus deformation behavior under tension. A constant strain rate of 0.4 mm/s was used to conduct all experiments based on literature [34,35,36,37,38]. The standard size chosen for all test coupons was 34 mm × 9 mm × 2.5 mm (after clamping) [34,35,36,37,38]. Five coupons with no wounds were tested first to obtain baseline measurements and to calibrate the VIC 2D system. After baseline measurements, tensile tests (Figure 4) were conducted on test specimens with wounds and strain changes with time were quantified using VIC 2D. Overstraining, defined as the occurrence of a high strain zone (i.e., strain ≥25% of average strain [4]), was identified during the tests. Possibility of rupture was indicated for incidences of high strain zones surrounded by low strain zones (i.e., strain ≤25% of average strain [4]).
2.3. Finite Element Modeling
The computational model of the coupon was developed based on the size of the actual coupons used in the experiments (50 mm length, 9 mm width and 2.5 mm depth). Figure 5 shows the transverse wound geometry observed under a microscope. The direction along the length of the coupon was considered to be the y-axis and along the width to be the x-axis. The geometries of the coupon and the wound were measured and modeled (Figure 5) within the finite element software ANSYS (ANSYS 17.1, Canonsburg, PA, USA). Meshing was conducted using the higher order 3-D 20-node Solid 186 element, which perform well with large deflections, hyperelasticity, and large strain deformations [39,40]. The test specimen was constrained in all degrees of freedom at the bottom end, and pulled from the top end. Tensile test with a strain rate of 0.4 mm/s was simulated by transferring the Displacement-Time data from the experiments into ANSYS dynamic FE solver. The stress-strain plots obtained from experiments were compared with the results from the computational analysis. Also, the local strains were analyzed and the results were compared with the DIC based measurements.
2.4. Nonlinear Material Modeling
Soft tissue surrogates such as the human skin phantom exhibits nonlinear biomechanical behavior, which can be modeled using isotropic hyperelastic formulations such as Fung, Mooney-Rivlin, Ogden, Yeoh, and Veronda-Westmann [13,20,25,41,42,43,44,45,46,47]. Hyperelastic models are based on the material dependent strain-energy function (denoted as ) [48,49]. The strain energy function depends on either the principal stretches (, and ) along the x, y and z Cartesian coordinate axes, or the Cauchy-green tensor invariants namely , and (also functions of the principal stretches) [41] given by where . In the current work, the Veronda-Westmann’s hyperelastic model was used to characterize the nonlinear mechanical behavior of the human skin phantom. The strain energy functions of Veronda-Westmann’s model is given by Equation (1).
The principal Cauchy stress is expressed in terms of the stretch and the strain energy function using Equation (2). Further, using Equations (1) and (2), Equation (3) is obtained. Using experimental stress-strain data from uniaxial tests in the current work, the hyperelastic curve fit parameters and were predicted using Equation (3) (see Table 1) with an R2 correlation value of 0.982.
3. Results and Discussion
3.1. Strain in Skin Phantom without Wound
Skin phantom specimens were tested in tension and DIC was used to model the strain distribution on the specimen surface (Figure 6). To quantify the baseline strain versus time data in the skin phantom specimens, strains were measured using DIC in a skin phantom specimen without wound, and compared with the strains recorded using the experimental device. Figure 6 shows the average strain field post-processed using DIC. A total of 14 frames were extracted from the 40 s long video of the tensile test. Markers were placed at 6 different locations to obtain the average strain versus frames (Figure 7) for five coupons each tested twice. It should be mentioned here that the plot axes have been modified for all Strain () versus Time Frame, from eyy [1]-Lagrange versus Index [1] for Figure 7 and following figures for clarity. A high R2 correlation of 0.976 was estimated for the average strain versus time frame results and the data from the experimental device, and the overall error in DIC strain measurements was quantified to be 2.3 ± 0.3. The maximum difference in the local strains recorded at different locations of the specimen, and the average strain was 0.11 (14%), indicating no overstraining or rupture potential.
3.2. Strains in Skin Phantom with Symmetric-Short Wound
Tensile tests were conducted on the specimen with symmetric and short wound geometry (Wound 1), and DIC was used to study the local strains around the wound perimeter. A significant strain build-up was observed around the wound periphery majorly concentrated on the left and right sides (Figure 8). Markers were placed at the different locations around the wound periphery (Figure 9) and the specific strain values were estimated. It was observed that the average strain value for the test specimen was lower than that at the points of strain build-up. The maximum strain recorded was approximately 31% greater than the overall average strain, indicating possible overstraining. The strain values recorded at the top and bottom points of the wound were lower than that of the average strain observed for the specimen. Also, the strain values recorded on the left and right side of the wound (at points P4 and P5 in the Figure 9) were similar, which could be due to the near symmetric elliptical geometry of the wound. No possible rupture sites, characterized by the incidence of high strain zones surrounded by low strain zones, were observed.
3.3. Strains in Skin Phantom with Symmetric-Long Wound
The specimen with symmetric and long wound geometry (Wound 2) was subjected to tensile strain and 14 frames were extracted from 49 s visual data (Figure 10). A high stress build-up was observed on the left and right side of the wound to start with, which shifted dominantly to the right side with increasing strains. Using 6 markers along the circumference of the wound as shown in the inset in Figure 11, the lowest strains were estimated at the top and bottom of the wound. All the markers along the left side of the wound (P1, P3 and P4) resulted in similar strain changes as seen in the Figure 11. The highest strains were recorded for the marker P2 on the right side of the wound, the maximum value of which was 34% higher than the average strain (indicating overstraining). Additionally, the strain at the bottom was observed to increase with time (with a maximum value of >30% over the average) with a zone of low strains (with a minimum value of <25% below the average strain) around it, which may be a possible rupture site, with high chances of skin tearing.
3.4. Strains in Skin Phantom with Asymmetric-Wide Wound
The test specimen with asymmetric and wide wound geometry (Wound 3) was subjected to tensile loads for 42 s and 14 frames were extracted for the DIC measurements. A high stress build-up was observed initially on the left-hand side of the wound which shifted eventually to the right-hand side (see Figure 12). On quantification of the strains along the circumference of the long wound with 7 markers (Figure 13), the strain fields were found to be close to each other all around the wound with the peak at point P2 initially which was on the left-hand side. After 8 s, the maximum strain was recorded for marker P5, which was within 25% of the average strain, indicating no overstraining. The significant differences in the strains at the left and right sides could be attributed to the asymmetry of the wound geometry. The lowest strains were observed at the top and bottom of the wound similar to other wounds. Additionally, no possible rupture sites were identified.
3.5. Strains in Skin Phantom with Asymmetric-Thin Wound
Specimen with asymmetric and thin wound geometry (Wound 4) was subjected to the tensile test for 41 s and 14 frames were captured (Figure 14). Eight markers were placed around the wound circumference and the strains were tracked (Figure 15) using DIC. High strain build-ups were observed at the top (P0 and P1), left side (P3) and bottom right (P5) locations along the wound geometry. The reason behind such arbitrary high strain zones could be the thin and asymmetric geometry of the wound. The maximum strain quantified for marker P5 was approximately 24% above the average strain, indicating possibility of overstraining at higher applied strains. The lowest strain was observed at the bottom most point of the wound. Strains estimated at the other locations were observed to be similar. Also, with time, the top locations P0 and P1 experienced high strains (with maximum values over 22% of average strain) surrounded by a low strain zone (with minimum values below 26% of average strain), which may be possible sites of rupture with further applied strains, cause progressive tissue tearing.
3.6. Strains in Skin Phantom with Transverse Wound
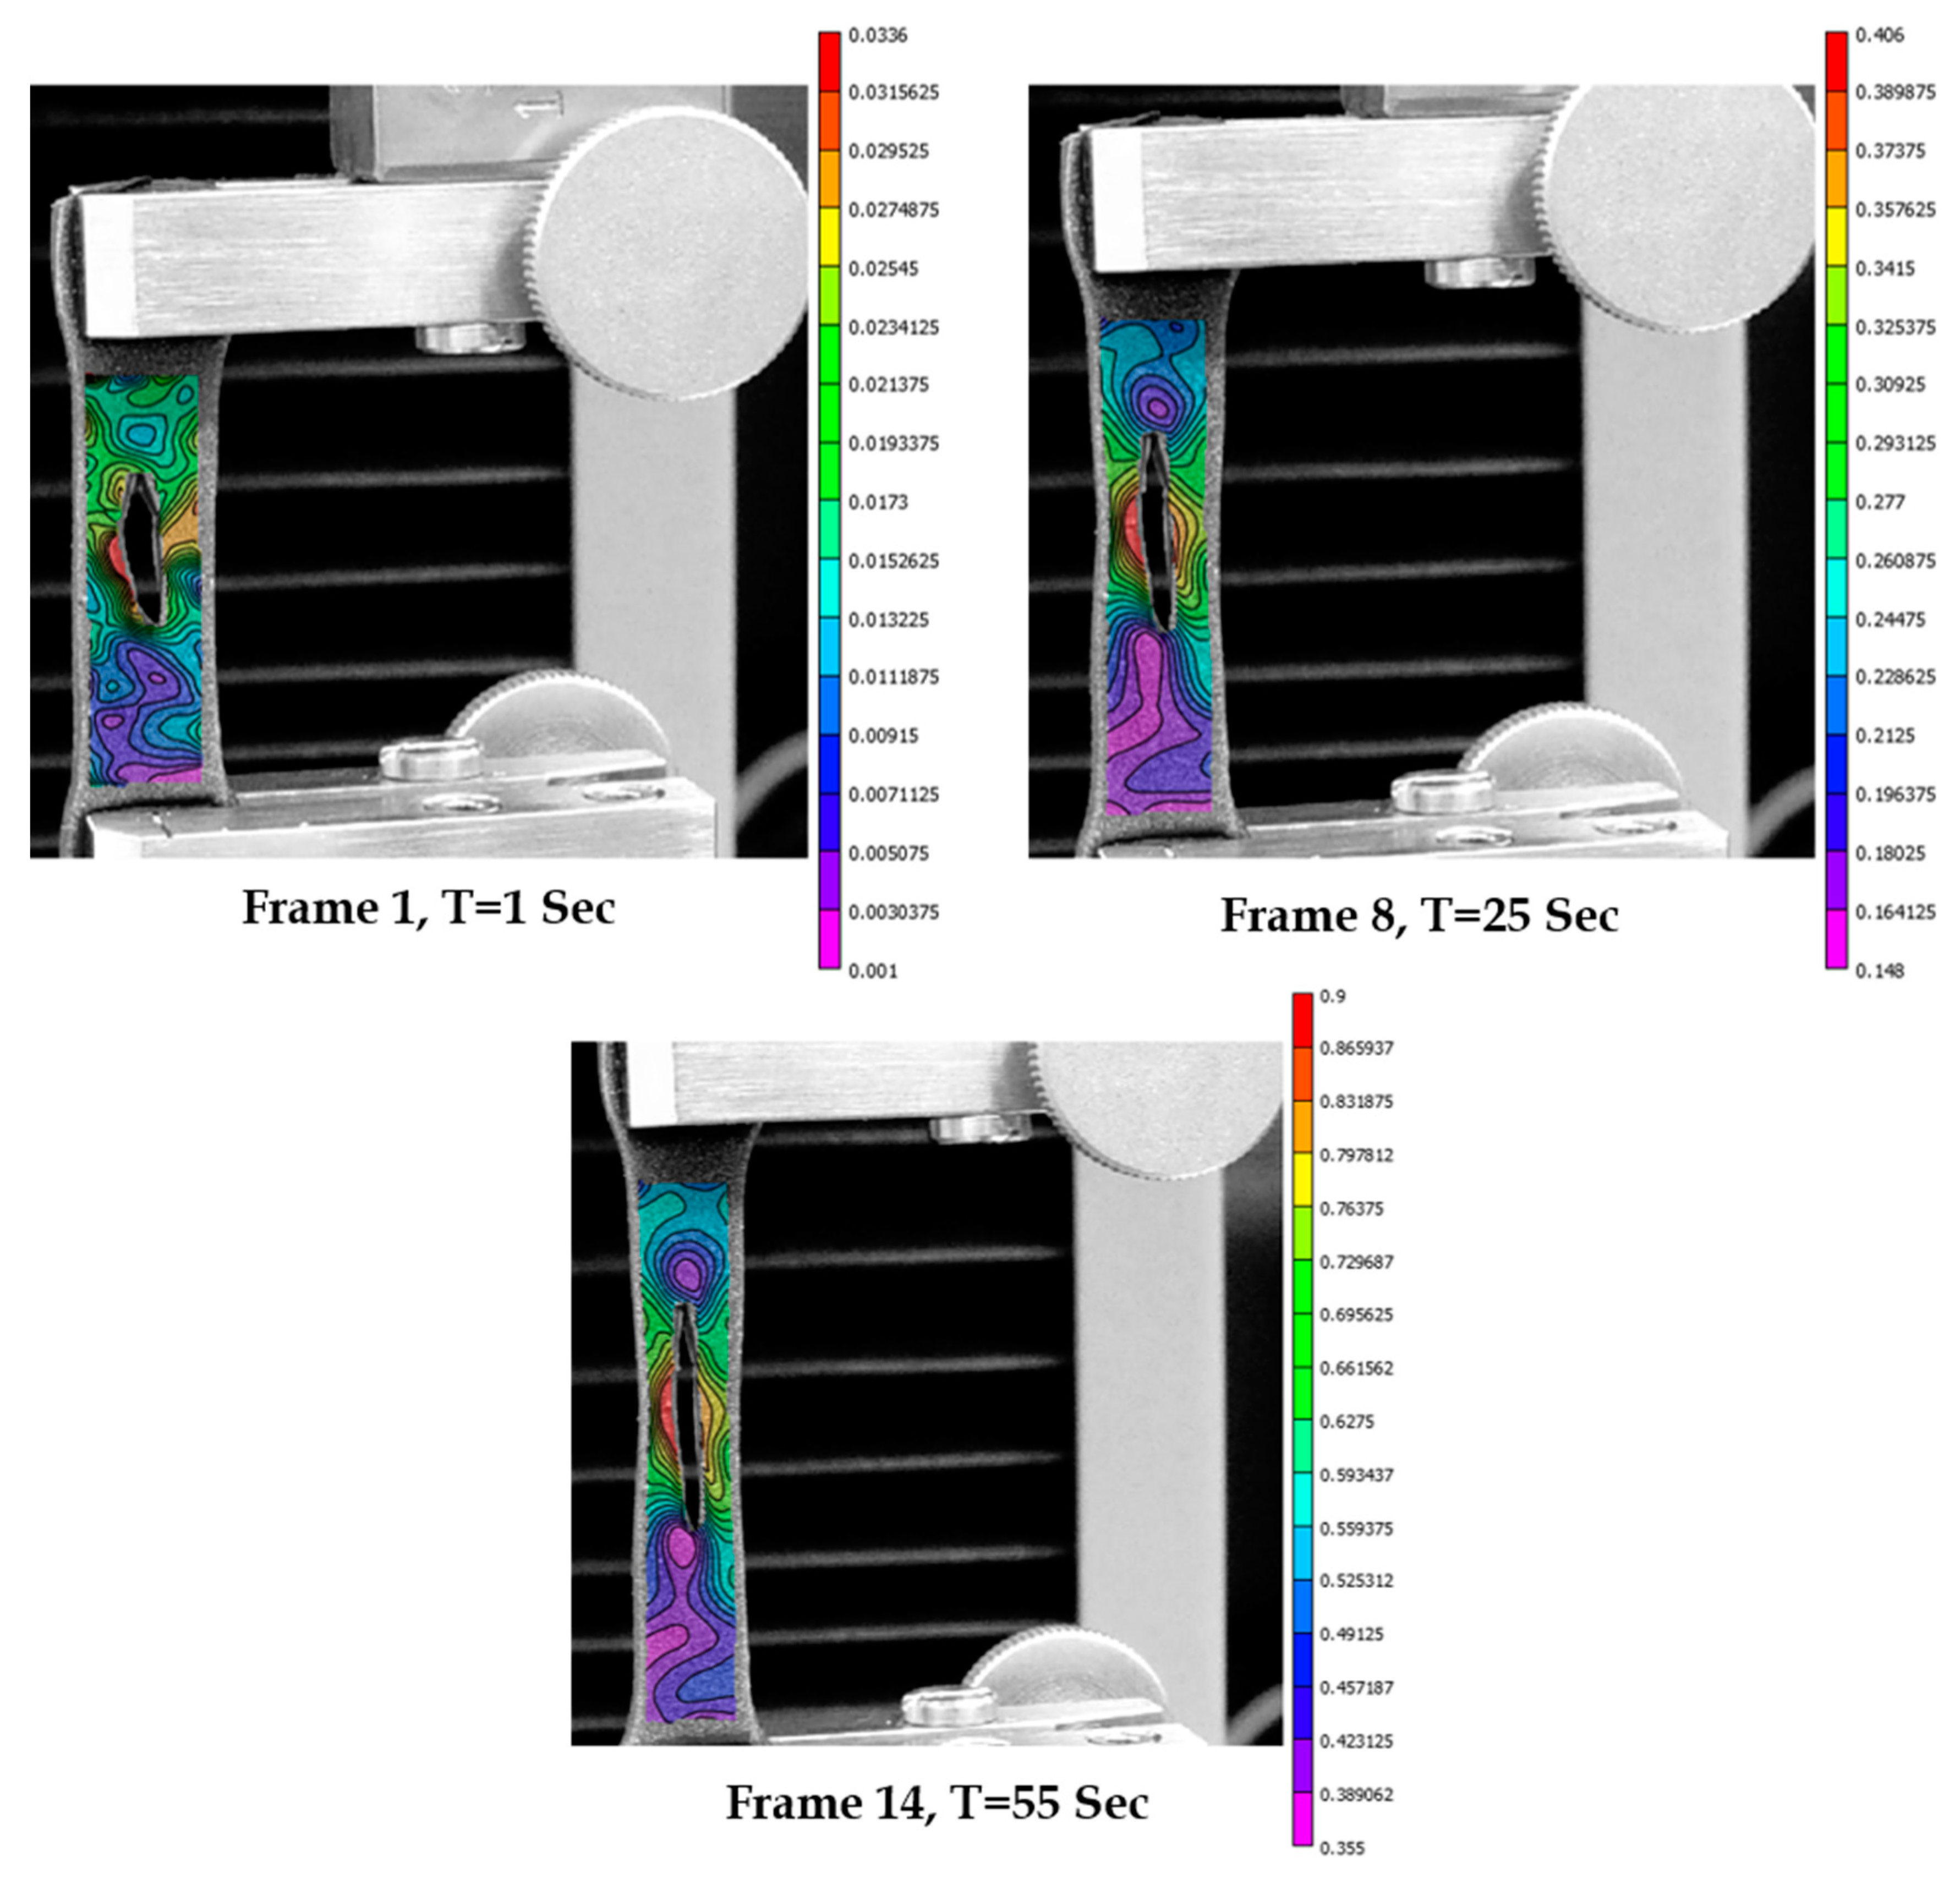
The specimen with the transverse wound geometry (Wound 5) was subjected to tensile test for 57 s and 12 frames were extracted for DIC measurements. It was observed that there was a symmetric strain build-up on the left and right side of the wound to start with, followed by a localized high strain build-up on the left size of the wound circumference, finally leading to tearing in that direction (see frame 12 of the Figure 16). Four markers were placed along the wound geometry to quantify the strain changes (Figure 17). Point P1 at the left-hand corner had a steep rise in strain followed by the point P3 on the right side, P0 on the top, and P2 at the bottom. The maximum value of strain recorded for marker P1 was over 53% higher than the average strain, indicating massive overstraining. The average strain was found to be higher than the strains at the bottom point P2. Also, a low strain region (with minimum value <45% of average strain) was observed around the localized high strain zone at the location of marker P1, indicating high possibility of tissue rupture. The actual tearing observed in the experiment validated this hypothesis of high tearing possibility at the location of high strain surrounded by a low strain zone.
3.7. Comparison of Strains in Skin Phantoms across Wound Geometries
The DIC results from the different wound geometries were compared. It was observed that the strain at the bottom most point of the wound was always the lowest and its value was lower than that of the average strains measured for the specimen throughout. For symmetric long wounds with the long edge along the y-axis (direction of tension), the maximum strains were observed at the left and right sides of the wound with similar values. The wider this long wound was, the greater was the difference between the strains on the left and right side. Asymmetry in the wound geometry also played a major role in the strain differences in the left and right side. For a short wound, the strain distribution was similar at the top, left and right due to the comparable aspect ratio (AR~1) of the wound length (along y-axis) and width (along x-axis). However, the geometry of the wound in case of short wounds was observed to play a significant role in deciding the superior strain build-up locations with tension, which may drive soft tissue rupture (as seen in case with wound 5). Also, for thin and long wounds (wound geometry 4), high strain build-up was observed on the top of the wound which may lead to rupture and increase in the length of the wound. All these findings provide valuable insights into the local wounded skin biomechanics for common wound geometries and sizes.
The average strain versus time plots of the specimens with no wound and the ones with the different wound geometries were compared as shown in Figure 18. From the study, the strains observed for wounded specimens were found to be lower than those without wounds. The lowest strains were observed for the specimen with the smallest size and the most symmetric wound (specimen 5). The strains were found to increase with decreasing AR. The strains for the wound with lowest aspect ratios (Wound 4, AR = 0.07) was found to be the closest to the strains observed in the specimens with no wounds.
3.8. Computational Modeling of Stress and Strain on Transverse Wound
A computational model of the biofidelic skin phantom with transverse wound geometry 5 was developed to model the local strains in tension and to compare it with the experimental results and DIC measurements. Applying constant strain rates employed in the experiments to the computational model, the deformation of the specimen is shown in Figure 19 at the times 2 s, 24 s and 57 s respectively from the start of the test.
The local strains around the wound studied using the computational analysis were compared with DIC measurements. Figure 20 captures the strain distribution around the wound for a constant strain rate of 0.4 mm/s at 2 s, 24 s and 57 s respectively. The maximum strain was observed at the left side of the wound in both the computational and DIC measurements. This localized strain build-up could be attributed to the geometry of the wound. Another common observation is the occurrence of minimum strains at the top and bottom of the wound. After 24 s, strain reduction was observed around the wound due to tearing in the DIC measurements, which was not captured by the computational model.
The maximum local strain variation with time around the wound, from the computational model, was compared with the experimental data obtained using DIC measurements (Figure 21). It can be seen that there is good agreement between the computational data and the experimentally measured maximum strain.
The average stress-strain responses of the computational and experimental models were compared for the transverse wound 5 geometry selected, and also with the normal unwounded skin. In Figure 22, the skin with the wound was observed to be more compliant than the normal skin. Comparing the experimental and computational plots of the wound under tension, an R2 correlation index of 0.976 was estimated. The computational plot was observed to become stiffer compared to the experimental values after a strain of about 0.4. This observation may be attributed to skin phantom tearing which was observed during the experiments. However, the tearing was not simulated in the computational model, possibly resulting in higher stress values after a strain of 0.4.
4. Conclusions
In this work, the mechanics of wounded skin was studied using experiments, DIC and computational modeling. Specifically, localized overstraining and possibilities of rupture in wounded tissue was investigated. A biofidelic human skin phantom was employed to develop skin tensile test specimens, and some common wounds geometries were created. The test specimens were subjected to uniaxial strains and DIC was used to investigate the strain fields developed due to different wound geometries. Local markers were placed around the wound circumference to closely monitor the strain changes around the wound during the tensile test. The symmetric wounds were found to result in maximum strains at the left and right sides and minimum strains at the top and bottom. Asymmetry and reducing wound thickness was observed to lead to significant differences in the strain values on the left and right sides of the wound, and also the development of localized high strains. Also, the wound aspect ratio was found to inversely affect the average strains developed around the wound periphery. Skin overstraining and possibilities of tearing were observed in all symmetric wounds, with the maximum effect in the transverse wound with the lowest aspect ratio. A novel computational model was developed based on the experiments with the common elliptical transverse wound geometry, exhibiting the most prominent overstraining effect and rupture. Hyperelastic material properties were adopted from the experiments and tensile strain was applied on the numerical model of the wounded skin. The results from the analyses were found to be in close agreement with experiments and DIC measurements. A few limitations of the computational work should be acknowledged. Only a few common elliptical wound geometries were considered in the study. Skin tissue tearing was not modeled in the current computational model which will be incorporated in future studies to improve the accuracy of the model. Also, the effect of biaxial pre-stress loading and skin tissue material anisotropy needs to be included to obtain more precise insights into the mechanics of wounded skin. To date, this study is the first attempt towards biomechanical modeling of wounded skin, with a focus on localized overstraining and rupture possibilities. The results of the study will help the selection of wound closure techniques which may cause minimal skin overstraining and rupture possibilities, informing pre-surgical planning and future applications in robotic surgeries.
Author Contributions
Conceptualization, A.C.; Data curation, W.U.; Formal analysis, A.C.; Supervision, A.C.; Writing–original draft, A.C.
Funding
This research received no external funding.
Acknowledgments
A.C. would like to acknowledge the collaboration with Advanced Computational and Experimental Mechanics Laboratory (ACEML) at the University of Alabama (UA) for the experimental facility and equipment.
Conflicts of Interest
The author declares no conflict of interest.
References
- Stillman, R.M.; Bella, F.J.; Seligman, S.J. Skin wound closure: The effect of various wound closure methods on susceptibility to infection. Arch. Surg. 1980, 115, 674–675. [Google Scholar] [CrossRef] [PubMed]
- Broughton, G., 2nd; Janis, J.E.; Attinger, C.E. The basic science of wound healing. Plast. Reconstruct. Surg. 2006, 117, 12S–34S. [Google Scholar] [CrossRef] [PubMed]
- Reiley, C.E.; Lin, H.C.; Varadarajan, B.; Vagvolgyi, B.; Khudanpur, S.; Yuh, D.; Hager, G. Automatic recognition of surgical motions using statistical modeling for capturing variability. Stud. Health Technol. Informat. 2008, 132, 396–401. [Google Scholar]
- Chanda, A.; Ruchti, T.; Unnikrishnan, V. Computational modeling of wound suture: A review. IEEE Rev. Biomed. Eng. 2018, 11, 165–176. [Google Scholar] [CrossRef] [PubMed]
- Danielson, D.; Natarajan, S. Tension field theory and the stress in stretched skin. J. Biomech. 1975, 8, 135–142. [Google Scholar] [CrossRef]
- Larrabee, W.F.; Galt, J. A finite element model of skin deformation. III. The finite element model. Laryngoscope 1986, 96, 413–419. [Google Scholar] [CrossRef] [PubMed]
- Cavicchi, A.; Gambarotta, L.; Massabò, R. Computational modeling of reconstructive surgery: The effects of the natural tension on skin wrinkling. Finite Elem. Anal. Des. 2009, 45, 519–529. [Google Scholar] [CrossRef]
- Flynn, C.; McCormack, B.A. Finite element modelling of forearm skin wrinkling. Skin Res. Technol. 2008, 14, 261–269. [Google Scholar] [CrossRef]
- Flynn, C. Finite element models of wound closure. J. Tissue Viabil. 2010, 19, 137–149. [Google Scholar] [CrossRef]
- Capek, L.; Jacquet, E.; Dzan, L.; Simunek, A. The analysis of forces needed for the suturing of elliptical skin wounds. Med. Biol. Eng. Comput. 2012, 50, 193–198. [Google Scholar] [CrossRef]
- Feng, A.L.; Clark, J.H.; Agrawal, N.; Moussa, W.; Richmon, J.D. Neck incision planning for total laryngectomy: A finite element analysis. J. Biomech. 2015, 48, 4149–4154. [Google Scholar] [CrossRef] [PubMed]
- Chanda, A.; Unnikrishnan, V. A Realistic 3D Computational Model of the Closure of Skin Wound with Interrupted Sutures. J. Mech. Med. Biol. 2016, 17, 1750025. [Google Scholar] [CrossRef]
- Chanda, A.; Flynn, Z.; Unnikrishnan, V. Biofidelic Vaginal Tissue Surrogate. U.S. Provisional Patent No. 62/263942, 7 July 2015. [Google Scholar]
- Melis, P.; Noorlander, M.L.; Bos, K.E. Tension Decrease during Skin Stretching in Undermined versus Not Undermined Skin: An Experimental Study in Piglets. Plast. Reconstr. Surg. 2001, 107, 1201–1205. [Google Scholar] [CrossRef] [PubMed]
- Frick, T.; Marucci, D.; Cartmill, J.; Martin, C.; Walsh, W. Resistance forces acting on suture needles. J. Biomech. 2001, 34, 1335–1340. [Google Scholar] [CrossRef]
- Cacou, C.; Muir, I. Effects of plane mechanical forces in wound healing in humans. J. R. Coll. Surg. Edinb. 1995, 40, 38–41. [Google Scholar]
- Cacou, C.; Anderson, J.; Muir, I.F. Measurements of closing force of surgical wounds and relation to the appearance of resultant scars. Med. Biol. Eng. Comput. 1994, 32, 638–642. [Google Scholar] [CrossRef]
- Corr, D.T.; Hart, D.A. Biomechanics of scar tissue and uninjured skin. Adv. Wound Care 2013, 2, 37–43. [Google Scholar] [CrossRef]
- Chanda, A.; Unnikrishnan, V. Human tissue simulants for study of traumatic brain injury (TBI). In Proceedings of the American Society for Composites: Thirty-First Technical Conference, Williamsburg, VA, USA, 19–22 September 2016. [Google Scholar]
- Chanda, A.; Flynn, Z.; Unnikrishnan, V. Biomechanical characterization of normal and prolapsed vaginal tissue surrogates. J. Mech. Med. Biol. 2018, 18, 1750100. [Google Scholar] [CrossRef]
- Chanda, A.; Unnikrishnan, V.; Flynn, Z.; Lackey, K. Experimental study on tissue phantoms to understand the effect of injury and suturing on human skin mechanical properties. Proc. Inst. Mech. Eng. Part H J. Eng. Med. 2017, 231, 80–91. [Google Scholar] [CrossRef]
- Chanda, A.; Unnikrishnan, V. Customized Insoles for Diabetic and Pressure Ulcers. Google Patents US20180008000A1, 1 January 2018. [Google Scholar]
- Chanda, A.; Graeter, R. Human Skin-Like Composite Materials for Blast Induced Injury Mitigation. J. Compos. Sci. 2018, 2, 44. [Google Scholar] [CrossRef]
- Chanda, A.; Unnikrishnan, V.; Roy, S.; Richter, H.E. Computational modeling of the female pelvic support structures and organs to understand the mechanism of pelvic organ prolapse: A review. Appl. Mech. Rev. 2015, 67, 040801. [Google Scholar] [CrossRef]
- Chanda, A.; Unnikrishnan, V.; Richter, H.E.; Lockhart, M.E. Computational Modeling of Anterior and Posterior Pelvic Organ Prolapse (POP). In Proceedings of the ASME 2016 International Mechanical Engineering Congress and Exposition, Phoenix, AZ, USA, 11–17 November 2016. [Google Scholar]
- Chanda, A.; Unnikrishnan, V.; Flynn, Z. Biofidelic Skin Simulant. U.S. Patents US20170011657A1, 12 Jaunary 2017. [Google Scholar]
- Chanda, A.; Callaway, C.; Clifton, C.; Unnikrishnan, V. Biofidelic Human Brain Tissue Surrogates; Taylor & Francis: New York, NY, USA, 2016. [Google Scholar]
- Chanda, A.; Unnikrishnan, V.; Lackey, K. Biofidelic Conductive Synthetic Skin Composites. In Proceedings of the American Society for Composites—Thirty-second Technical Conference, West Lafayette, IN, USA, 23–25 October 2017. [Google Scholar]
- Chanda, A.; Curry, K. Patient-Specific Biofidelic Human Coronary Artery Surrogates. J. Mech. Med. Biol. 2018, 18. [Google Scholar] [CrossRef]
- Chanda, A.; Callaway, C. Tissue Anisotropy Modeling Using Soft Composite Materials. Appl. Bion. Biomech. 2018, 2018. [Google Scholar] [CrossRef] [PubMed]
- Chanda, A. Biofidelic Soft Composites–Experimental and Computational Modeling; University of Alabama Libraries: Tuscaloosa, AL, USA, 2017. [Google Scholar]
- Xu, H. Application of Visual Imaging Correlation-2D to Strain Measurement. Master’s Thesis, Rochester Institute for Technology, Rochester, NY, USA, 27 July 2014. [Google Scholar]
- Abanto-Bueno, J.; Lambros, J. Investigation of crack growth in functionally graded materials using digital image correlation. Eng. Fracture Mech. 2002, 69, 1695–1711. [Google Scholar] [CrossRef]
- Annaidh, A.N.; Bruyère, K.; Destrade, M.; Gilchrist, M.D.; Otténio, M. Characterization of the anisotropic mechanical properties of excised human skin. J. Mech. Behav. Biomed. Mater. 2012, 5, 139–148. [Google Scholar] [CrossRef] [PubMed] [Green Version]
- Groves, R.B.; Coulman, S.A.; Birchall, J.C.; Evans, S.L. An anisotropic, hyperelastic model for skin: Experimental measurements, finite element modelling and identification of parameters for human and murine skin. J. Mech. Behav. Biomed. Mater. 2013, 18, 167–180. [Google Scholar] [CrossRef] [PubMed]
- Payne, T.; Mitchell, S.; Bibb, R.; Waters, M. Initial validation of a relaxed human soft tissue simulant for sports impact surrogates. Procedia Eng. 2014, 72, 533–538. [Google Scholar] [CrossRef]
- Payne, T.; Mitchell, S.; Bibb, R.; Waters, M. The evaluation of new multi-material human soft tissue simulants for sports impact surrogates. J. Mech. Behav. Biomed. Mater. 2015, 41, 336–356. [Google Scholar] [CrossRef] [Green Version]
- Annaidh, A.N.; Destrade, M.; Ottenio, M.; Bruyere, K.; Gilchrist, M.D. Strain rate effects on the failure characteristics of excised human skin. J. Mech. Behav. Biomed. Mater. 2015, 41, 241–250. [Google Scholar]
- Wang, E.; Nelson, T.; Rauch, R. Back to elements-tetrahedra vs. hexahedra. In Proceedings of the 2004 International ANSYS Conference, Pittsburg, PA, USA, 24–26 May 2004. [Google Scholar]
- Chanda, A.; Graeter, R.; Unnikrishnan, V. Effect of blasts on subject-specific computational models of skin and bone sections at various locations on the human body. AIMS Mater. Sci 2015, 2, 425–447. [Google Scholar] [CrossRef]
- Martins, P.; Natal Jorge, R.; Ferreira, A. A Comparative Study of Several Material Models for Prediction of Hyperelastic Properties: Application to Silicone-Rubber and Soft Tissues. Strain 2006, 42, 135–147. [Google Scholar] [CrossRef]
- Chanda, A.; Callaway, C. Computational modeling of blast induced whole-body injury: A review. J. Med. Eng. Technol. 2018, 42, 88–104. [Google Scholar] [CrossRef] [PubMed]
- Chanda, A.; Meyer, I.; Richter, H.E.; Lockhart, M.E.; Moraes, F.R.; Unnikrishnan, V. Vaginal changes due to varying degrees of rectocele prolapse: A computational study. J. Biomech. Eng. 2017, 139, 101001. [Google Scholar] [CrossRef] [PubMed]
- Chanda, A.; Unnikrishnan, V. Effect of bladder and rectal loads on the vaginal canal and levator ani in varying pelvic floor conditions. Mech. Adv. Mater. Struct. 2017, 25, 1214–1223. [Google Scholar] [CrossRef]
- Chanda, A.; Unnikrishnan, V.; Richter, H.E.; Lockhart, M.E. A biofidelic computational model of the female pelvic system to understand effect of bladder fill and progressive vaginal tissue stiffening due to prolapse on anterior vaginal wall. Int. J. Numer. Methods Biomed. Eng. 2016, 32. [Google Scholar] [CrossRef] [PubMed]
- Chanda, A.; Unnikrishnan, V.; Flynn, Z. Biofidelic Human Skin Simulant. U.S. Patent 15/204353, 7 July 2015. [Google Scholar]
- Ghoneim, H.; Chanda, A. Pumping potential of a left-ventricle-like flexiblematrix-composite structure. In Proceedings of the 19th international conference on composite materials (ICCM19), Montreal, QC, Canada, 28 July–2 August 2013; pp. 7457–7462. [Google Scholar]
- Gonzalez, L.Y.S.; Botero, M.G.; Betancur, M. Hyperelastic Material Modeling; Technical Report; Departamento de Ingenieria Mecanica, Universidad EAFIT: Medellın, Colombia, 2005. [Google Scholar]
- Holzapfel, G.A. Nonlinear Solid Mechanics; Wiley: Chichester, UK, 2000; Volume 24. [Google Scholar]
Figure 1.
Schematic of different layers of the skin with a dermal wound.

Figure 2.
(a) Biofidelic human skin phantoms with wounds. AR is the aspect ratio in each case; (b) Irregular speckle pattern used for Digital Image Correlation (DIC).
Figure 2.
(a) Biofidelic human skin phantoms with wounds. AR is the aspect ratio in each case; (b) Irregular speckle pattern used for Digital Image Correlation (DIC).

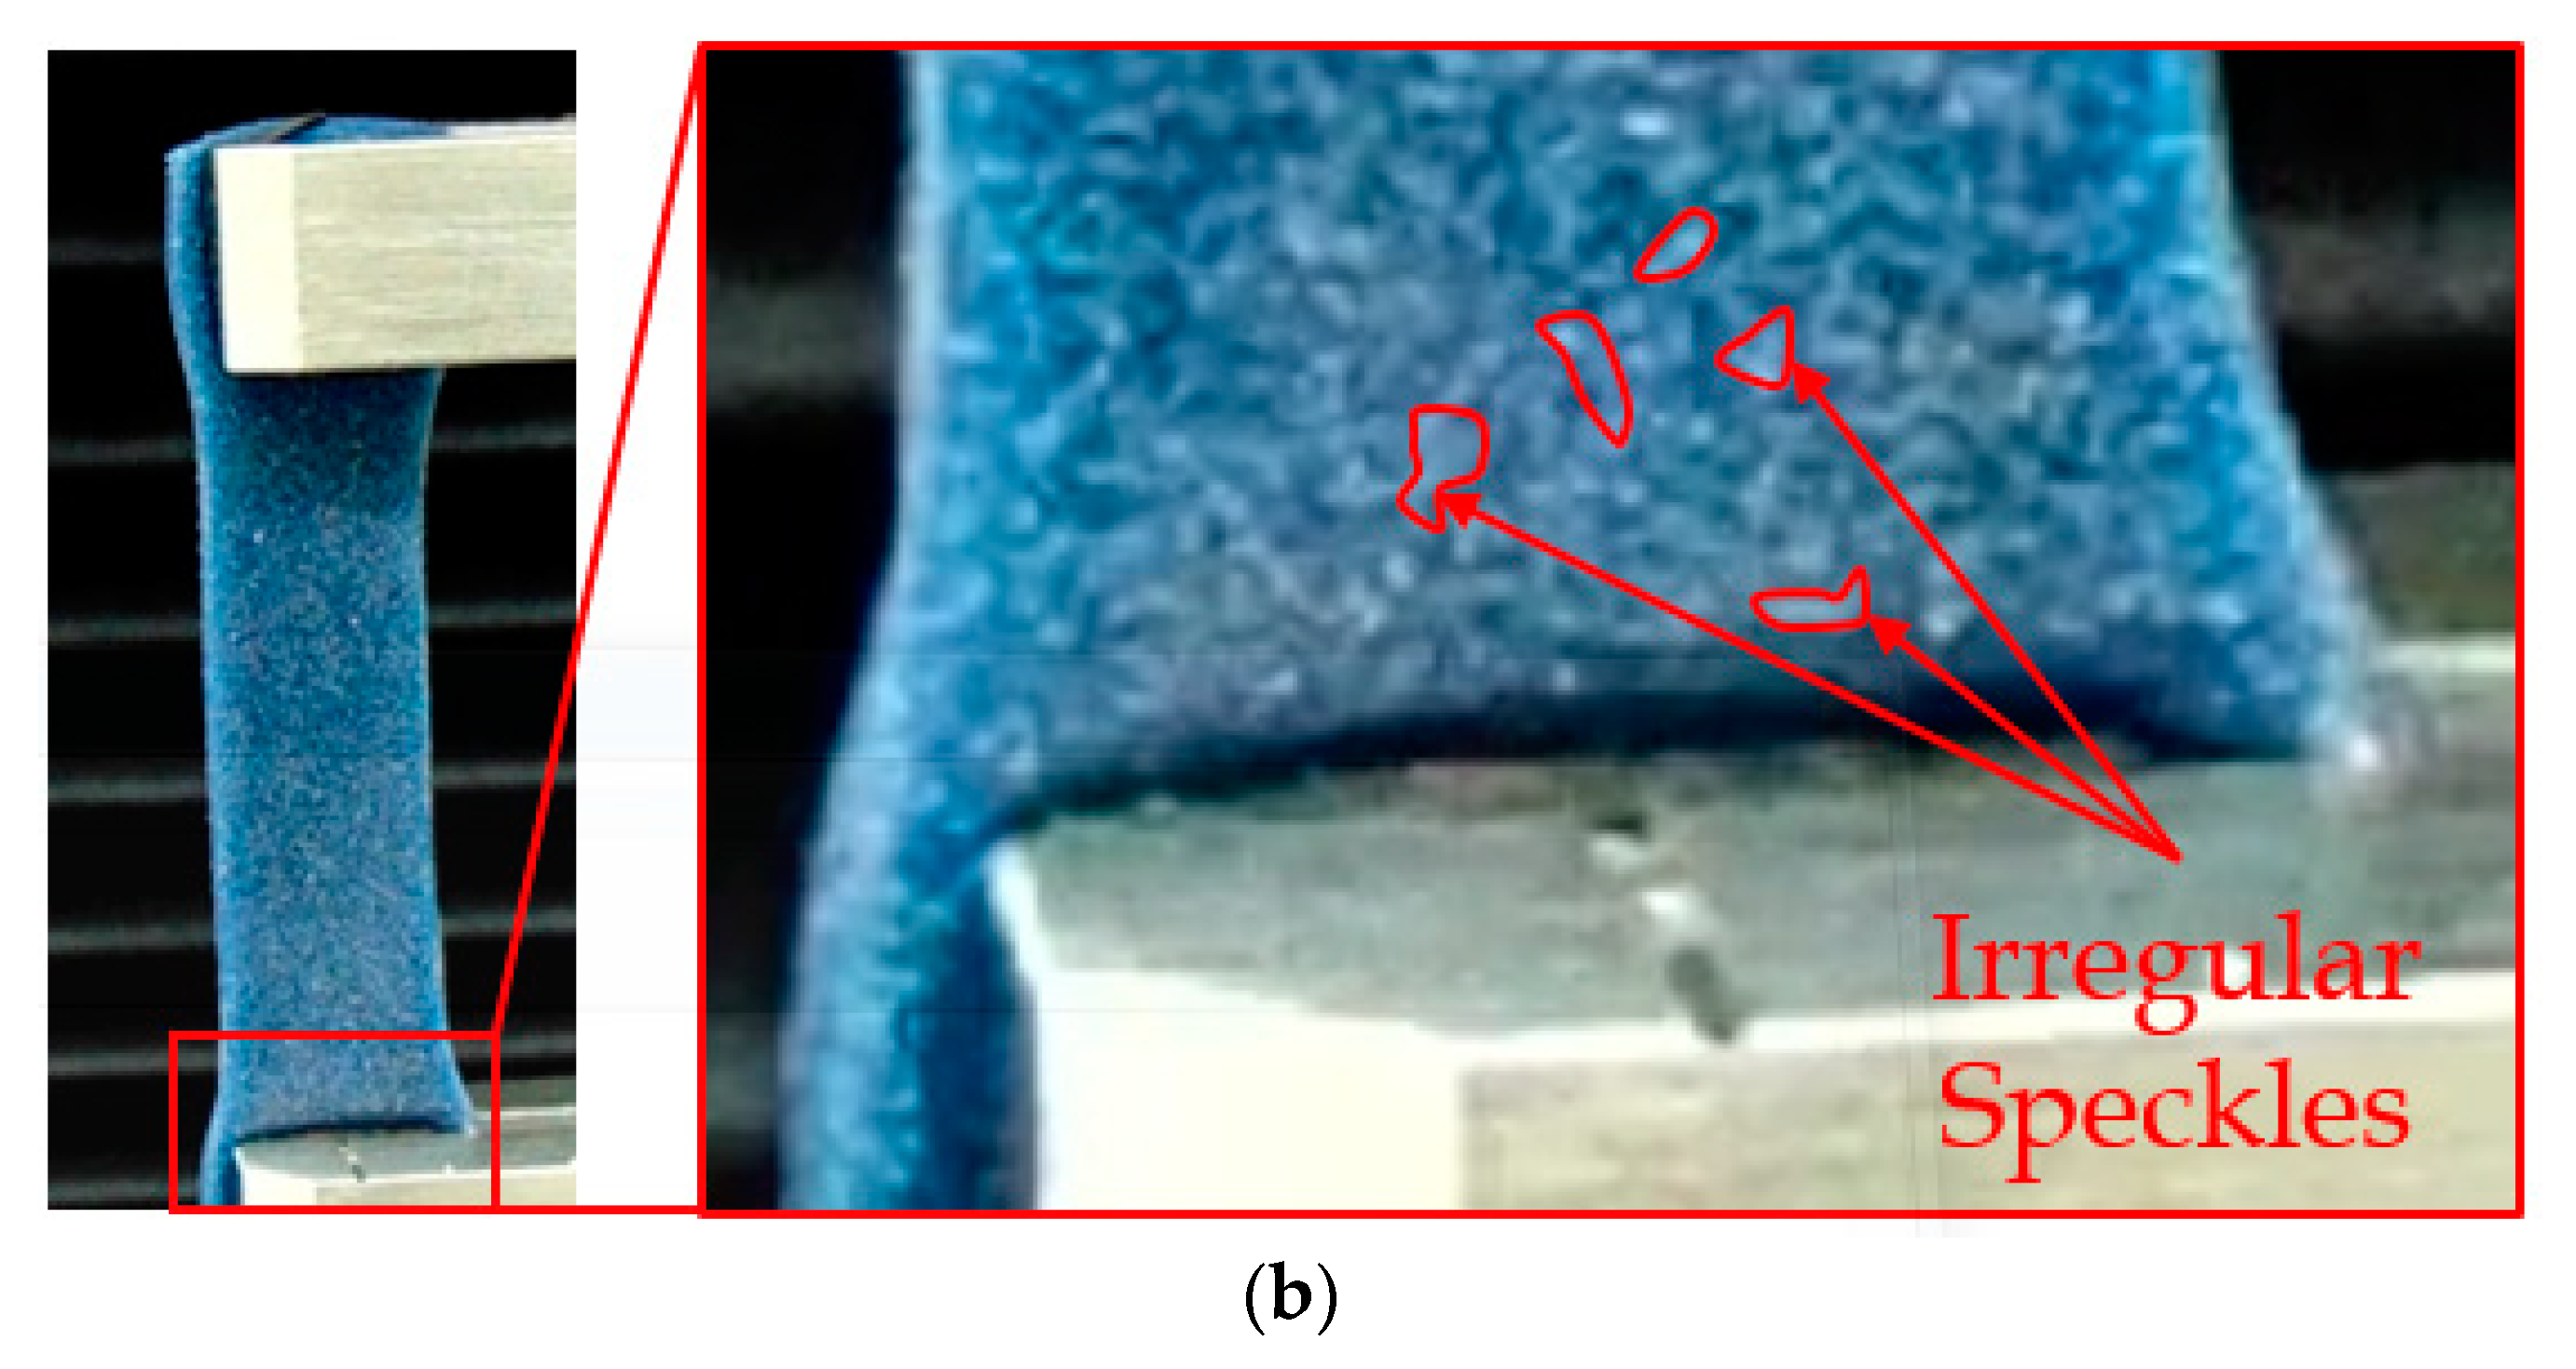
Figure 3.
Schematic of vertical and horizontal strain calculations using DIC for a tension test.

Figure 4.
Mechanical tensile test of a wounded skin phantom used for DIC measurements.

Figure 5.
Coupon with transverse wound dimensions observed under a microscope and finite element (FE) model of the coupon with the wound.
Figure 5.
Coupon with transverse wound dimensions observed under a microscope and finite element (FE) model of the coupon with the wound.

Figure 6.
Strain distribution measured using DIC during the tensile test (at t = 1 s) on the biofidelic human skin specimen with no wound.
Figure 6.
Strain distribution measured using DIC during the tensile test (at t = 1 s) on the biofidelic human skin specimen with no wound.

Figure 7.
Strain (y-axis) versus time frame (x-axis) measured using DIC from tensile test on the biofidelic human skin specimen with no wound.
Figure 7.
Strain (y-axis) versus time frame (x-axis) measured using DIC from tensile test on the biofidelic human skin specimen with no wound.

Figure 8.
Strain distribution at different times for symmetric-short wound 1 measured using DIC.

Figure 9.
Average strain (y-axis) versus time frame (x-axis) measured using DIC from tensile test on the skin phantom specimen with symmetric-short wound 1.
Figure 9.
Average strain (y-axis) versus time frame (x-axis) measured using DIC from tensile test on the skin phantom specimen with symmetric-short wound 1.
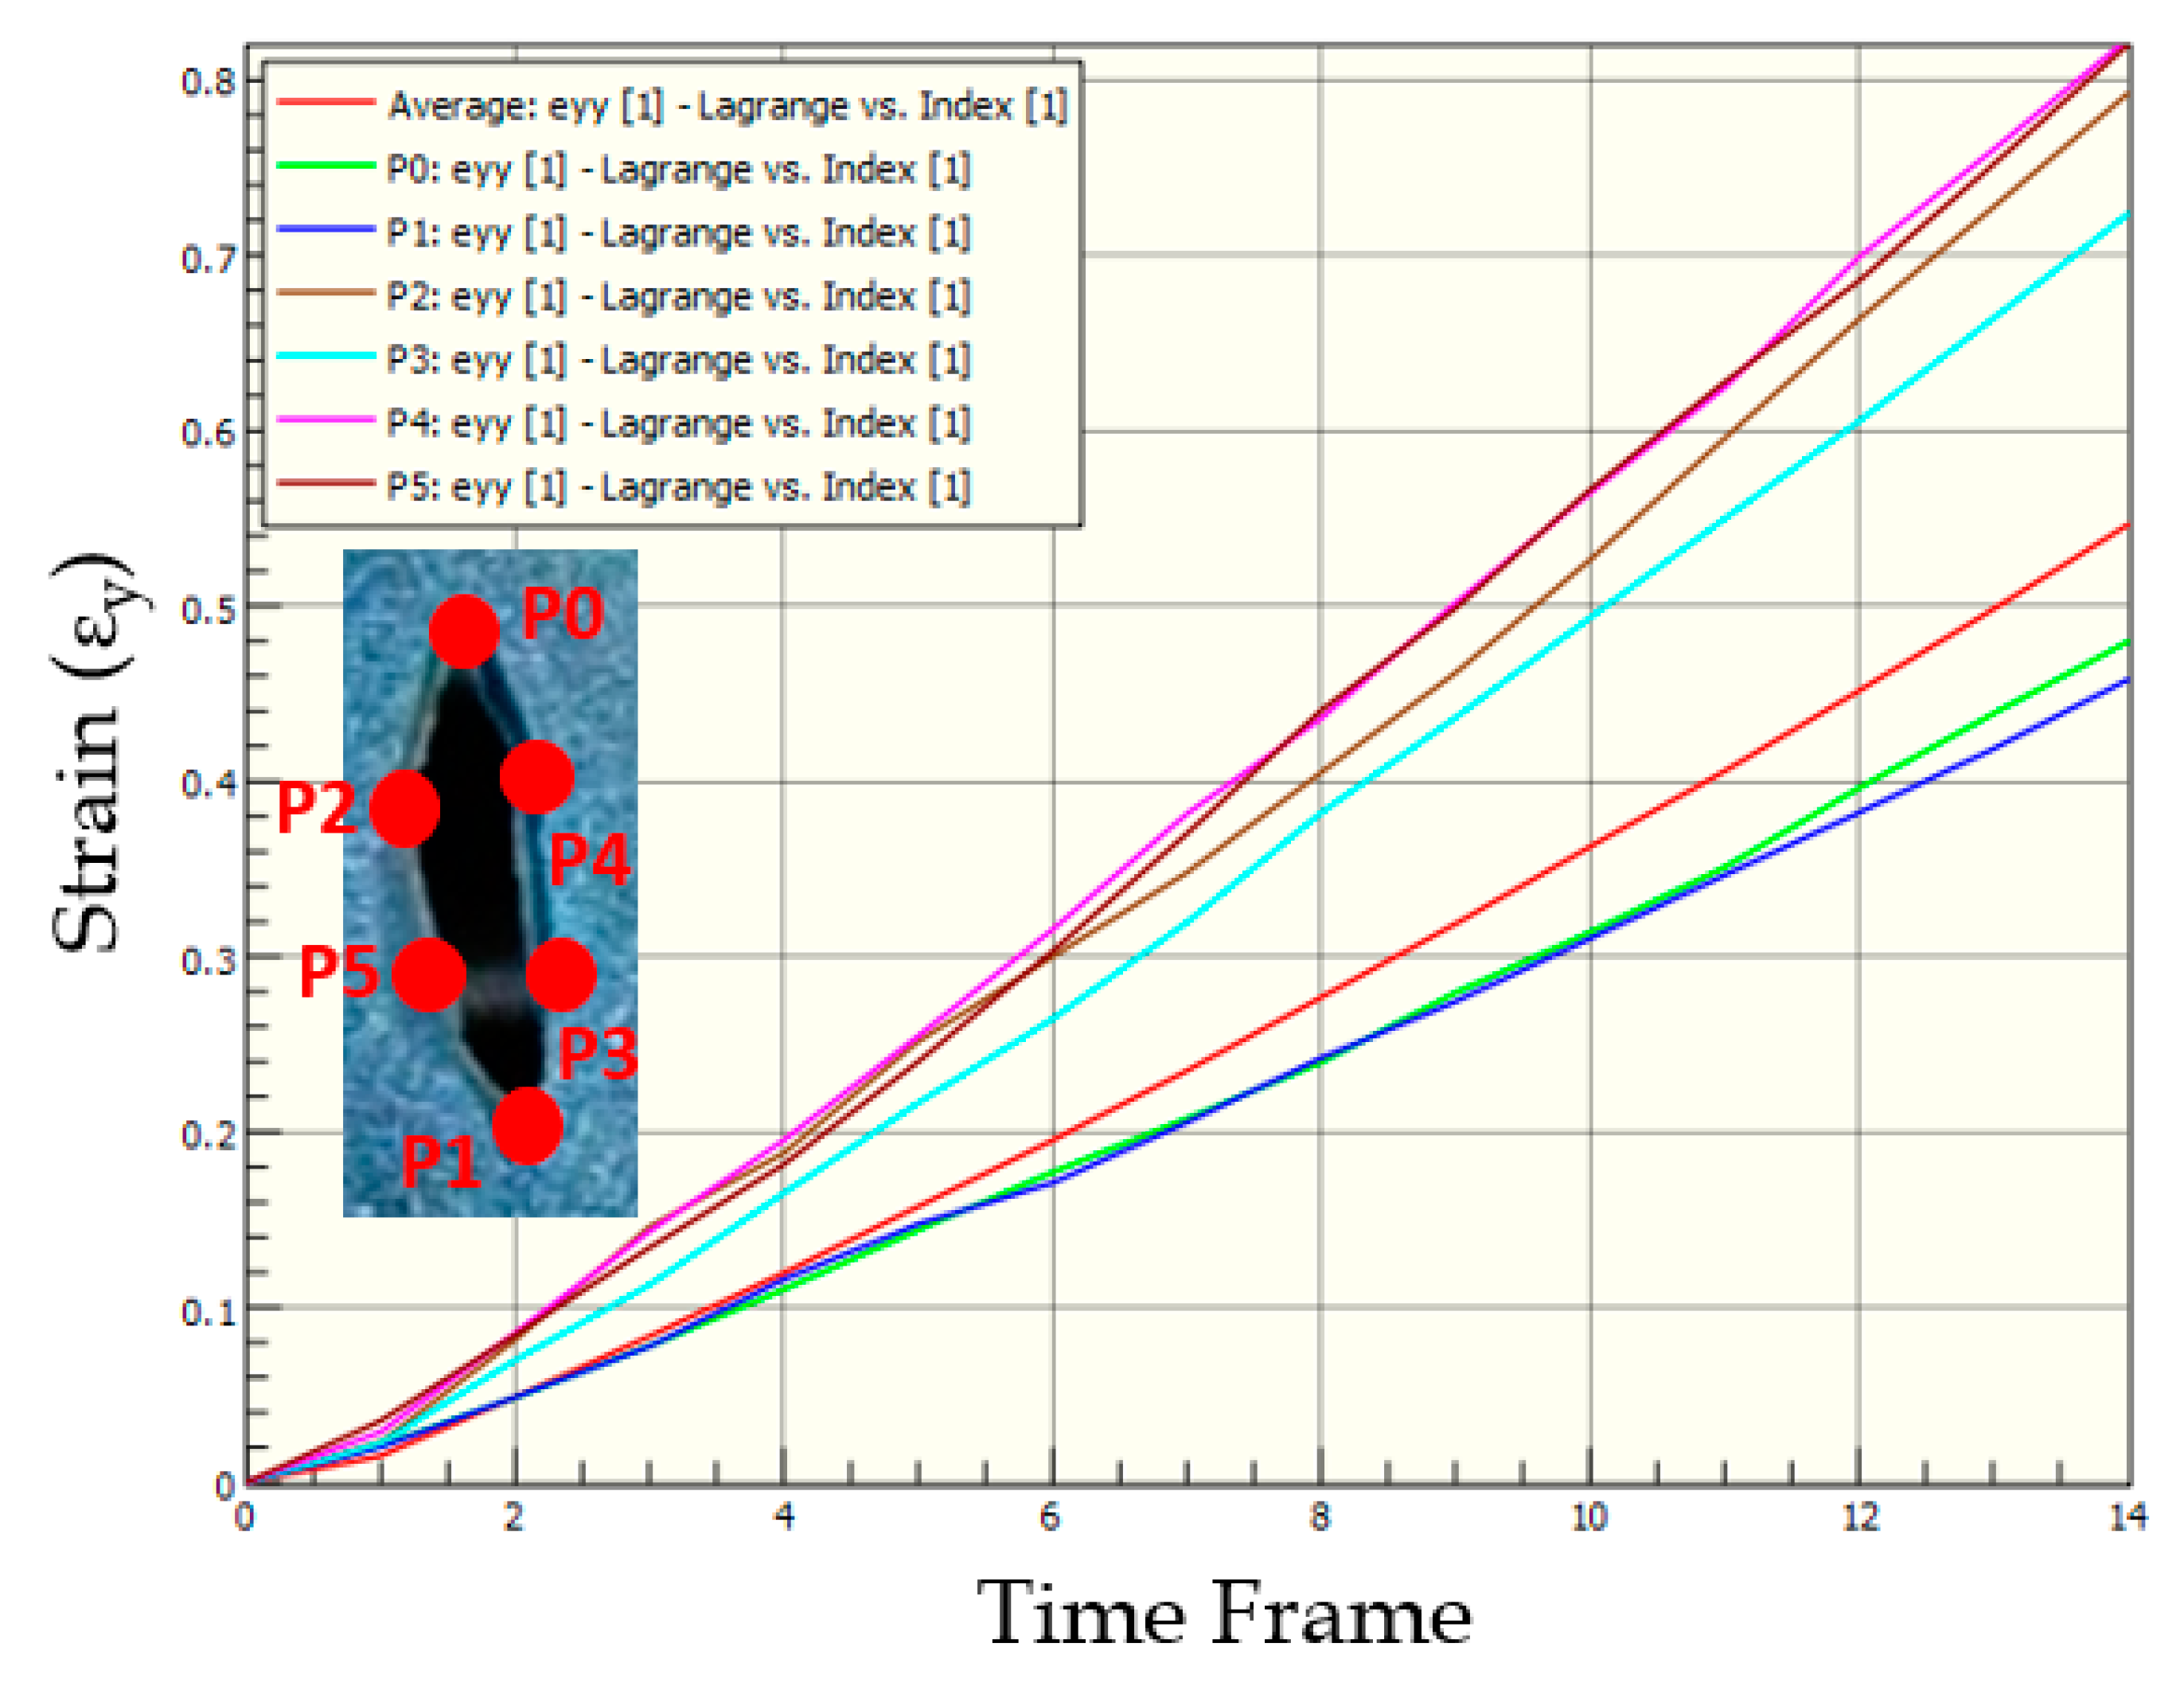
Figure 10.
Strain distribution at different times for symmetric long wound 2 measured using DIC.

Figure 11.
Average strain (y-axis) versus time frame (x-axis) measured using DIC from tensile test on the skin phantom specimen 2 with wound.
Figure 11.
Average strain (y-axis) versus time frame (x-axis) measured using DIC from tensile test on the skin phantom specimen 2 with wound.

Figure 12.
Strain distribution at different times for asymmetric long wound 3 measured using DIC technique.
Figure 12.
Strain distribution at different times for asymmetric long wound 3 measured using DIC technique.

Figure 13.
Average strain (y-axis) versus time frame (x-axis) measured using DIC from tensile test on the skin phantom specimen 3 with wound.
Figure 13.
Average strain (y-axis) versus time frame (x-axis) measured using DIC from tensile test on the skin phantom specimen 3 with wound.

Figure 14.
Strain distribution at different times for thin wound 4 measured using DIC.

Figure 15.
Average strain (y-axis) versus time frame (x-axis) measured using DIC from tensile test on the skin phantom specimen 4 with wound.
Figure 15.
Average strain (y-axis) versus time frame (x-axis) measured using DIC from tensile test on the skin phantom specimen 4 with wound.

Figure 16.
Strain distribution at different times for transverse wound 5 measured using DIC.

Figure 17.
Average strain (y-axis) versus time frame (x-axis) measured using DIC from tensile test on the skin phantom specimen 5 with wound.
Figure 17.
Average strain (y-axis) versus time frame (x-axis) measured using DIC from tensile test on the skin phantom specimen 5 with wound.

Figure 18.
Average strain versus time plots of the specimens with and without wounds.

Figure 19.
Deformation of the computational model of the skin phantom with wound.

Figure 20.
Local strains around the wound compared at different times in the computational model and DIC measurements.
Figure 20.
Local strains around the wound compared at different times in the computational model and DIC measurements.

Figure 21.
Maximum local strains measured around the transverse wound under tensile stretching in the computational model and compared with DIC measurements.
Figure 21.
Maximum local strains measured around the transverse wound under tensile stretching in the computational model and compared with DIC measurements.

Figure 22.
Average Stress-Strain plots of wounded and unwounded skin phantoms.


Table 1.
Average hyperelastic curve fitting parameters for human skin phantoms.
| Veronda-Westmann Model | (MPa) | (MPa) |
|---|---|---|
| Biofidelic Human Skin Phantom | 0.737 | 0.338 |
© 2018 by the authors. Licensee MDPI, Basel, Switzerland. This article is an open access article distributed under the terms and conditions of the Creative Commons Attribution (CC BY) license (http://creativecommons.org/licenses/by/4.0/).
Share and Cite
MDPI and ACS Style
Chanda, A.; Upchurch, W. Biomechanical Modeling of Wounded Skin. J. Compos. Sci. 2018, 2, 69. https://doi.org/10.3390/jcs2040069
AMA Style
Chanda A, Upchurch W. Biomechanical Modeling of Wounded Skin. Journal of Composites Science. 2018; 2(4):69. https://doi.org/10.3390/jcs2040069
Chicago/Turabian StyleChanda, Arnab, and Weston Upchurch. 2018. "Biomechanical Modeling of Wounded Skin" Journal of Composites Science 2, no. 4: 69. https://doi.org/10.3390/jcs2040069