Abstract
We report here the synthesis of uniform nanospheres-like silver nanoparticles (Ag NPs, 5–10 nm) and the dumbbell-like Fe3O4-Ag hybrid nanoparticles (FeAg NPs, 8–16 nm) by the use of a seeding growth method in the presence of oleic acid (OA)/oleylamine (OLA) as surfactants. The antibacterial activity of pure nanoparticles and nanocomposites by monitoring the bacterial lag–log growth has been investigated. The electron transfer from Ag NPs to Fe3O4 NPs which enhances the biological of silver nanoparticles has been proven by nanoscale Raman spectroscopy. The lamellae structure in the spherulite of FeAg NPs/High Density Polyethylene (HDPE) nanocomposites seems to play the key role in the antibacterial activity of nanocomposites, which has been proven by nanoscale AFM-IR. An atomic force microscopy coupled with nanoscale infrared microscopy (AFM-IR) is used to highlight the distribution of nanoparticles on the surface of nanocomposite at the nanoscale. The presence of FeAg NPs in PE nanocomposites has a better antibacterial activity than that reinforced by Ag NPs due to the faster Ag+ release rate from the Fe3O4-Ag hybrid nanoparticles and the ionization of Ag NPs in hybrid nanostructure.
1. Introduction
The transmission of infectious diseases by bacteria in airports, hospitals and other public places has been increasing in the last few decades [1]. The development of self-sterilizing polymers [2,3] able to inactivate bacteria is crucial. E. coli has been reported to lead to food poisoning [4,5]. Silver nanoparticles are reported to be effective biocidal agents against various bacteria [6,7,8,9,10]. The recent report approved that the antibacterial activity comes from silver ions (Ag+), not from metallic Ag [6]. Different components are combined with silver to yield a nanoentity with desired properties not afforded by their counterparts. For example, a combination of Ferrite and silver is expected to enhance antibacterial activity due to the electron transfer between these two metals and thus enhances the release of silver ions, the main defense against the inactivation of bacteria and virus. The magnetic properties of ferrite lead to the formation of superparamagnetic composites which are useful in carcinoembryonic antigen in clinical immunoassay [11] and water treatment due to their enable easy separation from solution [12].
The biological activity of silver can be enhanced in combination with other transition metals such as nano-silver-ferrite composite [13]. The highest antibacterial effect of 99.4% was achieved at 5.4 wt. % of NPs and the driving frequency of 100 rpm [14]. A time-dependent antibacterial effect in 0.1 wt. % of Ag/Fe3O4 was also observed which indicated that the use of specific rotating magnetic fields to manipulate Ag/Fe3O4 magnetic NPs can significantly improve the antibacterial efficacy against E Coli and that the highest antibacterial effect can be achieved to 99.4% [14]. The antibacterial silk from Fe3O4-Ag with high antibacterial activities against both Escherichia coli and Staphylococcus aureus been also synthesized [15]. The author confirmed that the as prepared antibacterial silks can be easily recycled without a decrease in their antibacterial activities due to the synergistic effects between the Ag NPs and Fe3O4 NPs with large amounts of active sites [15]. Depending on synthesis conditions, various morphologies of hybrid nanoparticles can be achieved [16,17,18].
Polyethylene is one of the most common types of polyolefin and remains the most consumed polymer in the world due to its interesting good mechanical properties, its stability and its low cost [16,19,20,21,22,23,24]. The addition of additive brings this polymer various new properties depending on end-end applications [25,26,27]. Polyethylene (PE) is a lightweight, durable thermoplastic with a variable crystalline structure. It is one of the most widely produced plastics in the world [28]. Their application can be found in various files such as films, tubes, plastic parts, laminates, packaging, automotive, electrical. Here, the main goal of this paper is to prepare hybrid silver nanoparticles with high antibacterial activity and the incorporated them in the polyethylene matrix and investigate their antibacterial activity. Some recent pointed techniques such as atomic force microscopy coupled with nanoscale infrared (AFM-IR) and nanoscale Raman (AFM-Raman) will be used for better understanding the release behavior on the composite surfaces and proposing possible mechanisms for the enhancement of the antibacterial activity.
The atomic force microscope (AFM) has been widely used for the study of nanocomposites and polymeric materials with nanoscale spatial resolution [29,30,31,32,33,34,35,36]. AFM-IR allows surface mapping with a resolution of several tens of nanometers. The main limitation of AFM-IR concerns the laser source near the infrared (900–4000 cm−1) region. Detection of the bonding signals between polymer and metals appearing below 900 cm−1 cannot be detected. The nano-Raman can overcome these drawbacks. AFM-Raman combines confocal Raman spectroscopy and imaging providing specific chemical information on the nano-materials with a sub-micron spatial resolution [37,38,39,40].
We show in this study that AFM-IR and AFM-Raman can be used to investigate the nanoscale structure and the electron transfer in hybrid nanoparticles. The detailed microstructure of FeAg NP and HDPE nanocomposites containing Fe3O4-Ag hybrid nanoparticles is addressed in this study. The release mechanism was investigated when these nanoparticles were incorporated in PE. The effect of these nanoparticles on the lamellae structure of PE was also worked out in the course of this study.
2. Materials and Methods
2.1. Chemicals
Iron(III) acetylacetonate (Fe(acac)3) 99.99%; silver nitrate (AgNO3) 99%; sodium borohydride (NaBH4) 99% and sodium stearate 99%; solvents: 1-octadecene, di-chlorobenezene (DCB, 99%), absolute ethanol and hexane; surfactants and reductant: oleic acid (OA) 99%, oleylamine (OLA) 70%, 1,2 n-hexadecanediol (HDD) 90%, polyvinylpyrrolidone (PVP) were purchased from Sigma-Aldrich (Missouri, MO, USA). High Density Polyethylene (HDPE) granules were purchased from IRPC Public Company (grade G2855, Polimaxx Polene, Rayong, Thailand).
2.2. Synthesis of Nanoparticles
AgNPs were prepared by the reduction of silver nitrate using sodium borohydride in the presence of PVP in distilled water. A 20 mL volume of 5 mM silver nitrate was added dropwise to 200 mM of PVP (at 0.1 wt. %), then 50 mL of 10 mM chilled sodium borohydride solution was added drop-wise into the above mixture. The reaction mixture was stirred vigorously during 30 min by using a magnetic stirring plate and sonicated for another 30 min. Afterwards, the Ag NPs was extracted with 100 mL xylene at 50 °C.
Synthesis of Fe3O4 nanoparticles: the Fe3O4 nanoparticles (Fe3O4 NPs) were prepared by pouring cetylacetonate (0.162 g, 0.63 mM), Fe (III) acetylacetonate (0.6 g, 1.9 mM) and hexadecanediol (0.58 g, 1.5 mM) into a 100 mL three-neck flask. At the same time, 3.6 mL OA, 3.6 mL OLA and 30 mL 1-octadecene were added into the above mixture. The concentrations of Fe(acac)3, OA, OLA, and HDD in the solution were equal to 63, 372, 372 and 75 mM, respectively. The reaction mixture was stirred and degassed at room temperature for 30 min before being heated to 100 °C, and kept at this temperature for 30 min to remove water. The temperature was increased to 200 °C, and maintained for 30 min. Then, the reaction solution was heated further to 295 °C at a heating rate of 5–7 °C/min and maintained for 30 min before cooling to room temperature. The Fe3O4 NPs were then purified from the excess ligands before the synthesis of Fe3O4-Ag as follows: 20 mL of the Fe3O4 NPs solution was mixed with 20 mL of ethanol. The Fe3O4 NPs were then collected using a magnetic bar and the supernatant was discarded. The Fe3O4 NPs were thereafter dispersed in 5 mL hexane and precipitated by adding 5 mL of ethanol. The precipitation/re-dispersion procedure was repeated two more times and the Fe3O4 NPs were finally dispersed in DCB.
Synthesis of Fe3O4-Ag hybrid nanoparticles: The seeding growth method was used to prepare Fe3O4-Ag NPs. About 5 mL of DCB solution containing 500 mg AgNO3 and 3 mL OLA was added drop-wise into 20 mL DCB containing 100 mg purified Fe3O4 NPs (at 170 °C). The mixture was maintained at this temperature for 60 min before cooling to room temperature.
2.3. Preparation of Nanocomposites
The master batch of HDPE nanocomposites containing a high concentration of nanoparticles (2 wt. %) was prepared by the mixing method. PE granules were dissolved in toluene (5 wt. %, stirring at 85 °C). The nanoparticles were then added to this solution following a sonication during 1h. Toluene was then removed at 110 °C under vacuum. To fabricate the final HDPE nanocomposite sheets, the above as-prepared master batch was mixed with HDPE granules, and then blended in an internal HAAKE mixer at 50 rpm and 170 °C for 8 min to extrude the final HDPE nanocomposites containing 0.1 wt. % of Ag NPs.
To characterize the polymer nanostructure, a solution of 20 mg/mL was added in 1,2 dichlorobenzene and stirred during 24 h, then heated up to 90 °C in the dark before casting it over Si-wafer or gold substrates. Polymer films were dried under vacuum at 60 °C for 2 h to ensure complete removal of residual solvent. The polymer film was then melted at 180 °C during 3 min to ensure transformation to crystalline crystals and subsequently quenched to the selected crystallization temperature at a cooling rate of 100 °C/min.
2.4. AFM-IR
The AFM-IR measurements were carried on a Nano-IR2 system (Anasys Instruments, Santa Barbara, CA, USA). The AFM images were recorded in contact mode at a rate line 0.1–1 Hz using a gold-plated silicon nitride probe (Anasys Instruments, Santa Barbara, CA, USA) with an elastic constant of about 0.5 N·m−1 and a nominal radius of 10 nm. The nanoscale IR spectra were collected directly on the single fiber surface, deposited on double-side adhesive tape within the 900–3600 cm−1 range at a spectral resolution of 4 cm−1, 256 co-averages. The single IR radiation image is recorded with a scan rate of 0.1 Hz, resolution 1024 × 1024 pixels and 16 co-averages, at a power limit within 0.5%–4% at a frequency of 196 Hz. All measurements were carried out at room temperature in a room provided with a humidity controller (about 20% RH). This precludes the effect of water absorption on the sample surface during the analyzing. The nano-IR devices were located in an anti-vibration system.
2.5. AFM-Raman
The Raman spectra and AFM images were recorded on a Witec Alpha300 RSA unit equipped with an AFM & SNOM Confocal Raman Microscope. The AFM images were recorded in contact mode with a rate of 0.3 Hz using an AFM tip TESPA (Brucker, Camarillo, CA, USA). For nano-Raman spectra measurements, the integration time was about 1 s with 10 scans at a spectral resolution of 1 cm−1 and laser wavelength of 532 nm. The laser power was set at 15 mW to avoid sample burning.
2.6. UV-Vis Analysis
An UV–Vis spectrophotometer, model CINTRA 4040 (GBC, Hampshire, Durham, NH, USA) with 2 nm slit width was used to monitor the absorbance of the chromophores and the electron transfer in the nanocomposites. The particle size distribution was measured using a Zetasizer instrument (6.20 version, Malvern, UK).
2.7. Antibacterial Growth Test
E. coli DH5α bacteria were purchased from Invitrogen (Carlsbad, CA, USA). Luria-Broth medium was provided by Merck (Darmstadt, Germany). To evaluate the cell density, a Beckman Coulter DU-730 (Fullerton, CA, USA) was used. In this test, the optical density OD600 measures the light absorbance of the E. coli sample. Different cell strains may have different cell numbers at a given OD600 value, but OD600 = 1 usually means that there are about 1 × 10⁹ cells per ml culture. Bacterial pre-cultures were prepared to generate subcultures of bacterial in the lag phase so that the number of bacterial cells was constant before the log phase or exponential growth phase. In this way, the growth rate of the bacteria on the nanocomposites was evaluated. The OD600 values in the range 0.1–2.0 for cell densities of E. coli culture indicated the bacterial growth rates.
A volume of 100 µL of stock culture of E. coli in glycerol was pipetted into 3 mL of medium in a 15 mL test tube and shaken overnight at 200 rpm and 37 °C. Afterward, a 500 µL aliquot of pre-culture was inoculated into 100 mL of medium in a 500 mL Erlenmeyer flask and shaken at 200 rpm and 37 °C until the OD600 absorbance value reached 0.3. These pre-cultures were used to account for the bacterial growth rate.
The as-prepared nanocomposites were cut into 10 × 10 mm square samples and then washed with acetone to remove all impurities on the sample surface and autoclaved at 130 °C for 20 min before every test.
The monitoring test for the evaluation of the bacterial growth was adapted from procedures described in the ASTM E 2149-10 standard. Ten square samples of autoclaved nanocomposites were placed into each 100 mL bacterial pre-culture in a 500 mL Erlenmeyer flask (as described previously) in which the OD600 had reached 0.3 and shaking was continued at 200 rpm at 37 °C. Then, the OD600 values of the bacterial cultures were monitored every 30 min until OD reached 2.0. The reported data was the average of three cultures. The relative OD600 values were then standardized to evaluate the effect of the nanocomposites on the growth rate of the bacteria. The pure bacterial cultures were used as controls.
3. Results and Discussion
3.1. Characterization of Nanoparticles
Figure 1 shows the transmission electron microscopy (TEM) images of Fe3O4 NPs (Figure 1a), FeAg NPs (Figure 1c) dispersed in an organic solvent (DCB). Figure 1a shows the uniform particle distribution with a diameter of 6–8 nm. Figure 1c shows that hybrid FeAg NPs with a uniform dumbbell-like structure: the bigger nanoparticles are Ag NPs and the smaller ones are Fe3O4 NPs. It has to be noted that the synthesis process of hybrid nanoparticles was optimized to obtain the reported sizes of the hybrid nanoparticles.
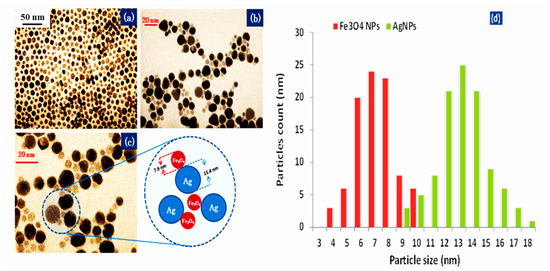
Figure 1.
TEM images of oleic acid (OA)/oleylamine (OLA) coated Fe3O4 NPs: (a) and FeAg NPs (b,c) dispersed in DBC and (d) the nanoparticle size distribution of Fe3O4 nanoparticles and Ag NPs. The insert image in Figure 1c shows an illustration of hybrid nanoparticles.
The Fe3O4 NPs were synthesized and used as the seeding components before hybridization with Ag NPs; the average size of Fe3O4 NPs (about 6–8 nm) was not affected during the hybridization process with Ag NPs. Bigger sizes of Ag NPs with an average about 15–16 nm were expected. During the breeding processes both the temperature (170 °C) and an Ag-salt concentration were 10 times higher than the volume of Fe3O4 nanoparticles. The synthesis of dumbell Ag-Fe3O4 hybrid systems with an Ag NPs size of about of 15–16 nm may be used as a template to fabricate Au (hollow)-Fe3O4 in which a plasmon-resonance peak in the near infrared region could be of interest for novel optical imaging applications.
UV-Vis spectra of OL/OLA coated Fe3O4 NPs, Ag NPs and FeAg NPs were carried out and the results are shown in Figure 2. A broad absorption band in the region of 300–600 nm for Fe3O4 NPs was observed [41], the shoulder at ~360.8 nm was due to nanosized Fe3O4 NPs [42]. The band around 400 nm is characteristic for the surface Plasmon resonance (SPR) peak of Ag NPs [43].
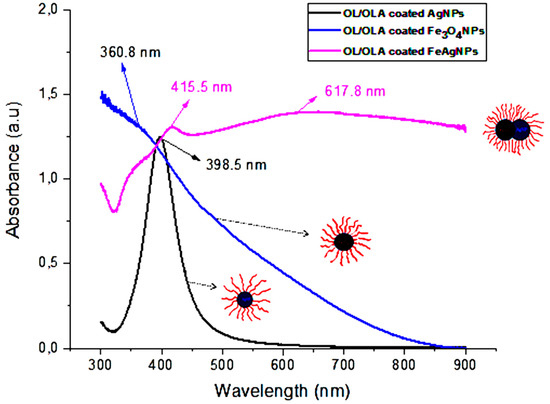
Figure 2.
UV-visible absorption spectra of the OL/OLA coated Fe3O4 NPs, PVP coated Ag NPs and OL/OLA coated FeAg NPs hybrid nanoparticles dispersed in hexane.
The hybridization of Ag NPs and Fe3O4 NPs leads to a red shift in the SPR spectra and a significant broadening of the SPR peak. Ag NPs, SPR peak is located at 398.5 nm, and at 415.5 nm for the Fe3O4-Ag hybrids. This red shift is assigned to the electron transfer between both samples, leading to a depletion of the free electron density in the surface layer due to the increase of π back bonding with the ligand [44,45]. In contrast, the presence of electron donors induces a blue-shift of SPR [46,47]. The contribution of Fe3O4 NPs nanoparticles gives raise to a band at ~360 nm. The peak at 617.8 nm could be assigned to the hybridization of Ag NPs and Fe3O4 NPs.
3.2. Antibacterial Behavior of HDPE Nanocomposites
Figure 3 shows the effect of the PE/Ag NPs and PE/FAg NPs nanocomposites on the growth rate of E. coli liquid cultures. It shows that the growth rates of the pure cultures and mixed cultures with PE slow down after 4 h of cultivation. The log phases of the pure cultures and mixed cultures with neat PE are about 93% after 1h cultivation, whereas they are 85% in the case of mixed cultures with PE/Ag NPs. Thus, the E. coli bacterial growth is inhibited by the presence of PE/Ag NPs nanocomposites. PE/FeAg NP growth rates of the culture were 81% after 4 h. The presence of FeAg NPs in the PE matrix exhibits a higher antibacterial activity, as compared to the Ag NPs. The FeAg NPs had showed a higher bactericidal activity against staphylococcus aureus bacteria compared to Ag NPs 28 due to: (i) a high catalytic activity of Ag NPs dispersion and stability due to the Fe3O4 carrier, and (ii) a large surface contact area between the bacterial cell membrane and the hybrid nanoparticles.
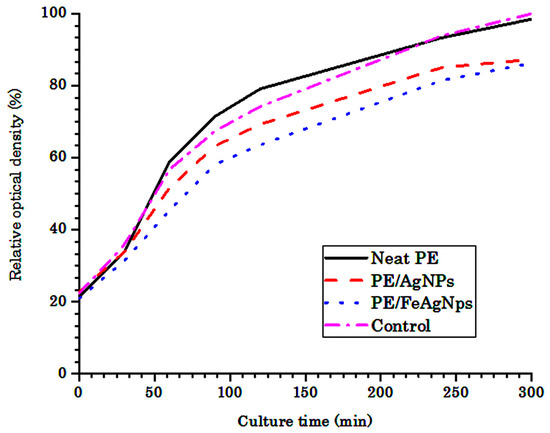
Figure 3.
Growth rate of E. coli liquid cultures of neat PE and nanocomposites with Ag NPs and hybrid FeAg NPs. The data shown represent the average of three cultures (standard deviation < 2%). The control sample is a culture medium without PE.
Since the average size of Ag NPs in FeAg NPs was bigger than that of Ag NPs, the above findings may be due to the faster Ag+ release rate from the Fe3O4-Ag hybrid nanoparticles. It was suggested that the ionization of Ag NPs in hybrid nanostructure was accelerated by Fe3+ ions. It has been reported that the addition of Ag and Fe3+ enhances the bio-leaching efficiency of the As-bearing gold ore and the electron transfer from Ag-core to the FeCo shell in 15 nm hybrid nanoparticles, which are proven by XPS results [48].
It is widely accepted that nano-silver interacts with bacterial membranes and causes cell wall disruption [49,50]. The Ag NPs absorbed on the outer bacteria membrane surface penetrates into the cytoplasm and inhibits cell replication [51]. The Ag NPs simultaneously induce apoptosis and inhibit DNA synthesis due to the silver ions (Ag+) [52]. Oxidation/reduction of silver ions and Fe+ promoting the release of silver ions to kill bacteria would proceed. In a reversible process, the concentration of silver ions remained stable in hybrid nanoparticles, showing a higher antibacterial activity compared to Ag NPs. Based on the results mentioned above, we suggest a novel mechanism of the inactivation of bacteria by FeAg NPs hybrids. The Ag+ would intervene in a reversible electron transfer to Fe3+ (Figure 4).
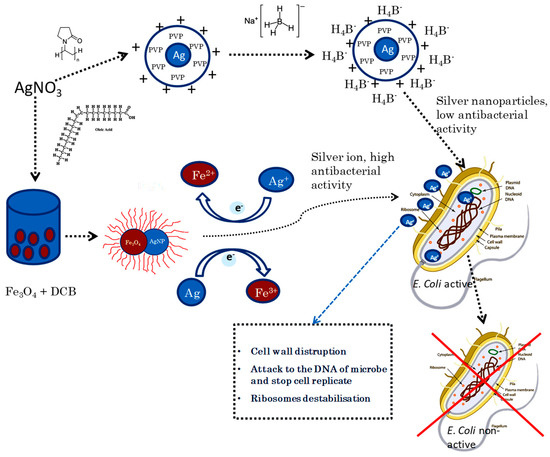
Figure 4.
Mechanism of inactivation of E. coli by FeAg NPs in which the electron exchange between Ag NPs and Fe NPs promotes the formation of the Ag+-ion leading to inactivation of E. coli.
3.3. Nanoscale Architecture of PE /FeAg NPs Nanocomposites
Figure 5 shows the morphology of the HDPE/FeAg NPs of neat HDPE and HDPE/FeAg NPs nanocomposites. The nanocomposites present a very different structure compared to that of neat PE in which the HDPE exhibits banded spherulites with sizes from 10–20 µm. The formation of ring-banded spherulites of semi-crystalline polymers is well known. The concerted twisting of the crystallographic orientation takes place during lamella growth under effect of surface stress but the arrangement of lamella in the banded spherulites is still an open question. It has been suggested that lamella stacks were continuously twisted up and down to create ridge and valley banded spherulites, respectively. The valley areas are basically composed by plat-on lamella while the edge-on lamellas are present in ridge areas. However, this band structure is not observed in the case of HDPE/FeAg NPs nanocomposites. This can be attributed to nanoparticles acting as a nucleation agent for the crystallization at an early stage of the crystallization. This can explain why the nanocomposites possess a higher spherulite density with smaller sizes compared to those of neat HDPE. It is interesting that the HDPE/FeAg NPs structure of spherulites was mainly composed by edge on lamella with a growth direction perpendicular to the substrate. This structure gives a more suitable configuration for the release of nanoparticles during the antibacterial tests. The IR spectra in Figure 5 show that the main vibrational peaks appearing in the IR spectra of neat HDPE are similar to those measured by the traditional FT-IR microscope related to the intensity and position. The bands at 2924 and 2874 cm−1 are assigned to the vibration of symmetric and asymmetric methylene groups (Figure 5i). These bands shift to lower frequencies in the case of nanocomposites due to the contribution of a long alkyl chain of oleic acid and oleylamine of the nanoparticles coating (Figure 5h). This peak has been also observed in the coated nanoparticles due to the presence of an alkyl chain of surfactant (Figure 5i). The vibrational bands at 1461, 1396 and 1368 cm−1, assigned to CH2 bending, CH3 bending and CH2 wagging, respectively, shift to lower frequencies in the nanocomposites (Figure 5a,b). In particular, a new peak at about 1245 cm−1 is observed in the case of nanocomposites which is slightly different to that observed in the case of pure nanoparticles at about 1225 cm−1 (Figure 5c) This band is probably due to the presence of C-O stretching in the ester and H bonded hydroxyl group stretching [53]. The appearance of the peak at 1245 cm−1 is important to identify the presence of nanoparticles near the sample surface of the nanocomposites and it can be used as a marker to detect nanocomposites in a PE matrix.
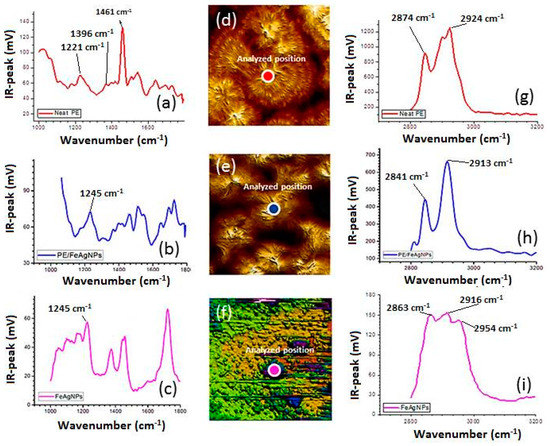
Figure 5.
Nano-IR spectra at the region 1000–1800 cm−1 (a) neat HDPE, (b) HDPE/FeAg NPs nanocomposites and (c) pure dumbbell like-FeAg NPs; AFM images of (d) neat PE spherulite, (e) nanocomposites spherulites, (f) pure nanoparticles; Nano-IR spectra at the region 3200–3600 cm−1 of (g) neat PE, (h) nanocomposite and (i) neat hybrid nanoparticles. AFM images show at the position at which the IR spectra were analyzed. Sample thicknesses were about 500 nm and films were deposed on gold substrates.
Figure 6 shows high-resolution AFM images of neat HDPE and the surface nanocomposites. The morphology of the spherulites is shown in Figure 5, but not the contour of the nanoparticle surface. The presence of nanoparticles on the sample was therefore determined by IR-spectroscopy. The peak at 1245 cm−1 was assigned to the C-O stretching in the OA/OLA layer (P1-P3), but it is absent in neat PE as shown in Figure 7. The distribution of nanoparticles was obtained by TEM.
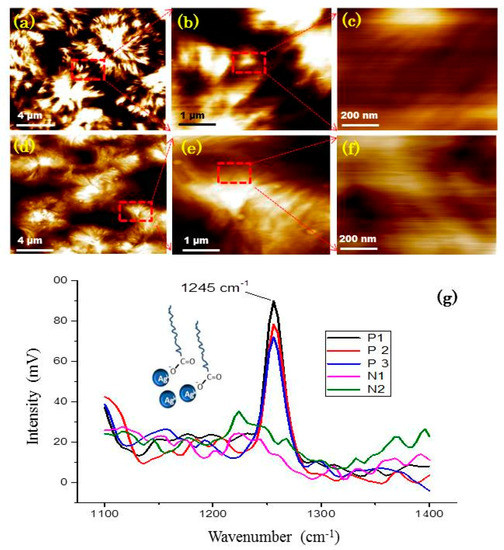
Figure 6.
High-resolution AFM images of neat HDPE at different magnifications (a–c); high-resolution AFM images of morphology of HDPE/FeAg NPs nanocomposites (d–f) and IR spectra (g) of neat PE at position N1 and N2, the spectra of HDPE/FeAg NPs nanocomposites at different positions P1, P2, P3.
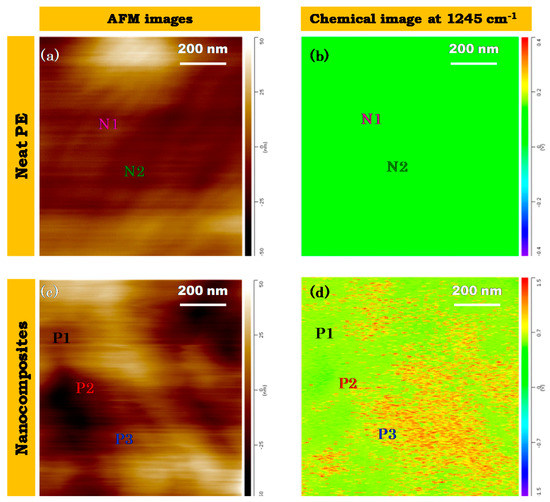
Figure 7.
(a) high resolution AFM images of neat HDPE; (b) IR-mapping image of neat HDPE; (c) high resolution AFM images of HDPE/FeAg NPs nanocomposites; (d) IR mapping image of HDPE/FeAg NPs nanocomposites. The points N1, N2, P1, P2, P3 are points corresponding to the nano-spectra analysis described below in Figure 8. Film thickness was close to 500 nm, deposed on Si-wafer substrate.
Resonance enhanced IR-spectroscopy single beam mode was used to obtain a dimensional mapping image of C-O stretching at 1245 cm−1 in the area shown in Figure 7. In the case of neat PE, IR- absorption mapping at 1245 cm−1 was observed to be negligible. The band was absent in neat PE shown in Figure 6c,g. However, for the HDPE/FeAg NPs nanocomposites, the absorption of C-O stretching was observed. In fact, there are some domains in which the IR-absorption of C-O was strong. This high vibrational absorption was due to the presence of OA/OLA on the surface of hybrid nanoparticles. For the first time nanoparticles are detected on a polymer matrix in the nanoscale without using the TEM technique. This is a non-destructive method for the characterization of nanoparticles dispersed on a polymer matrix.
Figure 8 shows the AFM-Raman spectra and AFM images with the characteristic bands for FeAg NPs located at 1792, 1345 and 614 cm−1. It is interesting to see that the typical Raman shift of magnetite Fe3O4 around 668–670 cm−1 was not observed in both FeAg NPs and nanocomposites [54]. However, two new bands at 613 and 1345 cm−1 appeared and were assigned to the Raman vibrational peaks of α-Fe2O3 [55]. These bands were visible on FeAg NPs alone and in the nanocomposite films. This may involve the phase transformation from Fe3O4 to α-Fe2O3 hexagonal plates. In other words, the electron transfer from Ag NPs to Fe3O4 leads to the reduction from Fe3+ to Fe2+ ions during the nucleation/growth of Fe3O4 polyhedral particles as described above in Figure 4. The broadening of the peak at 1792 and 2778 cm−1 is due to the vibrational carbonyl group and methylene group in the structure of oleic acid. In neat PE, characteristic Raman vibrational bands are seen at 1060 and 1130 cm−1 and both are assigned to C-C stretching; the bands at 1295, 1444, 2846, 2899 cm−1 are assigned to methylene twisting, CH2 wagging and asymmetric and symmetric CH2 stretching vibrations. The shift to lower frequencies is due to the change in the crystallinity and of the lamella assembly on the HDPE-surface. Two new bands observed at 1558 and 1373 cm−1 in the Raman spectrogram of the HDPE/FeAg NPs particles, but could not be assigned at the present time.
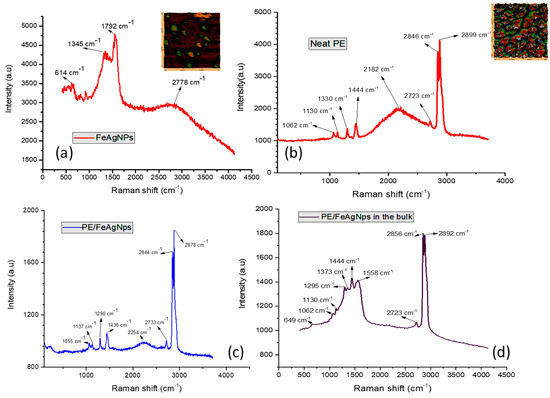
Figure 8.
Raman spectra of (a) FeAg NPs; (b) neat HDPE, (c) PE/FeAg NPs and (d) HDPE/FeAg Nps in the bulk. Inserted figures show corresponding AFM images.
4. Conclusions
This study presents the synthesis of new and uniform hybrid nanoparticles nano-spheres of Ag NPs (6–8 nm) and dumbbell like-hybrid FeAg NPs (15–16 nm). The activity was evaluated when they are incorporated with a polyolefin. By resonance enhanced atomic force microscopy coupled infrared spectroscopy (nano-IR), it was possible to detect and identify the distribution of the nanoparticles in the polymer matrix. The lamella assembly and the spherulite structure of PE/FeAg NPs are also examined. AFM-Raman spectra of the nanocomposites provide useful information about the electron-transfer mechanism of the hybrid nanoparticles, resulting in a higher antibacterial activity. The electron-transfer would proceed from hybrid FeAg NPs and Ag NPs to Fe3O4 NPs in a reversible fashion. The ionization of Ag NPs in hybrid nanostructure might be accelerated by Fe3+ ions. The as-prepared nanocomposites exhibit a self-sterilizing property, avoiding the formation of biofilms, which are the most dangerous source capable of spreading toxic bacteria into the environment.
Author Contributions
P.N.-T. supervised and wrote the manuscript. T.A.N. participated to write and edited the manuscript. V.T.N. participated to do experiments and explains obtained results.
Funding
This work was financial supported by Natural Sciences and Engineering Research Council of Canada (NSERC).
Acknowledgments
We thank Patricia (University of Montreal, Canada) for help with the AFM-IR measurements. Authors would like to thank Le Lu (institute for Tropical technology, VietNam) for the synthesis of these nanoparticles.
Conflicts of Interest
The authors declare no conflict of interest.
References
- Wang, L.-S.; Gupta, A.; Rotello, V.M. Nanomaterials for the Treatment of Bacterial Biofilms. ACS Infect. Dis. 2016, 2, 3–4. [Google Scholar] [CrossRef]
- Pappas, H.C.; Phan, S.; Yoon, S.; Edens, L.E.; Meng, X.; Schanze, K.S.; Whitten, D.G.; Keller, D.J. Self-Sterilizing, Self-Cleaning Mixed Polymeric Multifunctional Antimicrobial Surfaces. ACS Appl. Mater. Interfaces 2015, 7, 27632–27638. [Google Scholar] [CrossRef]
- Hui, L.; Su, Y.; Ye, T.; Liu, Z.; Tian, Q.; He, C.; Zhao, Y.; Chen, P.; Wang, X.; Han, W.; et al. Self-Sterilizing and Regeneratable Microchip for the Precise Capture and Recovery of Viable Circulating Tumor Cells from Patients with Cancer. ACS Appl. Mater. Interfaces 2018, 10, 207–218. [Google Scholar] [CrossRef] [PubMed]
- Turner, A.; Chen, S.-N.; Joike, M.K.; Pendland, S.L.; Pauli, G.F.; Farnsworth, N.R. Inhibition of Uropathogenic Escherichia coli by Cranberry Juice: A New Antiadherence Assay. J. Agric. Food Chem. 2005, 53, 8940–8947. [Google Scholar] [CrossRef] [PubMed]
- Osawa, R.; Kamide, T.; Satoh, Y.; Kawano, Y.; Ohtsu, I.; Dairi, T. Heterologous and High Production of Ergothioneine in Escherichia coli. J. Agric. Food Chem. 2018, 66, 1191–1196. [Google Scholar] [CrossRef] [PubMed]
- Xiu, Z.-M.; Zhang, Q.-B.; Puppala, H.L.; Colvin, V.L.; Alvarez, P.J.J. Negligible Particle-Specific Antibacterial Activity of Silver Nanoparticles. Nano Lett. 2012, 12, 4271–4275. [Google Scholar] [CrossRef]
- López-Esparza, J.; Espinosa-Cristóbal, L.F.; Donohue-Cornejo, A.; Reyes-López, S.Y. Antimicrobial Activity of Silver Nanoparticles in Polycaprolactone Nanofibers against Gram-Positive and Gram-Negative Bacteria. Ind. Eng. Chem. Res. 2016, 55, 12532–12538. [Google Scholar] [CrossRef]
- Ramalingam, B.; Parandhaman, T.; Das, S.K. Antibacterial Effects of Biosynthesized Silver Nanoparticles on Surface Ultrastructure and Nanomechanical Properties of Gram-Negative Bacteria viz. Escherichia coli and Pseudomonas aeruginosa. ACS Appl. Mater. Interfaces 2016, 8, 4963–4976. [Google Scholar] [CrossRef]
- Taglietti, A.; Diaz Fernandez, Y.A.; Amato, E.; Cucca, L.; Dacarro, G.; Grisoli, P.; Necchi, V.; Pallavicini, P.; Pasotti, L.; Patrini, M. Antibacterial Activity of Glutathione-Coated Silver Nanoparticles against Gram Positive and Gram Negative Bacteria. Langmuir 2012, 28, 8140–8148. [Google Scholar] [CrossRef] [PubMed]
- Phuong, N.-T. Claudiane Ouellet Plamondon. In Nanomaterials Based Coatings; Elsevier: Amsterdam, The Netherlands, 2019. [Google Scholar]
- Tang, D.; Yuan, R.; Chai, Y. Magnetic Core-Shell Fe3O4@Ag Nanoparticles Coated Carbon Paste Interface for Studies of Carcinoembryonic Antigen in Clinical Immunoassay. J. Phys. Chem. B 2006, 110, 11640–11646. [Google Scholar] [CrossRef] [PubMed]
- Liu, C.H.; Zhou, Z.D.; Yu, X.; Lv, B.Q.; Mao, J.F.; Xiao, D. Preparation and characterization of Fe3O4/Ag composite magnetic nanoparticles. Inorg. Mater. 2008, 44, 291–295. [Google Scholar] [CrossRef]
- Chang, M.; Lin, W.-S.; Xiao, W.; Chen, Y.-N. Antibacterial Effects of Magnetically-Controlled Ag/Fe3O4 Nanoparticles. Materials 2018, 11, 659. [Google Scholar] [CrossRef]
- Liu, X.; Yin, G.; Yi, Z.; Duan, T. Silk Fiber as the Support and Reductant for the Facile Synthesis of Ag–Fe3O4 Nanocomposites and Its Antibacterial Properties. Materials 2016, 9, 501. [Google Scholar] [CrossRef] [PubMed]
- Nguyen-Tri, P.; Nguyen, T.A.; Carriere, P.; Ngo Xuan, C. Nanocomposite Coatings: Preparation, Characterization, Properties, and Applications. Int. J. Corros. 2018, 2018, 1–19. [Google Scholar] [CrossRef]
- Pyun, J.; Jia, S.; Kowalewski, T.; Patterson, G.D.; Matyjaszewski, K. Synthesis and Characterization of Organic/Inorganic Hybrid Nanoparticles: Kinetics of Surface-Initiated Atom Transfer Radical Polymerization and Morphology of Hybrid Nanoparticle Ultrathin Films. Macromolecules 2003, 36, 5094–5104. [Google Scholar] [CrossRef]
- Li, X.; Ji, N.; Li, M.; Zhang, S.; Xiong, L.; Sun, Q. Morphology and Structural Properties of Novel Short Linear Glucan/Protein Hybrid Nanoparticles and Their Influence on the Rheological Properties of Starch Gel. J. Agric. Food Chem. 2017, 65, 7955–7965. [Google Scholar] [CrossRef]
- Nguyen Tri, P.; Guinault, A.; Sollogoub, C. Élaboration et propriétés des composites polypropylène recyclé/fibres de bambou. Matér. Tech. 2012, 100, 413–423. [Google Scholar] [CrossRef]
- Azizi, S.; David, E.; Fréchette, M.F.; Nguyen-Tri, P.; Ouellet-Plamondon, C.M. Electrical and thermal conductivity of ethylene vinyl acetate composite with graphene and carbon black filler. Polym. Test. 2018, 72, 24–31. [Google Scholar] [CrossRef]
- Azizi, S.; David, E.; Fréchette, M.F.; Nguyen-Tri, P.; Ouellet-Plamondon, C.M. Electrical and thermal phenomena in low-density polyethylene/carbon black composites near the percolation threshold. J. Appl. Polym. Sci. 2018, 47043. [Google Scholar] [CrossRef]
- Boukehili, H.; Nguyen-Tri, P. Helium gas barrier and water absorption behavior of bamboo fiber reinforced recycled polypropylene. J. Reinf. Plast. Compos. 2012, 31, 1638–1651. [Google Scholar] [CrossRef]
- Nguyen Tri, P.; Gilbert, V. Non-isothermal Crystallization Kinetics of Short Bamboo Fiber-reinforced Recycled Polypropylene Composites. J. Reinf. Plast. Compos. 2010, 29, 2576–2591. [Google Scholar] [CrossRef]
- Nguyen Tri, P.; Sollogoub, C.; Guinault, A. Relationship between fiber chemical treatment and properties of recycled pp/bamboo fiber composites. J. Reinf. Plast. Compos. 2010, 29, 3244–3256. [Google Scholar] [CrossRef]
- Nguyen Tri, P.; Nguyen, T.A.; Nguyen, T.H.; Carriere, P. Antibacterial Behavior of Hybrid Nanoparticles. In Noble Metal-Metal Oxide Hybrid Nanoparticles; Woodhead Publishing: Sawston, UK, 2019; pp. 141–155. [Google Scholar]
- Tri, P.N.; Rtimi, S.; Nguyen, T.A.; Vu, M.T. Physics, Electrochemistry, Photochemistry, and Photoelectrochemistry of Hybrid Nanoparticles. In Noble Metal-Metal Oxide Hybrid Nanoparticles; Woodhead Publishing: Sawston, UK, 2019; pp. 95–123. [Google Scholar]
- Nguyen Tri, P.; Ouellet-Plamondon, C.; Rtimi, S.; Assadi, A.A.; Nguyen, T.A. Methods for Synthesis of Hybrid Nanoparticles. In Noble Metal-Metal Oxide Hybrid Nanoparticles; Woodhead Publishing: Sawston, UK, 2019; pp. 51–63. [Google Scholar]
- Brandon, A.M.; Gao, S.-H.; Tian, R.; Ning, D.; Yang, S.-S.; Zhou, J.; Wu, W.-M.; Criddle, C.S. Biodegradation of Polyethylene and Plastic Mixtures in Mealworms (Larvae of Tenebrio molitor) and Effects on the Gut Microbiome. Environ. Sci. Technol. 2018, 52, 6526–6533. [Google Scholar] [CrossRef] [PubMed]
- Nguyen, T.V.; Nguyen Tri, P.; Nguyen, T.D.; El Aidani, R.; Trinh, V.T.; Decker, C. Accelerated degradation of water borne acrylic nanocomposites used in outdoor protective coatings. Polym. Degrad. Stabil. 2016, 128, 65–76. [Google Scholar] [CrossRef]
- Nguyen Tri, P.; Prud’homme, R.E. Crystallization and Segregation Behavior at the Submicrometer Scale of PCL/PEG Blends. Macromolecules 2018, 51, 7266–7273. [Google Scholar] [CrossRef]
- Nguyen, T.P. Nanoscale analysis of the photodegradation of Polyester fibers by AFM-IR. J. Photochem. Photobiol. A Chem. 2018, 371, 196–204. [Google Scholar] [CrossRef]
- Tri, P.N.; Prud’homme, R.E. Nanoscale Lamellar Assembly and Segregation Mechanism of Poly(3-hydroxybutyrate)/Poly(ethylene glycol) Blends. Macromolecules 2018, 51, 181–188. [Google Scholar] [CrossRef]
- Mohapatra, S.; Nguyen, T.A.; Nguyen-Tri, P. Noble Metal-Metal Oxide Hybrid Nanoparticles: Fundamentals and Applications; Elsevier: Amsterdam, The Netherlands, 2018; Volume 1. [Google Scholar]
- El Aidani, R.; Nguyen-Tri, P.; Malajati, Y.; Lara, J.; Vu-Khanh, T. Photochemical aging of an e-PTFE/NOMEX® membrane used in firefighter protective clothing. Polym. Degrad. Stabi. 2013, 98, 1300–1310. [Google Scholar] [CrossRef]
- Zeb, G.; Tri, P.N.; Palacin, S.; Le, X.T. Pulse potential deposition of thick polyvinylpyridine-like film on the surface of titanium nitride. RSC Adv. 2016, 6, 80825–80829. [Google Scholar] [CrossRef]
- Nguyen, T.V.; Le, X.H.; Dao, P.H.; Decker, C.; Nguyen-Tri, P. Stability of acrylic polyurethane coatings under accelerated aging tests and natural outdoor exposure: The critical role of the used photo-stabilizers. Prog. Org. Coat. 2018, 124, 137–146. [Google Scholar] [CrossRef]
- Cowcher, D.P.; Deckert-Gaudig, T.; Brewster, V.L.; Ashton, L.; Deckert, V.; Goodacre, R. Detection of Protein Glycosylation Using Tip-Enhanced Raman Scattering. Anal. Chem. 2016, 88, 2105–2112. [Google Scholar] [CrossRef] [PubMed]
- Huang, S.; Pandey, R.; Barman, I.; Kong, J.; Dresselhaus, M. Raman Enhancement of Blood Constituent Proteins Using Graphene. ACS Photonics 2018, 5, 2978–2982. [Google Scholar] [CrossRef]
- Dazzi, A.; Prater, C.B. AFM-IR: Technology and Applications in Nanoscale Infrared Spectroscopy and Chemical Imaging. Chem. Rev. 2017, 117, 5146–5173. [Google Scholar] [CrossRef] [PubMed]
- Hartman, T.; Wondergem, C.S.; Kumar, N.; van den Berg, A.; Weckhuysen, B.M. Surface- and Tip-Enhanced Raman Spectroscopy in Catalysis. J. Phys. Chem. Lett. 2016, 7, 1570–1584. [Google Scholar] [CrossRef] [PubMed]
- Koutzarova, T.; Kolev, S.; Ghelev, C.; Paneva, D.; Nedkov, I. Microstructural study and size control of iron oxide nanoparticles produced by microemulsion technique. Phys. Status Solidi (c) 2006, 3, 1302–1307. [Google Scholar] [CrossRef]
- Rahman, O.U.; Mohapatra, S.C.; Ahmad, S. Fe3O4 inverse spinal super paramagnetic nanoparticles. Mater. Chem. Phys. 2012, 132, 196–202. [Google Scholar] [CrossRef]
- Kuriakose, S.; Choudhary, V.; Satpati, B.; Mohapatra, S. Enhanced photocatalytic activity of Ag-ZnO hybrid plasmonic nanostructures prepared by a facile wet chemical method. Beilstein J. Nanotechnol. 2014, 5, 639–650. [Google Scholar] [CrossRef] [PubMed]
- Mandal, S.; Wang, J.; Winans, R.E.; Jensen, L.; Sen, A. Quantum Size Effects in the Optical Properties of Ligand Stabilized Aluminum Nanoclusters. J. Phys. Chem. C 2013, 117, 6741–6746. [Google Scholar] [CrossRef]
- Peng, S.; McMahon, J.M.; Schatz, G.C.; Gray, S.K.; Sun, Y. Reversing the size-dependence of surface plasmon resonances. Pro. Natl. Acad. Sci. 2010, 107, 14530–14534. [Google Scholar] [CrossRef] [PubMed]
- Xu, S.; Hartvickson, S.; Zhao, J.X. Engineering of SiO2-Au-SiO2 Sandwich Nanoaggregates Using a Building Block: Single, Double, and Triple Cores for Enhancement of Near Infrared Fluorescence. Langmuir 2008, 24, 7492–7499. [Google Scholar] [CrossRef]
- Siiman, O.; Bumm, L.A.; Callaghan, R.; Blatchford, C.G.; Kerker, M. Surface-enhanced Raman scattering by citrate on colloidal silver. J. Phys. Chem. 1983, 87, 1014–1023. [Google Scholar] [CrossRef]
- Chudasama, B.; Vala, A.K.; Andhariya, N.; Upadhyay, R.V.; Mehta, R.V. Enhanced antibacterial activity of bifunctional Fe3O4-Ag core-shell nanostructures. Nano Res. 2009, 2, 955–965. [Google Scholar] [CrossRef]
- Buszewski, B.; Railean-Plugaru, V.; Pomastowski, P.; Rafinska, K.; Szultka-Mlynska, M.; Golinska, P.; Wypij, M.; Laskowski, D.; Dahm, H. Antimicrobial activity of biosilver nanoparticles produced by a novel Streptacidiphilus durhamensis strain. J. Microbiol. Immunol. Infect. 2018, 51, 45–54. [Google Scholar] [CrossRef]
- Banach, M.; Tymczyna, L.; Chmielowiec-Korzeniowska, A.; Pulit-Prociak, J. Nanosilver Biocidal Properties and Their Application in Disinfection of Hatchers in Poultry Processing Plants. Bioinorg. Chem. Appl. 2016, 2016, 5214783. [Google Scholar] [CrossRef]
- Bao, H.; Yu, X.; Xu, C.; Li, X.; Li, Z.; Wei, D.; Liu, Y. New toxicity mechanism of silver nanoparticles: Promoting apoptosis and inhibiting proliferation. PLoS ONE 2015, 10, e0122535. [Google Scholar] [CrossRef]
- Wakshlak, R.B.; Pedahzur, R.; Avnir, D. Antibacterial activity of silver-killed bacteria: The “zombies” effect. Sci. Rep. 2015, 5, 9555. [Google Scholar] [CrossRef] [PubMed]
- Žagar, E.; Grdadolnik, J. An infrared spectroscopic study of H-bond network in hyperbranched polyester polyol. J. Mol. Struct. 2003, 658, 143–152. [Google Scholar] [CrossRef]
- Lu, J.F.; Tsai, C.J. Hydrothermal phase transformation of hematite to magnetite. Nanoscale Res. Lett. 2014, 9, 230. [Google Scholar] [CrossRef]
- Bellot-Gurlet, L.; Neff, D.; Réguer, S.; Monnier, J.; Saheb, M.; Dillmann, P. Raman Studies of Corrosion Layers Formed on Archaeological Irons in Various Media. J. Nano Res. 2009, 8, 147–156. [Google Scholar] [CrossRef]
- Schie, I.W.; Nolte, L.; Pedersen, T.L.; Smith, Z.; Wu, J.; Yahiatene, I.; Newman, J.W.; Huser, T. Direct comparison of fatty acid ratios in single cellular lipid droplets as determined by comparative Raman spectroscopy and gas chromatography. Analyst 2013, 138, 6662–6670. [Google Scholar] [CrossRef] [PubMed]
© 2019 by the authors. Licensee MDPI, Basel, Switzerland. This article is an open access article distributed under the terms and conditions of the Creative Commons Attribution (CC BY) license (http://creativecommons.org/licenses/by/4.0/).