Article

Poly(ε-Caprolactone)/Brewers’ Spent Grain Composites—The Impact of Filler Treatment on the Mechanical Performance

Department of Polymer Technology, Gdańsk University of Technology, Narutowicza 11/12, 80-233 Gdańsk, Poland
J. Compos. Sci. 2020, 4(4), 167; https://doi.org/10.3390/jcs4040167
Submission received: 6 October 2020 / Revised: 30 October 2020 / Accepted: 4 November 2020 / Published: 5 November 2020
(This article belongs to the Special Issue Progress in Polymer Composites)

Abstract

:
Waste lignocellulose materials, such as brewers’ spent grain, can be considered very promising sources of fillers for the manufacturing of natural fiber composites. Nevertheless, due to the chemical structure differences between polymer matrices and brewers’ spent grain, filler treatment should be included. The presented work aimed to investigate the impact of fillers’ reactive extrusion on the chemical structure and the poly(ε-caprolactone)/brewers’ spent grain composites’ mechanical performance. The chemical structure was analyzed by Fourier-transform infrared spectroscopy, while the mechanical performance of composites was assessed by static tensile tests and dynamic mechanical analysis. Depending on the filler pretreatment, composites with different mechanical properties were obtained. Nevertheless, the increase in pretreatment temperature resulted in the increased interface surface area of filler, which enhanced composites’ toughness. As a result, composites were able to withstand a higher amount of stress before failure. The mechanical tests also indicated a drop in the adhesion factor, pointing to enhanced interfacial interactions for higher pretreatment temperatures. The presented work showed that reactive extrusion could be considered an auspicious method for lignocellulose filler modification, which could be tailored to obtain composites with desired properties.

1. Introduction

From an economical and, most of all, the ecological point of view, one of the most beneficial approaches towards manufacturing natural fiber composites (NFCs) is applying various by-products or waste materials as reinforcements [1]. They can be obtained during the processing of renewable raw materials [2]. Among multiple candidates for such materials, it seems very interesting to use brewers’ spent grain (BSG)—the major by-product of the brewing industry [3]. According to the 2019 European Beer Trends Report conducted by The Brewers of Europe [4], beer’s European production has been increasing in recent years, currently exceeding 42 billion liters of beer annually. It results in the generation of over 2.5 million tonnes of BSG. In terms of chemical composition, brewers’ spent grain is relatively similar to various lignocellulosic fillers used during NFCs’ production [5]. Nevertheless, it contains noticeably higher amounts of proteins, providing additional properties to polymer composites [6]. Proteins may act as plasticizers of polymer matrices affecting the mechanical performance of the material and its processing by increasing the melt flow index [3]. Besides that, proteins may also participate in Maillard reactions resulting in the generation of melanoidins. Figure 1 presents a general scheme of Maillard reactions. These compounds are commonly known in food chemistry because of their antioxidant activity and beneficial impact on food products’ storage stability and shelf-life [7]. Potentially, they could also act as antioxidants in NFCs, enhancing their oxidative resistance. Such an effect was observed by other researchers, e.g., for composites containing coffee silverskin or spent coffee grounds [8,9]. Nevertheless, the incorporation of BSG into polymer matrices also shows some limitations. They are associated with relatively high humidity and large particle size [5]. Regarding the moisture content, BSG is present in the market in dried form. However, its price is significantly higher than the wet form. Moreover, in dried form, it still requires particle size reduction to be efficiently applied as a filler for NFCs.
Another issue related not only to the application of BSG but generally to all types of polymer composites, including NFCs, is their interfacial compatibility. Its appropriate level is essential for the satisfactory mechanical performance of composite materials [10,11]. In recent years, multiple approaches aimed at the enhancement of interfacial interactions were analyzed. They included modifications of polymer matrices, incorporation of additional compatibilizers, or various filler treatments [12]. Considering current pro-ecological trends and economic factors, it is very beneficial to reduce the number of steps required to manufacture polymer composites and simplify the whole production process. Such an approach could reduce the amount of generated waste and reduce the use of energy or water. It is also very beneficial to introduce unit processes with continuous character, instead of periodic character [13]. Considering these issues, properly designed filler treatment seems to be the most promising solution for the enhancement of interfacial adhesion in composites. The majority of fillers, especially those used for the manufacturing of NFCs (including analyzed BSG), require pretreatment to reduce particle size, which is an essential factor influencing the filler’s surface area [14]. Except for mechanical properties, small particle size may enhance the composite’s barrier properties, which can have an influence on, e.g., the rate of biodegradation [15]. Proper design of the grinding process could also result in the desired changes in the filler’s chemical structure due to the mechanical or thermo-mechanical treatment, promoting the affinity towards various polymer matrices. In BSG, such changes could be associated with the above mentioned Maillard reactions and generation of melanoidins.
The presented work aimed to investigate the impact of filler treatment on its particle size and chemical structure and the mechanical performance of the poly(ε-caprolactone)/brewers’ spent grain composites. The analyzed filler was subjected to reactive extrusion at various temperatures, based on the solution described in our patent application [16]. The changes in the chemical structure were assessed by Fourier-transform infrared spectroscopy (FTIR). The mechanical performance of composites was investigated by static tensile tests and dynamic mechanical analysis (DMA). The presented work should complement the current state of knowledge related to the polymer/BSG composites. Despite the numerous works investigating these materials in recent years [17,18,19,20,21,22,23], only the microscopic structure, mechanical, and thermal properties of the obtained NFCs were investigated. These works pointed to insufficient interfacial adhesion. However, the only applied modification of filler was alkali treatment applied by Berthet et al. [23]. Nevertheless, the effect of treatment could not be evaluated. The impact of melanoidins, generated during the thermo-mechanical treatment of brewers’ spent grain, on the mechanical performance of the resulting composites, has not been investigated yet.

2. Experimental

2.1. Materials

Brewers’ spent grain, used as a filler for poly(ε-caprolactone) (PCL), was acquired from Energetyka Złoczew Sp. z o.o. (Lututów, Poland). It was originally waste from the production of light lager and consisted solely of barley malts. The supplier already dried the obtained BSG. In Figure 2, there is shown the appearance of applied BSG. This by-product contains over 50 wt.% carbohydrates—cellulose, hemicellulose, lignin, and around 20 wt.% proteins.
The poly (ε-caprolactone) (Capa 6800, Mw = 80,000 g·mol−1) was acquired from Perstorp (Malmö, Sweden). It was selected as a matrix because of its relatively low processing temperature, which enables the reduction in energy consumption, simultaneously preventing lignocellulosic fillers from decomposition and reducing potential emissions of volatile organic compounds [3].

2.2. Extrusion Grinding of BSG

Extrusion grinding of BSG was performed with an EHP 2 × 20 Sline co-rotating twin-screw extruder from Zamak Mercator (Skawina, Poland), following our patent application [16]. The extruder has eleven heating/cooling zones with a screw diameter of 20 mm and an L/d ratio of 40. The screw configuration is shown in Figure 3. BSG was dosed into the extruder by a volumetric feeder with a constant throughput of 3 kg/h. The screw speed was set at 225 rpm; barrel temperature in all zones was set at 120 °C, 180 °C, or 240 °C. For each set of parameters, extrusion was carried out for at least 60 min after stabilizing the extruder’s motor load, which indicated the process’s stabilization. Therefore, at least 3 kg of each type of modified BSG was obtained. After grinding, samples of BSG were left in order to cool down to room temperature.
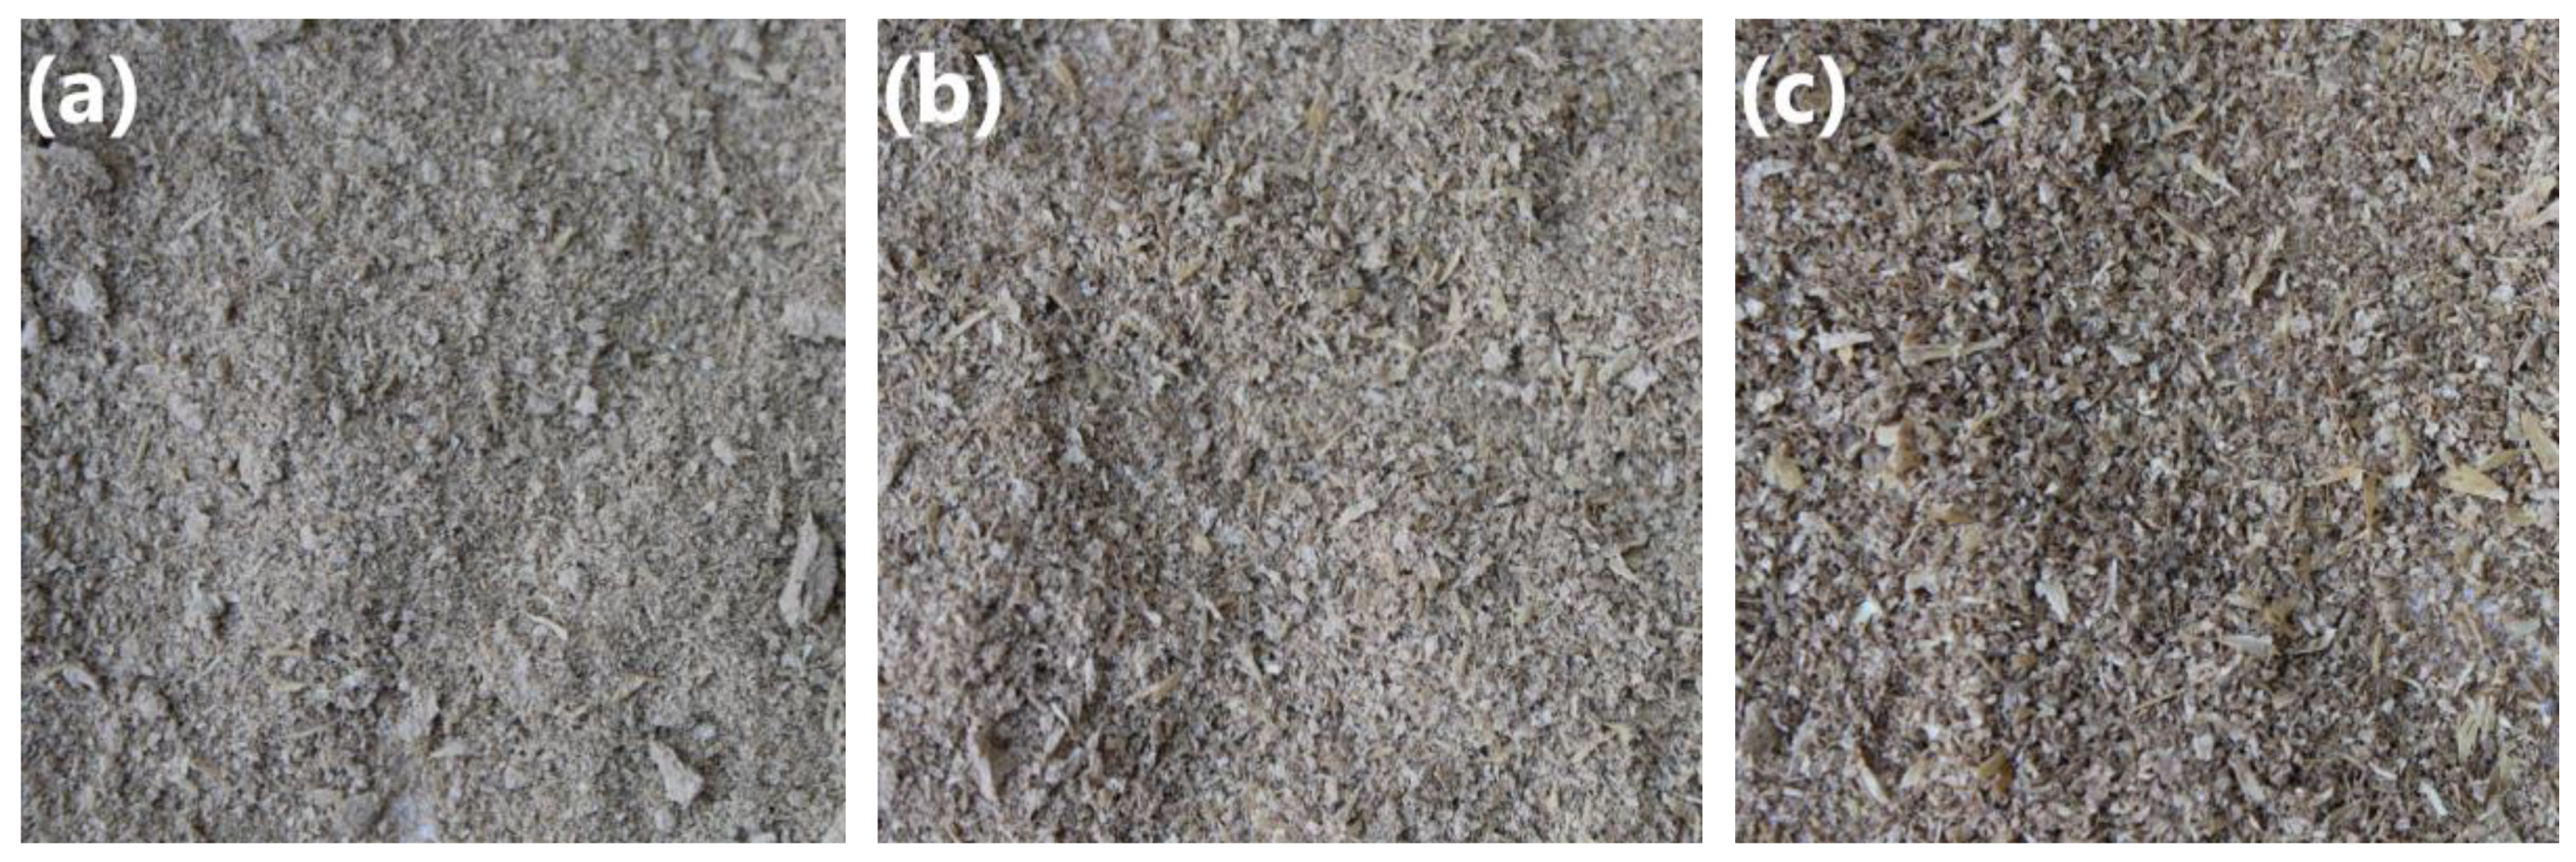
In Figure 4, the presented photographs show the appearance of the prepared materials. Samples extruded at 120 °C, 180 °C, and 240 °C were characterized with the following values of density—1.3669 g/cm3, 1.3691 g/cm3, and 1.3741 g/cm3, respectively. The slight increase in density with the temperature of modification could be associated with the removal of volatiles. In Figure 5, there is presented particle size distribution of modified brewers’ spent grain. It can be seen that the increase in processing temperature resulted in a slight decrease in particle size. Samples extruded at 120 °C, 180 °C, and 240 °C were characterized with the following average particle diameters—223 µm, 164 µm, and 157 µm, respectively.

2.3. Preparation of Polymer Composites

Composites filled with modified BSG were prepared in an EHP 2 × 20 Sline co-rotating twin-screw extruder from Zamak Mercator (Skawina, Poland) at 100 °C and a rotor speed of 100 rpm. Filler content in each sample was 20 wt.%, 30 wt.%, or 40 wt.%. At least 1 kg of each type of material was extruded. Next, they were compression molded at 100 °C and 4.9 MPa for 2 min and then kept under pressure at room temperature for another 5 min to solidify the material. Materials were molded into ready-to-test samples for tensile tests (sample 1BA according to ISO 527 standard) and dynamic mechanical analysis (40 × 10 × 2 mm). Obtained samples were coded as X/Y, where X stands for the temperature of BSG modification and Y for its content in composite. For comparison, the sample of unfilled PCL was also prepared and was named PCL.

2.4. Measurements

The particle size distribution of modified BSG samples was determined by sieve analysis. Samples were separated using a LPzE-2e siever from MULTISERW-Morek Jan Morek (Brzeźnica, Poland) with sieves characterized by the following openings—2.0, 1.0, 0.8, 0.6, 0.4, 0.2, 0.1, 0.075, 0.053, and 0.025 mm. The total sieve time was set at 10 min, while the amplitude of pulsing was 2 Hz.
The chemical structure of BSG samples and biocomposites were determined using Fourier transform infrared spectroscopy (FTIR) analysis performed by a Nicolet Spectrometer IR200 from Thermo Scientific (Waltham, MA, USA). The device had an attenuated total reflectance (ATR) attachment with a diamond crystal. Measurements were performed with 1 cm−1 resolution in the range from 4000 to 400 cm−1 and 64 scans.
The density of modified BSG samples and biocomposites was determined using an Ultrapyc 5000 Foam gas pycnometer from Anton Paar (Graz, Austria). The following measurement settings were applied: gas—helium; target pressure—10.0 psi; flow direction—sample first; temperature control—on; target temperature—20.0 °C; flow mode—fine powder; cell size—small, 10 cm3; preparation mode—pulse; the number of runs—5.
The tensile strength, elongation at break, and elastic modulus were estimated following the PN-EN ISO 527 standard, using the Instron 4465 H 1937 tensile testing machine with elongation head and an extensometer. Sample type 1BA was used. Tensile tests were performed at a constant speed of 1 mm/min (for elastic modulus) and 20 mm/min (tensile strength and elongation at break). Five samples were analyzed for each specimen.
The dynamic mechanical analysis was conducted on a DMA Q800 TA Instruments apparatus. Samples with dimensions of 40 × 10 × 2 mm were loaded with variable sinusoidal deformation forces in the single cantilever bending mode at the frequency of 1 Hz under the temperature rising rate of 4 °C/min, ranging the temperature from −100 °C to 100 °C.

3. Results and Discussion

3.1. Spectroscopic Analysis

In Figure 6, there are presented FTIR spectra of selected composites samples and applied raw materials. It can be seen that in qualitative terms, all types of modified BSG showed similar composition. Their spectra differed only by the intensity of particular signals, but generally, they were typical for lignocellulose materials. Moreover, obtained FTIR spectra are very similar to spectra obtained by other researchers for isolated melanoidins [24], which suggests that melanoidins were generated during modification of BSG. Broad peaks in the range of 3280–3340 cm−1 were attributed to O-H and N-H bonds’ stretching vibrations. The presence of these groups is typical for the lignocellulose materials and their components. Hydroxyl groups are commonly present in the structure of cellulose, lignin, but also starch, whose residue may be present in BSG. Amine groups are part of proteins present in BSG in substantial amounts (~20 wt.%). With the increasing temperature of BSG processing, peaks were shifted towards higher wavenumbers, suggesting the generation of amide groups during Maillard reactions, which results in signals above 3300 cm−1 [25]. For PCL, no such peaks were noted. In the range of 2850–2950 cm−1, there are observed signals associated with the symmetric and asymmetric stretching vibrations of C-H bonds in methyl and methylene groups. They are present in the polymer matrix, as well as carbohydrate structures of BSG. At 1722 cm−1 was noticed a signal that is typical for C=O ester bonds in poly(ε-caprolactone) [26]. For BSG samples, absorption bands in the range of 1620–1700 cm−1 were related to the stretching vibrations of unconjugated C=O and C=C bonds in polysaccharides. Moreover, the presence of amide bonds and the amide I vibrations (stretching vibrations of C=O and C-N bonds in amide groups) might have also contributed to these bands [27]. Oracz and Zyzelewicz [24] noted such an effect. Other signals associated with the presence of amide bonds generated during Maillard reactions were noted in the range of 1515–1550 cm−1 and were attributed to the amide II vibrations—the combination of N-H bending and C-N stretching vibrations of amide groups. These signals were not observed for PCL. For all raw materials, multiple bands were noted in the range of 1030–1460 cm−1. They were associated with stretching vibrations of C-O and C=O bonds present in structures of polysaccharides [28].
They showed relatively similar FTIR spectra, independently of type and content of modified BSG filler, regarding PCL-based composites. Such an effect was associated with the presence of similar chemical bonds in both components of composites. Compared to neat poly(ε-caprolactone), the introduction of applied fillers resulted in the appearance of a small signal around 3280–3340 cm−1, associated with the presence of hydroxyl and amide groups in modified BSG. Moreover, the most significant peak at 1722 cm−1 was slightly broadened, and the intensity of peaks at 1030–1120 cm−1 was increased. Nevertheless, no significant changes, which would indicate the chemical bonding at the matrix–filler interface, were noted. Therefore, FTIR analysis suggested only physical interactions, such as hydrogen bonding in the analyzed composites.

3.2. Physico-Mechanical Properties

In Table 1, there are presented the physical and mechanical properties of the prepared samples.
To determine the porosity of prepared composites, theoretical values of their density were calculated according to the simple rule of mixture, expressed by the following Equation (1):
ρc = ρm · (1 − φ) + ρf · φ
where: ρc—density of the composite, g/cm3; ρm—density of the matrix, g/cm3; ρf—density of the filler, g/cm3; φ—volume fraction of the filler, %vol.
Using obtained values of the density, the composite’s porosity was calculated (2):
p = (ρtheo − ρexp)/ρtheo · 100%
where: p—porosity of the material, %; ρtheo—theoretical value of density, g/cm3; and ρexp—the experimental value of density of composite, g/cm3.
It can be seen that prepared samples were characterized with very low values of porosity. This was associated with a low moisture content of applied polymer and fillers due to their drying before processing and the relatively high temperature of processing (100 °C) compared to PCL’s melting temperature, enabling efficient polymer melt flow.
Values of the average particle distance were calculated according to the following Equation (3) [29]:
D = r · (((4 · π)/(3 · φ))1/3 − 2)
where: D—the average distance between particles, µm; r—average radius of filler particles, µm.
Average particle distance decreased with the rise in filler content; a similar effect was noted by other researchers [30]. Considering its values for 40 wt.%, filler content (21–30 µm) may facilitate the unfavorable agglomeration of filler particles with the average particle size of 157–223 µm. Moreover, the average particle distance was decreasing with the average particle size. For a similar level of volume fraction of filler, such an effect is associated with the increasing number of particles dispersed in the matrix. This was also noted by Hong et al. [29], who incorporated nanometric (49 nm) and micrometric (40 µm) particles into the low-density polyethylene matrix. The same interparticle distance was noted for 14 vol.% loading of nanosized filler and 30 vol.% loading of micrometric filler.
In Table 1, there are also presented values of interface surface area for each composite sample. They were calculated according to the following Equation (4) presented by Nelson and Hu [31]:
Sa = (3 · φ)/r
where: Sa—interface surface area, µm−1.
Although the interface surface area’s calculation assumed the spherical shape of filler particles, it can be clearly seen that it increases with the decrease in the average particle size of filler and its loading. Nelson and Hu [31] noted a similar effect. For the same loading of nanosized (23 nm) and micrometric (1.5 µm) filler, surface areas were equal to 7.8 km2/m3 and 0.11 km2/m3, respectively.
Generally, the interface surface area is an essential parameter for the mechanical performance of composite materials. It is responsible for the phenomenon of nanocomposites, which require significantly lower filler loadings due to the much larger (even three orders of magnitude) specific surface area of nanofillers compared to micrometric fillers [30]. In the case of nanocomposites, especially at lower loadings, the increase in specific surface area is very beneficial in its impact on composite materials’ tensile strength. In the presented case, when waste-based lignocellulosic fillers were introduced into relatively strong poly(ε-caprolactone) matrix, a reinforcing effect, considering tensile strength, was not observed. Such an effect was confirmed by other researchers and our previous works [3,32].
The tensile performance of composites also varied depending on the temperature of BSG extrusion grinding. Such an effect can be associated with the changes in the filler’s chemical structure, related to non-enzymatic browning reactions, including Maillard reactions and caramelization. Maillard reactions can take place at lower temperatures than caramelization. They involve reactions of reducing sugars, which can be present in BSG in the amount of ~15 wt.% [33]. Except for typical reducing of sugars, and also other BSG compounds, lignin may show some reducing potential due to the presence of aldehyde groups, hence its ability to take part in Maillard reactions [34]. Products of Maillard reactions are commonly known as melanoidins. They are higher-molecular weight oligomeric and polymeric compounds containing various functional groups in their structure [35]. Therefore, their presence may be considered beneficial because they can provide additional hydrogen bonding at the matrix–filler interface.
The second group of reactions involves mono- and disaccharides and occurs at 160 °C or higher, except fructose (110 °C) [3]. Therefore, caramelization is especially pronounced for BSG processed at 240 °C, impacting the color of filler (see Figure 3). Caramelization results in the generation of high-molecular-weight compounds with multiple functional groups, e.g., caramelans (C24H36O18), caramelens (C36H50O25), and caramelins (C125H188O80) [36]. These compounds could improve the interfacial adhesion due to multiple possibilities for hydrogen interaction. Nevertheless, during caramelization, the decomposition of sugars also occurs, resulting in the generation of lower-molecular weight compounds, which do not evaporate during processing, such as 2,5-bis(hydroxymethyl)furan (boiling point of 275 °C) [37]. These lower-molecular weight compounds may act as plasticizers of the polymer matrix, causing deterioration of the tensile strength and increasing elongation at break. Such an effect is observed when comparing samples containing BSG processed at 180 °C and 240 °C.
A drop in tensile strength and elongation at break with the increasing filler loading was associated with insufficient interfacial adhesion, despite the increasing calculated interface surface area. Another aspect is overly small average particle distance, which considers the particle diameter and facilitates the agglomeration of filler. A similar effect, described as the critical particle–particle distance, was also described by other researchers [30,38]. As a result, composites were able to absorb a lower amount of energy before failure, which was expressed by the decrease in the toughness, obtained by integrating the area under stress–strain curves.
On the other hand, the enhancement of composites’ modulus was noted, and it is correlated with the increase in the interface surface area. Similar effects were noted by other researchers investigating PCL-based biocomposites [32,39]. Figure 7 presents a plot showing an almost linear correlation between these prepared composites’ parameters.
In Table 1, there are also presented results of dynamic mechanical analysis of prepared composites. Such analysis is often applied for a more comprehensive investigation of composite materials’ mechanical performance, additionally to the conventional static mechanical tests, e.g., tensile, compression, or impact tests. DMA analysis provides critical insights related to materials’ viscoelastic properties, such as storage modulus, loss modulus, or loss tangent.
According to literature data [30], the storage modulus of composite materials could be predicted by the rule of mixture, according to the following Equation (5):
E’c = E’m · (1 + φ)
where: E’—storage modulus, MPa; subscripts c and m—composite and matrix.
Einstein, in his work [40], modified this equation with the adhesion parameter. His model was developed to analyze the interfacial adhesion between spherical particles and incompressible polymer matrix. It is described by the following Equation (6):
E’c = E’m · (1 + 2.5 · φ)
Nevertheless, Einstein’s equation implied that the composite modulus linearly depends on the filler volume fraction, and interfacial adhesion is not affected by, e.g., the particle size of the filler. It assumes the perfect adhesion and dispersion of filler.
A relatively similar approach was proposed by Kerner [41], who also connected the modulus with filler volume fraction, but also included the effect of the matrix Poisson ratio. Moreover, his approach assumed that the filler’s stiffness is significantly higher than the polymer matrix’s stiffness. He proposed the following Equation (7):
E’c = E’m · (1 + (φ/(1 − φ)) · ((15 · (1 − νm))/(8 − 10 · νm)))
where: νm—matrix Poisson ratio (assumed to be 0.442 for PCL, based on the literature data [42]).
Another modification of Einstein’s model was developed by Guth [43], who considered the higher degree of interfacial interactions between the filler and the polymer matrix. He proposed the following Equation (8):
E’c = E’m · (1 + 1.25 · φ + 14.1 · φ2)
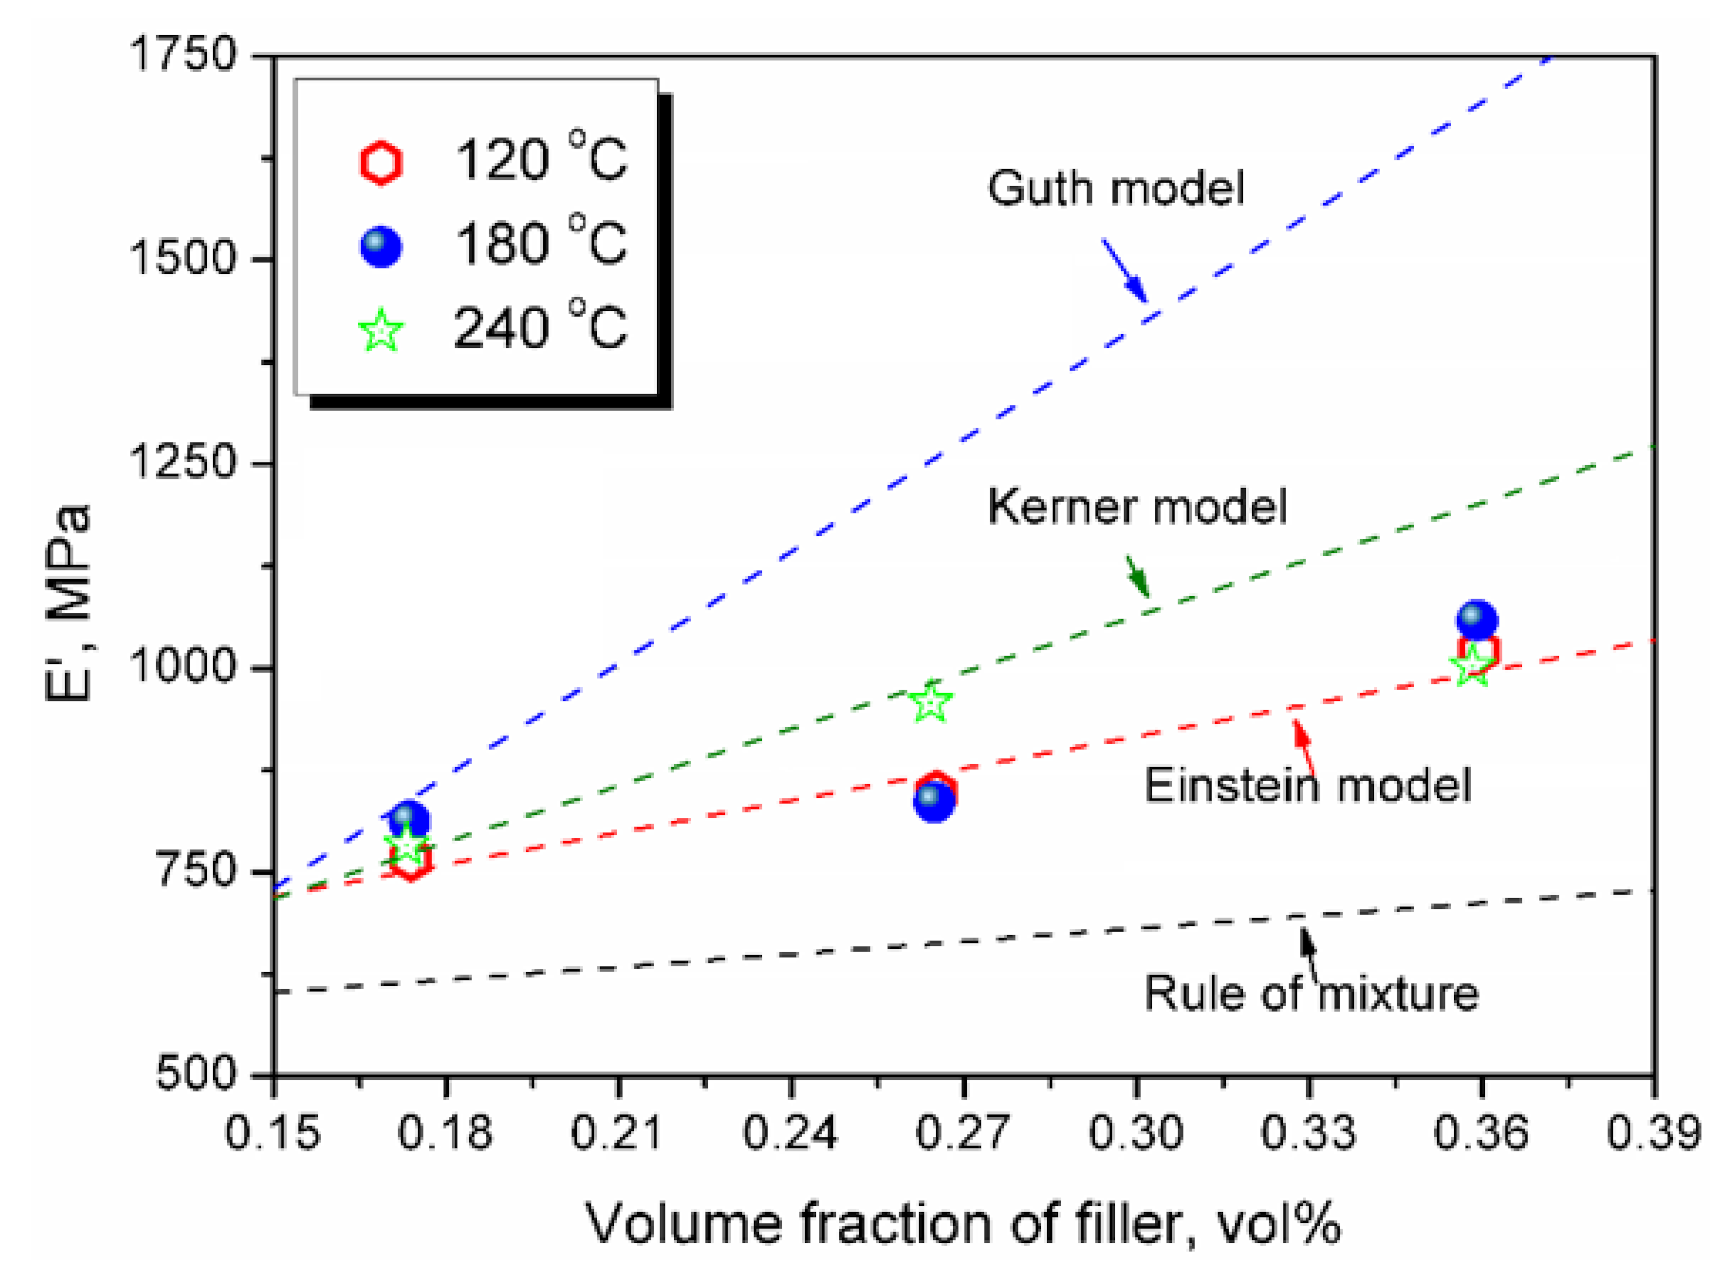
Table 1 presents values of storage modulus calculated for prepared composites using the equations mentioned above and compared to the value obtained from the dynamic mechanical analysis. It can be seen that for almost all samples, experimental values are between the results obtained by Einstein’s and Kerner’s models. For better visualization, obtained data was presented in Figure 8. Experimental data noticeably exceeded the values predicted by the rule of mixture, pointing to the interfacial adhesion between matrix and filler. On the other hand, values predicted by the Guth model were significantly higher. Such an effect was related to the assumptions of this model regarding a higher level of interfacial interactions.
To determine the efficiency of fillers on the modulus of prepared composites, in Table 1 there are presented values of C factor, which was introduced by Chua [44], and is expressed by the following Equation (9):
C = ((E’g c/E’r c)/(E’g m/E’r m))
where: E’g—storage modulus in the glassy state, MPa; E’r—storage modulus in the rubbery state, MPa.
The lower values of the C factor point to the higher efficiency of filler on the composite modulus. It can be seen that the C factor is decreasing with the rise in filler loading, which is associated with the increasing interface surface area and stiffening of material. Simultaneously, a drop in C factor was noted for the increasing temperature of BSG modification, which was related to the changes in the filler’s chemical structure mentioned above. Therefore, additional possibilities for the hydrogen bonding were provided after the treatment of BSG at higher temperatures, which increased the stiffness of composites.
Moreover, the results of the DMA analysis, together with the values of elongation at break, were used to calculate the brittleness of the material, according to the Equation (10) presented by Brostow et al. [45]:
B = 1/((εb ∙ E’))
where: B—brittleness, 1010 %·Pa; εb—elongation at break, %; E’—storage modulus at 25 °C, MPa.
Considering the equation mentioned above, brittleness can be considered as the antagonist of toughness. Material characterized by low brittleness should be characterized by its ability to withstand high forces over what is possibly the most comprehensive range of deformations. In the case of toughness, tensile strength is taken into account, while for brittleness, the storage modulus is considered.
Brostow et al. [46] related brittleness and toughness of multiple polymeric materials. They developed the Equation (11), which linked these to parameters:
τ = (b + c · B)/(1 + a · B)
where: τ—toughness, J/cm3; a, b, c—constants.
In our previous work [47], we presented this relationship using the power function in the form of the following Equation (12):
τ = d · Be
where: d, e—constants.
For data presented by Brostow et al. [46], d and e are 178.380, and −0.984, respectively. For PCL-based composites, values of constants were determined as 82.568 and −1.408, respectively. For better visualization, Figure 9 presents the relationship between toughness and brittleness for the prepared composites. It can be seen that obtained experimental data points lie below the curve proposed by Brostow et al. [46]. Such an effect is related to the insufficient interfacial adhesion between the PCL matrix and BSG fillers. The literature curve was developed for significantly more homogenous materials—homopolymers, copolymers, and metals. Therefore, no impact of interfacial adhesion was taken into account. On the other hand, in our previous work [48] related to PCL blends with reclaimed rubber, experimental data points lay over the literature curve. Nevertheless, the compatibility of these materials was significantly higher than for analyzed composites. It is mostly associated with composites’ tensile performance, which directly affects the value of their toughness.
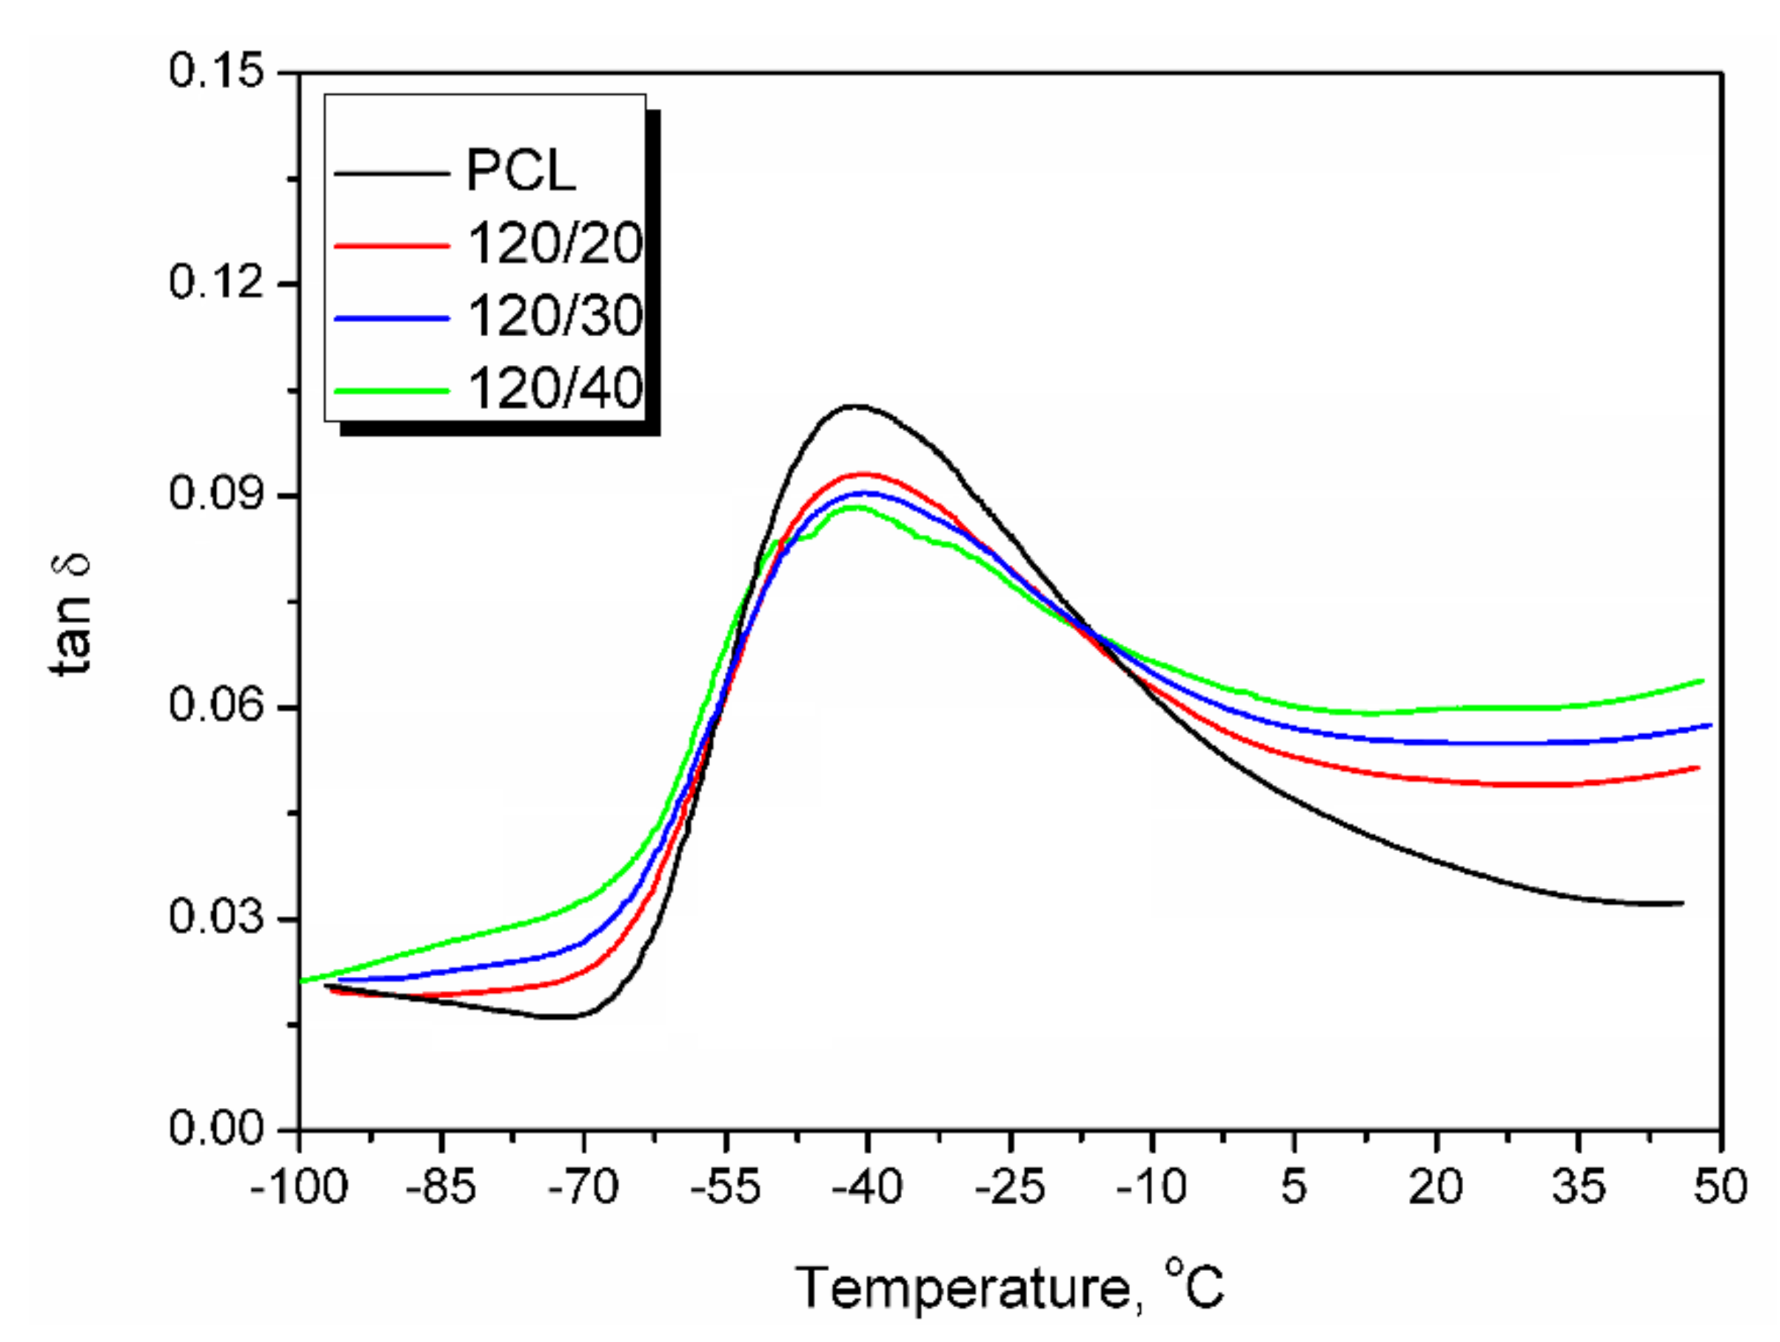
Except for the data related to the material’s stiffness, the dynamic mechanical analysis provides the information related to the glass transition temperature (Tg) and damping properties of materials. These properties are related to the loss tangent (tan δ) of material. The loss tangent is often called the damping factor because it expresses the material’s ability to dissipate the mechanical energy. Moreover, the peak of tan δ provides the information on glass transition temperature, which is related to the changes in the movement of small groups and chains of polymer macromolecules. Values of Tg for prepared materials are presented in Table 1, while temperature plots of tan δ for samples containing BSG modified at 120 °C are presented in Figure 10. For higher temperatures of modification, similar plots and dependences were noted. It can be seen that the introduction of BSG particles caused the shift of Tg towards higher temperatures, which can be related to the decreased mobility of polymer chains [49]. Such an effect is caused by the incorporation of filler particles and the reduction in the interparticle distance.
Except for the temperature position of the tan δ peak, another important issue is its magnitude. It depends on the molecular motions occurring inside the composite and the material’s ability to dissipate the energy. Generally, the drop in tan δ peak value indicates the enhancement of the interfacial interactions and reduced polymer chain mobility inside composites [50]. A decrease in the peak’s magnitude was noted for all analyzed samples. However, it was not substantial. Nevertheless, a noticeable broadening of peaks was noted, which resulted in the slight increase in area under tan δ peaks. Such an effect suggests the increase in the constrained chain volume in polymer composites [30]. Their volume can be determined, based upon the information presented by various researchers [50], using the following Equation (13):
Cv = 1 − (((1 − C0) · W)/W0)
where Cv—volume fraction of the immobilized polymer chains, %; C0—volume fraction of the immobilized chains in pure polycaprolactone (taken to be 0), %; W and W0—energy loss fractions for an analyzed sample and pure PCL, respectively.
Energy loss fraction W can be calculated from the tan δ by the following Equation (14):
W = (π · tan δ)/((π · tan δ) + 1)
The values of constrained chain volume are increasing with filler loading (see Figure 11a). Such an effect is caused by the larger number of particles able to interact with the polymer matrix. Moreover, for the similar volume fractions of modified BSG, higher constrained chain volumes were noted for the increasing temperature of BSG processing. As shown in Figure 11b, it was related to the higher interface surface area resulting from the extruder’s thermo-mechanical treatment. As a result, the rise in treatment temperature strengthened the interfacial adhesion between matrix and filler, resulting from the changes in fillers’ chemical structure, especially the hydrogen bonding between phases.
For a more detailed analysis of the interfacial adhesion in presented composites and its dependence on applied fillers’ type and content, in Table 1, there are also presented values of the adhesion factor. The concept was proposed by Kubát et al. [51]. It is based on the assumption that composite materials’ mechanical properties are determined by matrix, filler, and interface performance. Therefore, the loss tangent of the composite can be given by the following Equation (15):
tan δc = φf · tan δf + φi · tan δi + φm · tan δm
where: c, f, i, and m—subscripts related to composite, filler, interface, and matrix, respectively.
Kubát et al. [51] also presented the simplifications of this model related to the relatively low damping of fillers and low volume fraction of the interface compared to the matrix and filler. After simplifications, the equation mentioned above can be rearranged into Equation (16):
A = (1/(1 − φf)) · (tan δc/tan δm) − 1
where: A—adhesion factor.
Low values of the adhesion factor indicate strong interfacial adhesion between the matrix and filler. The increase in filler loading resulted in the drop in adhesion factor for the investigated materials, indicating the system’s relatively poor compatibility. Moreover, lower values of A were noted for higher temperatures of BSG processing. This confirms the suggestions mentioned above that caramelization and Maillard reactions during filler treatment enhance the system’s compatibility.

4. Conclusions

The presented research paper aimed to investigate the impact of the pretreatment of brewers’ spent grain filler on the static and dynamic mechanical performance of poly(ε-caprolactone)-based composites. Due to the insufficient interfacial interactions with polymer matrices, modifications of lignocellulose materials are often essential to provide a satisfactory mechanical properties level. Moreover, waste lignocellulose materials, such as BSG, often could not be introduced into polymer matrices in crudo because they require at least a reduction in particle size. Therefore, the investigated modification process, which included simultaneous grinding of filler and thermo-mechanical treatment resulting in the chemical structure changes, should be considered very promising. Analyzed PCL/BSG composites showed different mechanical performance depending on the filler’s content and its pretreatment parameters. Increasing the modification temperature reduced the average particle size from 223 to 157 µm, respectively, for 120 and 240 °C. It caused an increase of over 40% in the interface surface area. As a result, composites’ toughness was even 30% higher for the filler loadings of 30 and 40 wt%. The increase in the energy that could be withstood by the composites before failure was also associated with the 30–40% drop in the adhesion factor and the 27–35% increase in constrained chain volume. These parameters are used to describe the interfacial interactions in polymer composites in qualitative and quantitative terms. Their changes directly indicate that the increase in pretreatment temperature caused the enhancement of composites’ compatibility.
The presented work showed that the reactive extrusion could be applied as a method for modifying lignocellulose fillers, and the adjustment of its parameters could be used to tailor the mechanical performance of natural fiber composites. Waste lignocellulose fillers often must require particle size reduction before the manufacturing of polymer composites, and it was included in the proposed pretreatment process. Moreover, due to the reactive extrusion application, the proposed pretreatment is very flexible and allows the introduction of additional chemical compounds, which could further enhance the compatibility of composites or provide them with additional properties. In the case of BSG, treatment may result in the changes in chemical structure related to the generation of melanoidins, which, as proven, may affect the compatibility with the polymer matrix and mechanical performance of composites. Moreover, applications of BSG and other natural materials, including wastes and by-products from different branches of industry, may be applied to exploit their additional properties, e.g., antioxidant activity. For example, coffee industry by-products have been repeatedly proven as efficient antioxidants. Therefore, similar investigations may be conducted for BSG. Based on the current state of knowledge, BSG could improve the oxidative stability of polymeric materials. Such an approach would be the topic of further studies. Generally, the presented results should provide interesting and valuable insight into the engineering and preparation of natural fiber composites.

Funding

This work was supported by the National Science Centre (NCN, Poland) in the frame of SONATINA 2 project 2018/28/C/ST8/00187—Structure and properties of lignocellulosic fillers modified in situ during reactive extrusion.

Conflicts of Interest

The author declares no conflict of interest.

References

  1. Sultana, T.; Sultana, S.; Nur, H.P.; Khan, M.W. Studies on Mechanical, Thermal and Morphological Properties of Betel Nut Husk Nano Cellulose Reinforced Biodegradable Polymer Composites. J. Compos. Sci. 2020, 4, 83. [Google Scholar] [CrossRef]
  2. Ates, B.; Koytepe, S.; Ulu, A.; Gurses, C.; Thakur, V.K. Chemistry, Structures, and Advanced Applications of Nanocomposites from Biorenewable Resources. Chem. Rev. 2020, 120, 9304–9362. [Google Scholar] [CrossRef] [PubMed]
  3. Hejna, A.; Formela, K.; Reza Saeb, M. Processing, mechanical and thermal behavior assessments of polycaprolactone/agricultural wastes biocomposites. Ind. Crop. Prod. 2015, 76, 725–733. [Google Scholar] [CrossRef]
  4. The Brewers of Europe. European Beer Trends. Statistic Report, 2019 Edition. Available online: https://brewersofeurope.org/uploads/mycms-files/documents/publications/2019/european-beer-trends-2019-web.pdf (accessed on 31 August 2020).
  5. Mussatto, S.I.; Dragone, G.; Roberto, I.C. Brewers’ spent grain: Generation, characteristics and potential applications. J. Cereal Sci. 2006, 43, 1–14. [Google Scholar] [CrossRef]
  6. Lynch, K.M.; Steffen, E.J.; Arendt, E.K. Brewers’ spent grain: A review with an emphasis on food and health. J. I. Brewing 2016, 122, 553–568. [Google Scholar] [CrossRef]
  7. Rufián-Henares, J.A.; Morales, F.J. Functional properties of melanoidins: In vitro antioxidant, antimicrobial and antihypertensive activities. Food Res. Int. 2007, 40, 995–1002. [Google Scholar] [CrossRef]
  8. Sarasini, F.; Tirillò, J.; Zuorro, A.; Maffei, G.; Lavecchia, R.; Puglia, D.; Dominici, F.; Luzi, F.; Valente, T.; Torre, L. Recycling coffee silverskin in sustainable composites based on a poly(butylene adipate-co-terephthalate)/poly(3-hydroxybutyrate-co-3-hydroxyvalerate) matrix. Ind. Crop. Prod. 2018, 118, 311–320. [Google Scholar] [CrossRef]
  9. Cataldo, V.A.; Cavallaro, G.; Lazzara, G.; Milioto, S.; Parisi, F. Coffee grounds as filler for pectin: Green composites with competitive performances dependent on the UV irradiation. Carbohyd. Polym. 2017, 170, 198–205. [Google Scholar] [CrossRef]
  10. Chan, C.M.; Vandi, L.J.; Pratt, S.; Halley, P.; Richardson, D.; Werker, A.; Laycock, B. Composites of wood and biodegradable thermoplastics: A review. Polym. Rev. 2017, 58, 444–494. [Google Scholar] [CrossRef]
  11. Pappu, A.; Pickering, K.L.; Thakur, V.K. Manufacturing and characterization of sustainable hybrid composites using sisal and hemp fibres as reinforcement of poly (lactic acid) via injection moulding. Ind. Crop. Prod. 2019, 137, 260–269. [Google Scholar] [CrossRef]
  12. Hejna, A.; Przybysz-Romatowska, M.; Kosmela, P.; Zedler, Ł.; Korol, J.; Formela, K. Recent advances in compatibilization strategies of wood-polymer composites by isocyanates. Wood Sci. Technol. 2020, 54, 1091–1119. [Google Scholar] [CrossRef]
  13. Formela, K.; Zedler, L.; Hejna, A.; Tercjak, A. Reactive extrusion of bio-based polymer blends and composites—Current trends and future developments. Express Polym. Lett. 2018, 12, 24–57. [Google Scholar] [CrossRef]
  14. Fu, S.Y.; Feng, X.Q.; Lauke, B.; Mai, Y.W. Effects of particle size, particle/matrix interface adhesion and particle loading on mechanical properties of particulate–polymer composites. Compos. Part B Eng. 2008, 39, 933–961. [Google Scholar] [CrossRef]
  15. Kargarzadeh, H.; Huang, J.; Lin, N.; Ahmad, I.; Mariano, M.; Dufresne, A.; Thomas, S.; Gałęski, A. Recent developments in nanocellulose-based biodegradable polymers, thermoplastic polymers, and porous nanocomposites. Prog. Polym. Sci. 2018, 87, 197–227. [Google Scholar] [CrossRef]
  16. Hejna, A.; Formela, K. Sposób Suszenia i Rozdrabniania Młóta Browarnianego. Polish Patent Application P.430449, 30 June 2019. [Google Scholar]
  17. Formela, K.; Hejna, A.; Zedler, Ł.; Przybysz, M.; Ryl, J.; Saeb, M.R.; Piszczyk, Ł. Structural, thermal and physico-mechanical properties of polyurethane/brewers’ spent grain composite foams modified with ground tire rubber. Ind. Crop. Prod. 2017, 108, 844–852. [Google Scholar] [CrossRef]
  18. Hejna, A.; Haponiuk, J.; Piszczyk, Ł.; Klein, M.; Formela, K. Performance properties of rigid polyurethane-polyisocyanurate/brewers’ spent grain foamed composites as function of isocyanate index. e-Polymers 2017, 17, 427–437. [Google Scholar] [CrossRef]
  19. Zedler, Ł.; Colom, X.; Cañavate, J.; Saeb, M.R.; Haponiuk, J.T.; Formela, K. Investigating the Impact of Curing System on Structure-Property Relationship of Natural Rubber Modified with Brewery By-Product and Ground Tire Rubber. Polymers 2020, 12, 545. [Google Scholar] [CrossRef] [PubMed] [Green Version]
  20. Zedler, Ł.; Colom, X.; Saeb, M.R.; Formela, K. Preparation and characterization of natural rubber composites highly filled with brewers’ spent grain/ground tire rubber hybrid reinforcement. Compos. Part B Eng. 2018, 145, 182–188. [Google Scholar] [CrossRef]
  21. Revert, A.; Reig, M.; Seguí, V.J.; Boronat, T.; Fombuena, V.; Balart, R. Upgrading brewer’s spent grain as functional filler in polypropylene matrix. Polym. Compos. 2015, 38, 40–47. [Google Scholar] [CrossRef]
  22. Cunha, M.; Berthet, M.A.; Pereira, R.; Covas, J.A.; Vicente, A.A.; Hilliou, L. Development of polyhydroxyalkanoate/beer spent grain fibers composites for film blowing applications. Polym. Compos. 2014, 36, 1859–1865. [Google Scholar] [CrossRef]
  23. Berthet, M.A.; Angellier-Coussy, H.; Machado, D.; Hilliou, L.; Staebler, A.; Vicente, A.; Gontard, N. Exploring the potentialities of using lignocellulosic fibres derived from three food by-products as constituents of biocomposites for food packaging. Ind. Crop. Prod. 2015, 69, 110–122. [Google Scholar] [CrossRef]
  24. Oracz, J.; Zyzelewicz, D. In Vitro Antioxidant Activity and FTIR Characterization of High-Molecular Weight Melanoidin Fractions from Different Types of Cocoa Beans. Antioxidants 2019, 8, 560. [Google Scholar] [CrossRef] [Green Version]
  25. Ji, Y.; Yang, X.; Ji, Z.; Zhu, L.; Ma, N.; Chen, D.; Jia, X.; Tang, J.; Cao, Y. DFT-Calculated IR Spectrum Amide I, II, and III Band Contributions of N-Methylacetamide Fine Components. ACS Omega 2020, 5, 8572–8578. [Google Scholar] [CrossRef] [Green Version]
  26. Huang, A.; Jiang, Y.; Napiwocki, B.; Mi, H.; Peng, X.; Turng, L.S. Fabrication of poly(ε-caprolactone) tissue engineering scaffolds with fibrillated and interconnected pores utilizing microcellular injection molding and polymer leaching. RSC Adv. 2017, 7, 43432–43444. [Google Scholar] [CrossRef] [Green Version]
  27. Barth, A. Infrared spectroscopy of proteins. BBA Bioenergetics 2007, 1767, 1073–1101. [Google Scholar] [CrossRef] [Green Version]
  28. Hejna, A.; Sulyman, M.; Przybysz, M.; Saeb, M.R.; Klein, M.; Formela, K. On the correlation of lignocellulosic filler composition with the performance properties of poly(ε-caprolactone) based biocomposites. Waste Biomass Valori. 2020, 11, 1467–1479. [Google Scholar] [CrossRef] [Green Version]
  29. Hong, J.I.; Schadler, L.S.; Siegel, R.W.; Mårtensson, E. Rescaled electrical properties of ZnO/low density polyethylene nanocomposites. Appl. Phys. Lett. 2003, 82, 1956–1958. [Google Scholar] [CrossRef]
  30. Bindu, P.; Thomas, S. Viscoelastic Behavior and Reinforcement Mechanism in Rubber Nanocomposites in the Vicinity of Spherical Nanoparticles. J. Phys. Chem. B 2013, 117, 12632–12648. [Google Scholar] [CrossRef]
  31. Nelson, J.K.; Hu, Y. The Impact of Nanocomposite Formulations on Electrical Voltage Endurance. In Proceedings of the 2004 IEEE International Conference of Solid Dielectrics, ICSD 2004, Toulouse, France, 5–9 July 2004; pp. 832–835. [Google Scholar] [CrossRef]
  32. Siqueira, D.D.; Luna, C.B.B.; Ferreira, E.S.B.; Araújo, E.M.; Wellen, R.M.R. Tailored PCL/Macaíba fiber to reach sustainable biocomposites. J. Mater. Res. Technol. 2020, 9, 9691–9708. [Google Scholar] [CrossRef]
  33. Waters, D.M.; Jacob, F.; Titze, J.; Arendt, E.K.; Zannini, E. Fibre, protein and mineral fortification of wheat bread through milled and fermented brewer’s spent grain enrichment. Eur. Food Res. Technol. 2012, 235, 767–778. [Google Scholar] [CrossRef]
  34. Maillard, L.C. Action des acides amines sur les sucres; formation de melanoidines par voie méthodique. Compt. Rend. 1912, 154, 66–68. [Google Scholar]
  35. Martins, S.I.F.; Jongen, W.M.; van Boekel, M.A.J. A review of Maillard reaction in food and implications to kinetic modelling. Trends Food Sci. Tech. 2000, 11, 364–373. [Google Scholar] [CrossRef]
  36. Villamiel, M.; del Castillo, M.D.; Corzo, N. Browning Reactions. In Food Biochemistry and Food Processing; Hui, Y.H., Nip, W.K., Nollet, L.M.L., Paliyath, G., Simpson, B.K., Eds.; Wiley-Blackwell: New York, NY, USA, 2006; pp. 71–100. [Google Scholar] [CrossRef]
  37. Aguiar, C.; Rocha, A.L.B.; Jambassi, J.R.; Baptista, A.S.; Lima, R.B. Factors Affecting Color Formation During Storage of White Crystal Sugar. Focus. Modern Food Ind. 2015, 4, 1–10. [Google Scholar] [CrossRef]
  38. Wang, Z.H.; Liu, J.; Wu, S.Z.; Wang, W.C.; Zhang, L.Q. Novel percolation phenomena and mechanism of strengthening elastomers by nanofillers. Phys. Chem. Chem. Phys. 2010, 12, 3014–3030. [Google Scholar] [CrossRef] [PubMed]
  39. Svärd, A.; Brännvall, E.; Edlund, U. Modified and thermoplastic rapeseed straw xylan: A renewable additive in PCL biocomposites. Ind. Crop Prod. 2018, 119, 73–82. [Google Scholar] [CrossRef]
  40. Einstein, A. Ueber die von der molekularkinetischen fluessigkeiten suspendierten teilchen. Ann. Phys. (Leipzig) 1905, 17, 549–560. [Google Scholar] [CrossRef] [Green Version]
  41. Kerner, E.H. The Elastic and Thermoelastic Properties of Composite Media. Proc. Phys. Soc. B 1956, 69, 808–813. [Google Scholar] [CrossRef]
  42. Lu, L.; Zhang, Q.; Wootton, D.M.; Chiou, R.; Li, D.; Lu, B.; Lelkes, P.I.; Zhou, J. Mechanical study of polycaprolactone-hydroxyapatite porous scaffolds created by porogen-based solid freeform fabrication method. J. Appl. Biomater. Func. 2014, 12, 145–154. [Google Scholar] [CrossRef]
  43. Guth, E. Theory of filler reinforcement. J. Appl. Phys. 1945, 16, 20–25. [Google Scholar] [CrossRef]
  44. Chua, P.S. Dynamic mechanical analysis studies of the interphase. Polym. Compos. 1987, 8, 308–313. [Google Scholar] [CrossRef]
  45. Brostow, W.; Hagg Lobland, H.E.; Narkis, M. Sliding wear, viscoelasticity, and brittleness of polymers. J. Mater. Res. 2006, 21, 2422–2428. [Google Scholar] [CrossRef] [Green Version]
  46. Brostow, W.; Hagg Lobland, H.E.; Khoja, S. Brittleness and toughness of polymers and other materials. Mater. Lett. 2015, 159, 478–480. [Google Scholar] [CrossRef]
  47. Galeja, M.; Hejna, A.; Kosmela, P.; Kulawik, A. Static and Dynamic Mechanical Properties of 3D Printed ABS as a Function of Raster Angle. Materials 2020, 13, 297. [Google Scholar] [CrossRef] [Green Version]
  48. Hejna, A.; Zedler, Ł.; Przybysz-Romatowska, M.; Cañavate, J.; Colom, X.; Formela, K. Reclaimed Rubber/Poly(ε-caprolactone) Blends: Structure, Mechanical, and Thermal Properties. Polymers 2020, 12, 1204. [Google Scholar] [CrossRef]
  49. Cowie, J.M.G. Polymers: Chemistry and Physics of Modern Materials, 2nd ed.; Nelson Thornes Ltd.: Cheltenham, UK, 2000; pp. 375–390. [Google Scholar]
  50. Abdalla, M.; Dean, D.; Adibempe, D.; Nyairo, E.; Robinson, P.; Thompson, G. The effect of interfacial chemistry on molecular mobility and morphology of multiwalled carbon nanotubes epoxy nanocomposite. Polymer 2007, 48, 5662–5670. [Google Scholar] [CrossRef]
  51. Kubát, J.; Rigdahl, M.; Welander, M. Characterization of interfacial interactions in high density polyethylene filled with glass spheres using dynamic-mechanical analysis. J. Appl. Polym. Sci. 1990, 39, 1527–1539. [Google Scholar] [CrossRef]
Figure 1. General scheme of the Maillard reactions leading to the generation of melanoidins.
Jcs 04 00167 g001
Figure 2. Macroscopic (a) and microscopic (b) appearance of applied brewers’ spent grain (BSG) before extrusion grinding.
Jcs 04 00167 g002
Figure 3. Screw configuration applied during thermo-mechanical treatment of BSG.
Jcs 04 00167 g003
Figure 4. Appearance of BSG extruded at (a) 120 °C, (b) 180 °C, and (c) 240 °C.
Jcs 04 00167 g004
Figure 5. Plots showing (a) share of particles with a given diameter, and (b) cumulative particle size distribution of modified BSG.
Jcs 04 00167 g005
Figure 6. FTIR spectra of poly(ε-caprolactone) (PCL) and (a) modified BSG samples, (b) composites filled with varying content of BSG modified at 240 °C, and (c) composites filled with 30 wt% BSG modified at different temperatures.
Jcs 04 00167 g006
Figure 7. Young’s modulus as a function of interface surface area for prepared composites.
Jcs 04 00167 g007
Figure 8. Experimental and predicted values of storage modulus for prepared composites.
Jcs 04 00167 g008
Figure 9. The plot of toughness vs. brittleness for prepared composites and literature data.
Jcs 04 00167 g009
Figure 10. Temperature plot of tan δ for composites filled with BSG modified at 120 °C.
Jcs 04 00167 g010
Figure 11. Constrained chain volume of prepared composites as a function of (a) filler volume fraction, and (b) interface surface area.
Jcs 04 00167 g011
Table 1. Physical and mechanical properties of neat PCL and analyzed PCL/BSG composites.
ParameterPCL120/20120/30120/40180/20180/30180/40240/20240/30240/40
Theoretical density, g/cm31.1511.1891.2081.2291.1891.2091.2291.1901.2101.231
Experimental density, g/cm31.1511.1821.1991.2141.1851.2011.2171.1831.2031.223
Porosity, %0.0000.5420.7821.2070.3640.6340.9790.5740.5450.687
Filler volume fraction, %0.0017.3926.5235.9517.3726.4935.9217.3126.4235.83
Average particle distance, µm-995730734222704021
Interface surface area, nm−1-4.77.19.76.49.713.16.610.113.7
Tensile strength, MPa34.6 ± 1.511.1 ± 0.110.5 ± 0.39.8 ± 0.212.8 ± 0.310.9 ± 0.710.8 ± 0.311.8 ± 0.79.9 ± 0.79.1 ± 0.4
Elongation at break, %1061 ± 8233.2 ± 9.713.5 ± 1.85.9 ± 0.233.5 ± 1.812.9 ± 4.56.1 ± 1.037.2 ± 9.713.2 ± 0.89.0 ± 0.4
Young’s modulus, MPa289 ± 18469 ± 6502 ± 40615 ± 27512 ± 11599 ± 63677 ± 44536 ± 63640 ± 35735 ± 39
Toughness, J/cm325215 ± 3359283 ± 8195 ± 1644 ± 1317 ± 27106 ± 1849 ± 10342 ± 38125 ± 1458 ± 6
Brittleness, 1010 %·Pa0.01800.39320.87411.65620.36780.93091.54040.34350.79071.1125
E’ at 25 °C, MPa523.7766.2847.01021.1812.2835.41058.2782.8958.11002.1
E’ at −90 °C, MPa3372.63917.83846.44468.23990.03915.84522.03843.14110.04060.8
C factor1.000.790.710.680.760.730.660.760.670.63
E’ rule of mixture, MPa-614.8662.6712.0614.6662.4711.8614.4662.0711.3
E’ Einstein model, MPa-751.4870.9994.4751.1870.5993.9750.4869.5992.8
E’ Kerner model, MPa-781.4965.51211.0781.0964.81209.9780.1963.21207.4
E’ Guth model, MPa-860.81216.51713.5860.11215.11711.3858.41211.81706.3
tan δ at 25 °C0.03600.04940.05510.05960.04660.04900.05220.04140.04550.0481
tan δ at Tg0.10270.09320.09040.08850.09210.09020.08630.09060.08720.0838
Tg, °C−41.42−41.12−40.41−40.02−41.31−40.15−39.24−41.41−41.38−40.52
Area under tan δ peak, °C6.1366.3186.7427.5156.3966.9927.5736.2706.7027.547
Adhesion factor-0.6581.0791.5820.5650.8491.2580.3900.7161.081
Constrained chain volume, %0.007.179.3310.838.019.4712.559.1911.8714.58
Publisher’s Note: MDPI stays neutral with regard to jurisdictional claims in published maps and institutional affiliations.