Study on Toughness Improvement of a Rosin-Sourced Epoxy Matrix Composite for Green Aerospace Application †

 ,
,
Abstract
:1. Introduction
2. Experimental
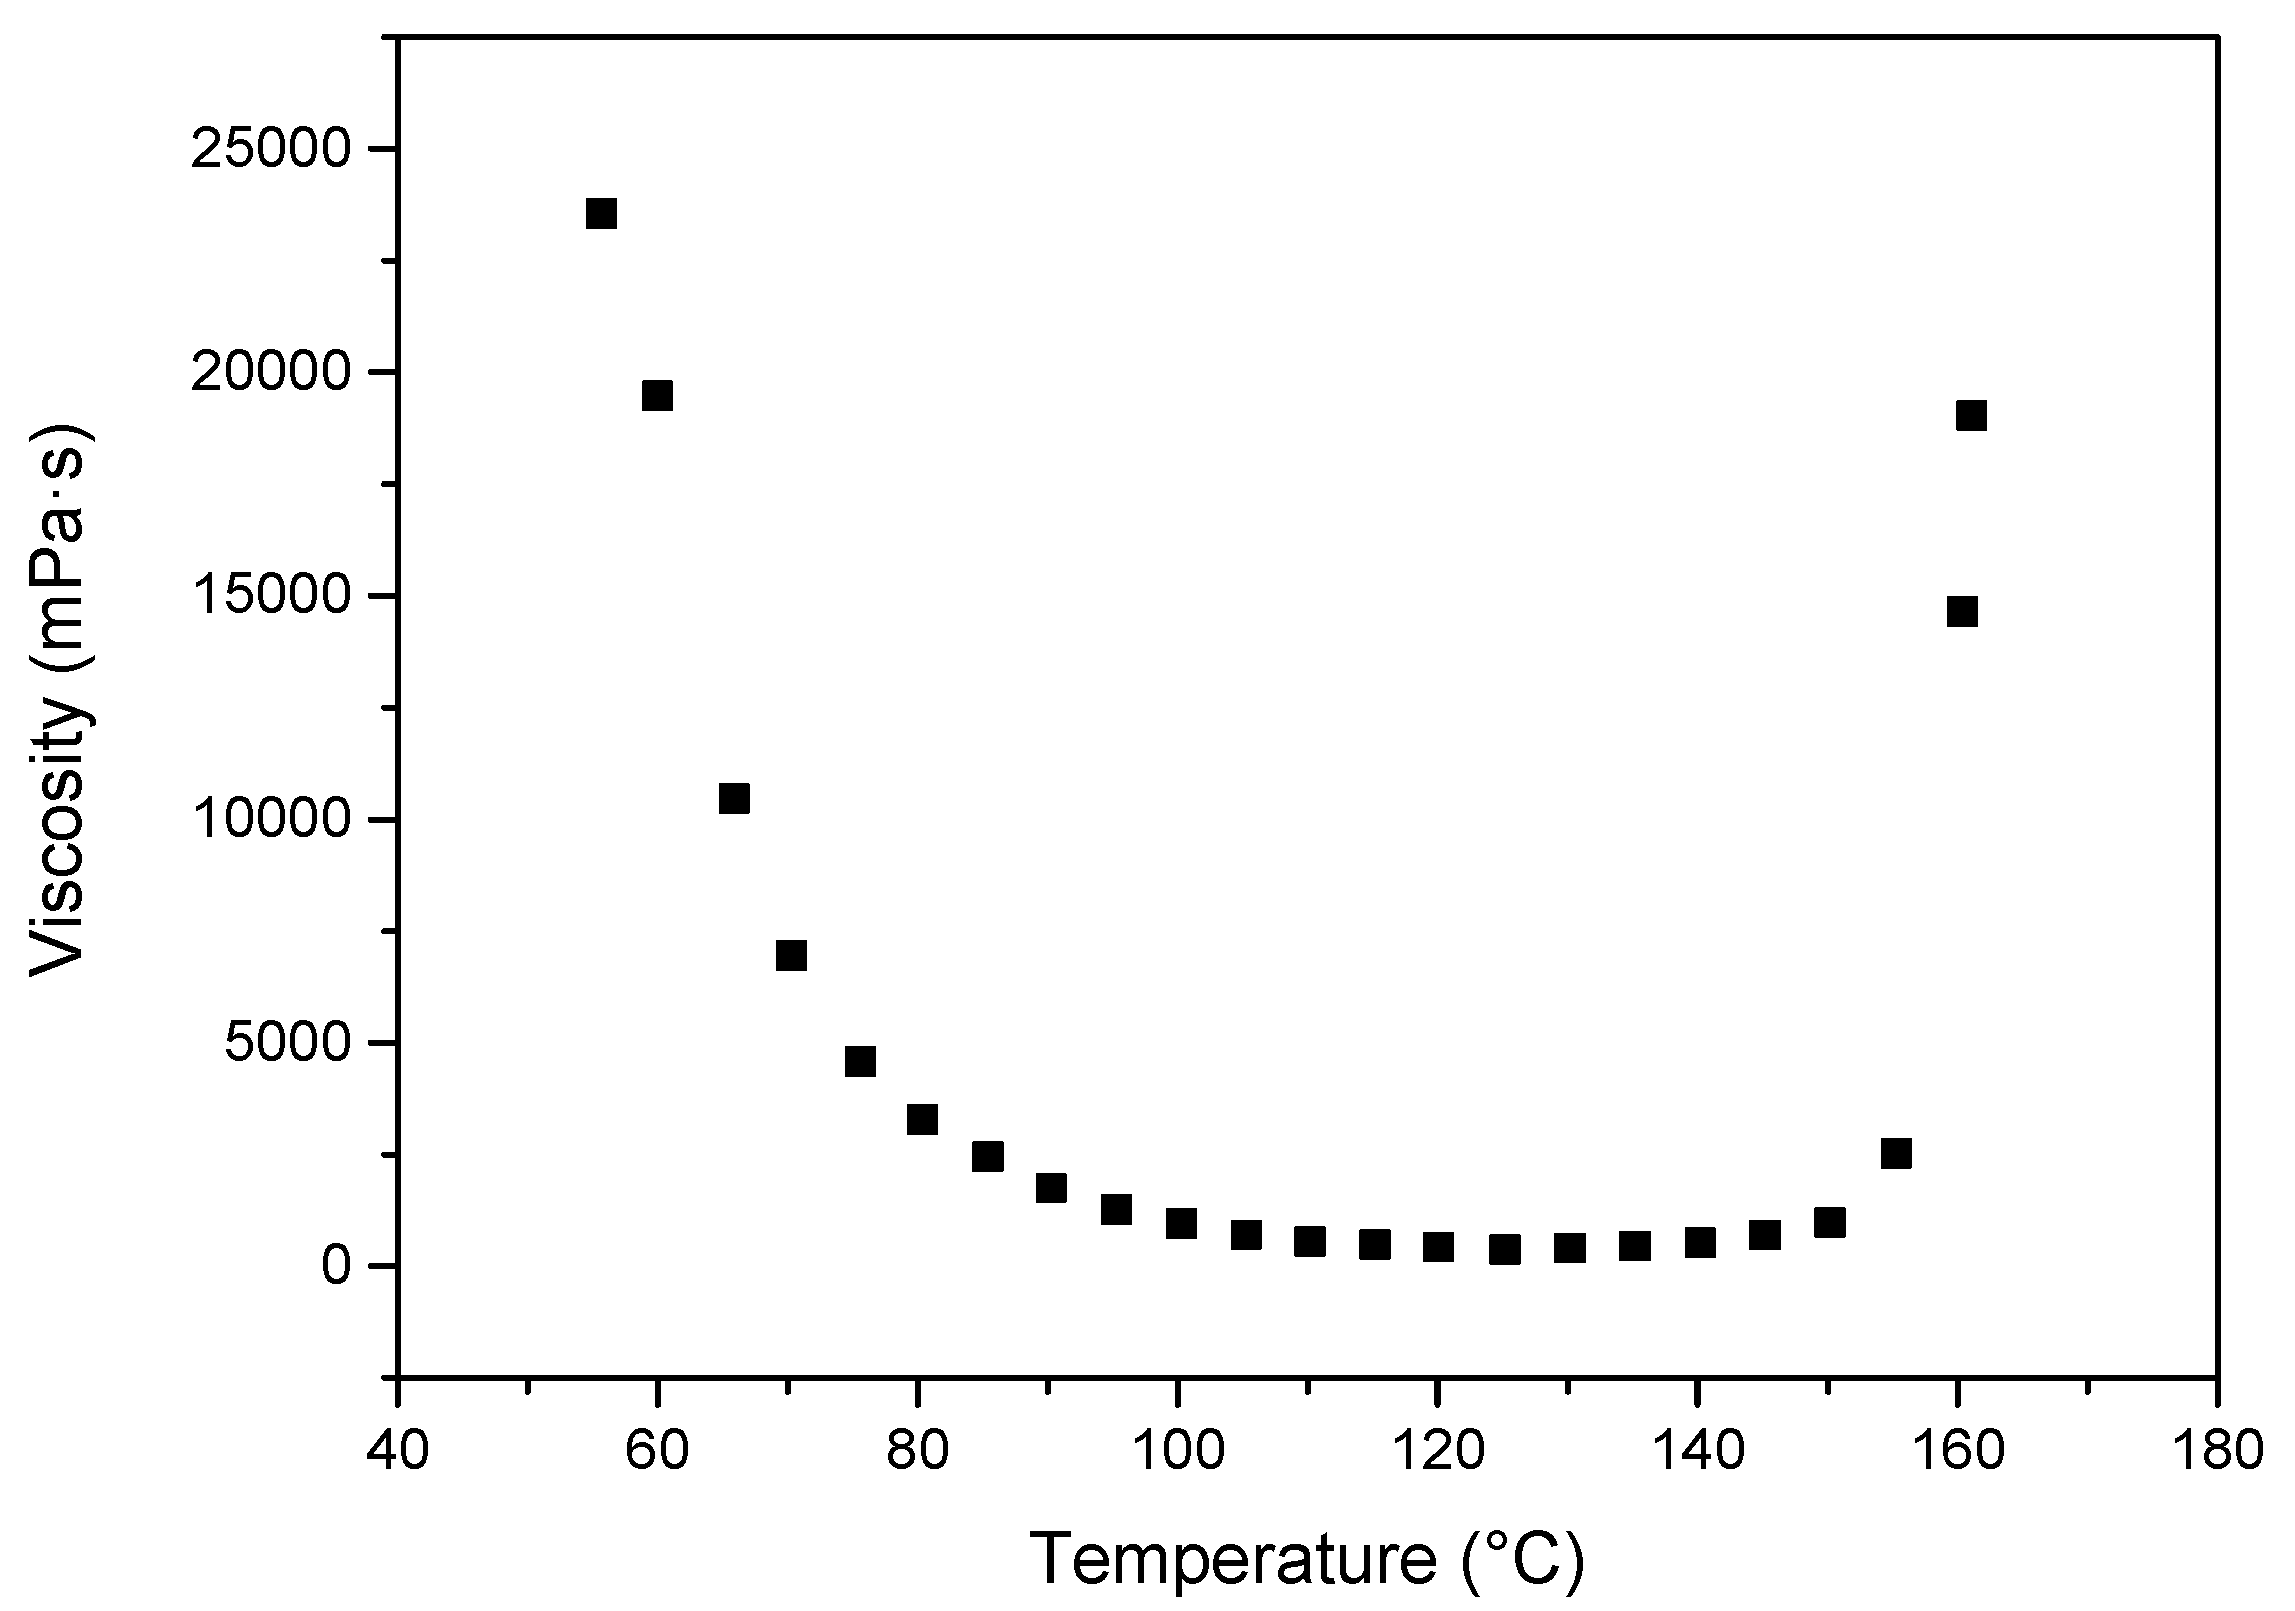
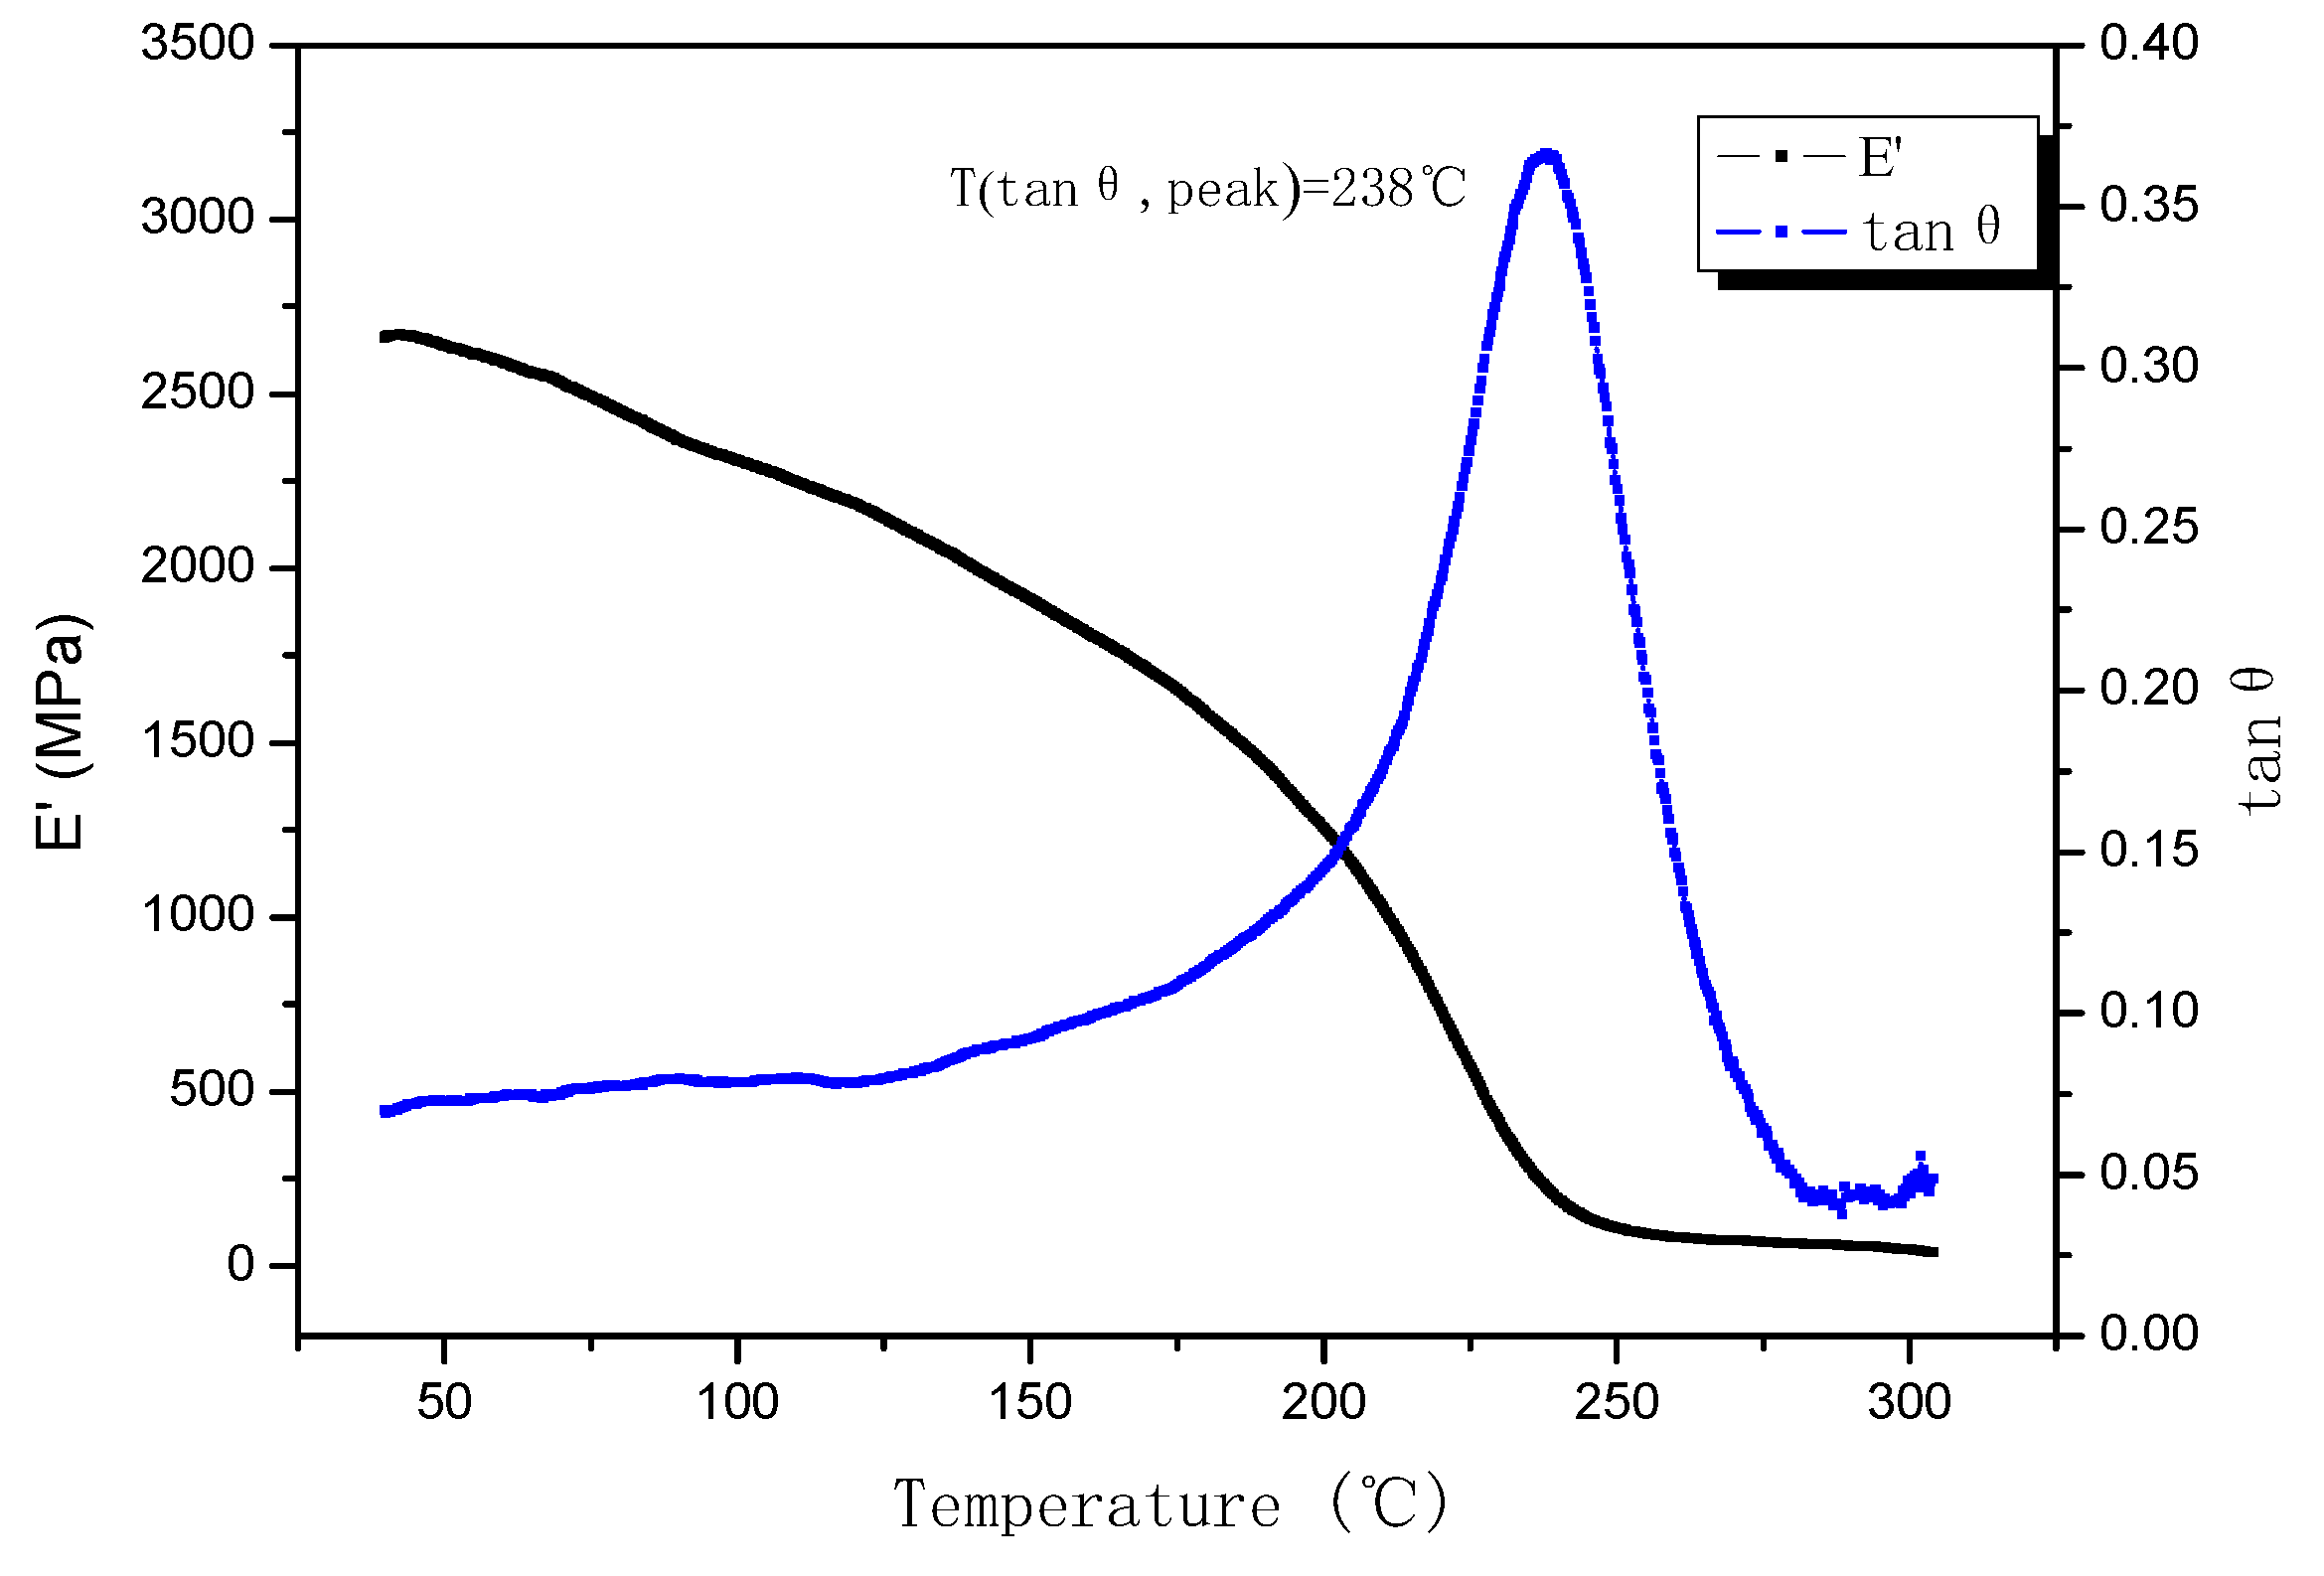
2.1. Materials
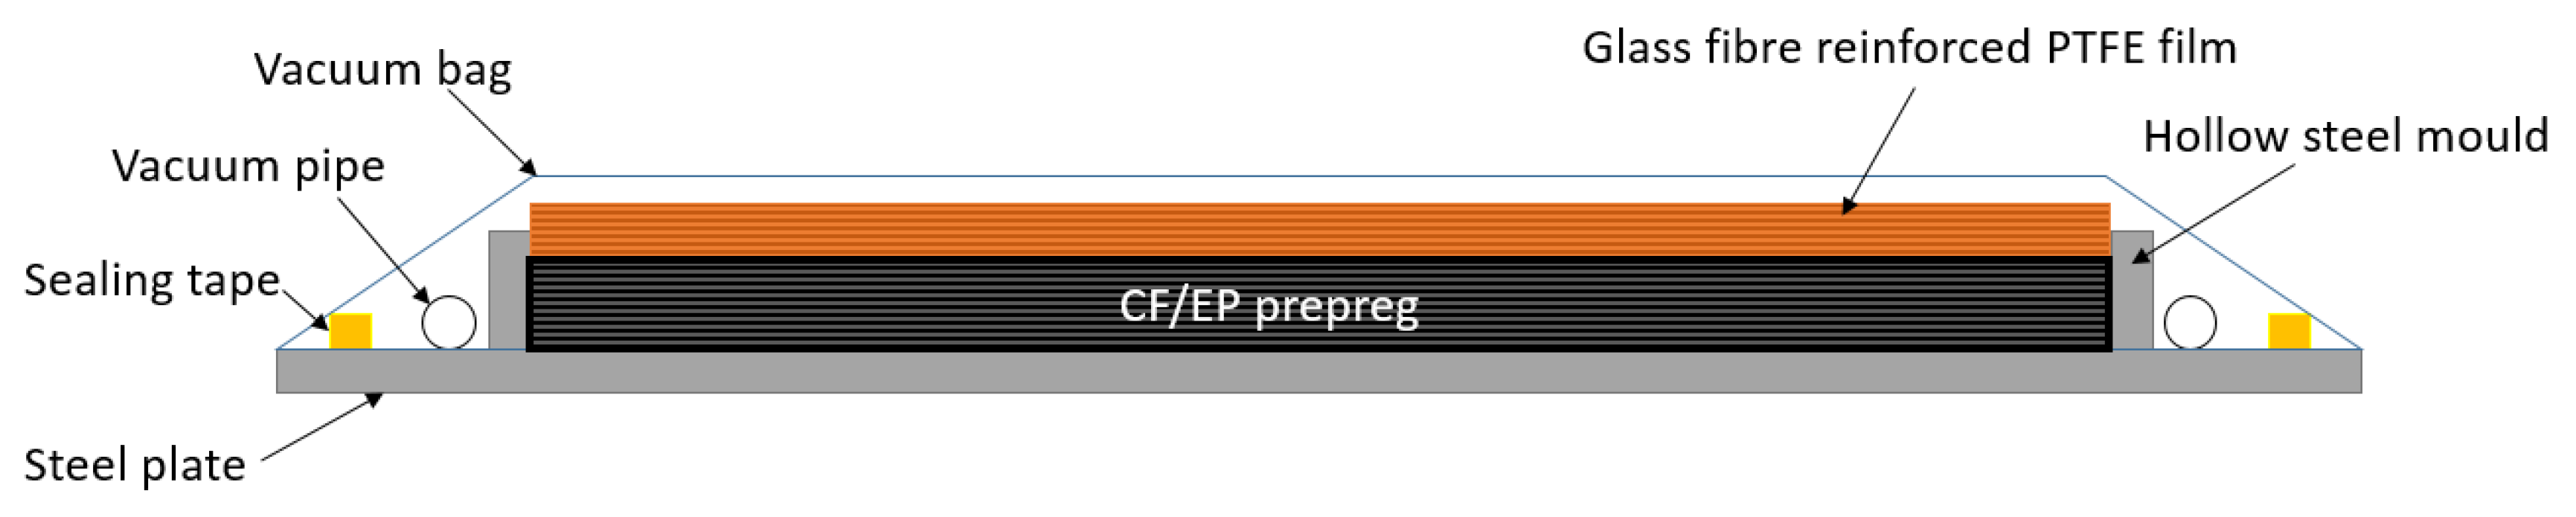
2.2. Fabrication of Composite Laminates
2.3. Preparation of Test Specimens
2.4. Determination of Interlaminar Fracture Toughness
2.5. Drop-Weight Impact and Compression after Impact Test
2.6. Mechanical Tests
2.7. Scanning Electron Microscopy
3. Results and Discussion
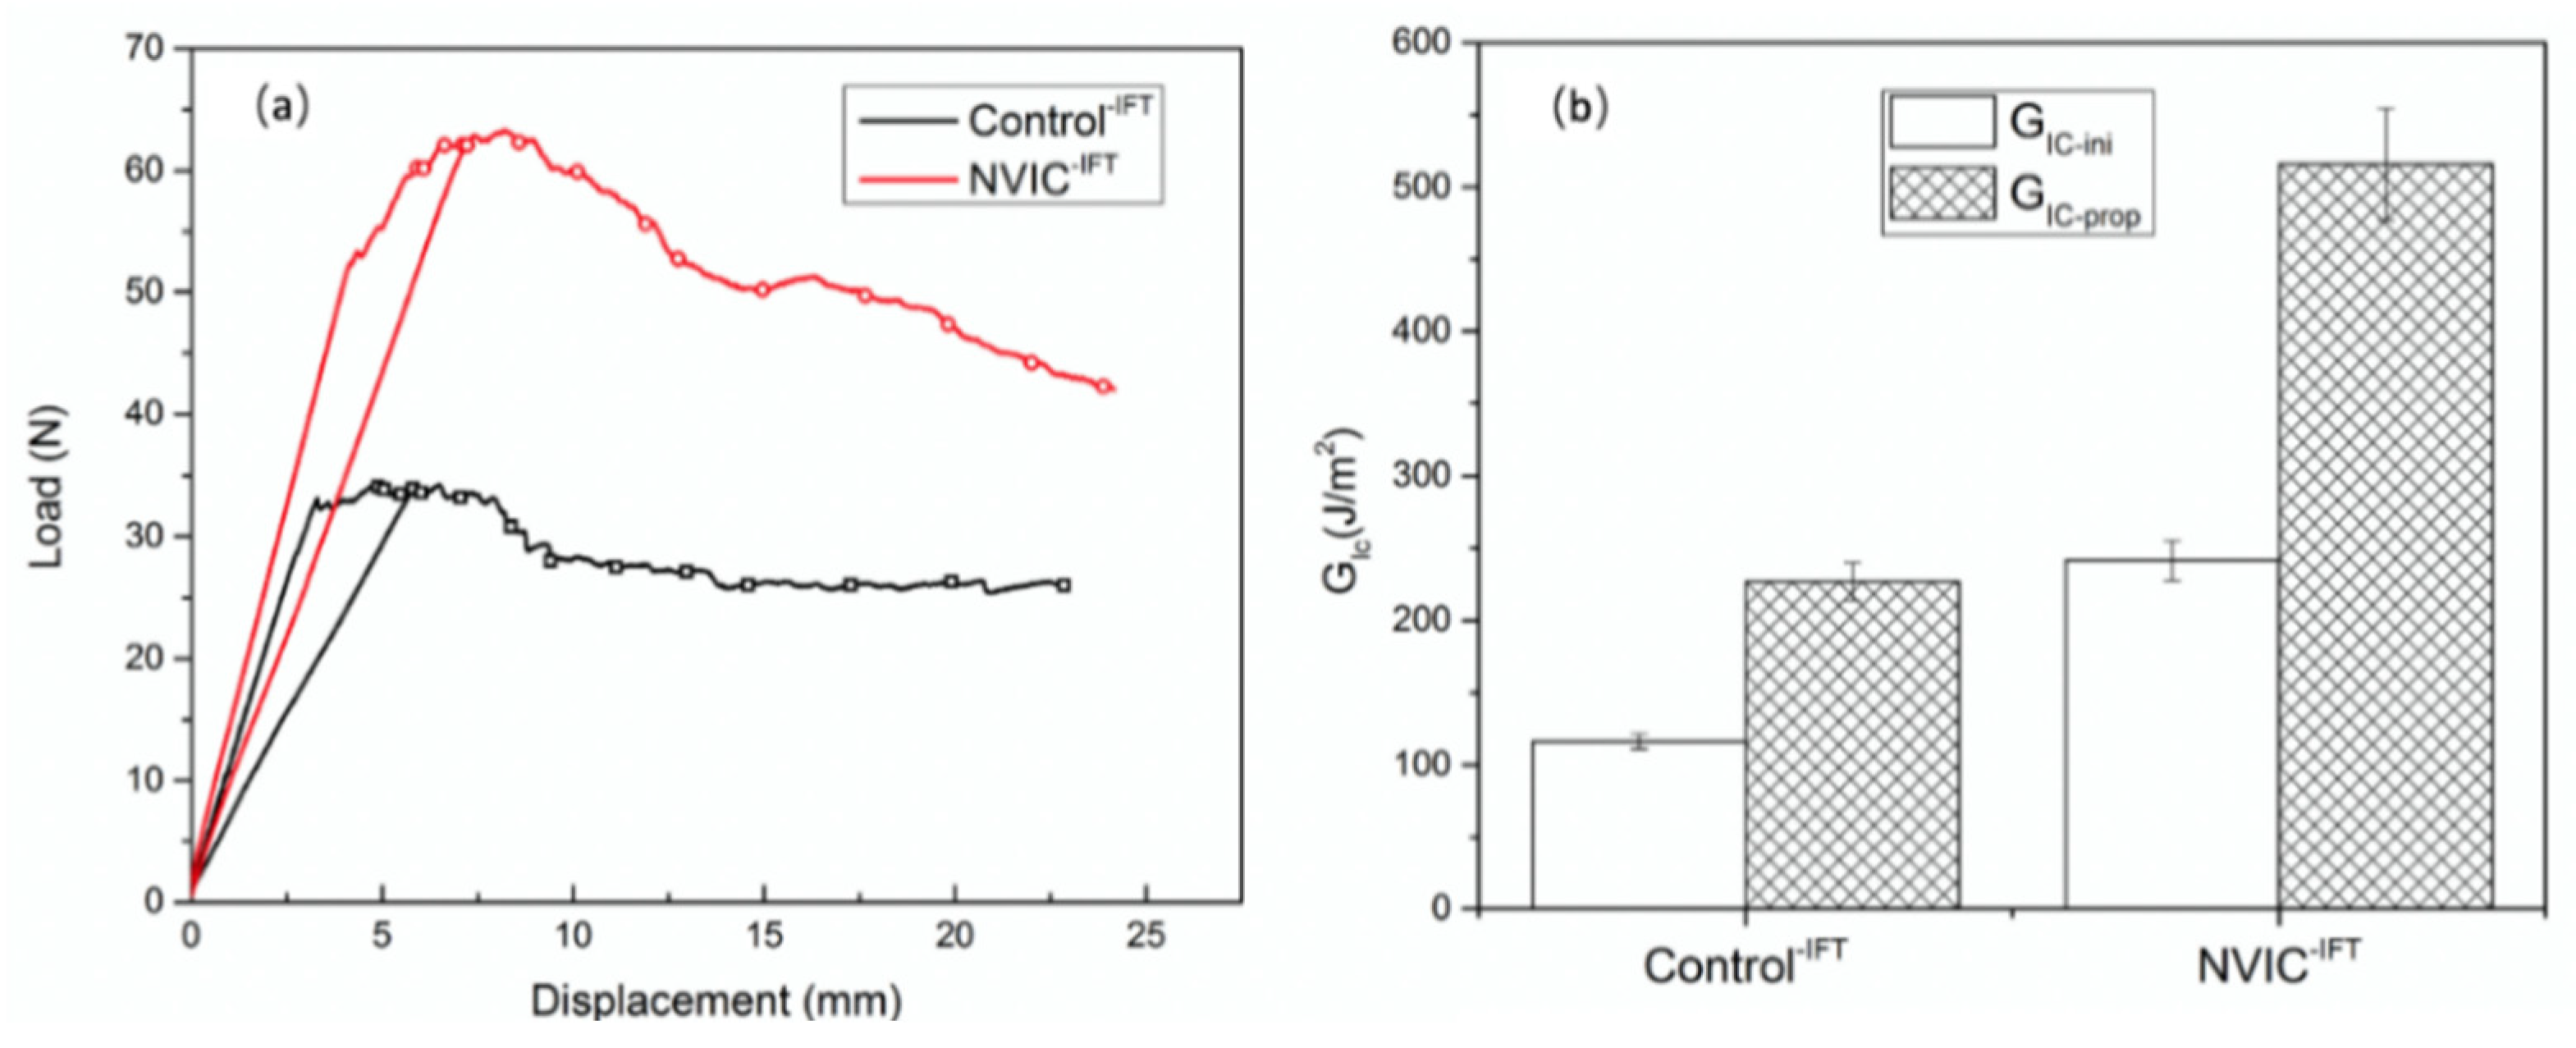
3.1. Interlaminar Fracture Toughness
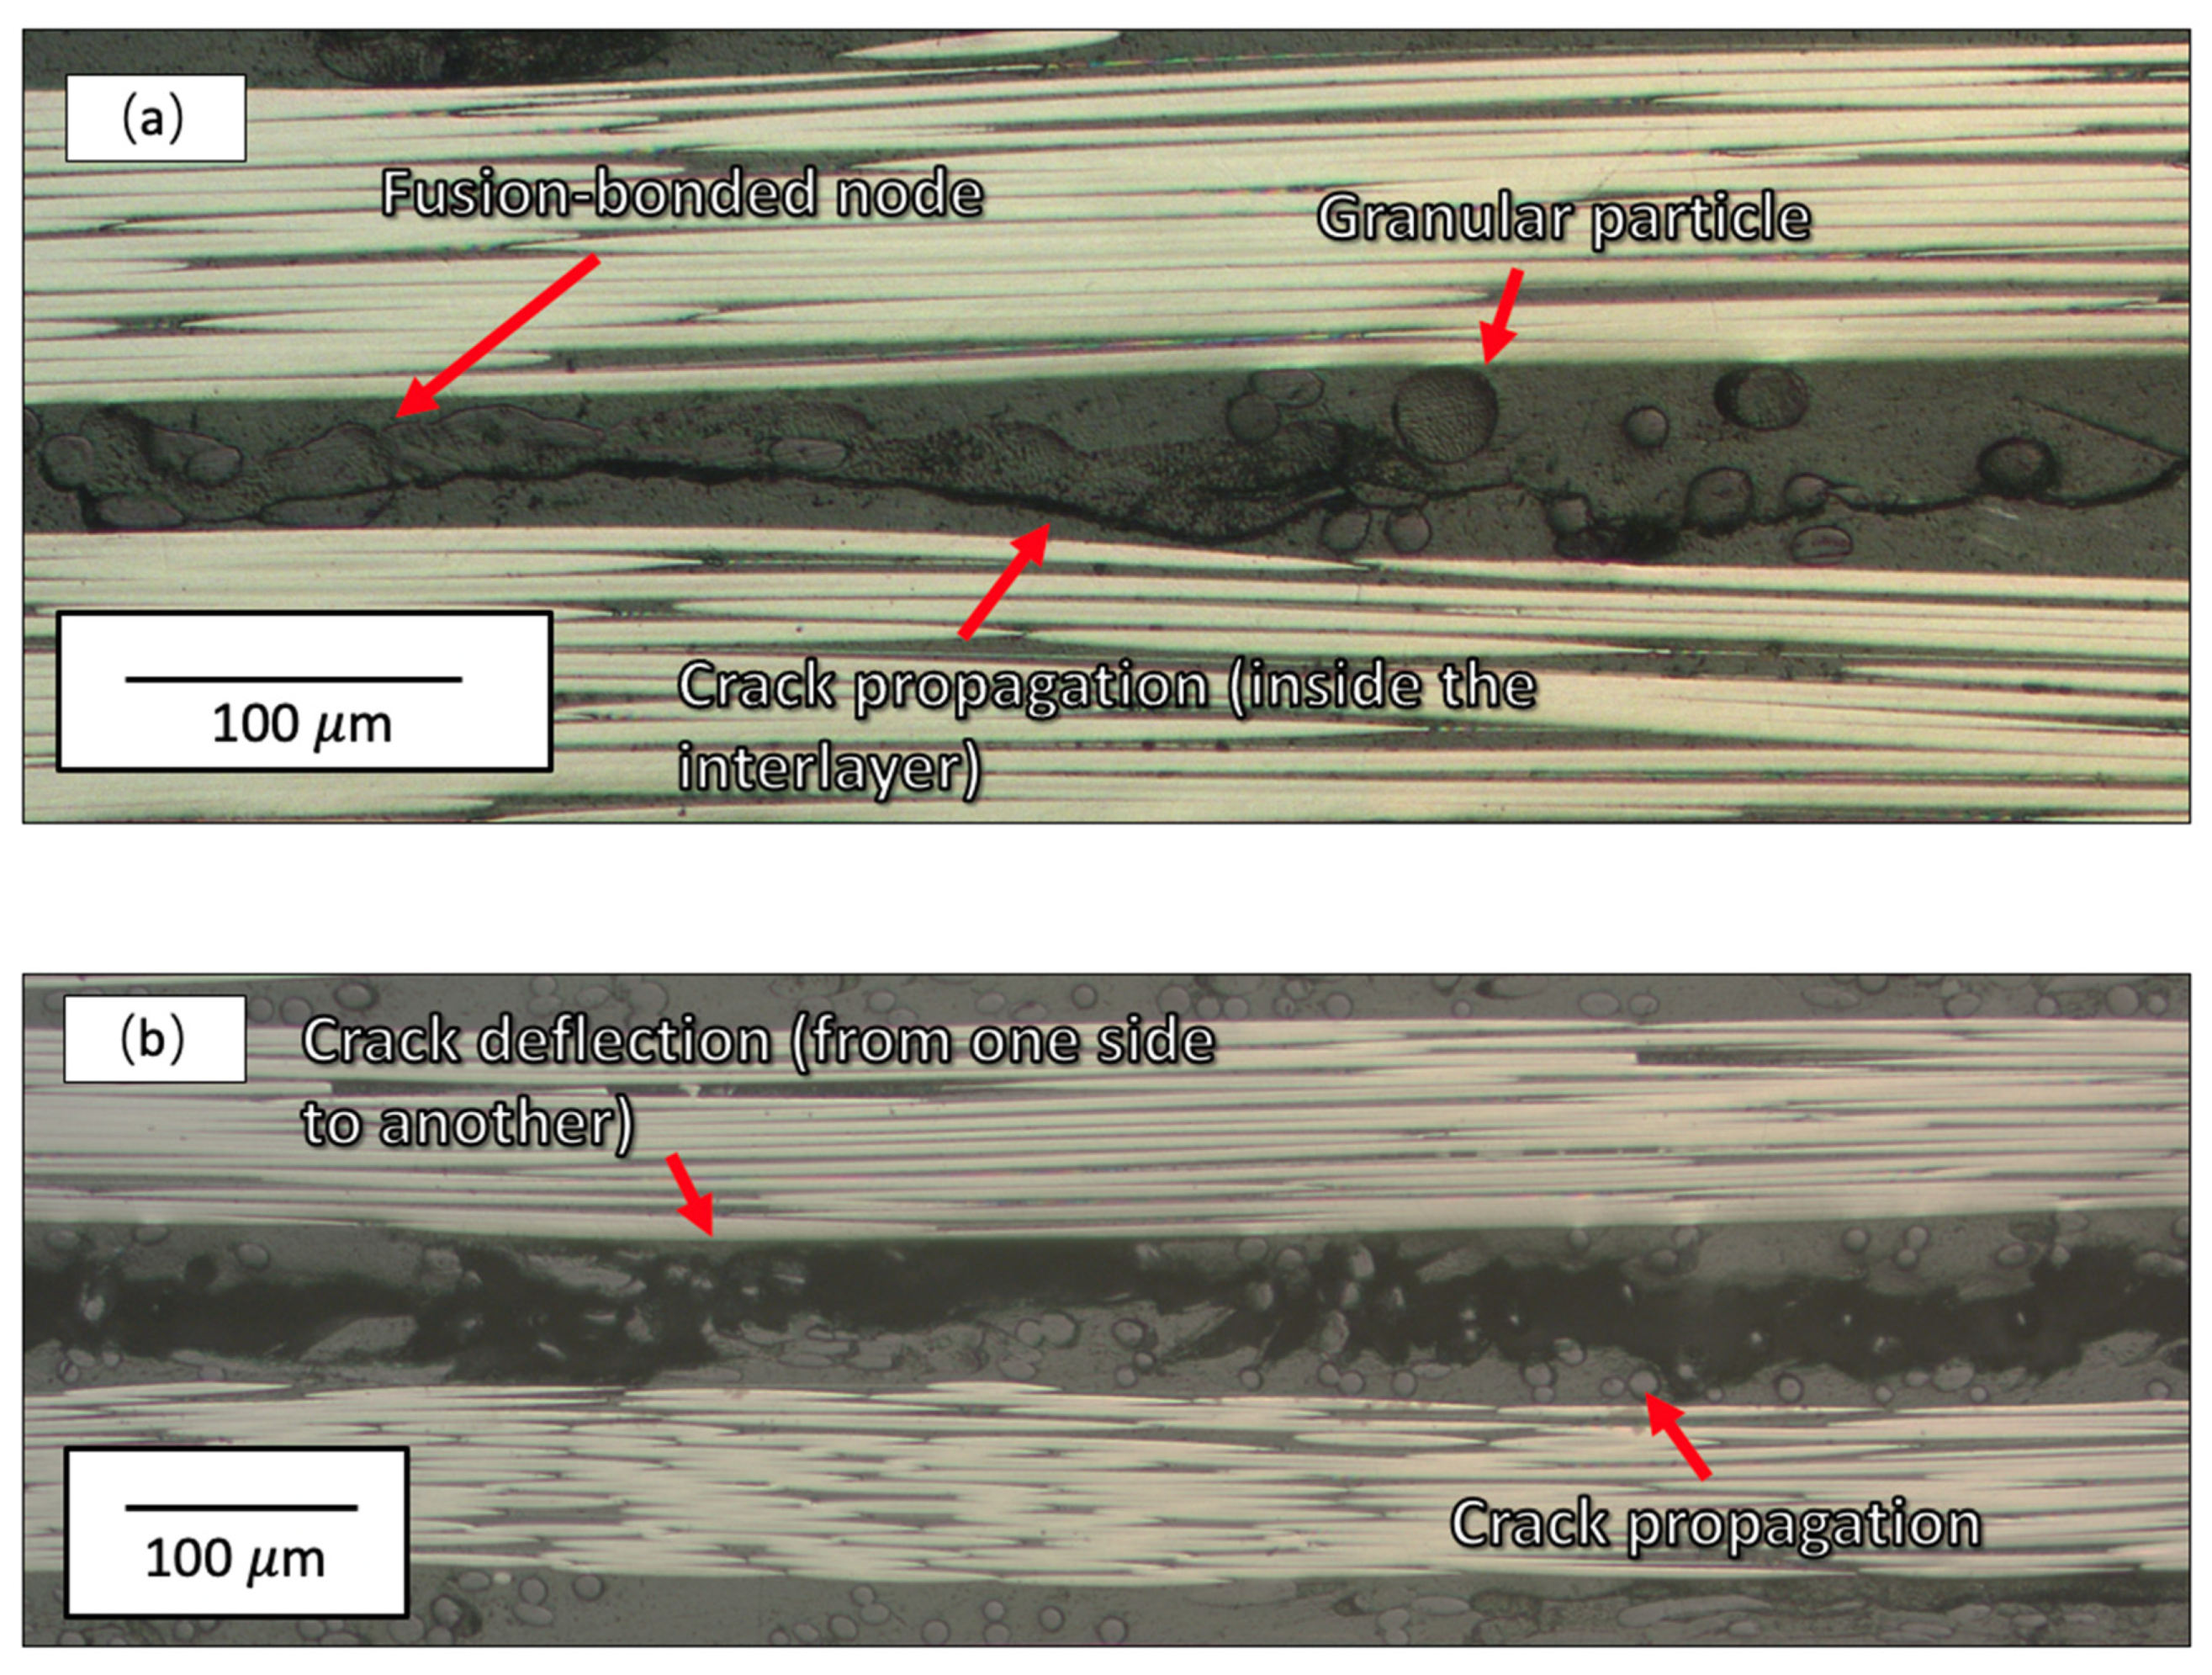
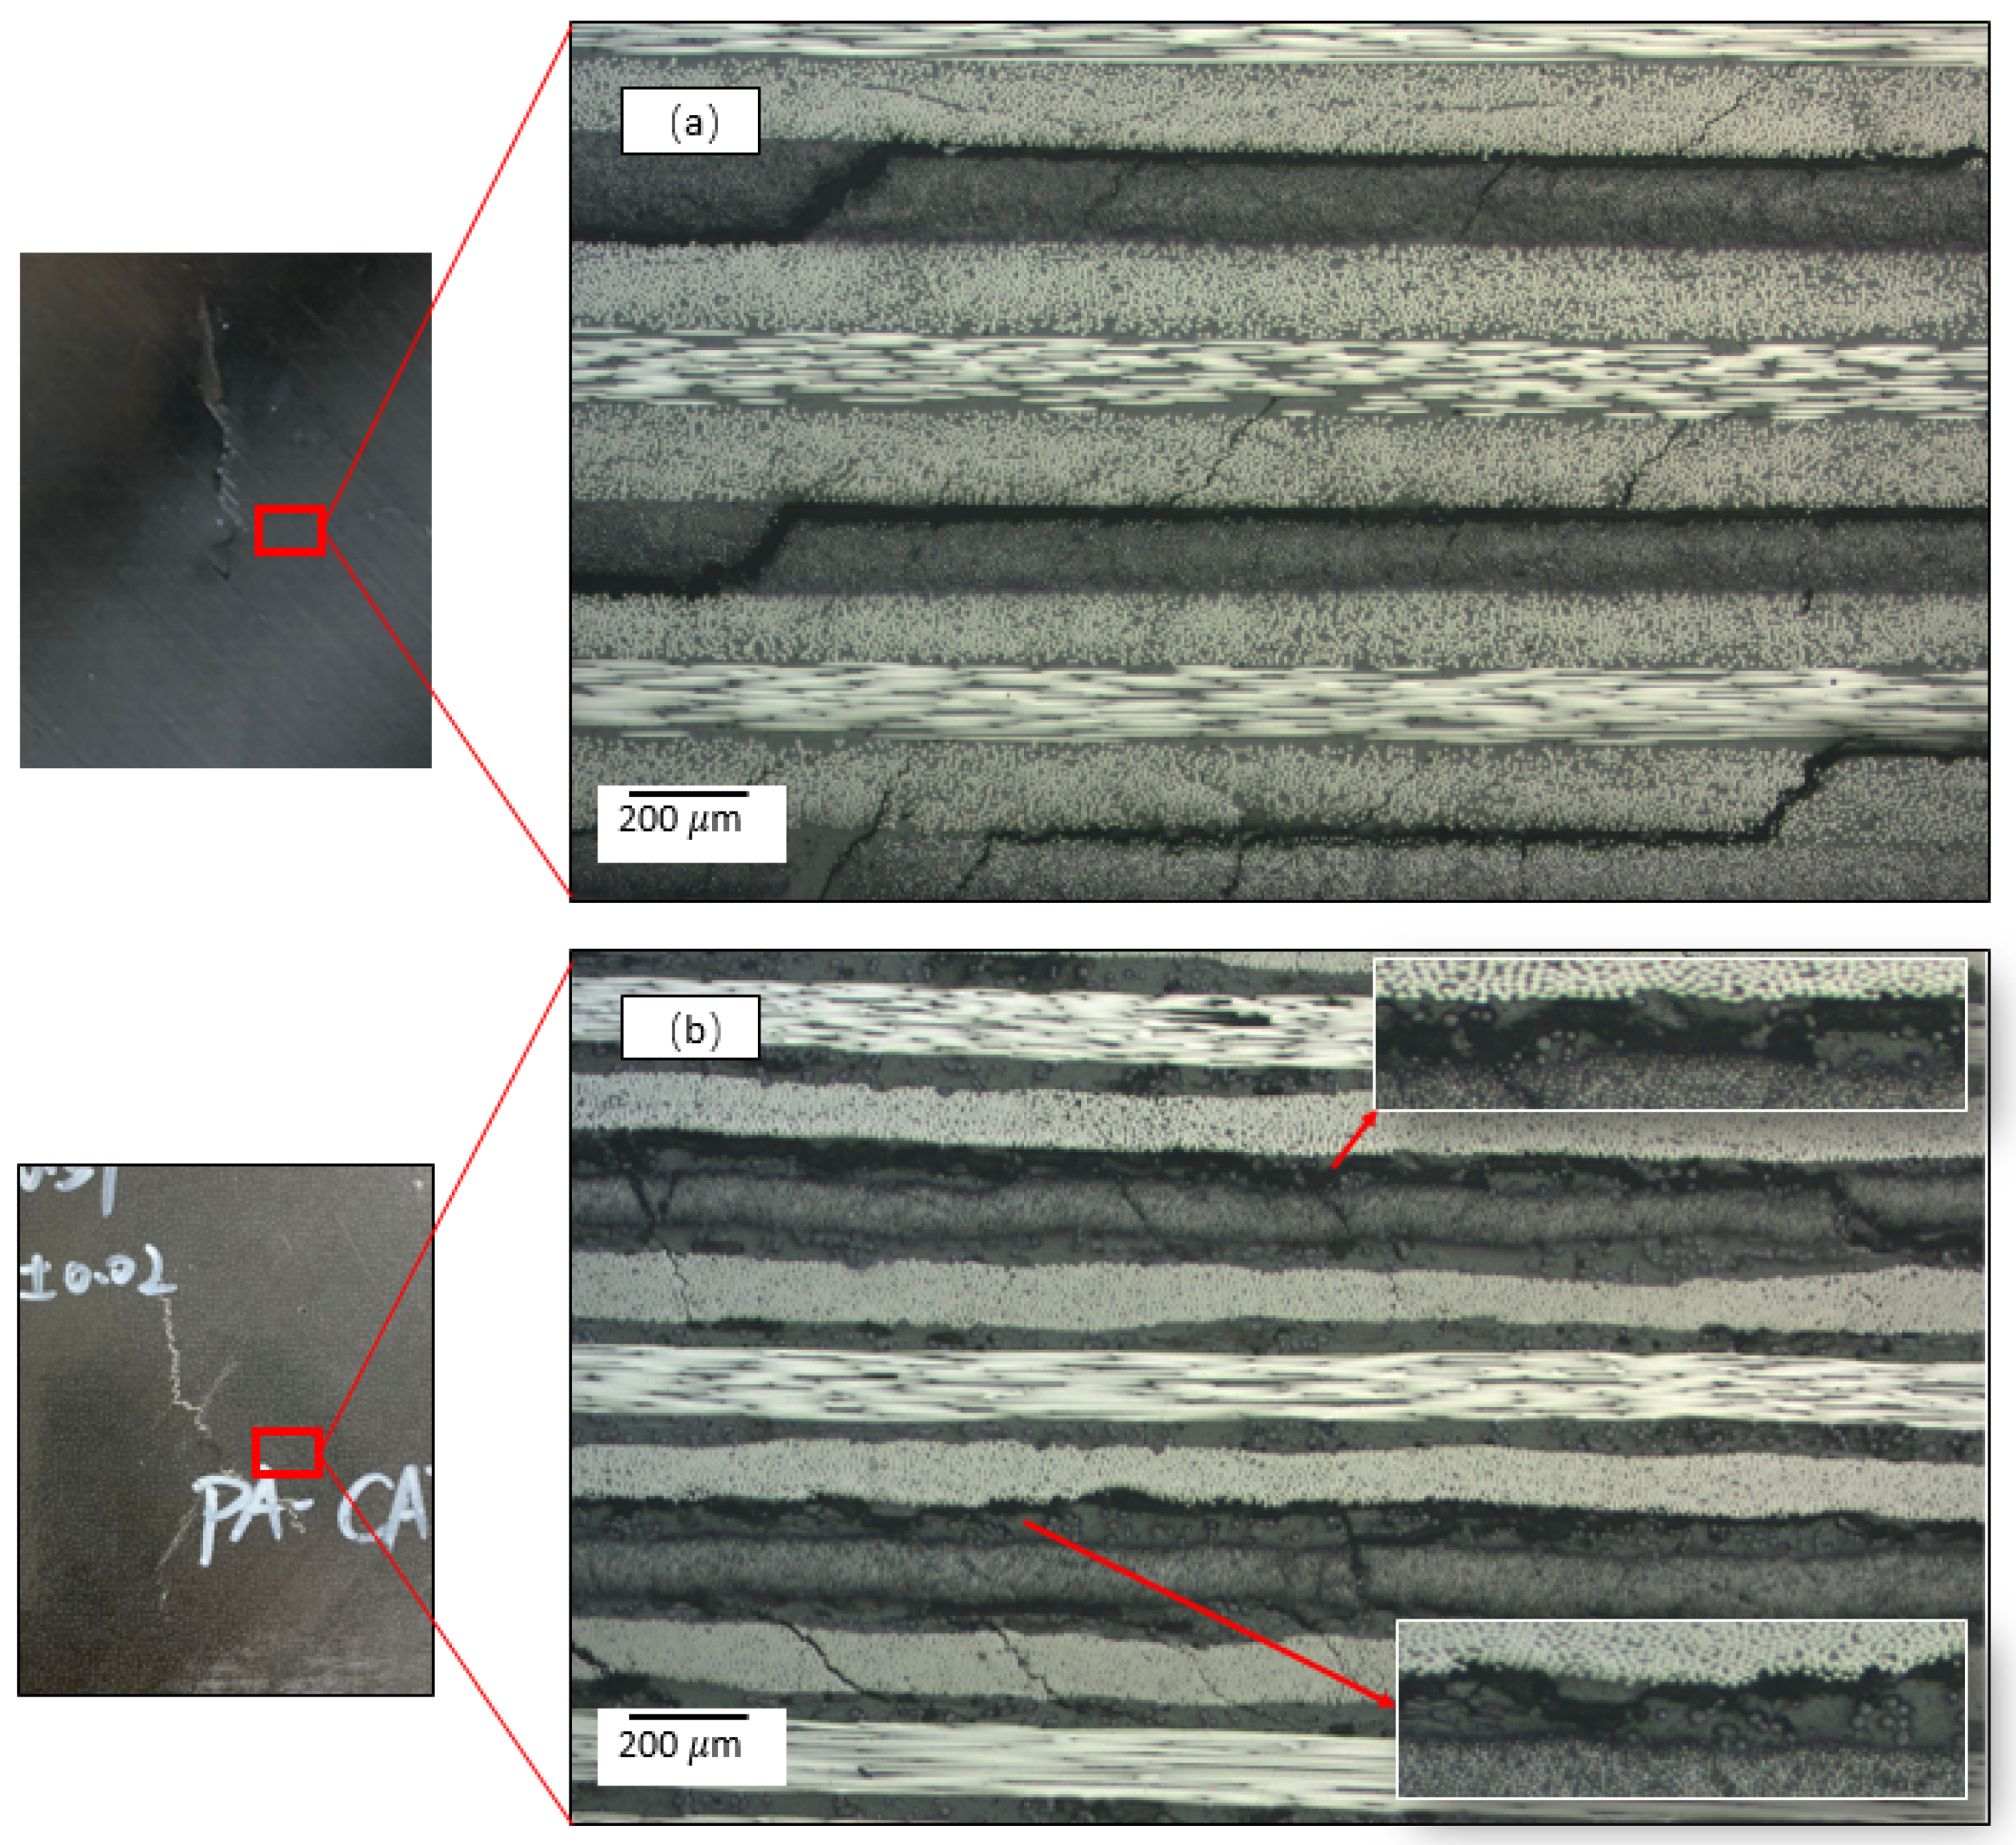
3.2. Toughening Mechanisms
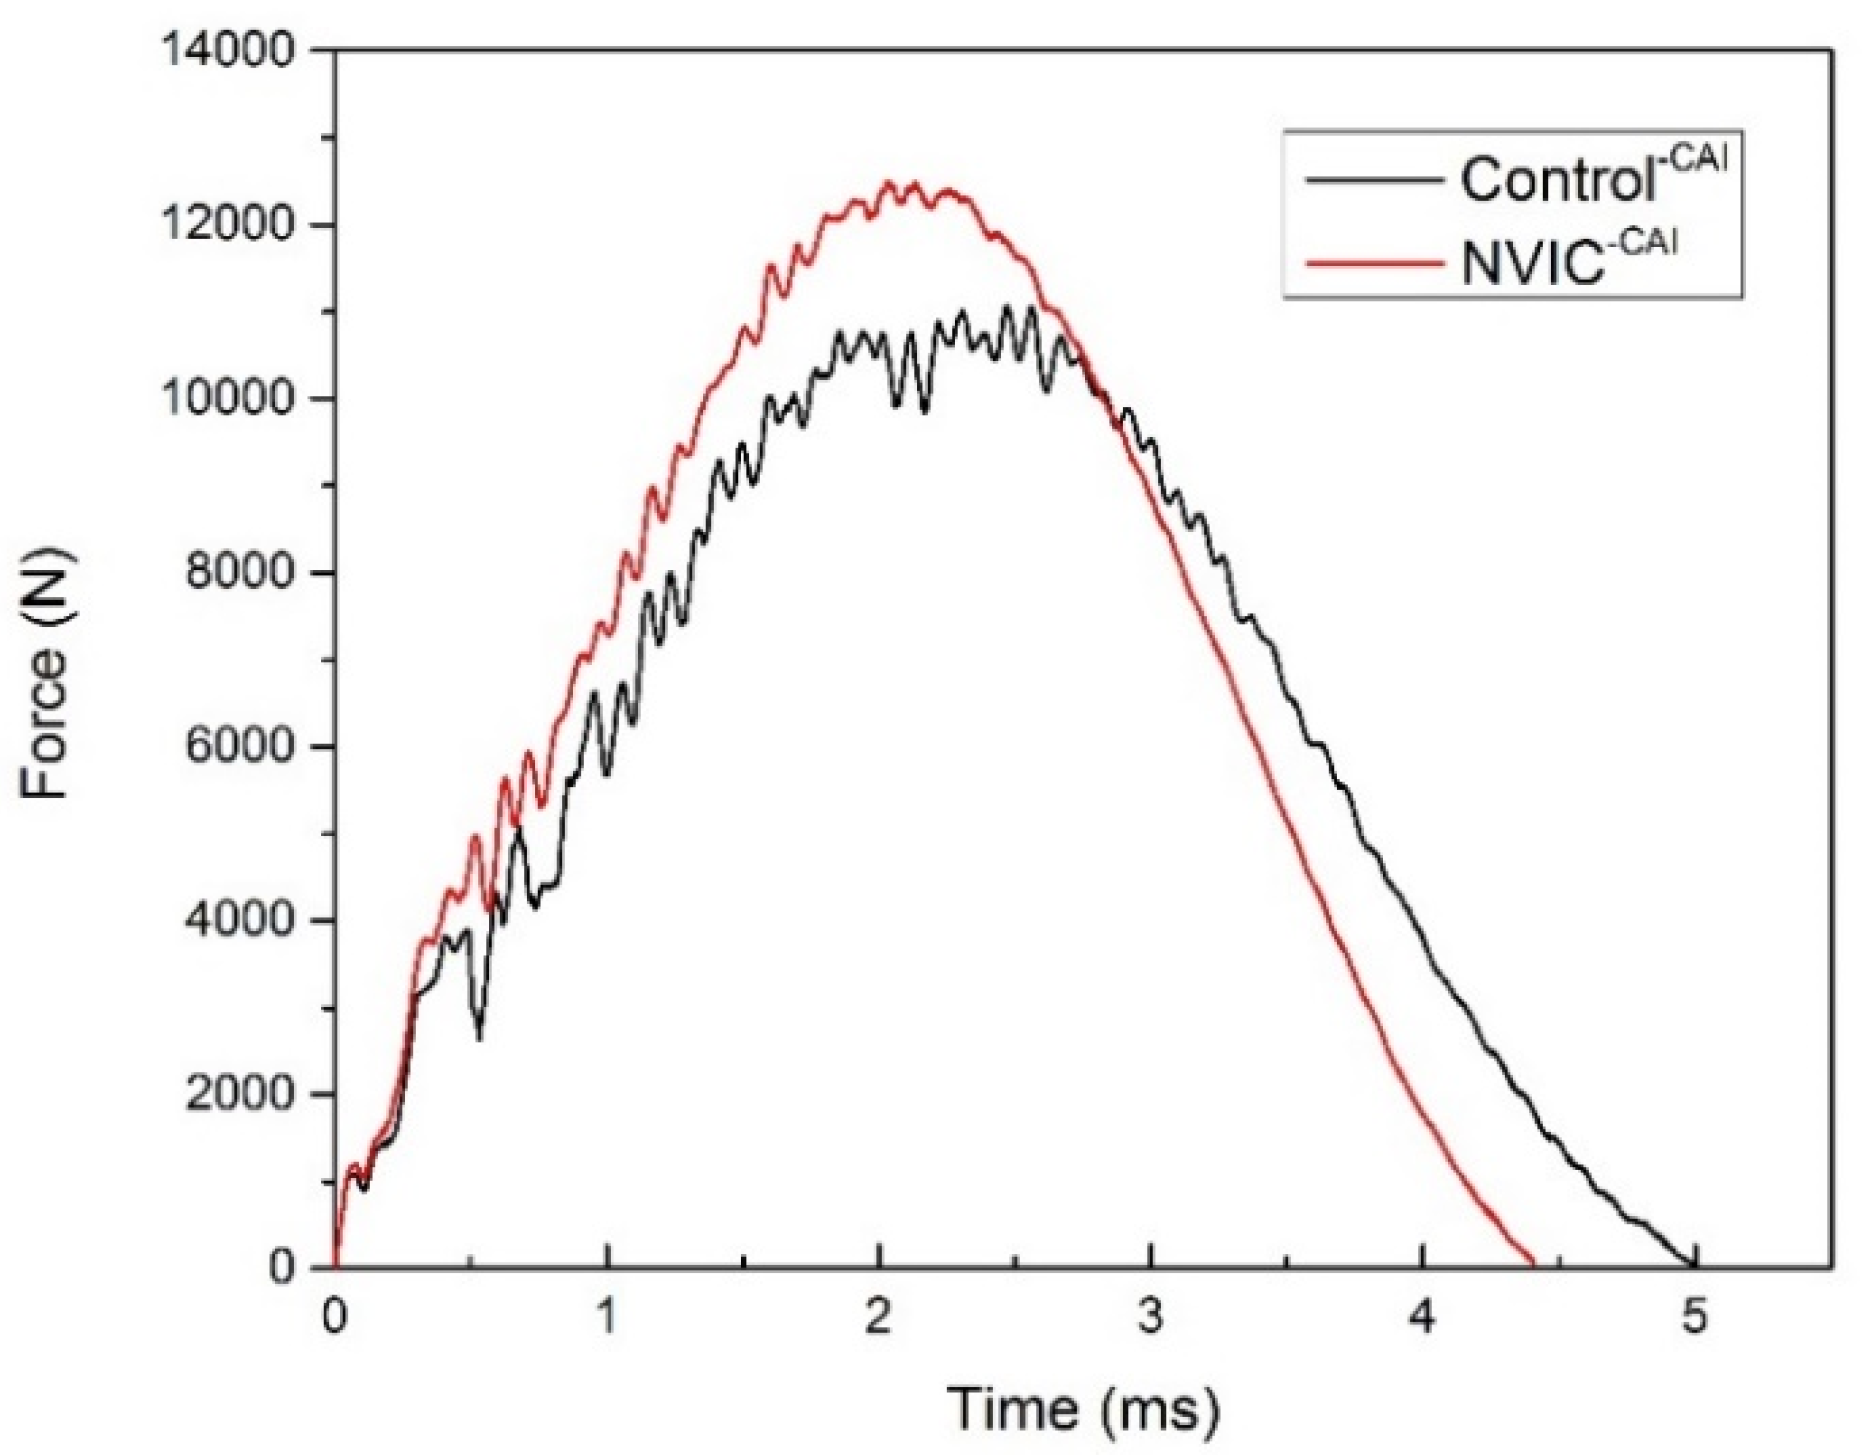
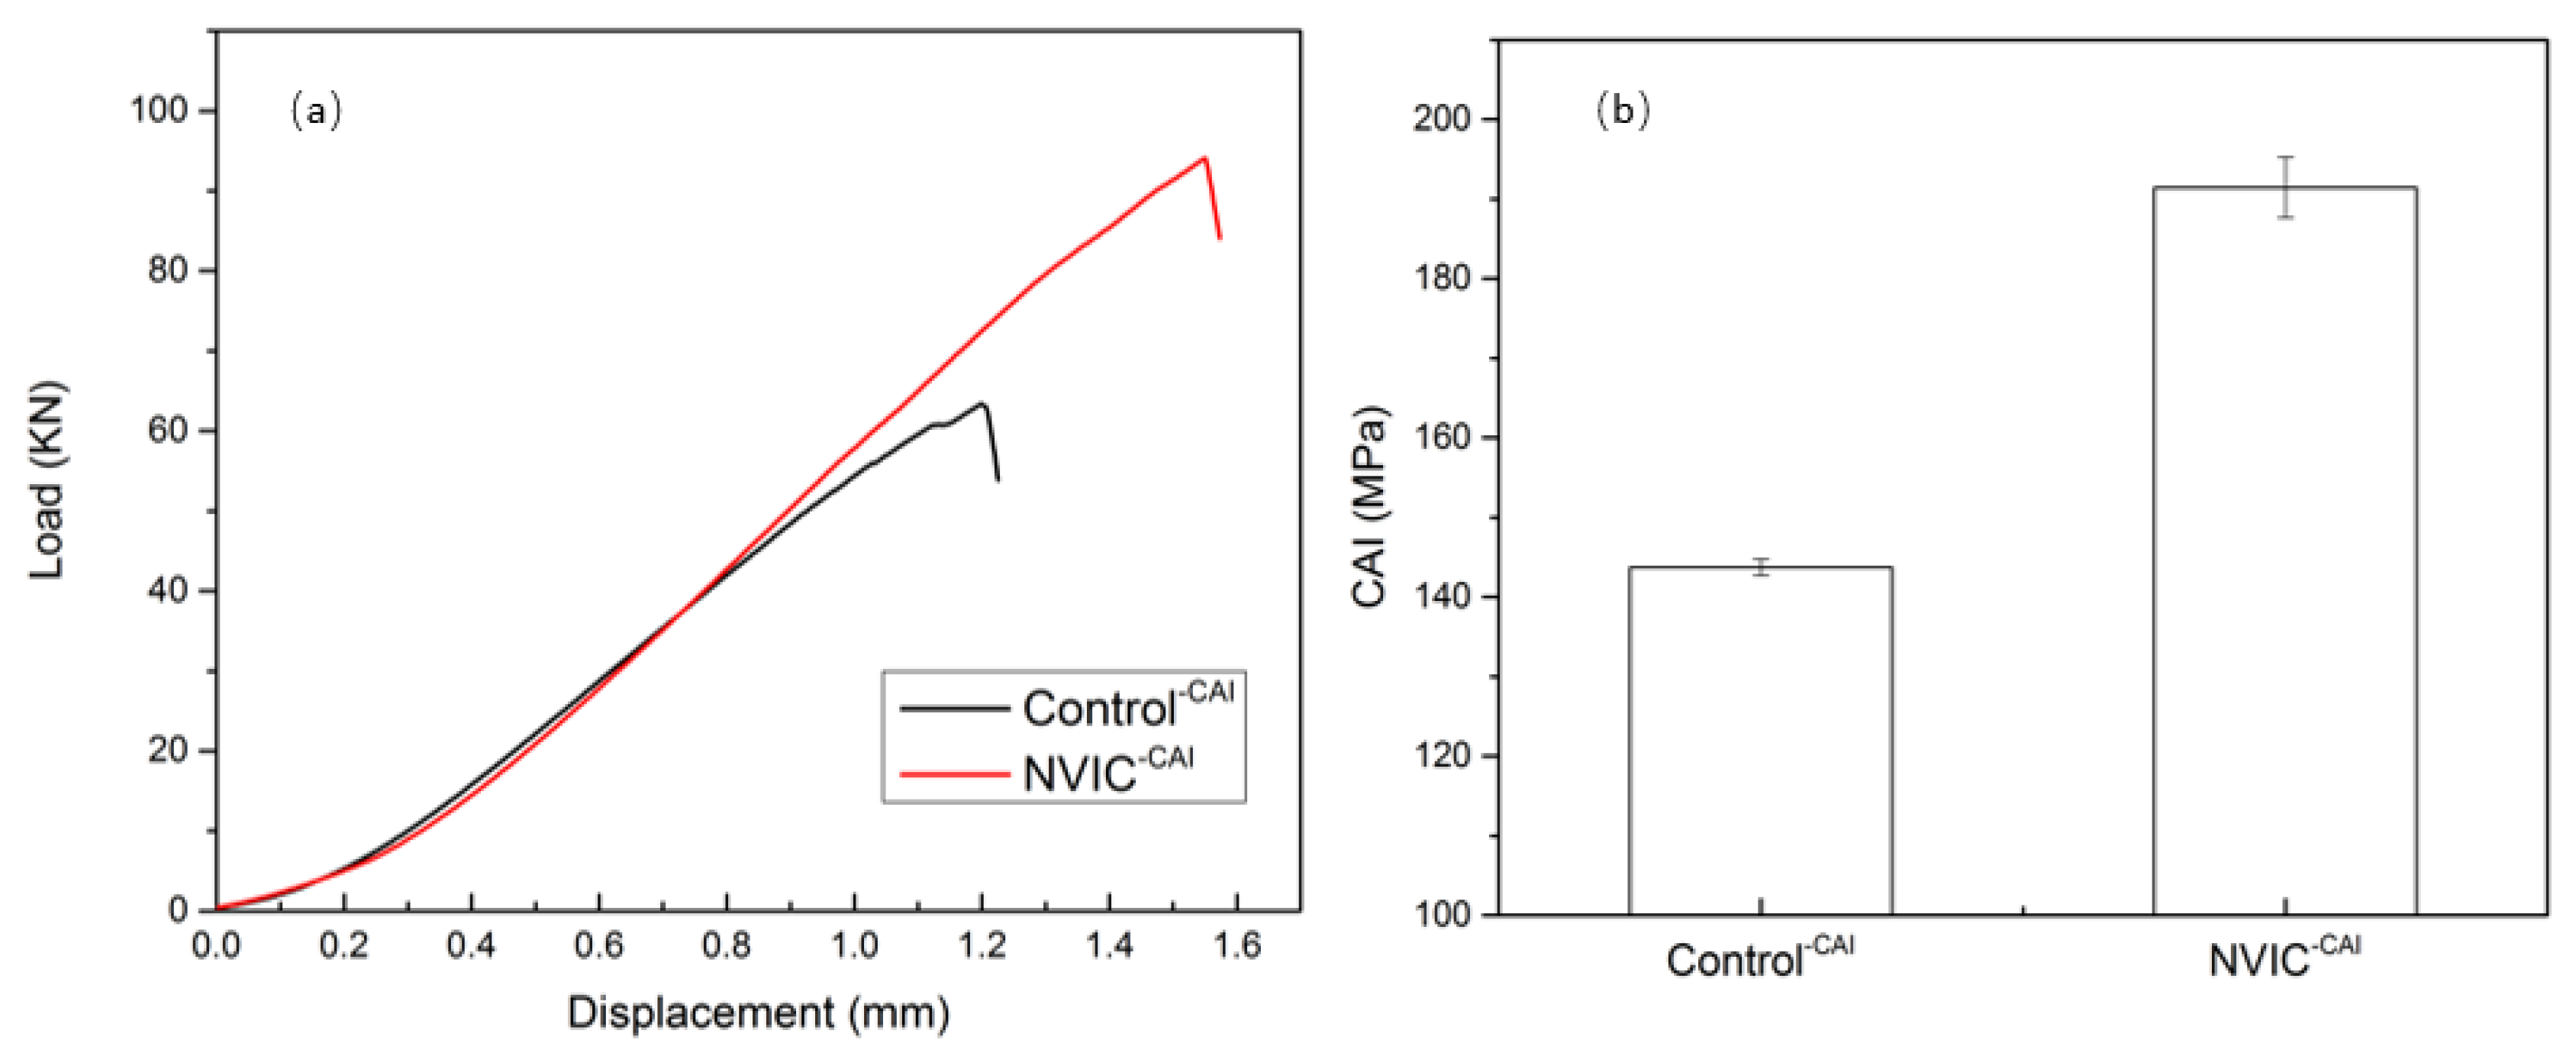
3.3. Drop-Weight Impact and Residual Compression after Impact Strength
3.4. In-Plane Mechanical Properties
4. Conclusions
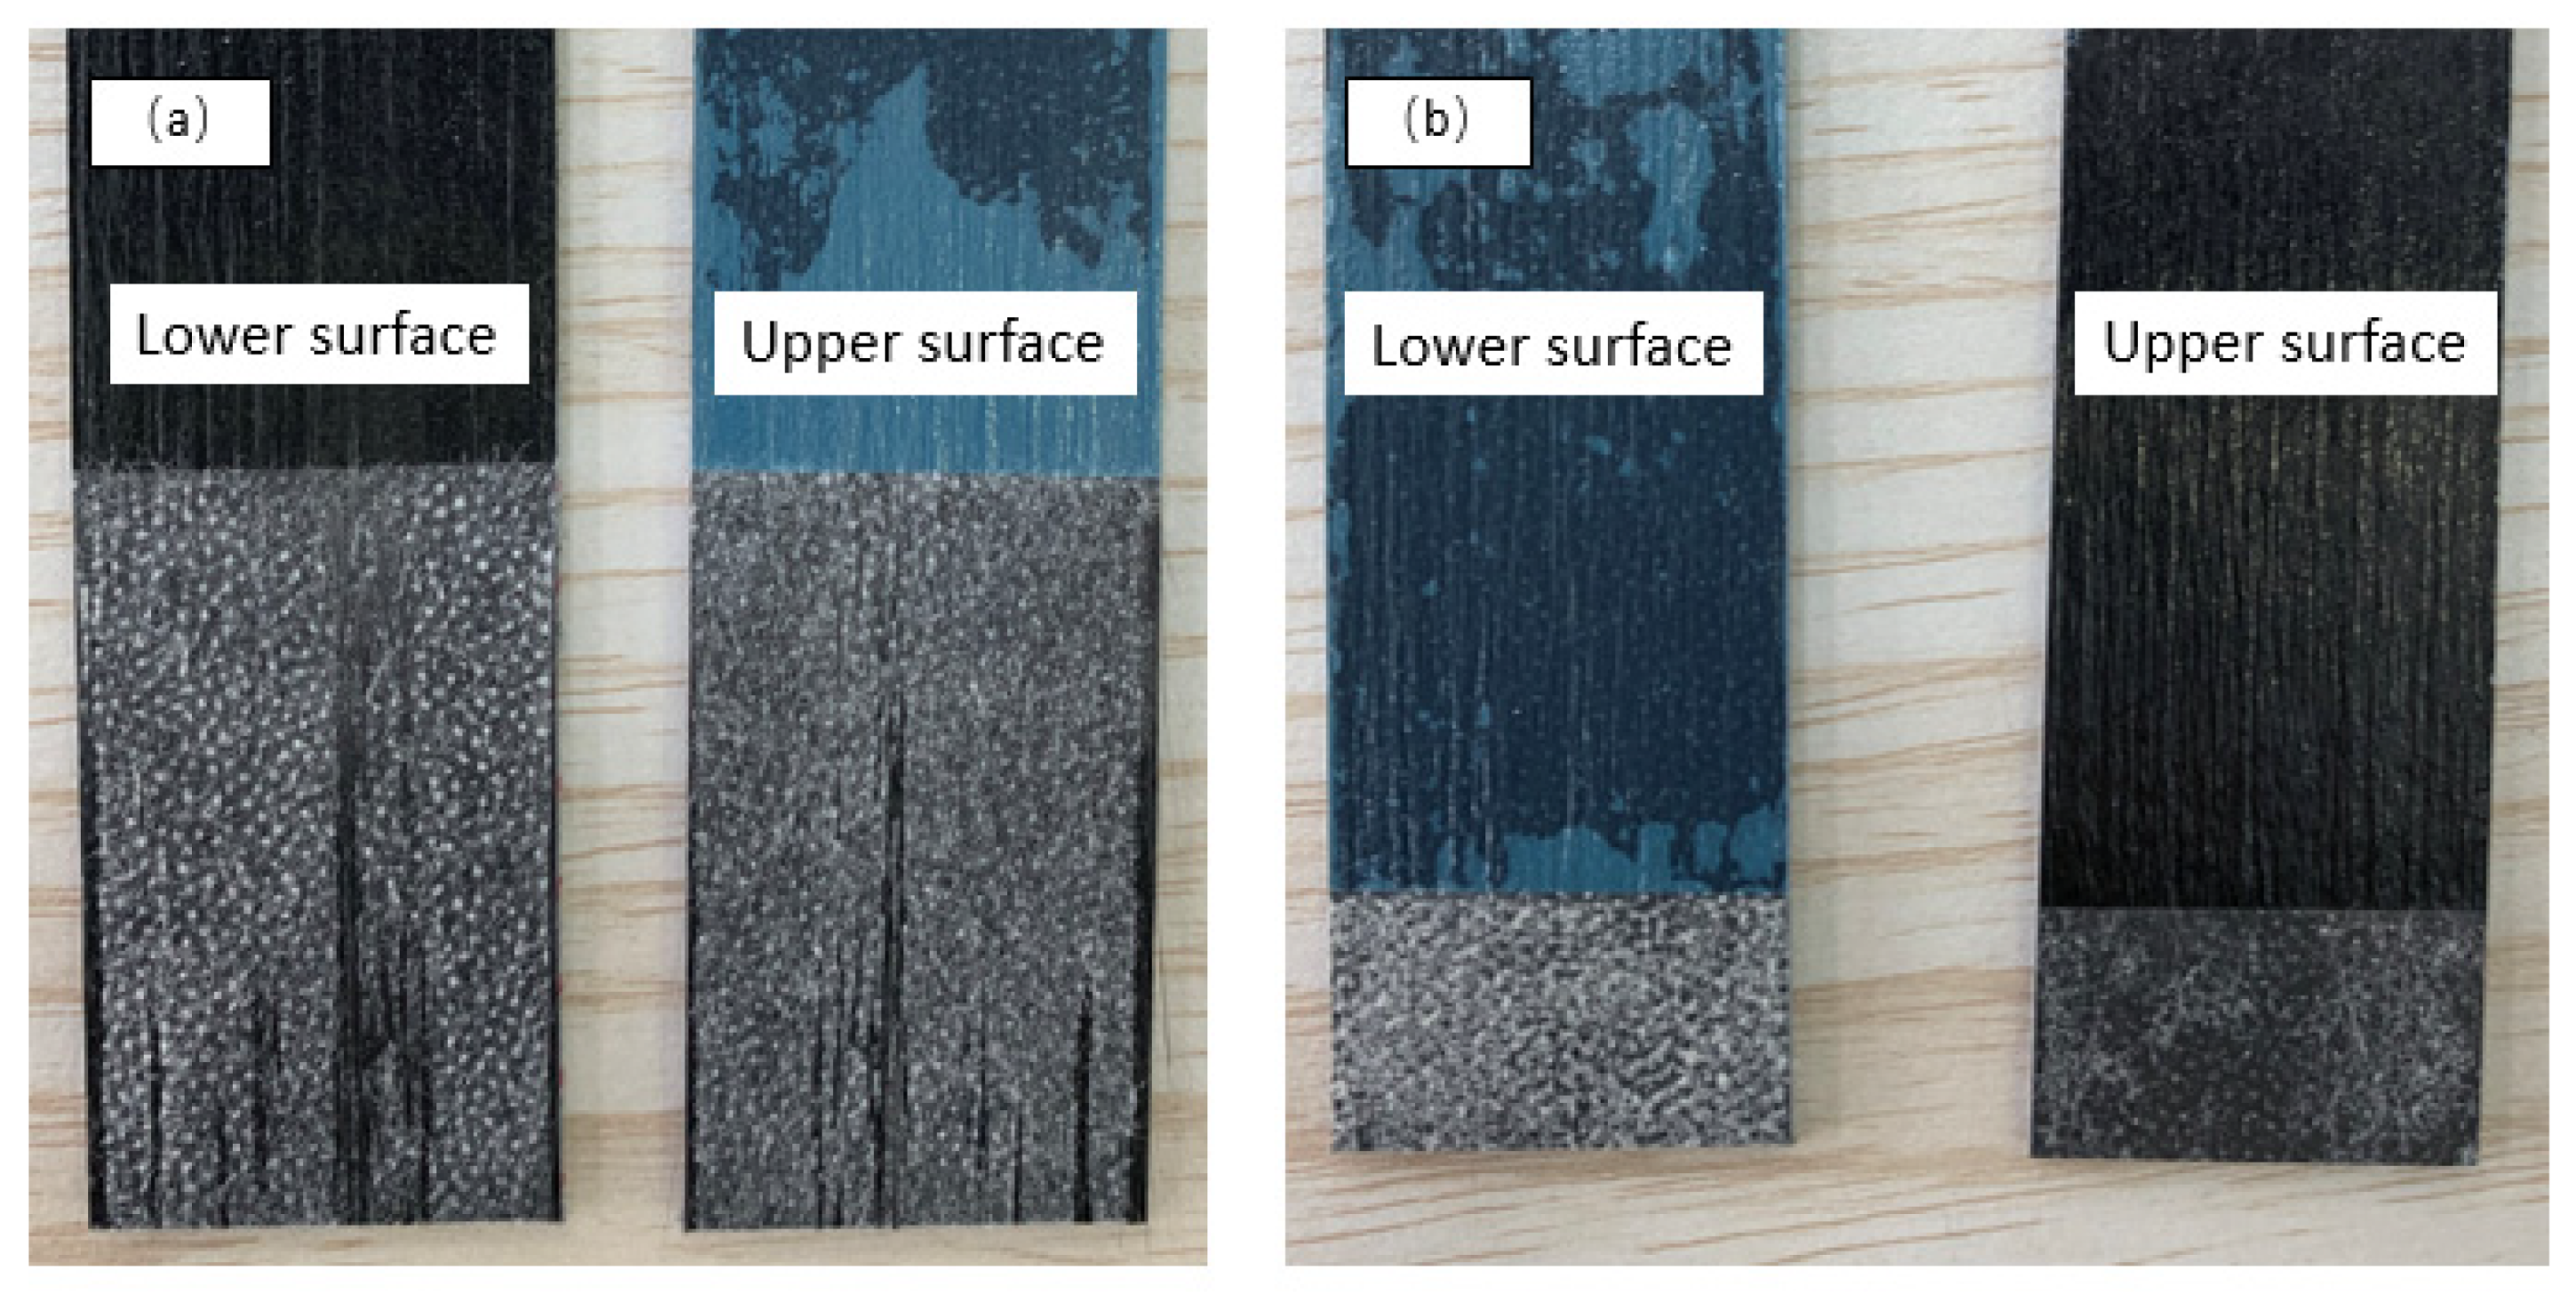
- We investigated the use of heat-bonded polyamide non-wovens as toughening interleaves in a green composite. Testing revealed useful improvements in toughness and CAI arising from changes in fracture mechanics with the incorporation of interleaves. Extensive study from fracture surfaces has yielded important information about crack propagation and the roles of the different features in the non-woven mat in controlling this.
- It is shown that the mechanical properties of the green composite system showed generally comparable performance with its commercial petroleum-sourced counterpart. Whilst the toughening effect was significant and demonstrable for the interleaved green composite, we also determined some reduction in static, in-plane properties due to the higher polymer ratio when interleaves were used. It is likely that some of this reduction could be mitigated by changing the stacking sequence and/or reducing the areal weight of the interleaves. Industrial application potential for a high temperature, toughened, “green composite” should be significant.
Author Contributions
Funding
Acknowledgments
Conflicts of Interest
References
- Darecki, M.; Edelstenne, C.; Enders, T.; Fernandez, E.; Hartman, P.; Herteman, J.-P.; Kerkloh, M.; King, I.; Ky, P.; Mathieu, M.; et al. Flightpath 2050 Europe’s Vision for Aviation; Publications Office of the European Union: Luxembourg, 2011. [Google Scholar]
- Liu, X.; Yi, X.; Zhu, J. Bio-based epoxies and composites as environmentally friendly alternative materials. In Thermosets: Structure, Properties and Applications; Guo, Q., Ed.; Elsevier: Amsterdam, The Netherlands, 2018; pp. 621–637. ISBN 9780081010211. [Google Scholar]
- Yi, X.; Tserpes, K. Special issue “ECO-COMPASS: Ecological and multifunctional composites for application in aircraft interior and secondary structures”. Aerospace 2019, 6, 17. [Google Scholar] [CrossRef] [Green Version]
- Bachmann, J.; Yi, X.; Gong, H.; Martinez, X.; Bugeda, G.; Oller, S.; Tserpes, K.; Ramon, E.; Paris, C.; Moreira, P.; et al. Outlook on ecologically improved composites for aviation interior and secondary structures. CEAS Aeronaut. J. 2018, 9, 533–543. [Google Scholar] [CrossRef] [Green Version]
- Yi, X.; Zhang, X.; Tong, J.; Xian, G. BIO-COMPOSITES Development of Bio-Composites for Green Aviation and Ground Vehicles. Sampe J. 2018, 16–26. [Google Scholar]
- Zhang, X.F.; Wu, Y.Q.Q.G.; Wei, J.H.; Tong, J.F.; Yi, X.S. Curing kinetics and mechanical properties of bio-based composite using rosin-sourced anhydrides as curing agent for hot-melt prepreg. Sci. China Technol. Sci. 2017, 60, 1318–1331. [Google Scholar] [CrossRef]
- Kumar, S.; Samal, S.K.; Mohanty, S.; Nayak, S.K. Study of curing kinetics of anhydride cured petroleum-based (DGEBA) epoxy resin and renewable resource based epoxidized soybean oil (ESO) systems catalyzed by 2-methylimidazole. Thermochim. Acta 2017, 654, 112–120. [Google Scholar] [CrossRef]
- Hu, F.; Yadav, S.K.; La Scala, J.J.; Sadler, J.M.; Palmese, G.R. Preparation and Characterization of Fully Furan-Based Renewable Thermosetting Epoxy-Amine Systems. Macromol. Chem. Phys. 2015, 216, 1441–1446. [Google Scholar] [CrossRef]
- Marotta, A.; Faggio, N.; Ambrogi, V.; Cerruti, P.; Gentile, G.; Mija, A. Curing Behavior and Properties of Sustainable Furan-Based Epoxy/Anhydride Resins. Biomacromolecules 2019, 20, 3831–3841. [Google Scholar] [CrossRef] [PubMed]
- Wong, D.W.Y.; Lin, L.; McGrail, P.T.; Peijs, T.; Hogg, P.J. Improved fracture toughness of carbon fibre/epoxy composite laminates using dissolvable thermoplastic fibres. Compos. Part A Appl. Sci. Manuf. 2010, 41, 759–767. [Google Scholar] [CrossRef]
- Van Velthem, P.; Ballout, W.; Daoust, D.; Sclavons, M.; Cordenier, F.; Henry, E.; Dumont, D.; Destoop, V.; Pardoen, T.; Bailly, C. A Influence of thermoplastic diffusion on morphology gradient and on delamination toughness of RTM-manufactured composites. Compos. Part A 2015, 72, 175–183. [Google Scholar] [CrossRef]
- Hourston, D.J.; Lane, J.M. The toughening of epoxy resins with thermoplastics: 1. Trifunctional epoxy resin-polyetherimide blends. Polymer 1992, 33, 1379–1383. [Google Scholar] [CrossRef]
- Yun, N.G.; Won, G.Y.; Kim, S.C. Toughening of carbon fiber/epoxy composite by inserting polysulfone film to form morphology spectrum. Polymer 2004, 45, 6953–6958. [Google Scholar] [CrossRef]
- Sun, Z.; Xu, L.; Chen, Z.; Wang, Y.; Tusiime, R.; Cheng, C.; Zhou, S.; Liu, Y.; Yu, M.; Zhang, H. Enhancing the mechanical and thermal properties of epoxy resin via blending with thermoplastic polysulfone. Polymers 2019, 11, 461. [Google Scholar] [CrossRef] [PubMed] [Green Version]
- Chen, H.; Su, C.; Huang, T.; Li, T. Investigation of the relationship between morphology and tribological properties of an epoxy resin based on tetraglycidyl 4,4′-diaminodiphenylmethane modified with polyetherimide oligomers. J. Appl. Polym. Sci. 2014, 131. [Google Scholar] [CrossRef]
- Wu, Z.; Yi, X.; Wilkinson, A. Interlaminar fracture toughness of carbon fi bre/RTM6-2 composites toughened with thermoplastic-coated fabric reinforcement. Compos. Part B 2017, 130, 192–199. [Google Scholar] [CrossRef] [Green Version]
- Zhang, J.; Guo, Q.; Fox, B.L. Study on thermoplastic-modified multifunctional epoxies: Influence of heating rate on cure behaviour and phase separation. Compos. Sci. Technol. 2009, 69, 1172–1179. [Google Scholar] [CrossRef]
- Gan, W.; Yu, Y.; Wang, M.; Tao, Q.; Li, S. Viscoelastic Effects on the Phase Separation in Thermoplastics-Modified Epoxy Resin. Macromol. Chem. Phys. 2003, 35, 7746–7751. [Google Scholar] [CrossRef]
- Aljarrah, M.T.; Abdelal, N.R. Improvement of the mode I interlaminar fracture toughness of carbon fiber composite reinforced with electrospun nylon nanofiber. Compos. Part B Eng. 2019, 165, 379–385. [Google Scholar] [CrossRef]
- Zheng, N.; Huang, Y.; Liu, H.Y.; Gao, J.; Mai, Y.W. Improvement of interlaminar fracture toughness in carbon fiber/epoxy composites with carbon nanotubes/polysulfone interleaves. Compos. Sci. Technol. 2017, 140, 8–15. [Google Scholar] [CrossRef] [Green Version]
- Zhou, H.; Du, X.; Liu, H.Y.; Zhou, H.; Zhang, Y.; Mai, Y.W. Delamination toughening of carbon fiber/epoxy laminates by hierarchical carbon nanotube-short carbon fiber interleaves. Compos. Sci. Technol. 2017, 140, 46–53. [Google Scholar] [CrossRef]
- Hogg, P.J. Toughening of thermosetting composites with thermoplastic fibres. Mater. Sci. Eng. A 2005, 412, 97–103. [Google Scholar] [CrossRef]
- Xu, F.; Yang, B.; Feng, L.; Huang, D.; Xia, M. Improved interlaminar fracture toughness and electrical conductivity of CFRPs with non-woven carbon tissue interleaves composed of fibers with different lengths. Polymers 2020, 12, 803. [Google Scholar] [CrossRef] [PubMed] [Green Version]
- Ramirez, V.A.; Hogg, P.J.; Sampson, W.W. The influence of the nonwoven veil architectures on interlaminar fracture toughness of interleaved composites. Compos. Sci. Technol. 2015, 110, 103–110. [Google Scholar] [CrossRef]
- Cheng, Q.; Fang, Z.; Yi, X.; An, X.; Tang, B.; Xu, Y. “ Ex Situ ” Concept for Toughening the RTMable BMI Matrix Composites, Part I: Improving the Interlaminar Fracture Toughness. J. Appl. Polym. Sci. 2008, 109. [Google Scholar] [CrossRef]
- Nasser, J.; Zhang, L.; Sodano, H. Aramid nanofiber interlayer for improved interlaminar properties of carbon fiber/epoxy composites. Compos. Part B Eng. 2020, 197, 108130. [Google Scholar] [CrossRef]
- Yi, X.; Guo, M.; Liu, G.; Zhao, W.; Liu, L.; Cui, H. Composite conductive sheet, fabricating method and application thereof. European Patent EP2687364A1, 22 January 2014. [Google Scholar]
- Hu, D.; Yi, X.; Jiang, M.; Li, G.; Cong, X.; Liu, X.; Rudd, C. Development of highly electrically conductive composites for aeronautical applications utilizing bi-functional composite interleaves. Aerosp. Sci. Technol. 2020, 98, 105669. [Google Scholar] [CrossRef]
- Guo, M.; Yi, X.; Rudd, C.; Liu, X. Preparation of highly electrically conductive carbon-fiber composites with high interlaminar fracture toughness by using silver-plated interleaves. Compos. Sci. Technol. 2019, 176, 29–36. [Google Scholar] [CrossRef]
- Liu, X.; Xin, W.; Zhang, J. Rosin-based acid anhydrides as alternatives to petrochemical curing agents. Green Chem. 2009, 11, 1018–1025. [Google Scholar] [CrossRef]
- ASTM D5528-01 Standard Test Method for Mode I Interlaminar Fracture Toughness of Unidirectional Fiber-Reinforced Polymer Matrix Composites. Available online: https://www.astm.org/Standards/D5528 (accessed on 30 August 2020).
- ASTM D7905 Standard Test Method for Mode II Interlaminar Fracture Toughness of Unidirectional Fiber-Reinforced Polymer Matrix Composites. Available online: https://www.astm.org/Standards/D7905.htm (accessed on 30 August 2020).
- ASTM D7136/D7136M-12 Standard Test Method for Measuring the Damage Resistance of a Fiber-Reinforced Polymer Matrix Composite to a Drop-Weight Impact Event. Available online: https://www.astm.org/Standards/D7136.htm (accessed on 30 August 2020).
- ASTM D7137/D7137M-17 Standard Test Method for Compressive Residual Strength Properties of Damaged Polymer Matrix Composite Plates. Available online: https://www.astm.org/Standards/D7137.htm (accessed on 30 August 2020).
- ASTM D790-17 Standard Test Methods for Flexural Properties of Unreinforced and Reinforced Plastics and Electrical Insulating Materials. Available online: https://www.astm.org/Standards/D790 (accessed on 30 August 2020).
- ASTM D2344/D2344M-16 Standard Test Method for Short-Beam Strength of Polymer Matrix Composite Materials and Their Laminates. Available online: https://www.astm.org/Standards/D2344 (accessed on 30 August 2020).
- ASTM D6641/D6641M-16e1 Standard Test Method for Compressive Properties of Polymer Matrix Composite Materials Using a Combined Loading Compression (CLC) Test Fixture. Available online: https://www.astm.org/Standards/D6641 (accessed on 30 August 2020).
- ASTM D3039/D3039M-17 Standard Test Method for Tensile Properties of Polymer Matrix Composite Materials. Available online: https://www.astm.org/Standards/D3039 (accessed on 30 August 2020).
- Venkateshwar Reddy, C.; Ramesh Babu, P.; Ramnarayanan, R.; Das, D. Mechanical Characterization of Unidirectional Carbon and Glass/Epoxy Reinforced Composites for High Strength Applications. Mater. Today Proc. 2017, 4, 3166–3172. [Google Scholar] [CrossRef]


| Density, g/cm2 | Gel Time at 120 °C, s | Peak Exothermic Temperature (Tp) under 10 °C /min Heating Rate, °C |
|---|---|---|
| 1.18 | 500 | 164 |
| Strength, MPa | Modulus, GPa | Elongation at Break, % | Linear Density, g/km | Density, g/cm3 | Diameter, μm |
|---|---|---|---|---|---|
| 4900 | 230 | 2.1 | 800 | 1.79 | 7 |
| Area Density, g/m2 | Resin Content, wt% | Areal Weight, g/m2 | Volatile Content, wt% |
|---|---|---|---|
| 140 | 37.2 | 223.4 | 0.85 |
| Specimen | Lay-Up | Thickness (mm) | Veil Mass Fraction (wt.%) | Fibre Volume Fraction (Vf.%) |
|---|---|---|---|---|
| Control-IFT | [0]24 | 3.3 ± 0.02 | - | 56.7 ± 0.32 |
| NVIC-IFT | 3.9 ± 0.01 | 12.31 ± 0.15% | 48.1 ± 0.18 |
| Specimen | Lay-up | Thickness (mm) | Veil Mass Fraction (wt.%) | Fibre Volume Fraction (Vf.%) |
|---|---|---|---|---|
| Control-CAI | [+/0/−/90]4s | 4.38 ± 0.02 | - | 57.04 ± 0.05 |
| NVIC-CAI | 4.86 ± 0.02 | 12.44 ± 0. 38 | 51.48 ± 0.21 |
| Specimen. | Lay-Up | Thickness (mm) | Veil Mass Fraction (wt.%) | Fiber Volume Fraction (Vf.%) | Test |
|---|---|---|---|---|---|
| Control-T | [0]5 | 0.7 ± 0.01 | - | 55.56 ± 0.8 | Tensile test |
| NVIC-T | 0.81 ± 0.01 | 11.24 ± 0.1 | 48.28 ± 0.53 | ||
| Control-FS | [0]20 | 2.69 ± 0.01 | - | 58.1 ± 0.32 | Flexural and Interlaminar shear strength test |
| NVIC-FS | 3.09 ± 0.01 | 11.9 ± 0.06 | 50.7 ± 0.13 | ||
| Control-C | [0/90]6 | 1.6 ± 0.01 | - | 58.44 ± 0.37 | Compression (CLC) test |
| NVIC-C | 1.78 ± 0.02 | 13.08 ± 0.07 | 52.67 ± 0.58 |
| Impact Energy (J) | Control-CAI | NVIC-CAI |
|---|---|---|
| 6.7 J/mm |  Damage area: 3201.1 mm2 (20.9%) | 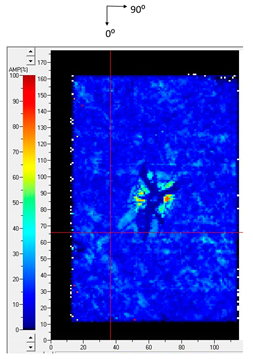 Damage area: 1713.82 mm2 (11.33%) |
| Mechanical Property | UNIT | Commercial Product (LY556/T700 Toray 12K, Vf = 65%, UD) [39] | Control | NVIC |
|---|---|---|---|---|
| Flexural strength 0° | MPa | 1396.96 | 1187.3 ± 46.4 | 1049.2 ± 39 |
| Flexural modulus 0° | GPa | 104.16 | 104 ± 2.8 | 93 ± 1.4 |
| Interlaminar shear strength | MPa | 57.83 | 73 ± 0.2 | 66.2 ± 1 |
| Tensile strength 0° | MPa | 1235.70 | 2121.9 ± 77.2 | 1821.6 ± 47.9 |
| Tensile modulus 0° | GPa | 134.58 | 130.1 ± 2.8 | 115.6 ± 11.1 |
| Compression strength [0/90°] | MPa | 674.7 (0°) | 469.3 ± 22.8 | 428.6 ±26 |
| Compression modulus [0/90°] | GPa | 153.72 (0°) | 66.8 ± 5.1 | 55.1 ± 2.2 |
Publisher’s Note: MDPI stays neutral with regard to jurisdictional claims in published maps and institutional affiliations. |
© 2020 by the authors. Licensee MDPI, Basel, Switzerland. This article is an open access article distributed under the terms and conditions of the Creative Commons Attribution (CC BY) license (http://creativecommons.org/licenses/by/4.0/).
Share and Cite
Hu, D.; Zhang, X.; Liu, X.; Qin, Z.; Hu, L.; Rudd, C.; Yi, X. Study on Toughness Improvement of a Rosin-Sourced Epoxy Matrix Composite for Green Aerospace Application. J. Compos. Sci. 2020, 4, 168. https://doi.org/10.3390/jcs4040168
Hu D, Zhang X, Liu X, Qin Z, Hu L, Rudd C, Yi X. Study on Toughness Improvement of a Rosin-Sourced Epoxy Matrix Composite for Green Aerospace Application. Journal of Composites Science. 2020; 4(4):168. https://doi.org/10.3390/jcs4040168
Chicago/Turabian StyleHu, Dongyuan, Xvfeng Zhang, Xiaoling Liu, Zhen Qin, Li Hu, Chris Rudd, and Xiaosu Yi. 2020. "Study on Toughness Improvement of a Rosin-Sourced Epoxy Matrix Composite for Green Aerospace Application" Journal of Composites Science 4, no. 4: 168. https://doi.org/10.3390/jcs4040168