Article

Analysis of RC Beams under Combined Torsion and Shear Using Optimization Techniques Evaluation of NBR 6118 and AASHTO LRFD Standards

by
William Obel
1,
Bernardo Horowitz
1 and
Luís F. A. Bernardo
2,*
1
Department of Civil Engineering—Structural Area, Federal University of Pernambuco—UFPE, Av. Acadêmico Hélio Ramos, Recife 50740-530, Brazil
2
Centre of Materials and Building Technologies (C-MADE), Department of Civil Engineering and Architecture, University of Beira Interior, 6201-001 Covilha, Portugal
*
Author to whom correspondence should be addressed.
J. Compos. Sci. 2022, 6(6), 175; https://doi.org/10.3390/jcs6060175
Submission received: 30 May 2022 / Revised: 9 June 2022 / Accepted: 14 June 2022 / Published: 15 June 2022
(This article belongs to the Special Issue Feature Papers in Journal of Composites Science in 2022)

Abstract

:
In this article, a novel calculation procedure using optimization techniques is proposed to compute the torsion–shear interaction curves for reinforced concrete (RC) beams. The calculation procedure is applied to NBR 6118 and AASHTO LRFD standards in order to evaluate their reliability. For this, some experimental results found in the literature and related to RC beams tested under combined torsion and shear, as well as results from the combined-action softened truss Model (CA-STM), are used for comparison. From the obtained results, AASHTO LRFD provisions are found to –be satisfactorily accurate. The NBR 6118 provisions are found to be consistent with the experimental results when the angle of the concrete struts is assumed to be variable or equal to the lower bound value of 30°, according to model II of the standard. For an angle assumed equal to 45°, according to model I of the NBR 6118 standard, the predicted strengths are found to be excessively conservative. The results demonstrate that formulating the analysis of RC beams under combined torsion and shear as an optimization problem, as proposed in this article, constitutes an alternative and efficient option. In addition, the generality of the proposed calculation procedure allows it to be applied to any design standard to compute the torsion–shear interaction curves for RC beams.

1. Introduction

Reinforced concrete (RC) members under high eccentric loadings undergo torsional moments in addition to shear. Such interaction of internal forces is very common in structural members, such as spandrel beams and beams curved in plan. In some cases, interaction loading leads to primary torsion combined with shear, which can be highly critical for design [1]. Situations in which critical cross-sections must resist primary torques and shears is common in practice, namely in girder bridges. Figure 1 illustrates the model of a curved continuous girder in plan with two spans. If the twists are restrained at both ends, the cross-sections will undergo torque and shear force, even if a redistribution of the internal forces occur.
Modelling the ultimate response of RC members under combined internal forces is not an easy task after the cracking stage. However, since the second half of the last century, analytical models have been proposed to predict the strength of RC members under pure torsion and, also, under combined torsion. Some of the developed models were based on the so-called skew-bending approach, firstly proposed in 1968 [2]. Such models considered the equilibrium state only for the ultimate stage and were mainly calibrated for small rectangular and solid cross-sections. Models based on the skew-bending approach were developed over more than two decades, and were incorporated in some important design codes, such as the ACI code until 1995. Further developments of such models to predict the strength of RC members under combined loading were also proposed by researchers [3,4].
At about the same time, alternative and physically more comprehensive models for cracked RC members were developed by several authors. Such models are based on the space truss analogy (STA), which was firstly proposed by Rausch in the beginning of last century to compute the strength of RC members under torsion [5]. From the 1950s and 1960s, extensive experimental and theoretical research allowed for the refinement of models based on the STA approach. This allowed researchers to extend and calibrate the models for both small and large cross-sections (plain or hollow), for cross-sections with arbitrary geometry, for prestressed members, and for members under combined loading, and also to predict the full envelope of the load–deformation response. Models based on the STA approach were developed for RC members under torsion [6,7,8,9,10] and also under torsion with combined loading, namely combined torsion and bending [11,12], combined torsion and shear [13,14,15,16], combined torsion, bending and axial load [17], combined torsion and axial force [18,19], as well as for more complex loading conditions [20,21,22,23,24,25]. Nowadays, most of the design codes incorporate design rules for torsion (for both pure torsion and combined torsion) based on STA approaches.
Recently, more advanced analytical models for RC members under torsion and combined loading have also been proposed in the literature [26,27,28,29,30]. However, although these models have showed to be very accurate, they are not easy to use for practical design, since they require advanced calculation procedures.
For practice, structural engineers usually apply the clauses from structural design standards. Most of the torsional and shear standard design rules for RC members are based on STA approaches (planar truss for shear and spatial truss for torsion). As a consequence of the development of such approaches over the years, the design rules for torsion and combined torsion have been successively updated in the design standards. This has been the case for the American specifications for bridge design (AASHTO LRFD [31]), and also for the Brazilian standard (NBR 6118 [32]). For the latter, the clauses to compute the shear strength are based on Mörsch’s truss model and also on empirical models, while the model to compute the torsional strength is based on the space truss model. For the AASHTO LRFD standard, the clauses for the shear strength are based on the modified compression field theory (MCFT), while the clauses for the torsional strength are based on the same model as NBR 6118.
To design RC members under combined torsion and shear, or to check the resistance for a given RC member, the torsion–shear interaction curves constitute a fundamental tool. However, obtaining such curves from the equations incorporated in the design standards, mainly based on empirical methods and mechanical models, is not an easy task due to the complexity of the resulting equations and the difficulty of implementing them to generate the interaction curves. In spite of this, such interaction curves have been successfully computed in previous studies for the evaluation of design standard against experimental results, although the difficulty to compute such curves is often evident [33,34,35,36]. Hence, new and general calculation procedures are still needed to apply the clauses from any design standard, in order to compute the torsion–shear interaction curves.
The aforementioned motivated the work presented in this article, in which a novel calculation procedure is proposed to compute the torsion–shear interaction curves. The novelty lies on the use of optimization techniques to formulate the proposed general calculation procedure. To the best of the authors’ knowledge, the calculation of interaction curves using optimization techniques has never been proposed in the literature. The proposed calculation procedure is applied to the NBR 6118 and AASHTO LRFD standards in order to evaluate their reliability. For this, some experimental results found in the literature, related with RC beams tested under combined torsion and shear, are used to compare and evaluate the NBR 6118 and AASHTO LRFD standards. In addition, the theoretical combined-action softened truss model (CA-STM) is also used for comparison. The proposed calculation procedure, which can be implemented to any design standard, was found to be simple and numerically efficient. It can be used as an alternative procedure to more complicated ones for the analysis of RC members under combined torsion and shear.

2. Calculation Procedure to Generate Torsion–Shear Interaction Curves

2.1. Statement of the Problem

The aim of the proposed calculation procedure is to compute the resistance of the critical cross-section for RC beams under torsion, T , combined with shear, V . The interaction of internal forces is characterized by the ratio T / V .
Let α be an angle, such that:
V = V max r cos ( α )
T = T max r sin ( α )
where V max is the maximum shear strength of the RC cross-section under pure shear force (with no torsion) and T max is the maximum torsional strength of the cross-section under pure torsion (with no shear). In the previous equations, T and V are the maximum acting forces that can be resisted by the given section, according to the specific standard. An internal force multiplier r 1 is defined as a dimensionless variable and called radius. This variable is to be determined in order to maximize the internal forces acting in the RC cross-section.
The problem to calculate the resistance of the RC cross-section for the torsion–shear interaction, for a given ratio T / V , can be stated as the following optimization problem:
M a x i m i z e f ( r , α ) = r s u b j e c t   t o : S ( r , α ) j R ( r , α ) j ,   j = 1 J
In Equation (3), the optimization parameter to be maximized is a load multiplier for a given ratio of acting forces T and V , such that the section attains its maximum resistance according to the specific standard. Furthermore, f is the objective function to be maximized, which in this case is the load multiplier. The J inequality constraints, in the form Acting Force ≤ Strength, represent the various standard clauses limiting the maximum values for the pair V and T as a function of the strength of the materials (concrete and steel reinforcement), the geometry of the cross-section, and the amount and detailing of the reinforcement. These constraints are detailed later for each of the studied design standard.
Depending on the design standard employed, other design variables need to be considered in the problem stated through Equation (3). One example of such an additional design variable is the angle θ of the inclined concrete struts to the longitudinal axis of the member, which is considered a variable in model II from the Brazilian standard (NBR 6118) to compute the shear strength.
Figure 2 represents the model used to obtain the torsion–shear interaction curve. Parameter r i represents the radii which provide the maximum values for the acting torque, T , and shear force, V , as a function of the angles α i corresponding to the different ratios T / V . The set of all points defined from r i are used to draw the torsion–shear interaction curve for a given design standard.

2.2. Optimization Procedure

To solve the problem stated in Equation (3), Mathcad software [37] was used to generate the torsion–shear interaction curve. Quasi-Newton was used as the constrained optimization algorithm. The steps of the proposed calculation procedure to compute the optimal solution for a given design standard can be summarized as follows:
  • For a given reference beam, enter the following initial data:
    • Geometry of the rectangular cross-section: b and h ;
    • Mechanical properties for steel reinforcement: f y l , f y t and E s ;
    • Mechanical properties for concrete: f c k ;
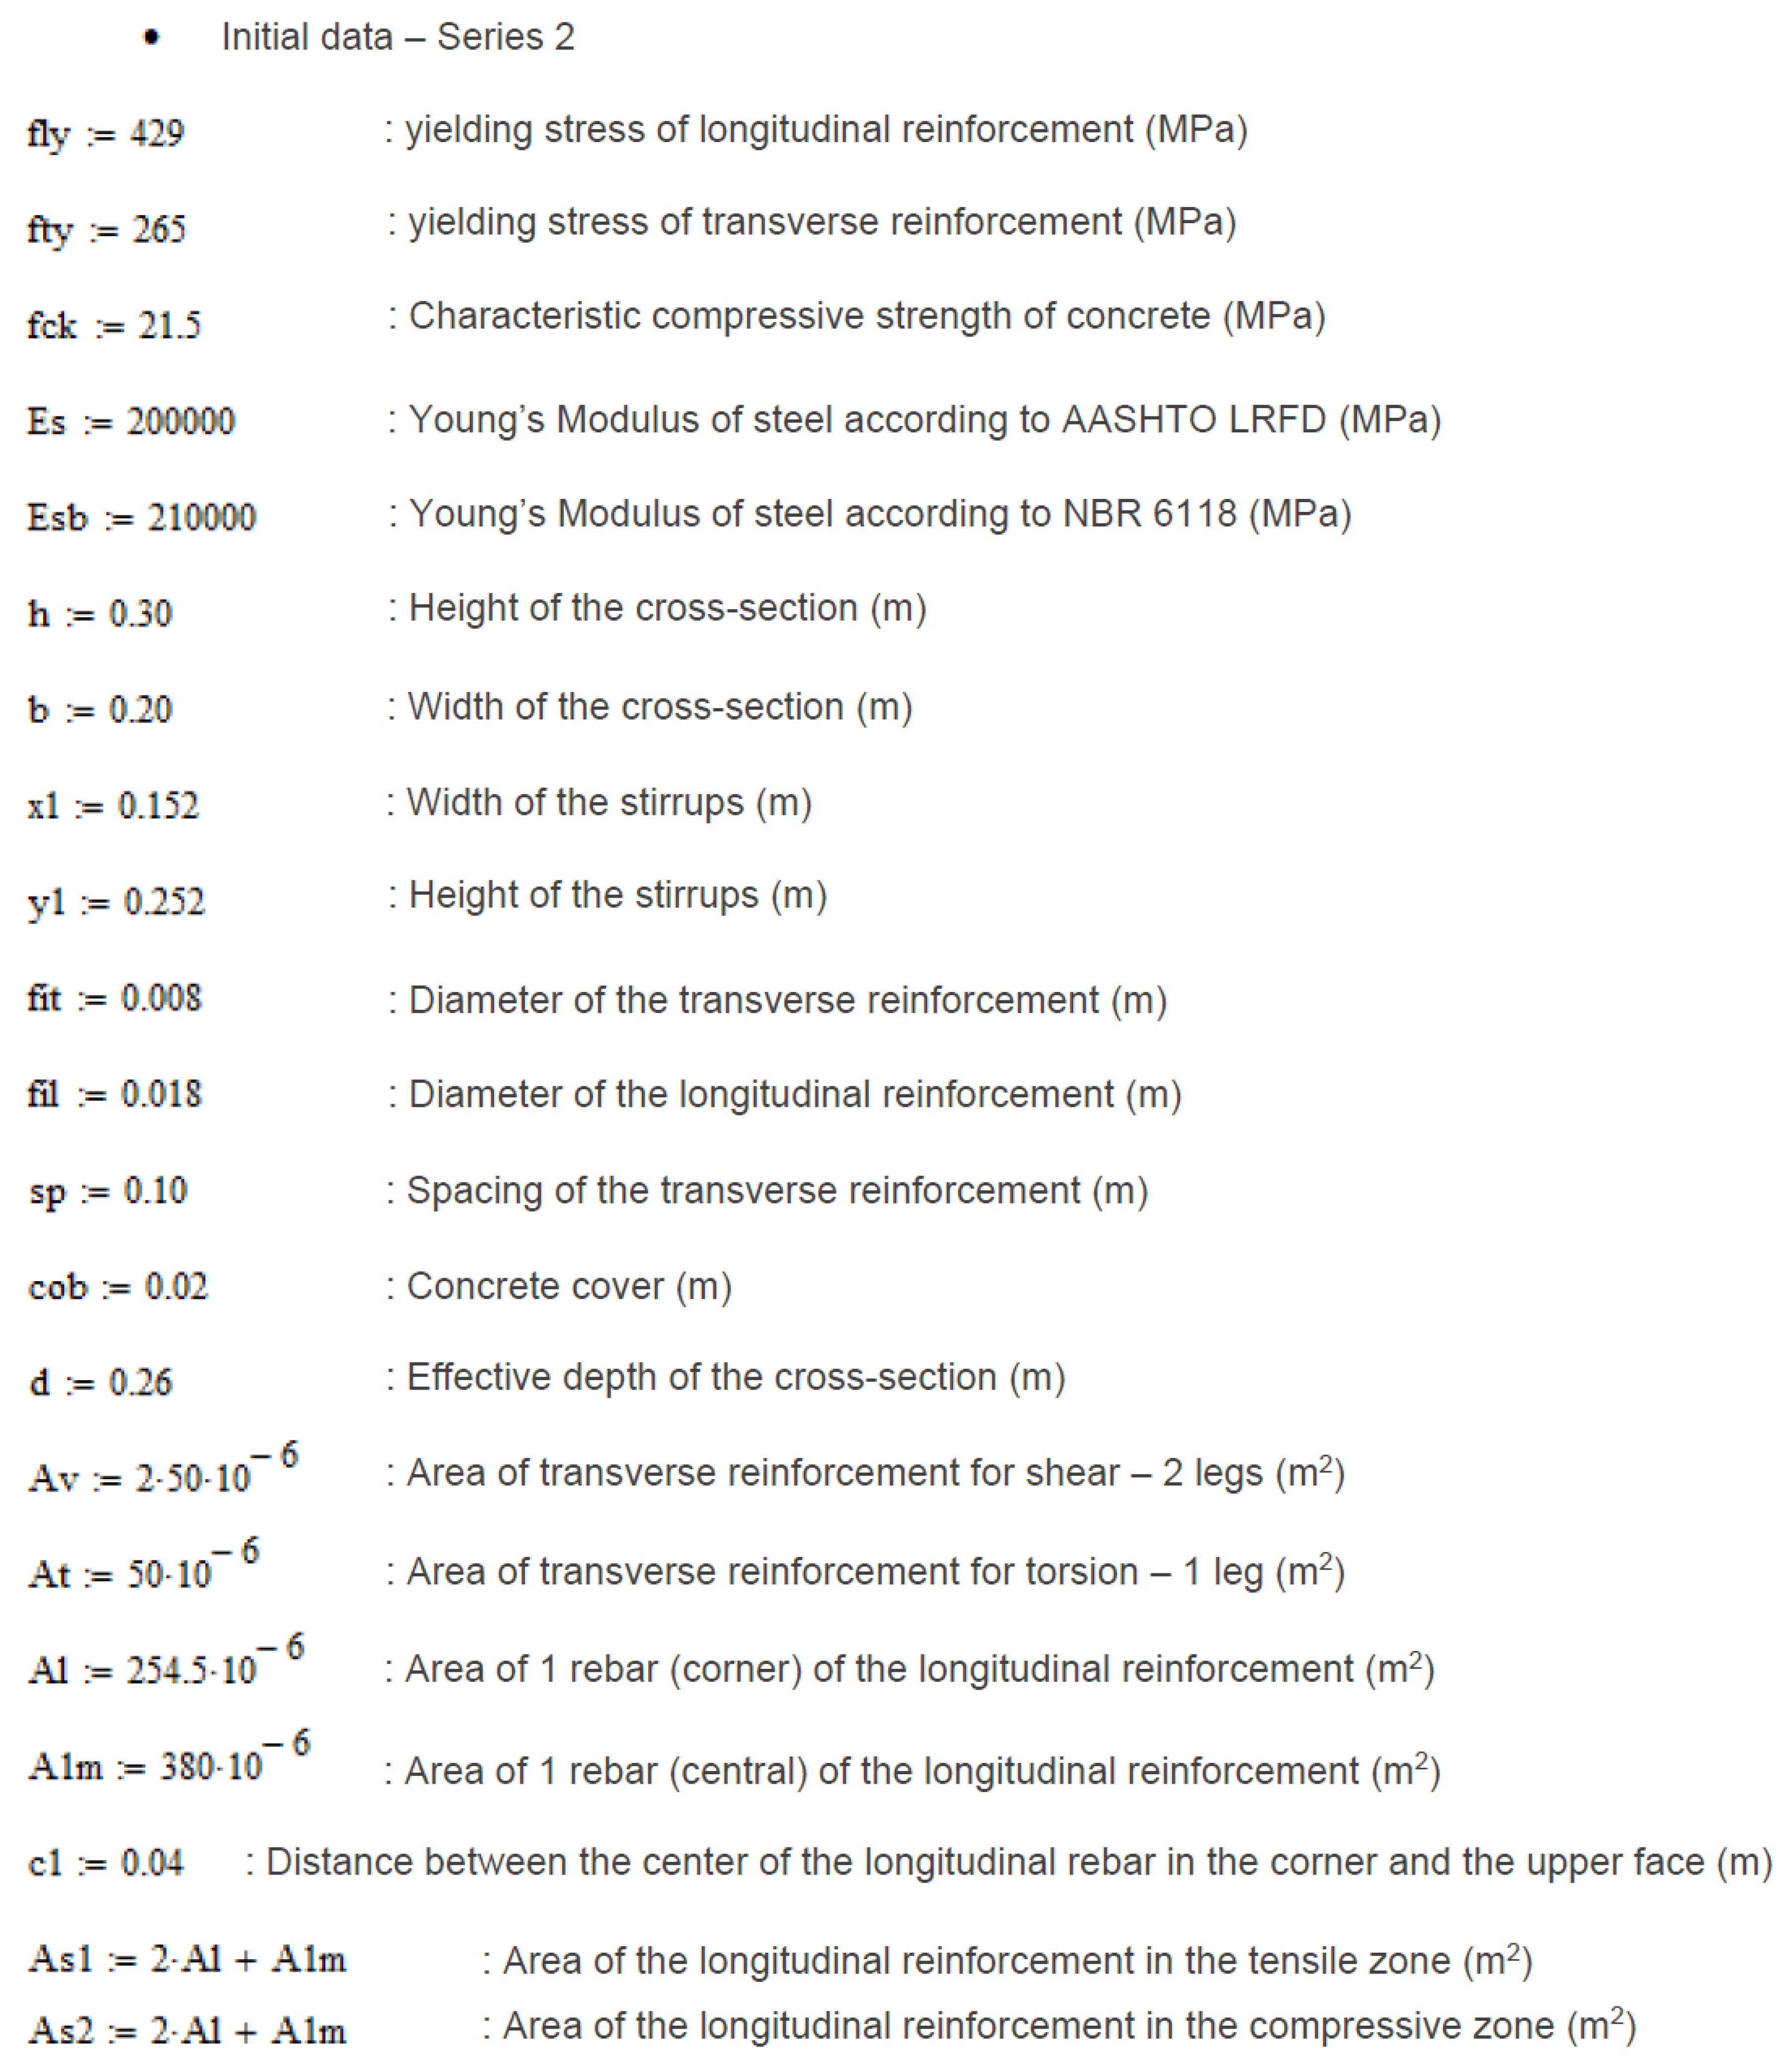
    • Detailing and amount of transverse and longitudinal steel reinforcement: A v , A t , A l , s and c . Where b = width of the cross-section (m); h = height of the cross-section (m); f y l = yielding stress for the longitudinal reinforcement (MPa); f y t = yielding stress for the transverse reinforcement (MPa); E s = Young’s modulus for steel (MPa); f c k = characteristic concrete compressive strength (MPa); A v = area of transverse steel reinforcement, considering two legs, to resist the acting shear force (m2); A t = area of transverse steel reinforcement, considering one leg, to resist the acting torque (m2); A l = area of one rebar of the longitudinal reinforcement (m2); s = longitudinal spacing between stirrups (m); c = concrete cover (m).
  • Compute the following initial parameters: x 1 , y 1 , ϕ t , ϕ l , d , d v , c 1 , A s 1 , A s 2 , A s l , A c p , p c , A 0 h , p h , A 0 and p 0 . Where x 1 = width of the stirrups (m); y 1 = height of the stirrups (m); ϕ t = diameter of transverse reinforcement rebar (m); ϕ l = diameter of longitudinal reinforcement rebar (m); d = effective depth of the cross-section (m); d v = effective thickness of the concrete diagonal strut (m); c 1 = distance between the axis of the longitudinal rebar in the corner and the outer face of the cross-section (m); A s 1 = area of the longitudinal reinforcement in the tensile zone (m2); A s 2 = area of the longitudinal reinforcement in the compressive zone (m2); A s l = total area of longitudinal reinforcement in the cross-section (m2); A c p = area of the cross-section (m2); p c = outer perimeter of the cross-section (m); A 0 h = area enclosed by the center line of stirrups (m2); p h = perimeter of the centerline of stirrups (m); A 0 = area enclosed by the centerline of flow of shear stress (m2); p 0 = perimeter of the centerline of flow of shear stress (m).
  • Calculate the torques and shear forces, including the maximum and equivalent values for the combined internal forces, according to the standards. As recommended for all numerical computations, variables are normalized to stay roughly in the range (−1, 1). Therefore, forces are scaled using the maximum allowable values according to the specific standard.
  • Define the objective function in terms of the parameters involved to calculate the strength for the acting internal forces. This function is defined according to Equation (3).
  • Maximize the objective function subject to design constraints, which are derived from limits related to the crushing of concrete struts, yielding of longitudinal reinforcement, and yielding of transverse reinforcement, among others.
Some parameters, such as the equivalent wall thickness ( h e ), the area enclosed by the flow of shear stress ( A 0 ), and the perimeter of the flow of shear stress ( p 0 ) are difficult to compute according to the standard clauses and in the context of the optimization problem. This aspect is discussed in detail later.

Post-Processing

The objective function to be maximized in the aforementioned Step 5 is a function of the angle α which relates each maximum radius with the acting shear force and torque. The solution vector R obtained in Step 5 can be declared in the maximization calculation procedure according to Equation (3) as follows:
R ( α ) = M a x i m i z e ( f , r )
The angle α is defined as a function of the requested number of points, n , required to generate the torsion–shear interaction curve according to the model presented in Figure 2. Knowing that this angle ranges between 0° and 90°, a reference angle θ 1 is defined as follows:
θ 1 = 1 n π 2
From Equation (5), it can be stated that when n = 1 , θ 1 is equal to π / 2 , and, consequently, the acting torque is maximum. For a very large n , the angle is approximately equal to zero and the acting shear force is maximum. Thus, angle α can be defined as follows:
α = i θ 1 f o r i = 1 n
Finally, the solution vectors for the acting shear force concomitant with the acting torque in the RC cross-section can be defined from Equations (1) and (2) as follows:
V = r ( i θ 1 ) cos ( i θ 1 ) V max
T = r ( i θ 1 ) sin ( i θ 1 ) T max

2.3. Constraints from NBR 6118

The constraints related to NBR 6118 [32] clauses for the design and analysis of RC members under combined torsion and shear can be derived from the following requirements:
First, the angle of the concrete struts, θ , according to the clauses to calculate the shear strength using model II from NBR 6118 (Clause 17.4.2.3), varies between a minimum, θ min , and a maximum, θ max , value of 30° and 45°, respectively, as follows:
θ min θ θ max
Second, Clause 17.5.1.4.1 imposes some limits to compute the equivalent wall thickness, h e , according to the following [32]:
{ 2 c 1 h e A u ,   for A u 2 c 1 h e = A u b w 2 c 1 ,   for A u < 2 c 1
where A = area of the solid cross-section; u = perimeter of the solid cross-section; c 1 = distance between the center of the rebar in the corner and the outer face of the member; b w = width of the cross-section.
In the first case stated in Equation (10), for A / u 2 c 1 , h e can vary between the minimum 2 c 1 and the maximum A / u values. For the second case, for A / u < 2 c 1 , h e is well-defined, and both the lower and upper bounds can be stated from its value. Thus, regardless of the case, the following constraint for the thickness h e can be stated:
h e , min h e h e , max
Third, two additional constraints are derived for the distance between the middle plane of the equivalent walls and the outer face of the cross-section, c 0 . As c 0 is a function of h e , the first constraint arises from this dependency and can be written as follows:
c 0 , min c 0 c 0 , max
To avoid convergence problems during the optimization procedure, parameter c 0 is imposed to be higher than or equal to half the equivalent wall thickness, h e . This constraint is conservative, because the smaller h e , the smaller c 0 , and the higher the solicitation in the cross-section. The second constraint for c 0 is defined as follows:
0.5 h e c 0
The area enclosed by the shear flow, A e , and the perimeter of the shear flow, u e , can be calculated as a function of the equivalent wall thickness, h e , or from the distance between the middle plane of the equivalent wall and the outer face of the cross-section, c 0 . For the latter, the following equation can be written:
{ A e ( c 0 ) = ( b 2 c 0 ) ( h 2 c 0 ) u e ( c 0 ) = p c 8 c 0
Fourth, Clause 17.4.2.3 establishes the following limits for the design values of the acting shear force:
  • The acting shear force in the cross-section, V , must not exceed the design shear strength corresponding to the crushing of the concrete diagonal struts, V R d 2 , as follows [32]:
    V ( r , α ) V R d 2 ( θ )
    V R d 2 = 0.54 α v 2 f c k b w d sin θ cos θ
    α v 2 = ( 1 f c k 250 ) , f c k   in   MPa
  • The acting shear force in the cross-section, V , must not exceed the design shear strength corresponding to the failure due to diagonal tension, V R d 3 , as follows [32]:
    V ( r , α ) V R d 3 ( r , α , θ )
    V R d 3 = V c + V s w
    where V c = V c 1 for simple bending and for bending combined with tensile axial force (with the neutral axis located in the cross-section). V c 1 is defined as V c 1 = V c 0 when V S d V c 0 , and V c 1 = 0 when V S d = V R d 2 (linear interpolation can be used for intermediate values). V c 0 is defined as follows [32]:
    V c 0 = 0.6 f c t k , inf b w d
    f c t k , inf = 0.21 f c k 2 / 3 ,   f c k   in   MPa
    V s w = A s w f y w d 0.9 d s cot θ
    where V c 0 = shear strength contributed by the concrete for simple bending and for bending combined with tensile axial force (with the neutral axis located in the cross-section); f c t k , inf = inferior characteristic tensile strength of concrete; V s w = shear strength contributed by the transverse reinforcement; A s w = area of transverse reinforcement; f y w d = design yielding stress of the transverse reinforcement.
Fifth, to compute the torsional strength, Clause 17.5 provides three additional constraints which can be deduced as follows:
  • The acting torque in the cross-section, T , must not exceed the limit corresponding to the strength of the concrete diagonal struts, T R d 2 [32], as follows:
    T ( r , α ) T R d 2 ( θ , h e , c 0 )
    T R d 2 = 0.5 α v 2 f c k A e h e sin ( 2 θ )
    α v 2 = ( 1 f c k 250 ) ,   f c k   in   MPa
  • The acting torque in the cross-section, T , must not exceed the limit corresponding to the strength of the stirrups, T R d 3 [32], as follows:
    T ( r , α ) T R d 3 ( θ , c 0 )
    T R d 3 = A 90 f y w d 2 A e s cot θ
    where A 90 represents the area of one leg of the transverse reinforcement build with stirrups normal to the longitudinal axis (90°).
  • The acting torque in the cross-section, T , must not exceed the limit corresponding to the strength of the longitudinal reinforcement, T R d 4 [32], as follows:
    T ( r , α ) T R d 4 ( θ , c 0 )
    T R d 4 = A s l 2 A e f y w d u e tg θ
Sixth, according to Clause 17.7.2, the total transverse reinforcement can be determined by adding the transverse reinforcement required to resist the design shear force, V S d , with the transverse reinforcement required to resist the design torque, T S d . Thus, the equation to compute the transverse reinforcement for the combined torsion and shear loading is the following:
A w + 90 s = A w s + 2 A 90 s
Substituting the areas of transverse reinforcement per unit length for the shear force, from Equation (22), and for the torque, from Equation (27), into Equation (30), gives the following:
A w + 90 s = V s w f y w d 0.9 d cot θ + T f y w d A e cot θ
Considering V s w = max { V V c , 0 } , Equation (31) can be rewritten as follows:
A w + 90 s = max { V V c , 0 } f y w d 0.9 d cot θ + T f y w d A e cot θ
From Equation (23), the following constraint can be stated as follows:
V ( r , α ) V c ( r , α , θ ) f y t 0.9 d cot θ + T ( r , α ) f y t A e ( c 0 ) cot θ A v + t s
The first term in the left-hand side of Equation (33) represents the required transverse reinforcement per unit length to resist the acting shear. The numerator of this term represents the contribution of the stirrups for the shear strength, V s . Therefore, this quantity cannot be negative, since a negative value would mean that the concrete contribution for shear, V c , is sufficient to resist the full acting shear force and that all existing transverse reinforcement in the cross-section is only required for the torsional strength. This leads to a new constraint related with the transverse reinforcement, as follows:
0 A v s n
A v s n = V ( r , α ) V c ( r , α , θ ) f y t 0.9 d cot θ
Seventh, according to Clause 17.7.2.2, the crushing of the concrete diagonal strut must be checked using the following requirement [32]:
V S d V R d 2 + T S d T R d 2 1
Hence, the following new following constraint can be stated:
V ( r , α ) V R d 2 ( θ ) + T ( r , α ) T R d 2 ( θ , h e , c 0 ) 1
Eighth and finally, the last constraint is deduced from the cut-off point rule of the tensile force diagram, as stated in Clause 17.4.2.2 [32], as follows:
cot θ ( T ( r , α ) u e ( c 0 ) 4 A e ( c 0 ) + V ( r , α ) 2 ) F s
The first term of the sum inside the parentheses in Equation (38) is derived from the equation to compute the torque as a function of the longitudinal reinforcement, according to Equation (29), and considering half of the perimeter enclosed by the shear flow in the tensile zone, u e / 2 . F s represents the strength force of the longitudinal reinforcement in the tensile zone of the cross-section.

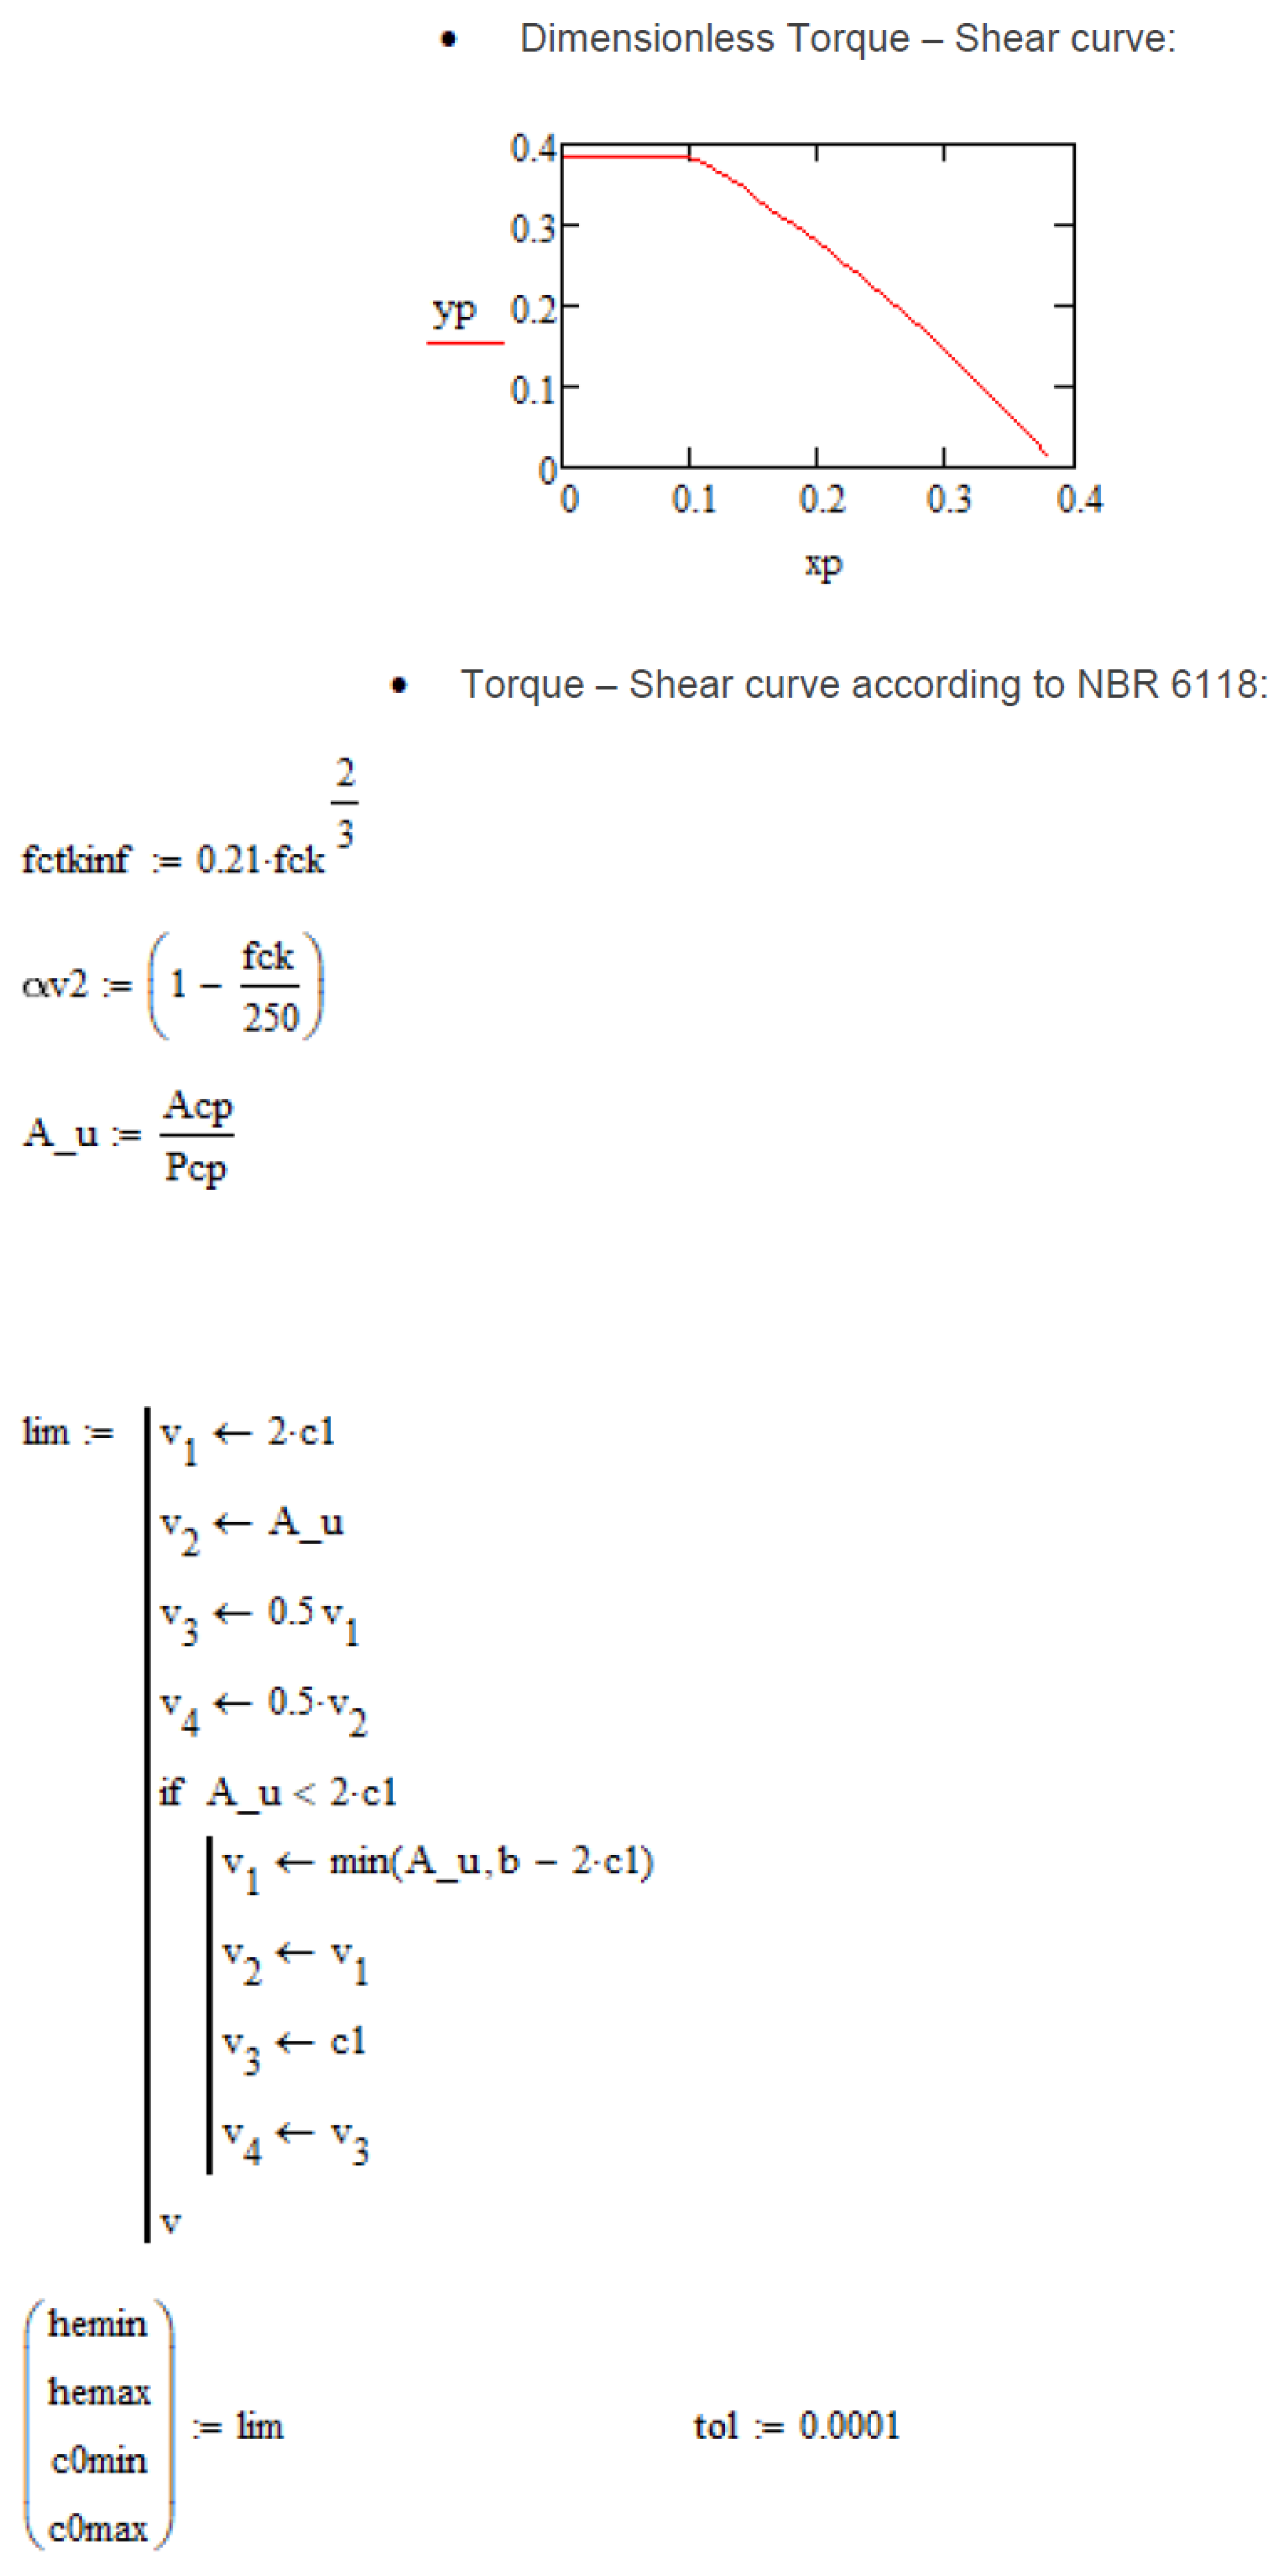
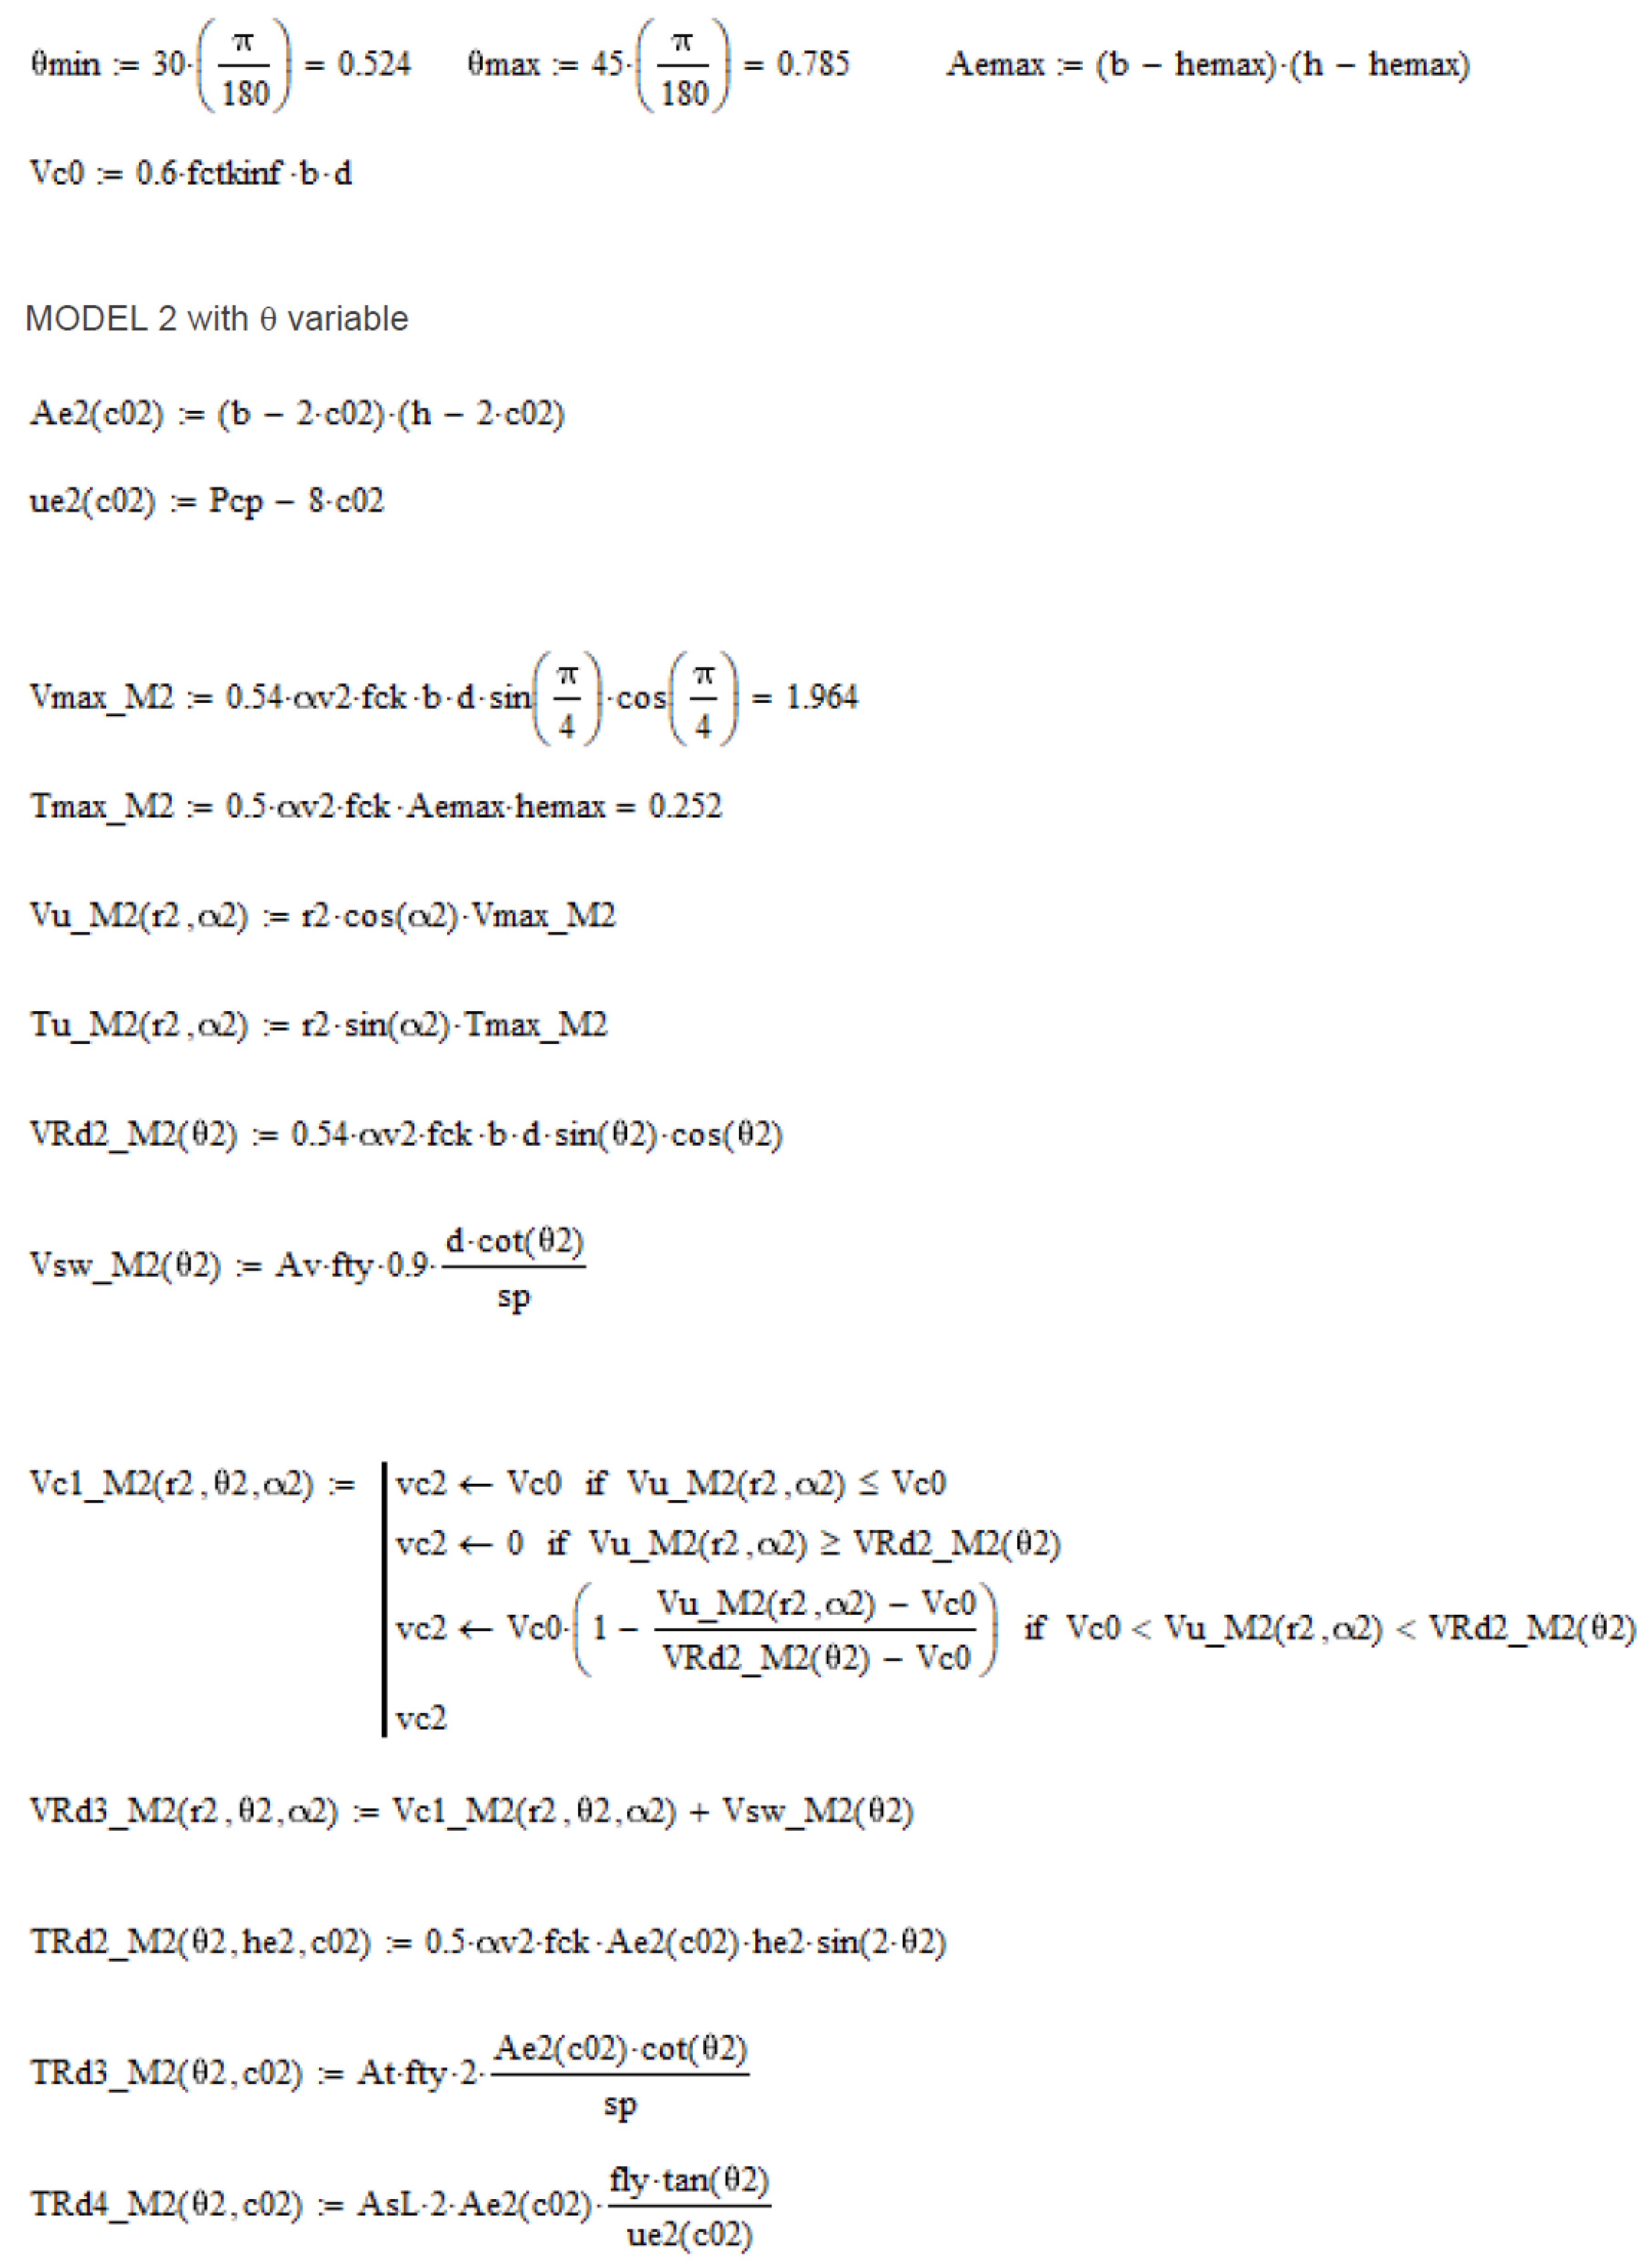
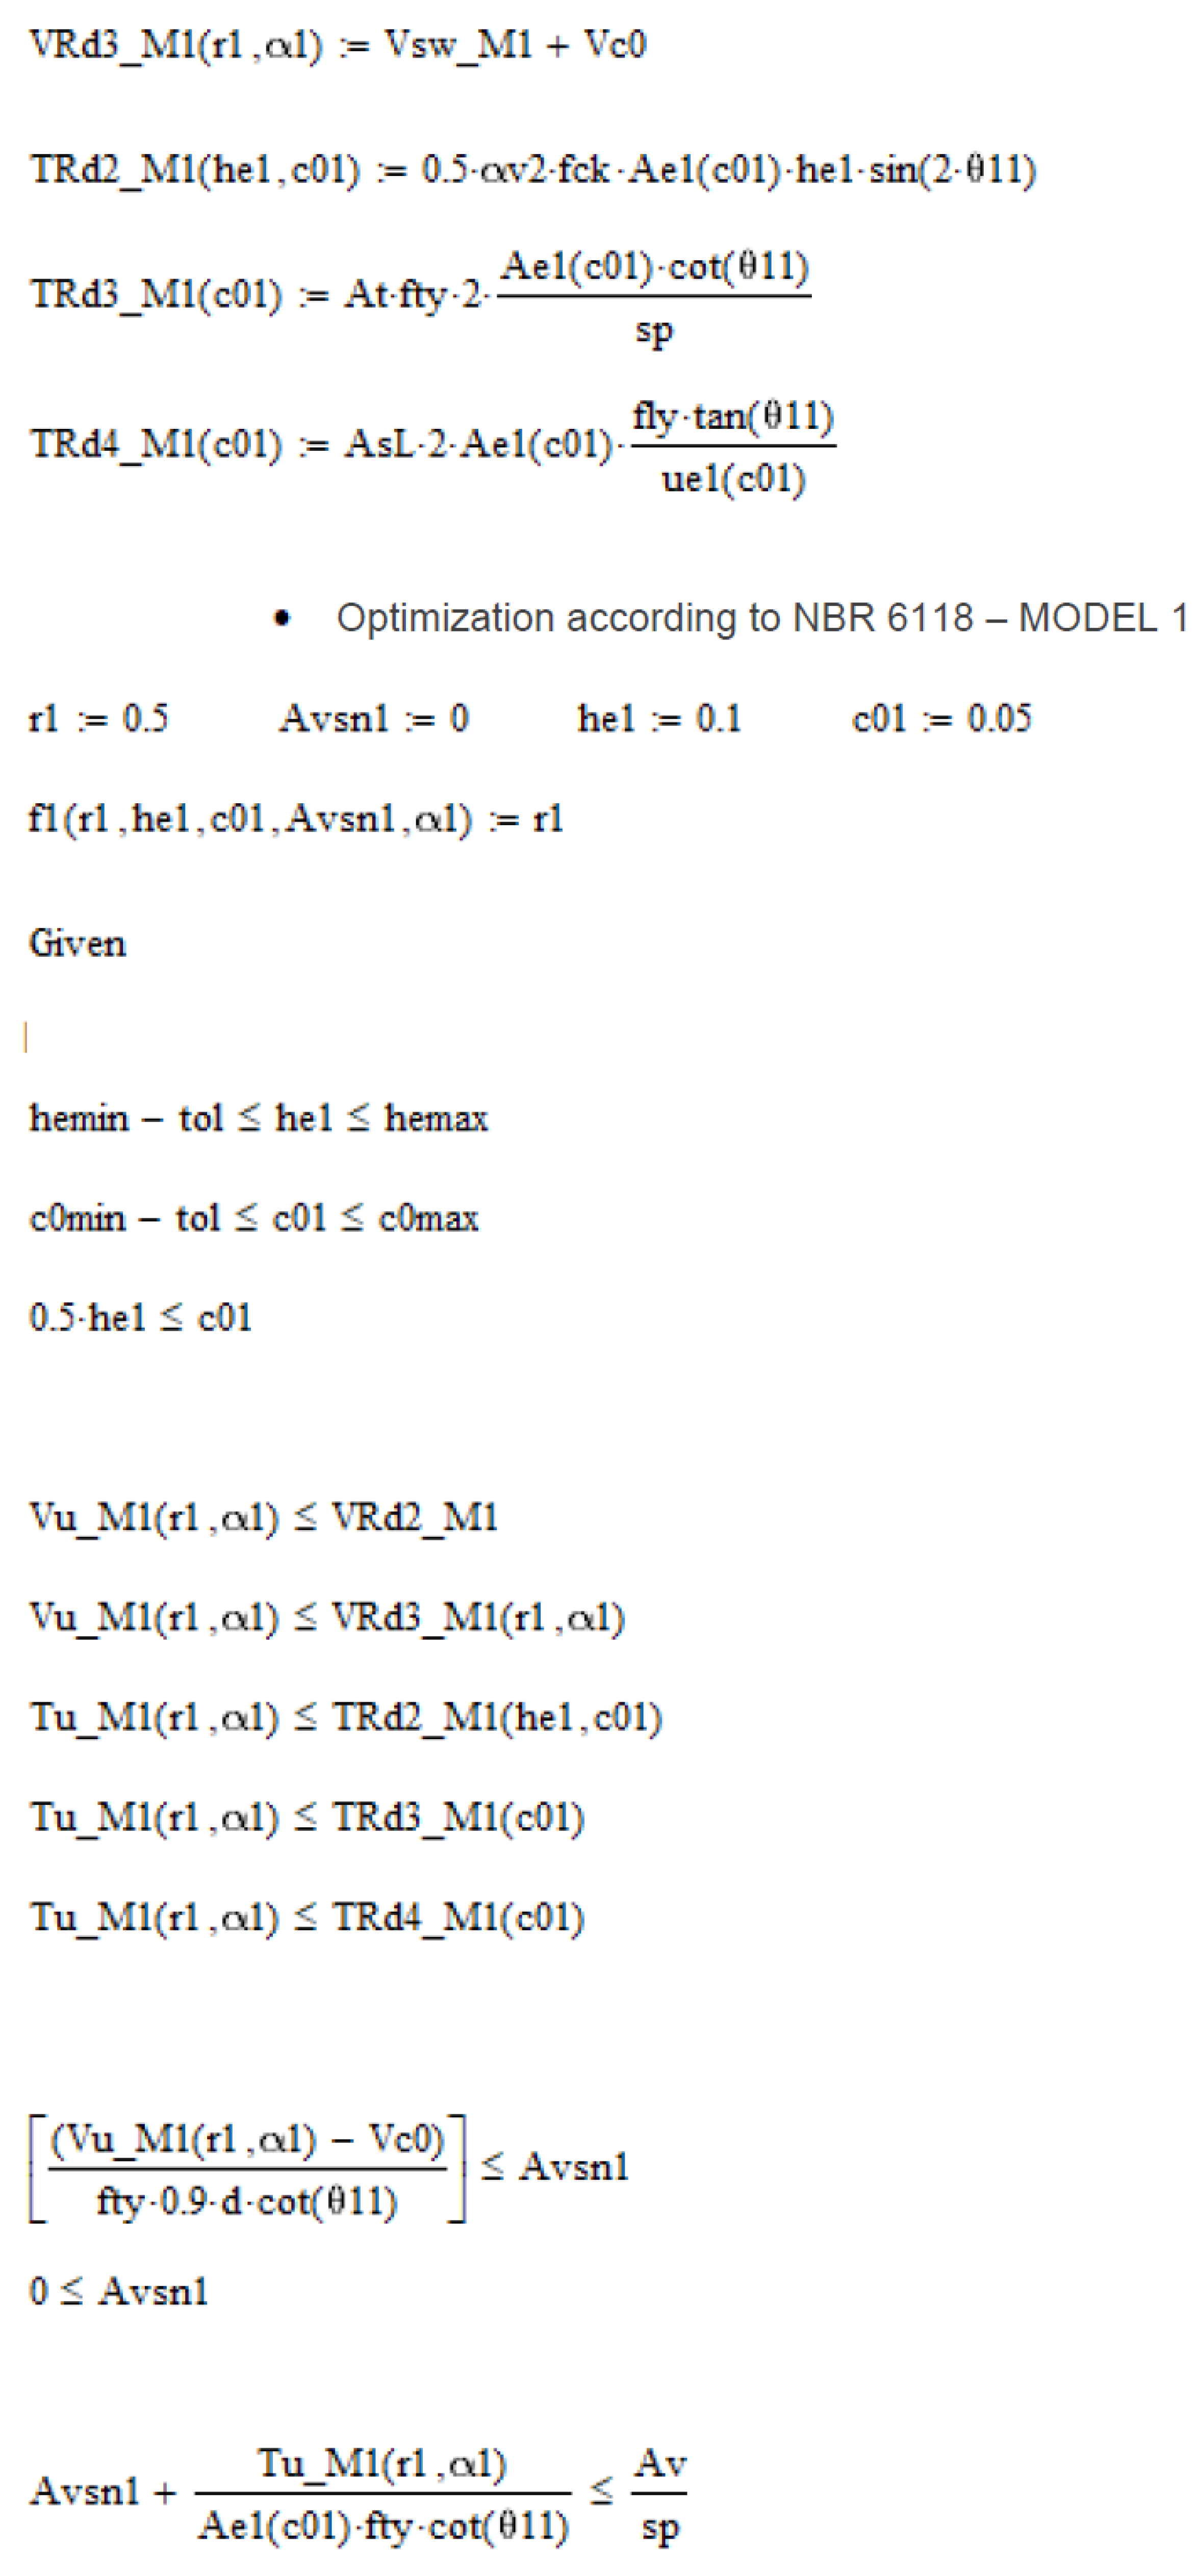
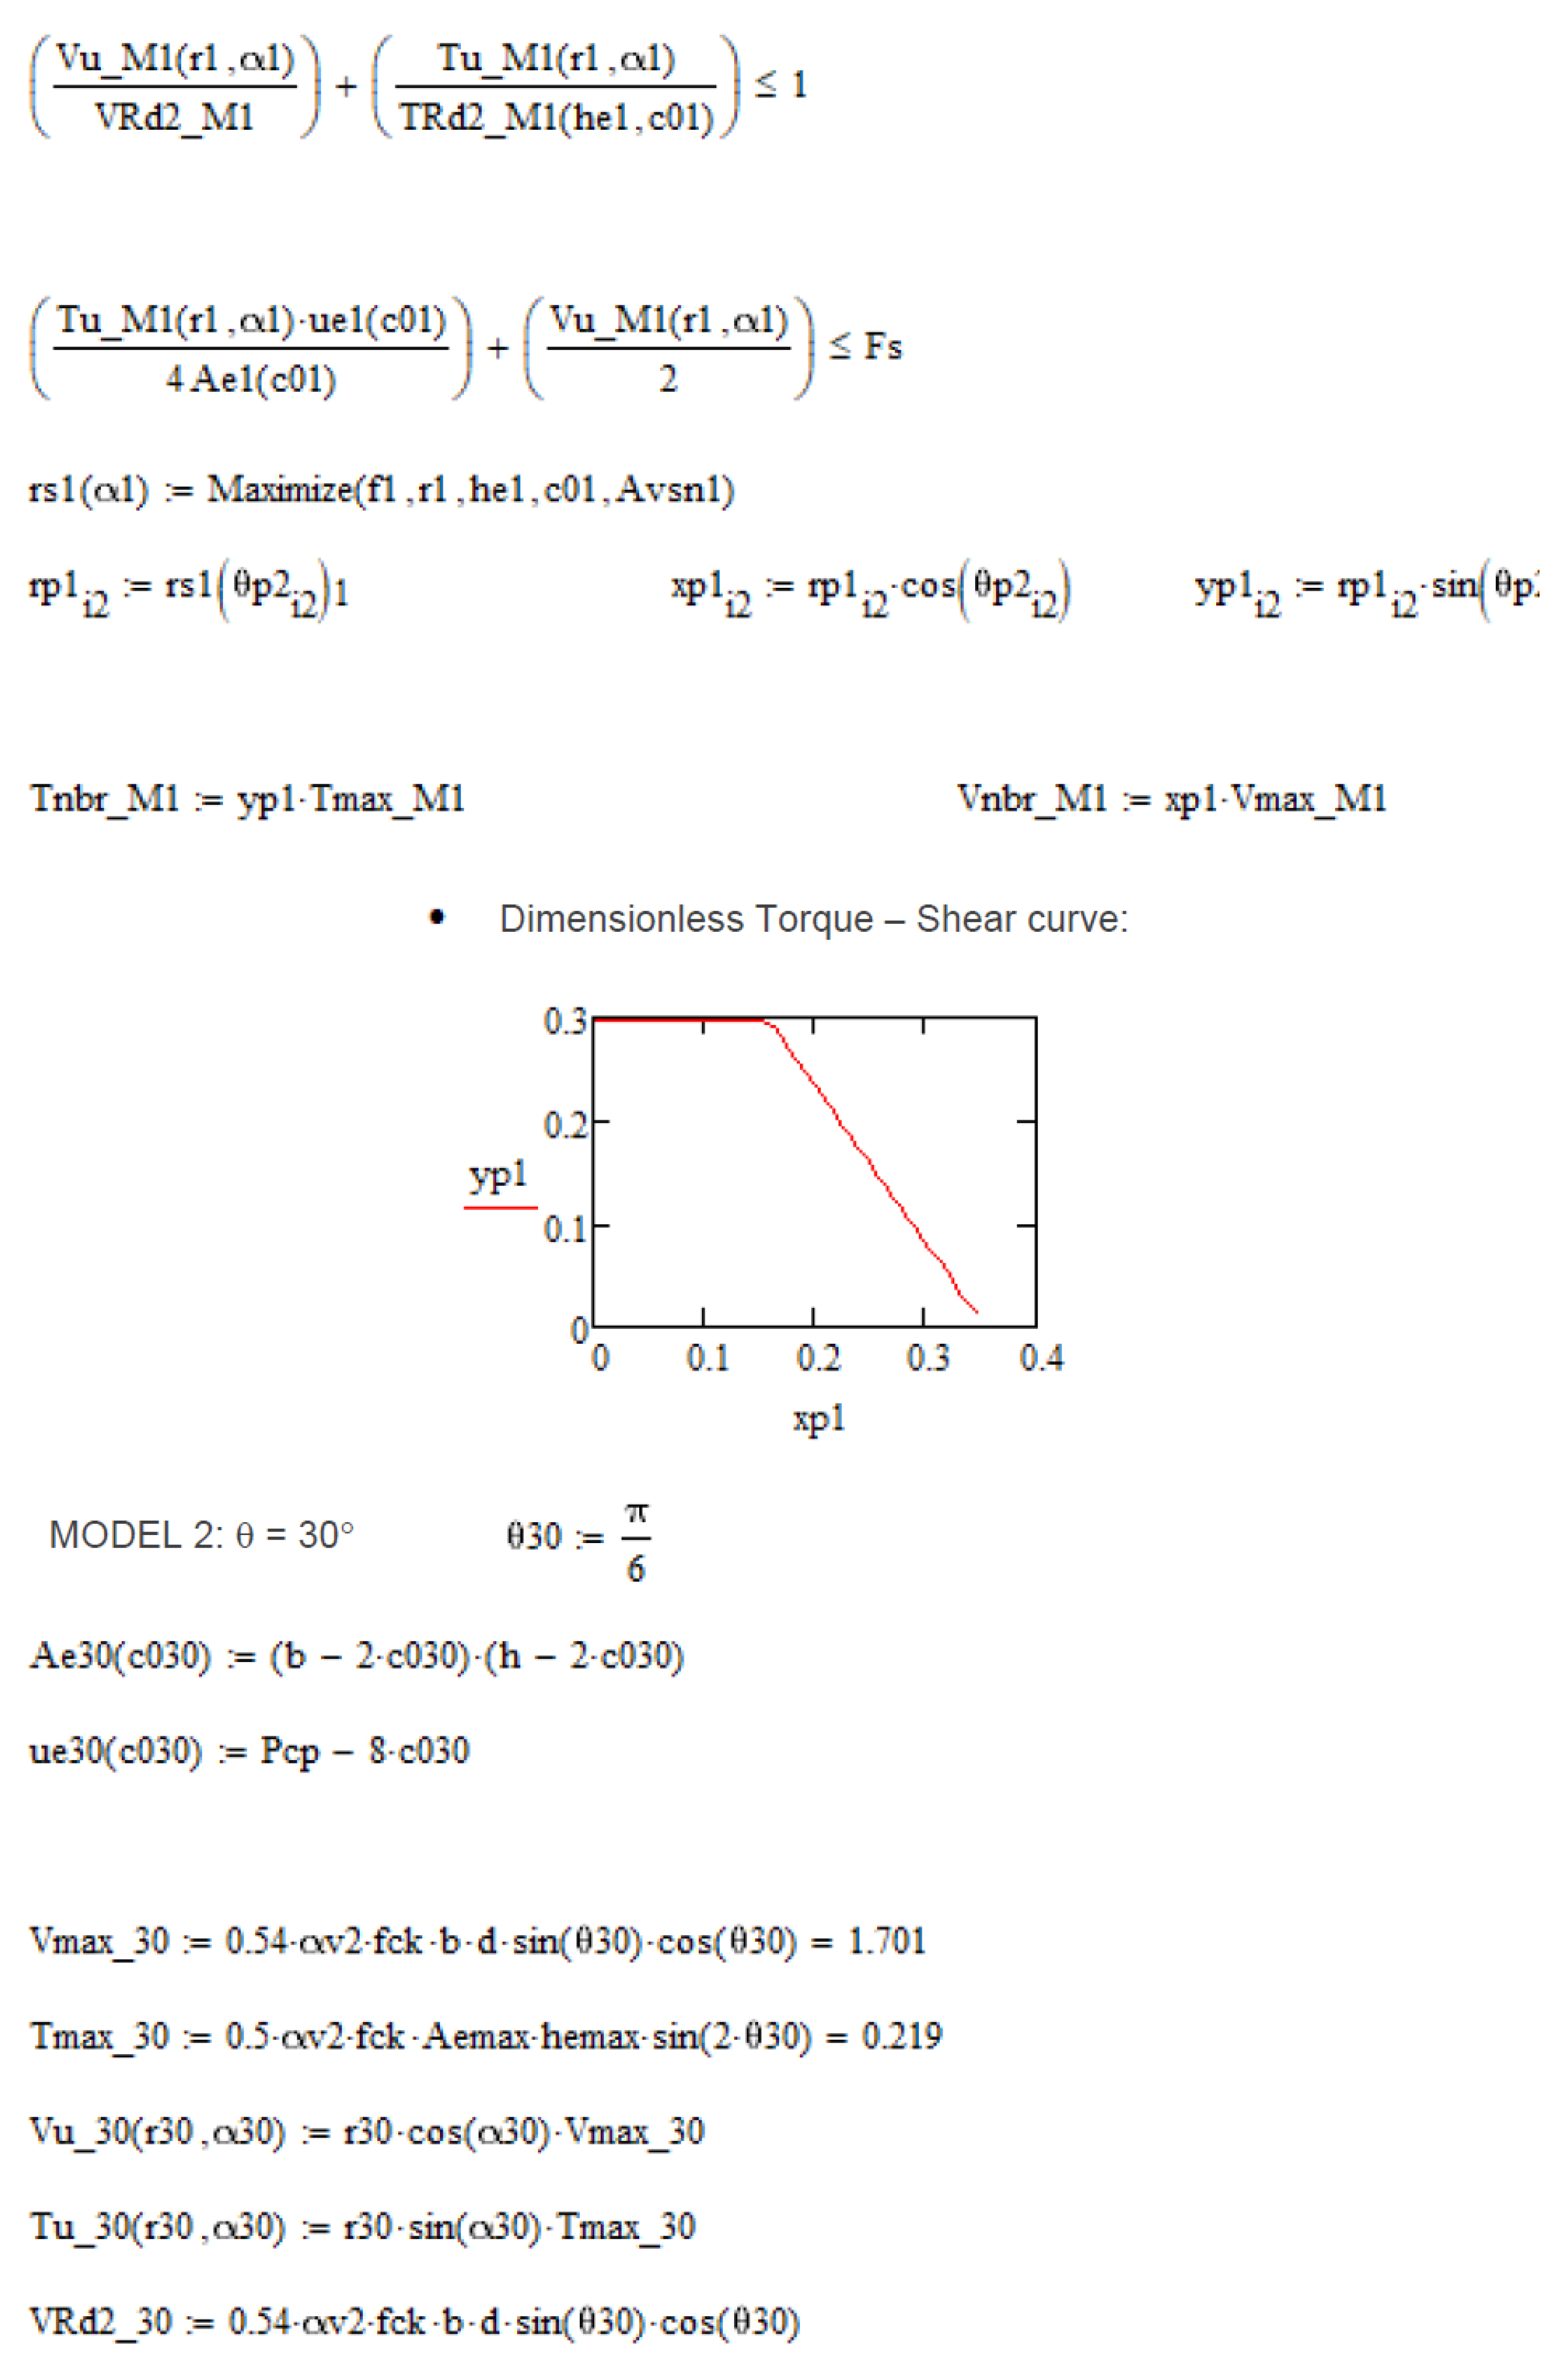
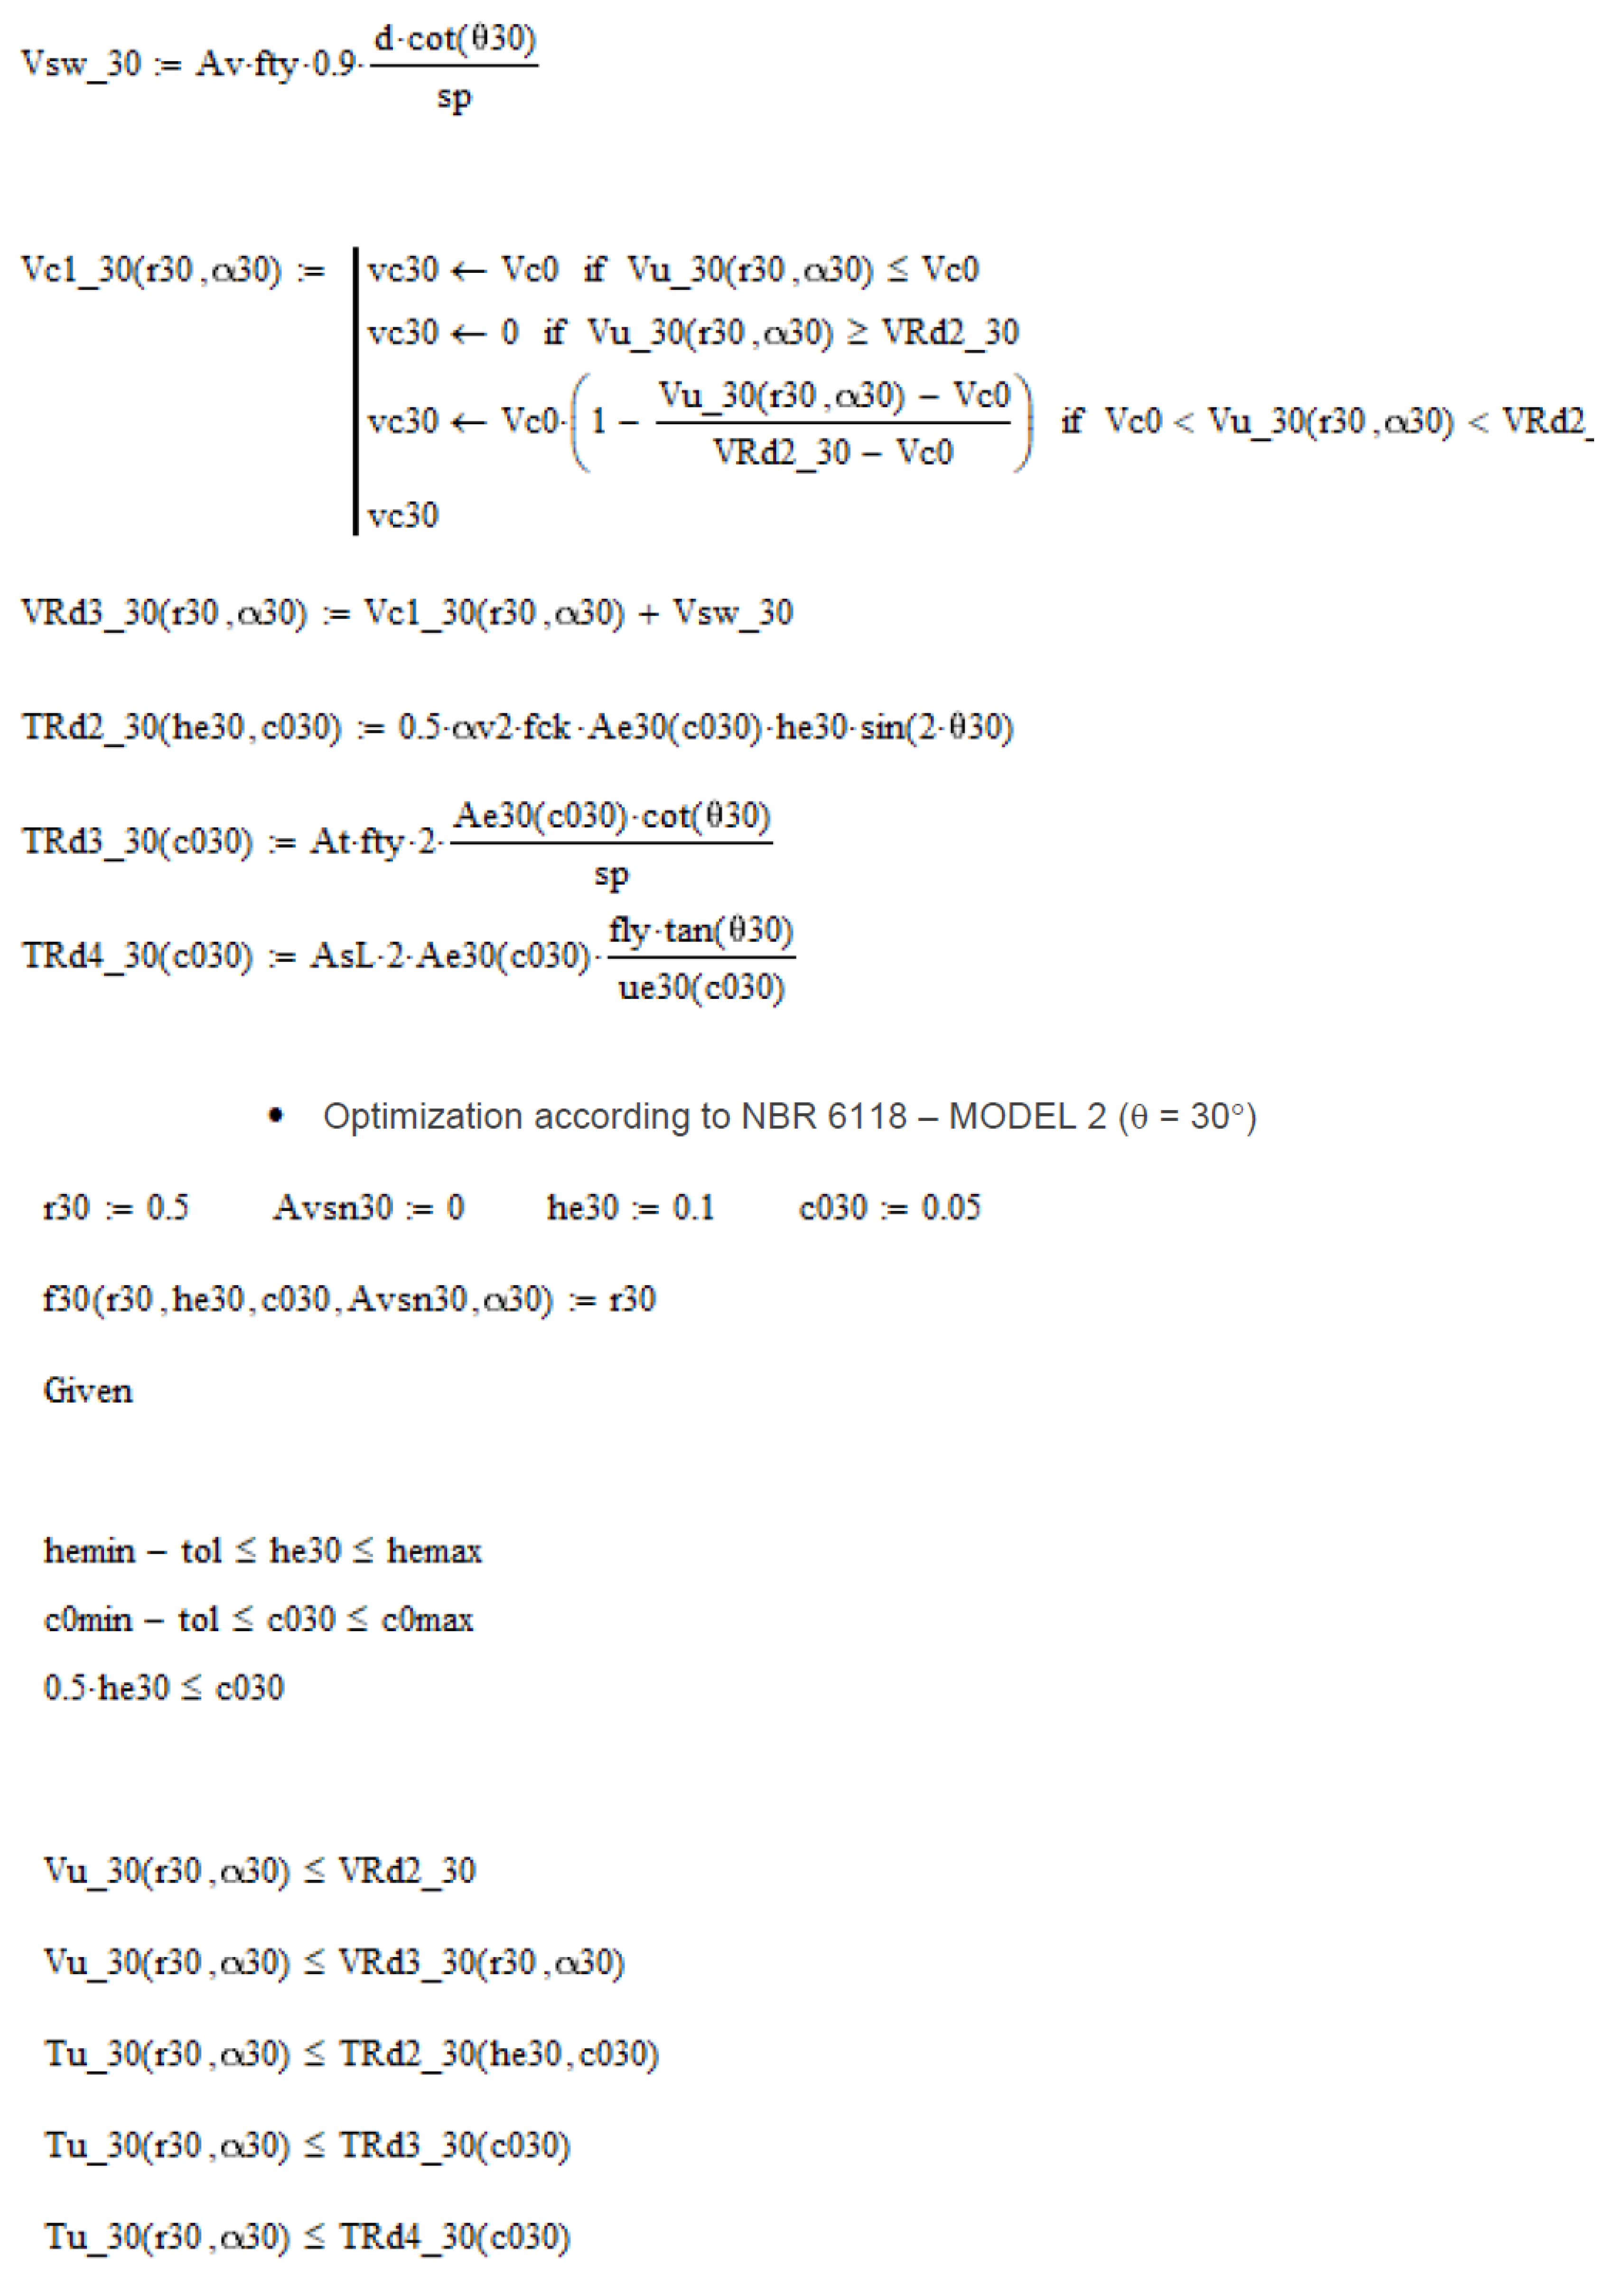
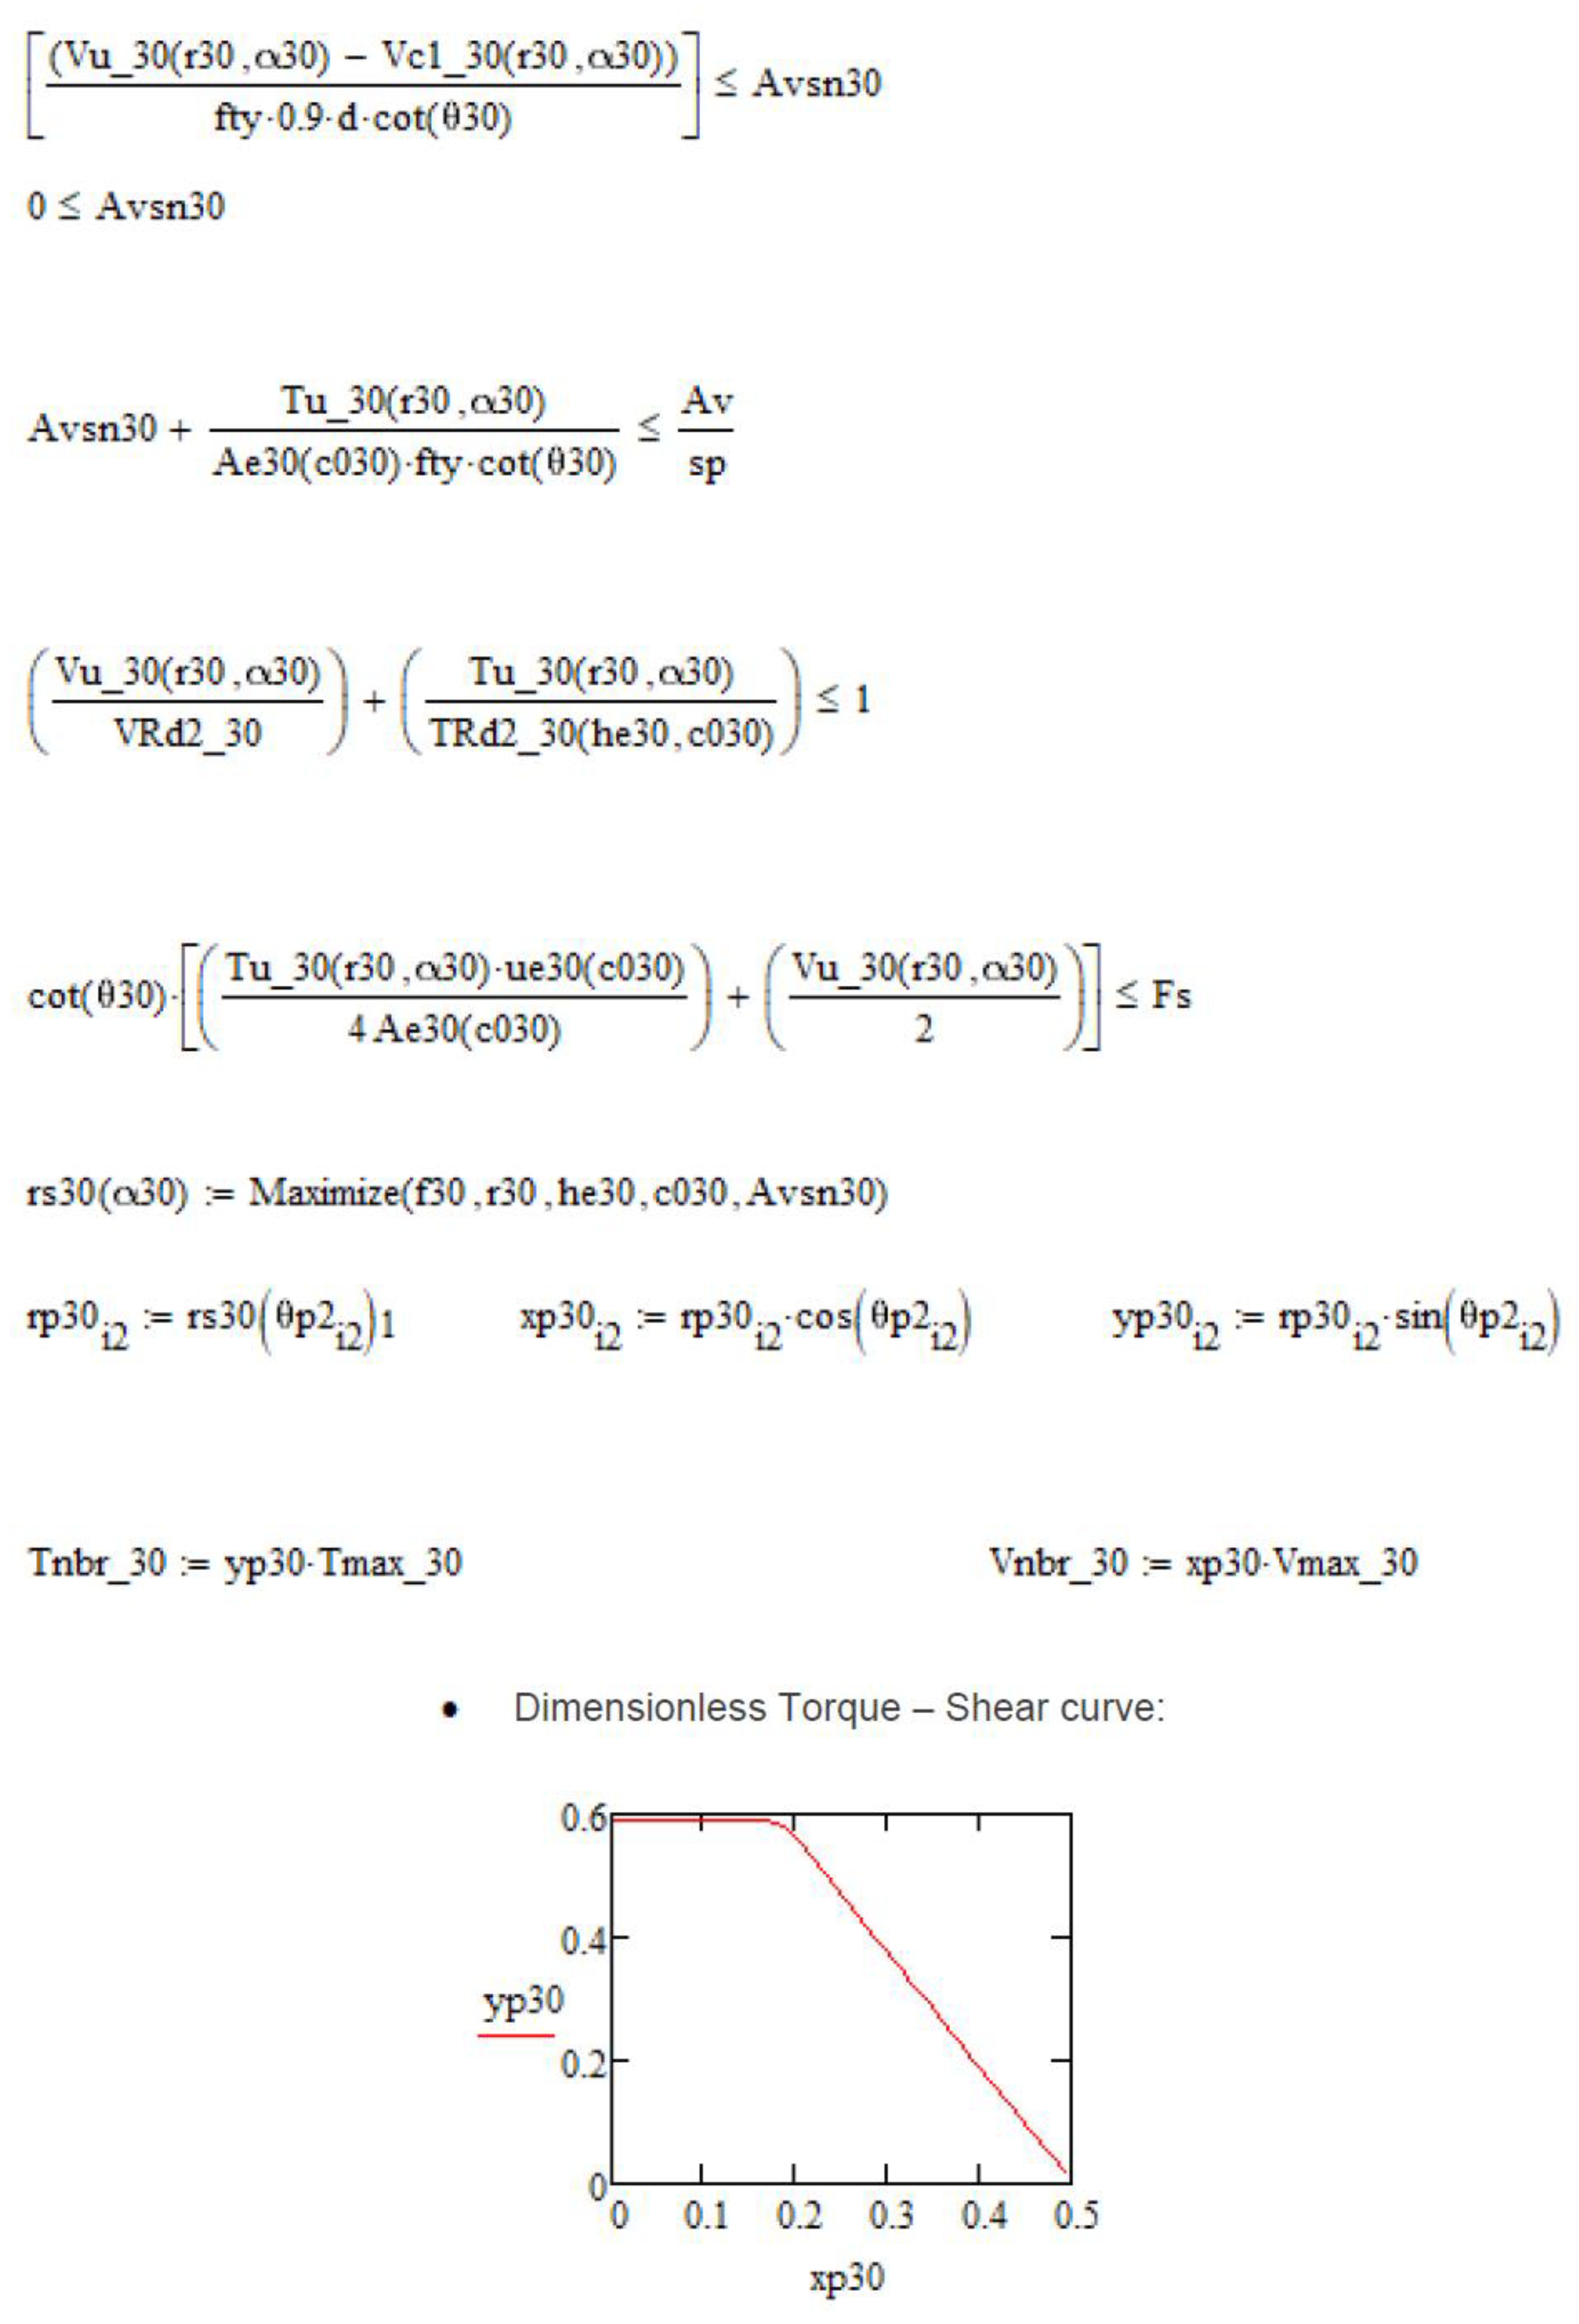
2.4. General Formulation for the Optimization Problem According to NBR 6118

In its general form, the optimization problem related with the analysis of RC cross-sections under combined torsion and shear, according to NBR 6118 [32], can be stated in a canonical way as follows:
( P ) { M a x i m i z e f ( r , α , θ , h e , c 0 , A v s n ) = r S u b j e c t t o : θ min θ θ max h e , min h e h e , max c 0 , min c 0 c 0 , max 0.5 h e c 0 V ( r , α ) V R d 2 ( θ ) V ( r , α ) V R d 3 ( r , α , θ ) T ( r , α ) T R d 2 ( θ , h e , c 0 ) T ( r , α ) T R d 3 ( θ , c 0 ) T ( r , α ) T R d 4 ( θ , c 0 ) V ( r , α ) V c ( r , α , θ ) f y t 0.9 d cot θ A v s n 0 A v s n A v s n + T ( r , α ) f y t A e ( c 0 ) cot θ A v + t s V ( r , α ) V R d 2 ( θ ) + T ( r , α ) T R d 2 ( θ , h e , c 0 ) 1 cot θ ( T ( r , α ) u e ( c 0 ) 4 A e ( c 0 ) + V ( r , α ) 2 ) F s
The general Mathcad code for the optimization calculation procedure can be found in Appendix A.

2.5. Constraints from AASHTO LRFD

For the sake of clarity, and according to AASHTO LRFD [31], the following strengths for RC members are defined:
  • R n = Nominal resistance (strength) is defined as the resistance of a component or connection to force effects, as indicated by the dimensions specified in the contract documents and by permissible stresses, deformations, or specified strength of materials;
  • R r = Factored (design) resistance is defined as the nominal resistance multiplied by a resistance factor, i.e., R r = ϕ R n . The resistance factor, ϕ , is defined to be a statistically-based multiplier applied to nominal resistance accounting primarily for variability of material properties, structural dimensions and workmanship, and uncertainty in the prediction of resistance, but also related to the statistics of the loads through the calibration process;
  • R u = Ultimate resistance (strength) is the limit related to the strength and stability during the design life.
The specific definitions for the resisting internal forces according to AASHTO LRFD are used in this section.
The constraints related to AASHTO LRFD clauses for the design and analysis of RC members under combined torsion and shear can be derived from the following requirements:
First, the limit for the acting shear force in RC cross-sections according to Clause 5.8.3.3-2, is given by the following [31]:
V u = 0.25 f c k b d v
Clause 5.8.3.6 requires that the ultimate shear, V u , defined for the case with no torque, must be replaced by the equivalent shear due to combined torsion and shear to calculate the longitudinal deformation in the tensile zone. From this, it can be deduced that the equivalent shear force in the RC cross-section must not exceed the limit established for the acting shear force, as follows:
V e q ( r , α ) V u
For solid cross-sections, the following equation applies [31]:
V u , e q = V u 2 + ( 0.9 p h T u 2 A 0 ) 2
where T u and d s represent the ultimate torque and the effective depth of the RC cross-section, respectively. The other parameters were defined earlier. Equation (41) checks the crushing of the concrete diagonal struts due to combined torsion and shear.
Second, regarding the yielding strength of the transverse reinforcement for the case of combined torsion and shear, Clause 5.8.3.6 provides the constraints based on the same concepts stated by Equation (30). According to Clauses 5.8.3.3-4 and 5.8.3.6.2-1, Equations (43) and (44) for the shear and torsional strengths resisted by the stirrups, respectively, can be stated as follows [31]:
V s = A v f t y d v s cot θ
T n = 2 A 0 A t f t y cot θ s
where T n is the nominal resistance of the torque with no shear force. The other parameters were defined earlier.
Substituting in Equation (30), the areas of transverse reinforcement per unit length for shear from Equation (43), and for torsion from Equation (44), the following equation can be written:
A v + t s = V s f y t d v cot θ + T f y t A 0 cot θ
Considering V s = V V c , Equation (45) is rewritten as follows:
V ( r , α ) V c ( r , α ) f y t d v cot ( θ ( r , α ) ) + T ( r , α ) f y t A 0 cot ( θ ( r , α ) ) A v + t s
The shear strength resisted by the stirrups, A s = V A c , cannot be negative, so the following constraint holds:
0 A v s n
A v s n = V ( r , α ) V c ( r , α ) f y t d v cot ( θ ( r , α ) )
The shear strength resisted by the concrete is stated in Clause 5.8.3.3-3 as follows [31]:
V c = 0.083 β f c k b d v
Factor β is defined as the capacity of the concrete struts to transfer tensile and shear forces. Considering that the amount of reinforcement for shear existing in the RC cross-section is higher than the minimum amount required in Clause 5.8.3.4.2-1, this factor is calculated as follows [31]:
β = 4.8 ( 1 + 750 ε s ) for A v A v , min
The previous equation also incorporates the influence of the longitudinal deformation for the contribution of the concrete struts, ε s . This parameter is defined in Clause 5.8.3.4.2-4 as the longitudinal deformation in the centroid of the longitudinal reinforcement located in the tensile zone of the RC cross-section. According to Bentz and Collins [38], the ultimate shear strength in RC members is influenced by several factors, namely section geometry, acting internal forces, and reinforcement ratios, among others. To account for all these effects, a single parameter is incorporated, which is the longitudinal deformation ε s . The higher this deformation is, the higher the crack width and, therefore, the smaller the aggregate interlock effect and the smaller value for V c . The reduction in the shear strength as the longitudinal deformation increases can be called the “deformation effect”. In RC members, this deformation can be calculated as follows [31]:
ε s = ( ( | M u | d v + 0.5 N u + | V u | ) ) E s A s
where M u = ultimate bending moment; N u = ultimate axial force; V u = ultimate shear force; A s = area of longitudinal reinforcement in the tensile zone.
The angle of the concrete struts to the longitudinal axis, θ , is also influenced by the geometric factors, the acting internal forces, and the reinforcement ratios. Consequently, the angle θ can be determined as a function of the longitudinal deformation in the tensile zone, ε s , according to Clause 5.8.3.4.2-3 as follows [31]:
θ = 29 ° + 3500 ε s
Third, for RC members with solid cross-sections, the longitudinal reinforcement in the tensile zone must satisfy the following relationship according to Clause 5.8.3.6.3-1 [31]:
A s f y | M u | ϕ f d v + 0.5 N u ϕ c + cot θ ( | V u ϕ v | 0.5 V s ) 2 + ( 0.45 p h T u 2 A 0 ϕ v ) 2
Equation (53) can be used to check the yielding of the longitudinal reinforcement in the tensile zone of the RC cross-sections under combined torsion and shear.
In this study, only solid cross-sections are considered to exemplify the application of the optimization calculation procedure, in view of the available experimental data found in the literature. Therefore, the following constraint is imposed:
cot ( θ ( r , α ) ) ( V ( r , α ) 0.5 A v s n f y t d v cot ( θ ( r , α ) ) ) 2 + ( 0.45 P h T ( r , α ) 2 A 0 ) 2 F s
d v max ( 0.9 d , 0.72 h )
where F s = A s f y = strength of the longitudinal reinforcement in the tensile zone; f y = yielding stress of the longitudinal reinforcement; ϕ f ,   ϕ v ,   ϕ c = resistance factors defined in Clause 5.5.4.2. It should be noted that the shear strength provided by the stirrups, V s , in Equation (53), was replaced by the corresponding value from Equation (48).

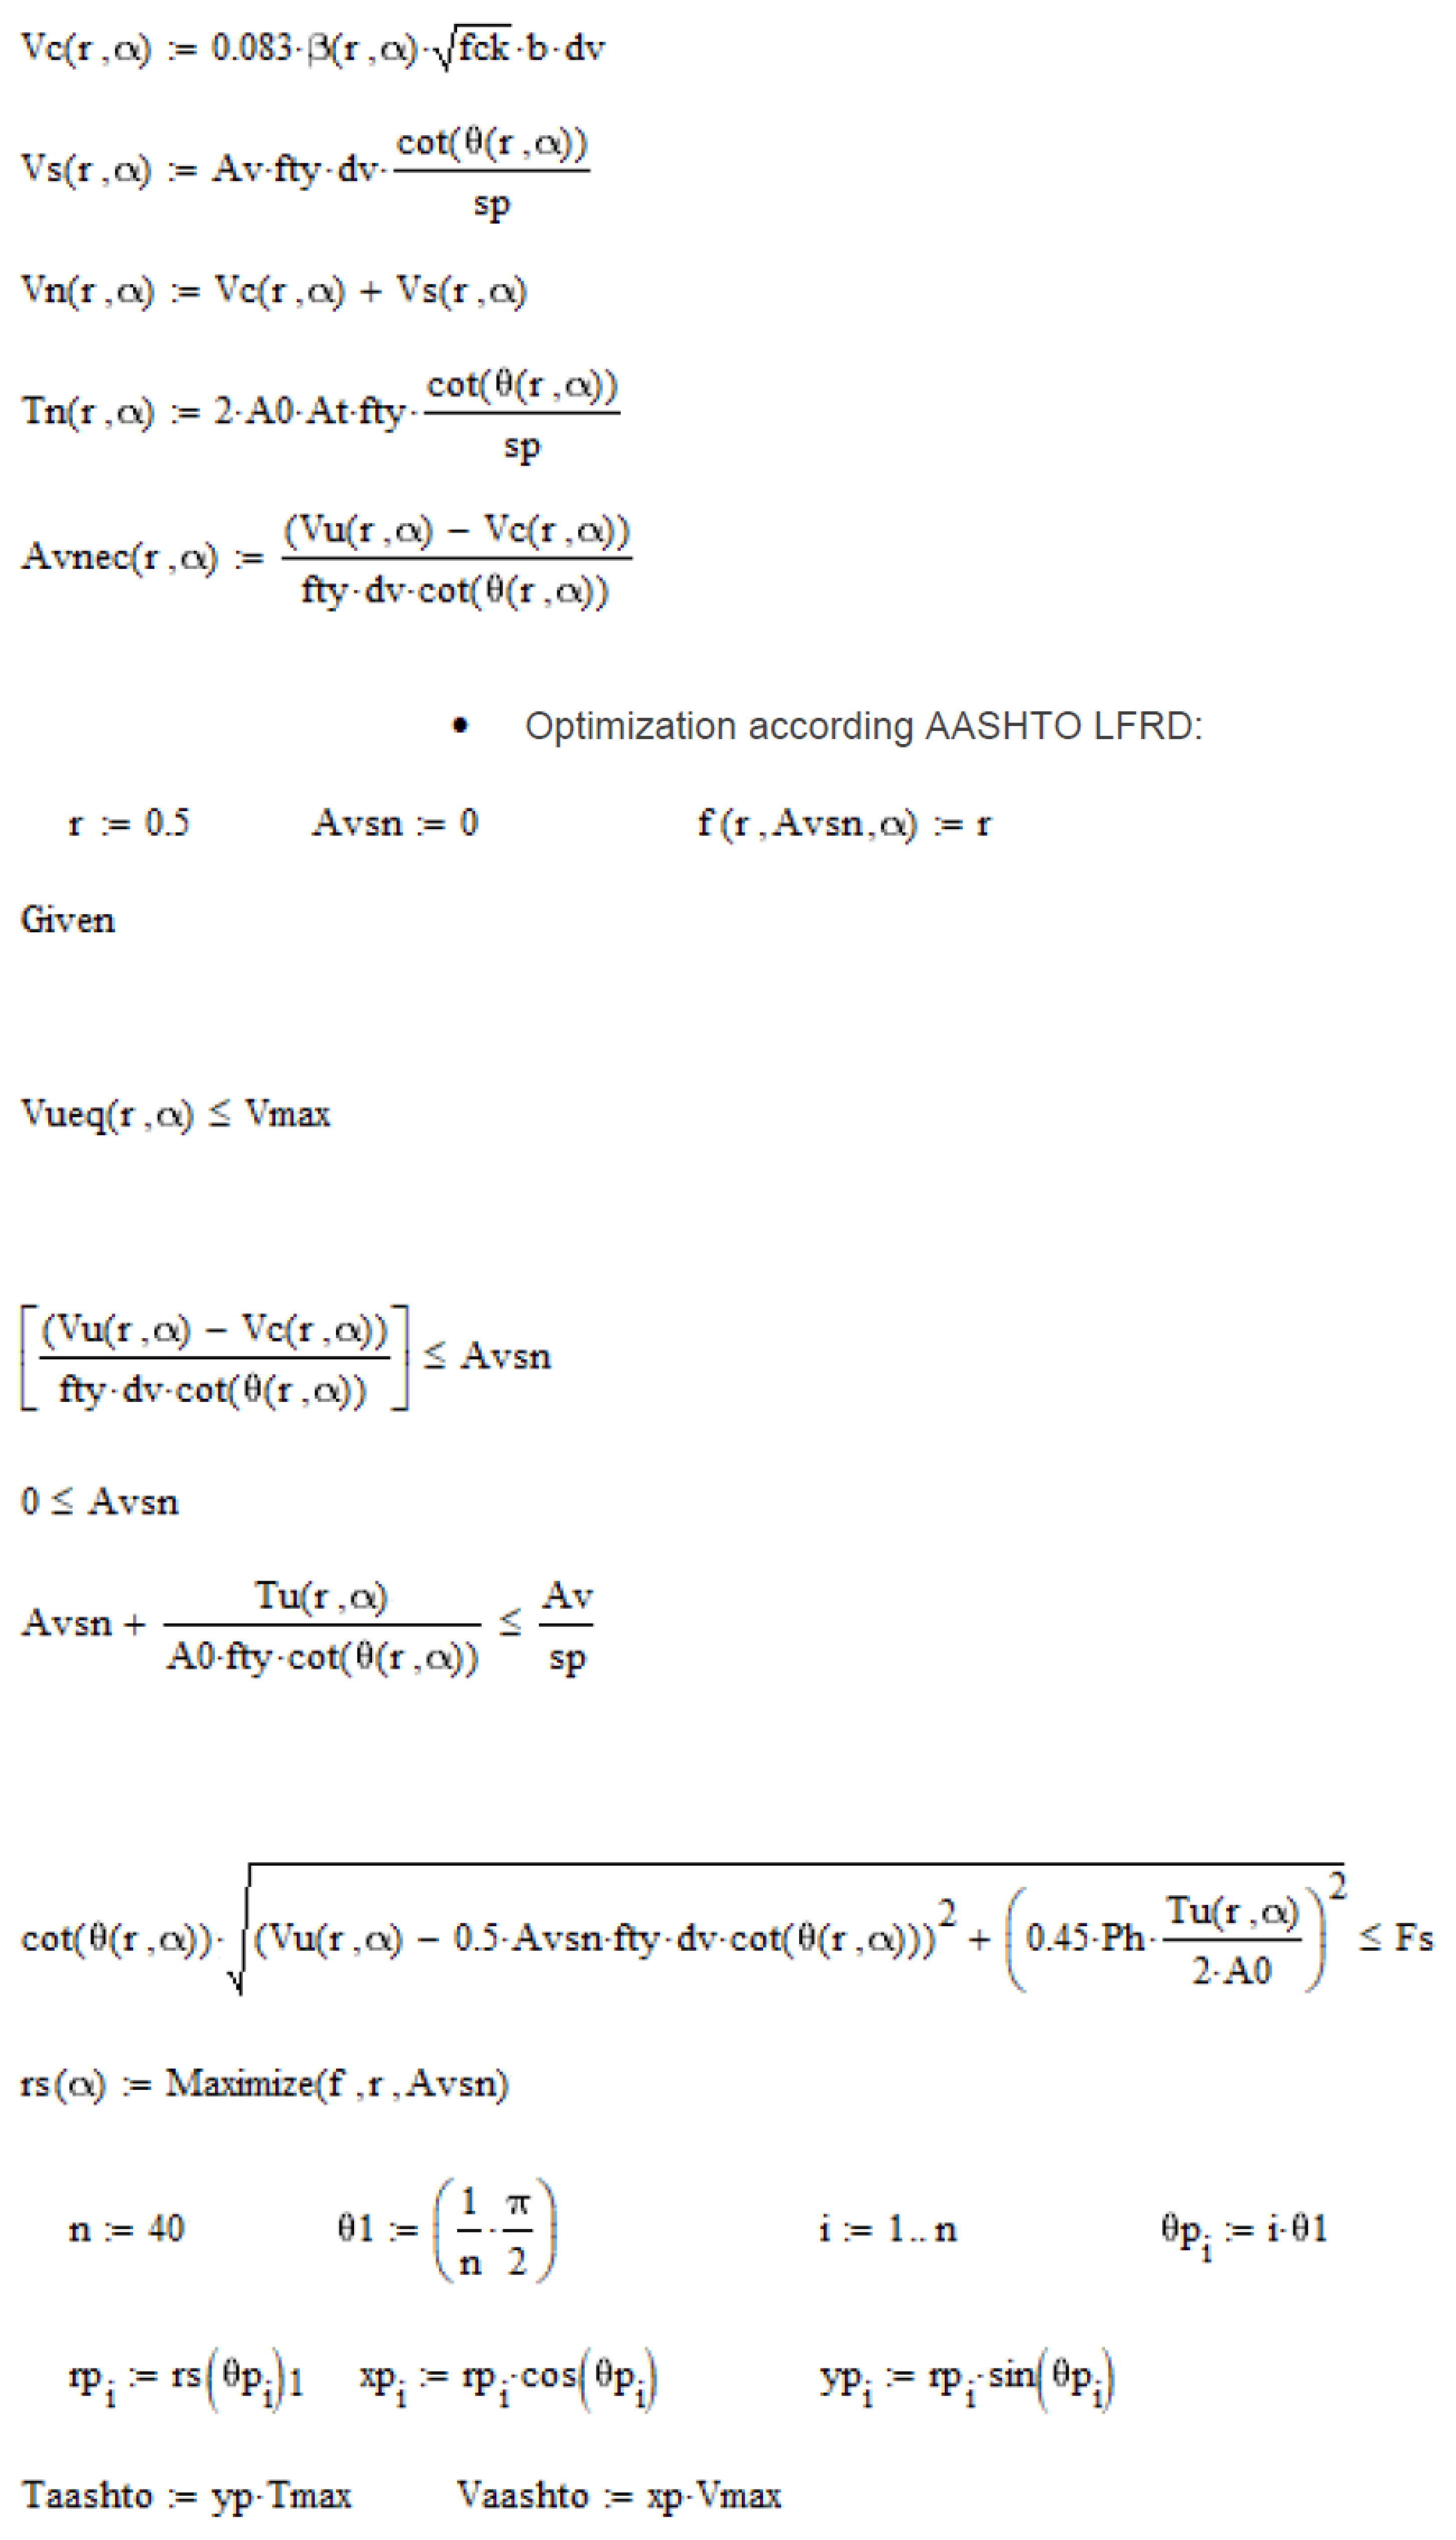
2.6. General Formulation for the Optimization Problem According to AASHTO LRFD

In the same way as presented in Section 2.4 for the NBR 6118 standard, the optimization problem related with the analysis of RC cross-sections under torque combined with shear, according to AASHTO LRFD [31], can be stated in a canonical way as follows:
( P ) { M a x i m i z e f ( r , α , A v s n ) = r S u b j e c t t o : V e q ( r , α ) V u V ( r , α ) V c ( r , α ) f y t d v cot ( θ ( r , α ) ) A v s n 0 A v s n A v s n + T ( r , α ) f y t A 0 cot ( θ ( r , α ) ) A v + t s cot ( θ ( r , α ) ) ( V ( r , α ) 0.5 A v s n f y t d v cot ( θ ( r , α ) ) ) 2 + ( 0 , 45 P h T ( r , α ) 2 A 0 ) 2 F s
The general Mathcad code for the optimization calculation procedure can be found in Appendix A.

3. Results and Discussion

Two sets of reference RC beams with solid cross-sections and tested under combined torsion and shear, with effective symmetrical longitudinal reinforcement, were chosen from the literature [33,36]. To evaluate the efficiency and analyze the reliability of the proposed optimization calculation procedure applied with design standards, comparative analyses are carried out between the experimental results, the optimized results according to NBR 6118 and AASHTO LRFD standards, and the theoretical results from the CA-STM model (combined-action softened truss model) with an efficient calculation procedure [23,39,40]. For this analysis, all load and resistance factors ( γ , ϕ ) are considered equal to unity. To assist in the comparative analyses, the following equation is used to compute the relative error, E r , between experimental and calculated values:
E r = | E x p e r i m e n t a l   v a l u e C a l c u l a t e d   v a l u e | E x p e r i m e n t a l   v a l u e

3.1. Combined Action—Softened Truss Model

The CA-STM allows us to predict the full response of RC members under combined internal forces. The model idealizes the member as the association of four cracked concrete panels, as illustrated in Figure 3, which are modeled with the softened truss model. In addition, the model incorporates compatibility conditions for the association of the panels. Further details about the CA-STM, as well as the implementation techniques for the efficient calculation procedure, can be found in the literature [23,39,40]. In this study, the CA-STM is used to compute the strength of the reference RC beams under combined torsion and shear, for comparison with the results from the proposed optimization calculation procedure according to NBR 6118 and AASHTO LRFD standards.

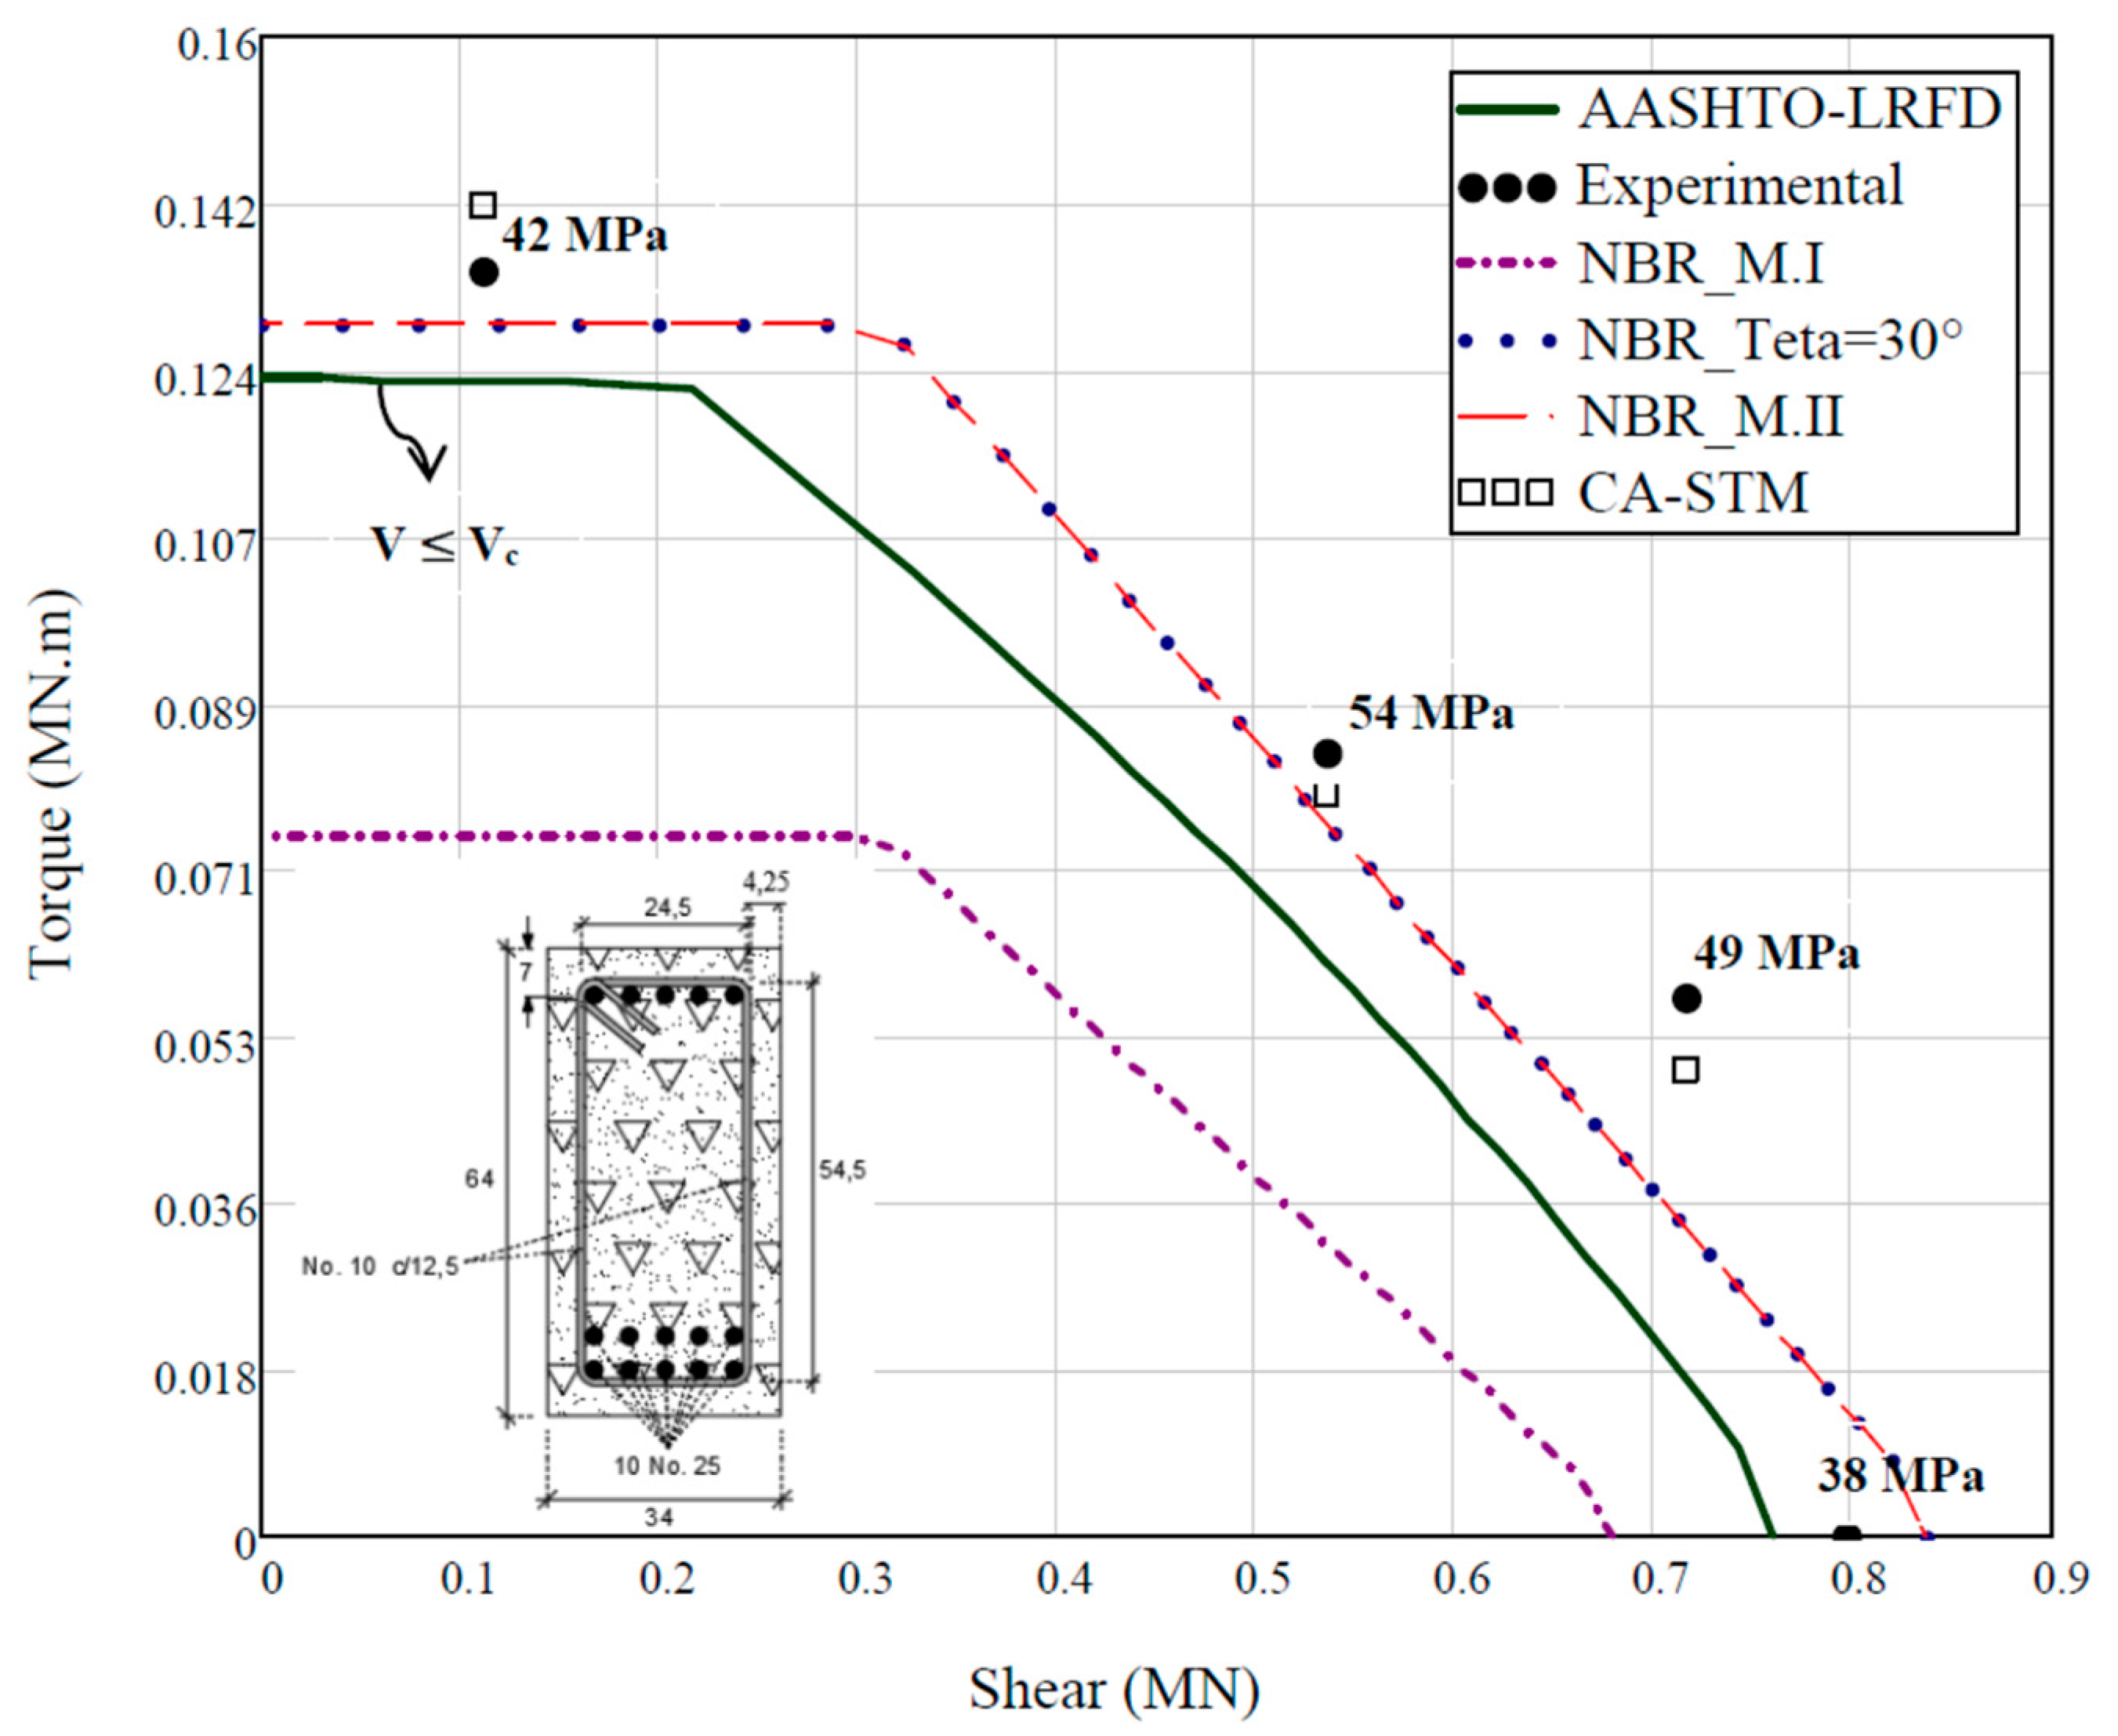
3.2. Results for Reference RC Beams from Series 1 and 2

The reference RC beams from Series 1 (Series RC2) were tested by Rahal and Collins [33] under combined torsion and shear in the failure zone and with different torsion-to-shear ratios. This series includes four specimens with equal geometry (a rectangular cross-section with 34 cm width and 64 cm height), and amounts and detailing of longitudinal and transverse reinforcement. The characteristic concrete compressive strength, f c k , ranges from 38 MPa to 54 MPa. The yielding stresses of the transverse, f y t , and longitudinal, f y l , reinforcements are equal to 466 MPa and 480 MPa, respectively. The cross-section incorporates stirrups with rebars No.10 (100 mm2) and 12.5 cm longitudinal spacing, and rebars No.25 (500 mm2) for the longitudinal reinforcement (10 rebars in the bottom face and 5 rebars in the top face). The properties of the beams from Series RC2 which are needed to compute the torsion–shear interaction curve according to the proposed calculation procedure, and which constitute the initial parameters for the Mathcad code, can be found in Appendix B. More details about the specimens and the testing procedure can be found in [33].
The cross-section in the failure zone of the RC specimens was designed for shear, i.e., the failure of the critical cross-section occurs after the yielding of the transverse reinforcement, before the yielding of the longitudinal reinforcement. In addition, the testing procedure was such that the bending moment is null in the failure zone. Hence, according to Rahal and Collins [33], the calculation of the maximum internal forces at failure, based on the design standards, can be performed by considering the cross-section as effectively symmetrical as far as the longitudinal reinforcement is concerned (five rebars in the bottom face and five rebars in the top face).
Figure 4 presents the interaction curves obtained from the proposed optimization procedure using the clauses from the NBR 6118 and AASHTO LRFD standards. The experimental results and the results obtained with the CA-STM model by Silva in 2015 [39] for each reference beam are also presented. Since the concrete compressive strength varied among the beams, the corresponding value is presented next to each experimental point.
In Figure 4, the “ ●” symbols represent the experimental results for each beam. The dashed line “− −” represents the interaction curve optimized from the NBR 6118 provisions, considering the angle of the concrete struts ( θ ) variable according to model II to compute the shear strength of the cross-section. The dotted line “∙ ∙ ∙” represents the interaction curve optimized according to model II from NBR 6118, considering θ = 30°. The dash-dotted line “− ∙ −” represents the interaction curve optimized from model I with θ = 45°. The continuous line represents the interaction curve computed from optimization procedures according to AASHTO LRFD provisions. Finally, the points with squared symbols represents the theoretical results from the CA-STM.
The horizontal plateau in each torsion–shear interaction curve represents the constant value for the maximum torque without the influence of the shear force, i.e., when the acting shear is less than or equal to the shear resisted by concrete, V c . In this case, the transverse reinforcement is only accounted for the torsional moment.
Table 1 summarizes, for each beam from Series 1, the maximum torques and shear forces computed from both the optimization calculation procedure according to the standards and the CA-STM model. Table 2 and Table 3 presents the percentage relative errors calculated from Equation (57) between the experimental maximum torques and shears, and the ones calculated from the optimization calculation procedure according to the standards, as well as the ones calculated from the CA-STM.
The reference RC beams from Series 2 were tested under torsion combined with shear by Klus in 1968 [36], with different torsion to shear ratios. Series 2 include 8 specimens (in fact, there are 10, but 2 pairs of specimens are equal) with equal geometry (a rectangular cross-section with 20 cm width and 30 cm height), and amounts and detailing of longitudinal and transverse reinforcement. The characteristic concrete compressive strength, f c k , is 21.5 MPa. The yielding stresses of the transverse, f y t , and longitudinal, f y l , reinforcements are equal to 265 Mpa and 429 Mpa, respectively. The cross-section incorporates stirrups with rebars ∅8 mm with 10 cm longitudinal spacing as transverse reinforcement, and rebars ∅22 mm for the longitudinal reinforcement (three rebars for both the bottom and top face). The properties of beams from Series RC2, which are needed for the proposed calculation procedure, can be found in Appendix B. More details about the specimens and the testing procedure can be found in [36].
A research group from the University of Kansas [34] processed the data tests from [36] and computed the strengths of the beams. Figure 5 reproduces some of the obtained experimental results from [34] with interest for this study. As in Figure 4, Figure 5 also presents the results obtained in this study, those from the proposed optimization procedure according to NBR 6118 and AASHTO LRFD standards, and also those from the CA-STM.
Table 4 summarizes, for each beam from Series 2, the maximum torques and shear forces computed from both the optimization calculation procedure according to the standards and the CA-STM model. Table 5 and Table 6 presents the percentage relative errors calculated from Equation (57) between the experimental maximum torques and shears, and the ones calculated from the optimization calculation procedure according to the standards, as well as the ones calculated from the CA-STM.
The values calculated from the optimization calculation procedure for the variable angle of the concrete struts, θ, according to NBR 6118 and AASHTO LRFD standards, are presented in Table 7 for the reference beams from Series 1 and 2. In addition, Table 7 also presents the calculated values from the NBR 6118 standard for the equivalent wall thickness, h e , and for the distance from the middle plane of the equivalent wall to the outer face of the cross-section, c 0 .
The results in Table 7 allow us to state the effectiveness of the proposed optimization calculation procedure to determine the angle of the cracks, which can be considered equal to the angle of the concrete struts θ , and which can vary during the optimization calculation procedure within the limits established by the standards. In addition, Table 3 also shows the effectiveness of the optimization calculation procedure to compute the equivalent wall thickness based on the NBR 6118 clauses, which is not an easy task for designers.

3.3. Discussion of the Results

From Figure 4 (dashed “− −” and dotted “∙ ∙ ∙” curves) and Table 1, Table 2 and Table 3, it can be concluded that, for the beams from Series 1, the interaction curves from both models coincide according to the NBR 6118 standard, with θ variable (model II) and considering θ = 30°. Furthermore, such models are the most satisfactory when compared with the experimental results, with percentage relative errors inferior to about 12%. Most of the predictions, both for the maximum torque and shear force, are slightly conservative. The model from the AASHTO LRFD standard (the continuous curve in Figure 4) is more conservative, with percentage relative errors inferior to about 17%, and consistent with the experimental results.
From Figure 5 and Table 4, Table 5 and Table 6, the interaction curve computed with the model according to the AASHTO LRFD standard (the continuous curve) is now the one with better agreement with most of the experimental results, with percentage relative errors inferior to about 6% for most of them. However, for Beam 2 the prediction is somewhat unconservative. Both the maximum torque and shear are overestimated with percentage relative errors of about 10% and 17%, respectively. The interaction curves from both models according to NBR 6118 standard, with θ variable (model II) and considering θ = 30° (dashed “− −” and dotted “∙ ∙ ∙” curves, respectively), almost coincide. The corresponding predictions are slightly conservative, with percentage relative errors less than about 15%, and consistent with the experimental results.
The aforementioned results show that the NBR 6118 standard, considering a constant angle of θ = 30°, can be considered suitable for design. As indicated in Table 7, for the beams from Series 2, the optimized values for the maximum torque and shear required a small variation of the angle around 30°. This explains why the interaction curves from both models according to the NBR 6118 standard, with θ variable (model II) and considering θ = 30°, do not fully coincide in Figure 4.
Figure 4 and 5, and Table 1, Table 2, Table 3, Table 4, Table 5 and Table 6 show that model I from the NBR 6118 standard with θ = 45° (dash-dotted lines “− ∙ −”) provides very conservative values for both the maximum torque and shear force when compared with the experimental results, with percentage relative errors up to 44% and 50% for the beams from Series 1 and 2, respectively.
Finally, the results show that the predictions from the CA-STM model are reasonably consistent for both the beams from Series 1 and 2. The results also show that the maximum torque seems to be slightly less conservative as the shear force increases.

4. Conclusions

With the aim to evaluate the NBR 6118 and AASHTO LRFD standards to compute the strength of RC beams under combined torsion and shear, an optimization calculation procedure was proposed to compute the torsion–shear interaction curve of the RC cross-section. Based on the obtained results, the following conclusions can be drawn:
  • The proposed calculation procedure based on optimization techniques allows researchers to easily compute the torsion–shear interaction curves of RC cross-sections based on design standards. The proposed calculation procedure is discussed as part of this paper.
  • Model I with an angle for the concrete struts θ = 45°, according to NBR 6118 standard to compute the shear strength, was found to be very conservative for RC members under combined torsion and shear;
  • Model II with an angle for the concrete struts θ = 30°, according to NBR 6118 standard to compute the shear strength, was found to be reliable for RC members under combined torsion and shear;
  • Good results were also found when considering a variable angle for the concrete struts according to the NBR 6118 standard. For this model, the proposed optimization calculation procedure appeared to be very suitable to calculate the resistance of the RC cross-section for the combined acting forces. It allows us to easily solve the difficulty in determining some key parameters involved in the calculation procedure, such as the equivalent wall thickness, h e , and the distance from the middle plan of the wall to the outer face of the cross-section, c 0 . This was confirmed during the optimization calculation procedure, since it was observed that c 0 is not always equal to half of the wall thickness h e (Table 7);
  • The AASHTO LRFD standard is simpler for the analysis of RC cross-sections under combined torsion and shear, although considered more complete, when compared with the NBR 6118 standard. This is because AASHTO LRFD considers the influence off several factors through the longitudinal deformation, ε s . The results obtained according to this standard were found to be consistent with the experimental results;
  • The CA-STM model was also found to be consistent in computing the resistance of RC cross-sections under combined torsion and shear. It was also found that, with this model, the theoretical value for the torsional strength seems to become slightly conservative as the acting shear strength increases. However, CA-STM is somewhat of a complex model to be suitable for design work. The optimization calculation procedure proposed in this study is more suitable for the practice.

Author Contributions

W.O.—methodology, investigation, formal analysis, software and writing—original draft preparation. B.H.—conceptualization, supervision, validation, writing—review and editing. L.F.A.B.—supervision, writing—review and editing. All authors have read and agreed to the published version of the manuscript.

Funding

This research received financial support given by the “Coordenação de Aperfeiçoamento de Pessoal de Nível Superior (CAPES)”.

Institutional Review Board Statement

Not applicable.

Informed Consent Statement

Not applicable.

Data Availability Statement

Not applicable.

Conflicts of Interest

The authors declare no conflict of interest.

Appendix A

Jcs 06 00175 i001Jcs 06 00175 i002Jcs 06 00175 i003Jcs 06 00175 i004Jcs 06 00175 i005Jcs 06 00175 i006Jcs 06 00175 i007Jcs 06 00175 i008Jcs 06 00175 i009Jcs 06 00175 i010

Appendix B

Jcs 06 00175 i011Jcs 06 00175 i012

References

  1. Badawy, H.E.I.; McMullen, A.E.; Jordaan, I.J. Experimental investigation of the collapse of reinforced concrete curved beams. Mag. Concr. Res. 1977, 29, 59–69. [Google Scholar] [CrossRef]
  2. Hsu, T.T.C. Torsion of structural concrete—Behaviour of reinforced concrete rectangular members. In Torsion of Structural Concrete; SP-18; American Concrete Institute: Farmington Hills, MI, USA, 1968; pp. 261–306. [Google Scholar]
  3. McMullen, A.E.; Warwaruk, J. Concrete beams in bending, torsion and shear. J. Struct. Div. 1970, 96, 885–903. [Google Scholar] [CrossRef]
  4. Elfgren, L.; Karlsson, I.; Losberg, A. Torsion-bending-shear interaction for concrete beams. J. Struct. Div. 1974, 100, 1657–1676. [Google Scholar] [CrossRef]
  5. Rausch, E. Berechnung des Eisenbetons gegen Verdrehung (Design of Reinforced Concrete in torsion). Ph.D. Thesis, Technische Hochschule, Berlin, Germany, 1929; p. 53. (In German). [Google Scholar]
  6. Mitchell, D.; Collins, M.P. Diagonal compression field theory—A rational model for structural concrete in pure torsion. ACI J. 1974, 71, 396–408. [Google Scholar]
  7. Hsu, T.T.C.; Mo, Y.L. Softening of concrete in torsional members—Theory and tests. J. Am. Concr. Inst. 1985, 82, 290–303. [Google Scholar]
  8. Jeng, C.-H.; Hsu, T.T.C. A softened membrane model for torsion in reinforced concrete members. Eng. Struct. 2009, 31, 1944–1954. [Google Scholar] [CrossRef]
  9. Bernardo, L.F.A.; Andrade, J.M.A.; Nunes, N.C.G. Generalized softened variable angle truss-model for reinforcement concrete beams under torsion. Mater. Struct. 2015, 48, 2169–2193. [Google Scholar] [CrossRef]
  10. Bernardo, L.F.A.; Andrade, J.M.A. A unified softened truss model for RC and PC concrete beams under torsion. J. Build. Eng. 2020, 32, 101467. [Google Scholar] [CrossRef]
  11. Lampert, P.; Thürlimann, B. Ultimate strength and design of reinforced concrete beams in torsion and bending. In Ultimate Strength and Design of Reinforced Concrete Beams in Torsion and Bending/Résistance et dimensionnement des poutres en béton armé soumises à la torsion et à la flexion/Bruchwiderstand und Bemessung von Stahlbetonbalken unter Torsion und Biegung; Institut für Baustatik und Konstruktion, Birkhäuser: Basel, Switzerland, 1972; Volume 42, pp. 107–131. [Google Scholar]
  12. Rahal, K.N.; Collins, M.P. Combined torsion and bending in reinforced and prestressed concrete beams. ACI Struct. J. 2003, 100, 157–165. [Google Scholar]
  13. Rahal, K.N.; Collins, M.P. Analysis of sections subjected to combined shear and torsion—A theoretical model. ACI Struct. J. 1995, 92, 459–469. [Google Scholar]
  14. Fouad, E.; Ghoneim, M.; Issa, M.; Shaheen, H. Combined shear and torsion in reinforced normal and high-strength concrete beams (1): Experimental study. J. Eng. Appl. Sci. 2000, 47, 1059–1078. [Google Scholar]
  15. Rahal, K.N. A unified approach to shear and torsion in reinforced concrete. Struct. Eng. Mech. 2021, 77, 691–703. [Google Scholar]
  16. Kothamuthyala, S.R.; Thammishetti, N.; Prakash, S.S.; Vyasarayani, C.P. Optimization-based improved softened membrane model for rectangular reinforced concrete members under combined shear and torsion. J. Struct. Eng. 2019, 145, 04018259. [Google Scholar] [CrossRef]
  17. Cocchi, G.M.; Volpi, M. Inelastic analysis of reinforced concrete beams subjected to combined torsion, flexural and axial loads. Comput. Struct. 1996, 61, 479–494. [Google Scholar] [CrossRef]
  18. Bernardo, L.F.A.; Taborda, C.S.B.; Andrade, J.M.A. Ultimate torsional behaviour of axially restrained RC beams. Comput. Concr. 2015, 16, 67–97. [Google Scholar] [CrossRef]
  19. Ganganagoudar, A.; Mondal, T.G.; Prakash, S.S. Improved softened membrane model for reinforced concrete circular bridge columns under torsion. J. Bridge Eng. 2016, 21, 04016037. [Google Scholar] [CrossRef]
  20. Rabbat, B.G.; Collins, M.P. A variable angle space truss model for structural concrete members subjected to complex loading. In Douglas McHenriy International Symposium on Concrete and Concrete Structures; ACE SP-55; American Concrete Institute: Farmington Hills, MI, USA, 1978; pp. 547–587. [Google Scholar]
  21. Greene, G.G.; Belarbi, A. Model for reinforced concrete members under torsion, bending, and shear. I: Theory. J. Eng. Mech. 2009, 135, 961–969. [Google Scholar] [CrossRef]
  22. Valipour, H.R.; Foster, S.J. Nonlinear reinforced concrete frame element with torsion. Eng. Struct. 2010, 32, 988–1002. [Google Scholar] [CrossRef]
  23. Silva, J.; Horowitz, B.; Bernardo, L. Efficient analysis of beam sections using softened truss model. ACI Struct. J. 2017, 114, 765–774. [Google Scholar] [CrossRef] [Green Version]
  24. Ju, H.; Lee, D.; Zhang, W.; Wang, L. Torsional strength model of reinforced concrete members subjected to combined loads. Comput. Concr. 2022, 29, 285–301. [Google Scholar]
  25. Alnauimi, A.S.; Bhatt, P. Direct design of hollow reinforced concrete beams. Part I: Design procedure. Struct. Concr. 2004, 5, 139–146. [Google Scholar] [CrossRef]
  26. Bairan Garcia, J.M.; Mari Bernat, A.R. Shear-bending-torsion interaction in structural concrete members: A nonlinear coupled sectional approach. Arch. Comput. Methods Eng. 2007, 14, 249–278. [Google Scholar] [CrossRef]
  27. Karayannis, C.G. Smeared crack analysis for plain concrete in torsion. J. Struct. Eng. 2000, 126, 638–645. [Google Scholar] [CrossRef]
  28. Karayannis, C.G.; Chalioris, C.E. Experimental validation of smeared analysis for plain concrete in torsion. J. Struct. Eng. 2000, 126, 646–653. [Google Scholar] [CrossRef]
  29. Deifalla, A.; Salem, N.M. A Machine learning model for torsion strength of externally bonded FRP-reinforced concrete beams. Polymers 2022, 14, 1824. [Google Scholar] [CrossRef]
  30. Lyu, Z.; Yu, Y.; Samali, B.; Rashidi, M.; Mohammadi, M.; Nguyen, T.N.; Nguyen, A. Cross-validation for prediction of tor-sional strength of reinforced concrete beam. Materials 2022, 15, 1477. [Google Scholar] [CrossRef]
  31. American Association of State Highway and Transportation Officials (AASHTO). LRFD: Bridge Design, Specifications; AASHTO: Washington, DC, USA, 2014. [Google Scholar]
  32. Associação Brasileira de Normas Técnicas (ABNT). NBR 6118, Projeto de Estruturas de Concreto; ABNT: Rio de Janeiro, Brazil, 2014. [Google Scholar]
  33. Rahal, K.N.; Collins, M.P. Effect of the thickness of concrete cover on the shear-torsion interaction—An experimental investigation. ACI Struct. J. 1995, 92, 334–342. [Google Scholar]
  34. Halim, A.H.; Rasheed, H.A.; Esmaeily, A. Software for AASHTO LRFD Combined Shear and Torsion Computations Using Modified Compression Field Theory and 3D Truss Analogy; Report; Kansas Departament of Transportation, Kansas State University: Manhattan, KS, USA, 2011. [Google Scholar]
  35. Rahal, K.N.; Collins, M.P. Experimental evaluation of ACI and AASHTO-LRFD design provisions for combined shear and torsion. ACI Struct. J. 2003, 100, 277–281. [Google Scholar]
  36. Klus, P.J. Ultimate strength of reinforced concrete beams in combined torsion and shear. ACI Struct. J. 1968, 65, 210–215. [Google Scholar]
  37. PTC. Mathcad 14: User’s Guide; Parametric Technology Corporation: Needham, MA, USA, 2011. [Google Scholar]
  38. Bentz, E.C.; Collins, M.P. Development of the 2004 Canadian standards association (CSA) A23.3 shear provisions for reinforced concrete. Can. J. Civ. Eng. 2006, 33, 521–534. [Google Scholar] [CrossRef]
  39. Silva, J.R.B. Efficient Procedure for the Analysis of Reinforced Concrete Cross-Sections Using the Softened Truss Model. Master’s Thesis, Federal University of Pernambuco, Recife, Brazil, 2016. (In Portuguese). [Google Scholar]
  40. Bernardo, L.F.A.; Teixeira, M.M. Refined softened-truss model with efficient solution procedure for reinforced concrete members under torsion combined with bending. Structures 2020, 26, 651–669. [Google Scholar] [CrossRef]
Figure 1. Curved continuous girder with two spans.
Jcs 06 00175 g001
Figure 2. Modeling the optimized torque–shear curve.
Jcs 06 00175 g002
Figure 3. Idealization of the RC member according to the CA-STM.
Jcs 06 00175 g003
Figure 4. Interaction torque–shear curves for RC beams from Series 1.
Jcs 06 00175 g004
Figure 5. Interaction torque–shear curves for RC beams from Series 2.
Jcs 06 00175 g005
Table 1. Results for RC beams from Series 1.
ExperimentalNBR 6118
M-I
NBR 6118
θ = 30 °
NBR 6118
M-II
AASHTO
LRFD
CA-STM
BeamV
(MN)
T
(MN.m)
V
(MN)
T
(MN.m)
V
(MN)
T
(MN.m)
V
(MN)
T
(MN.m)
V
(MN)
T
(MN.m)
V
(MN)
T
(MN.m)
RC2-10.5350.0830.3870.060.5180.0810.5180.0810.4760.0740.5360.08
RC2-2 0.79600.67800.83700.83700.7600.7960
RC2-30.1110.1350.0620.0750.1080.1290.1080.1290.1030.1230.1120.142
RC2-40.7150.0580.4940.0390.640.0510.640.0510.5950.0480.7160.05
Table 2. Relative errors (%) for the maximum torques for RC beams from Series 1.
BeamNBR 6118
M-I
NBR 6118
θ = 30°
NBR 6118
M-II
AASHTO
LRFD
CA-STM
RC2-127.72.42.410.83.6
RC2-2 -----
RC2-344.44.44.48.9−5.2
RC2-432.812.112.117.213.8
Table 3. Relative errors (%) for the maximum shear force for RC beams from Series 1.
BeamNBR 6118
M-I
NBR 6118
θ = 30°
NBR 6118
M-II
AASHTO
LRFD
CA-STM
RC2-127.73.23.211−0.2
RC2-2 14.8−5.2−5.24.50
RC2-344.12.72.77.2−0.9
RC2-430.910.510.516.8−0.1
Table 4. Results for RC beams from Series 2.
ExperimentalNBR 6118
M-I
NBR 6118
θ = 30°
NBR 6118
M-II
AASHTO
LRFD
CA-STM
BeamV
(MN)
T
(MN.m)
V
(MN)
T
(MN.m)
V
(MN)
T
(MN.m)
V
(MN)
T
(MN.m)
V
(MN)
T
(MN.m)
V
(MN)
T
(MN.m)
100.014200.007100.012100.012100.013800.0149
2 0.030.01250.0180.00710.030.01190.030.0120.0350.01380.0310.0131
30.0630.01150.0390.00710.0570.01040.0590.01060.0670.012--
40.0930.00880.0620.00580.0820.00770.0820.00770.0940.00880.0940.0073
50.1010.00730.070.0050.0910.00650.0910.00650.1040.00750.1010.0062
60.1180.00580.0790.00380.1010.0050.1010.0050.1160.00570.1180.0047
70.1320.00330.0930.00230.1160.00290.1160.00290.1320.0033--
80.15700.1100.13400.13400.1490--
Table 5. Relative errors (%) for the maximum torques for RC beams from Series 2.
BeamNBR 6118
M-I
NBR 6118
θ = 30°
NBR 6118
M-II
AASHTO
LRFD
CA-STM
15014.814.82.8−4.9
2 43.24.84−10.4−4.8
338.39.67.8−4.3-
434.112.512.5017.0
531.51111−2.715.1
634.513.813.81.719
730.312.112.10-
8-----
Table 6. Relative errors (%) for the maximum shear force for RC beams from Series 2.
BeamNBR 6118
M-I
NBR 6118
θ = 30°
NBR 6118
M-II
AASHTO
LRFD
CA-STM
1-----
2 4000−16.7−3.3
338.19.56.3−6.3-
433.311.811.8−1.1−1.1
530.79.99.9−30
633.114.414.41.70
729.512.112.10-
829.914.614.65.1-
Table 7. Key parameters.
NBR 6118
θ
(°)
NBR 6118
h e
(m)
NBR 6118
c 0
(m)
AASHTO LRFD
θ
(°)
Series 1300.1110.0734–35
Series 230–320.060.0432–33
Publisher’s Note: MDPI stays neutral with regard to jurisdictional claims in published maps and institutional affiliations.

