

Ultrasonic Attenuation of Carbon-Fiber Reinforced Composites

Department of Materials Science and Engineering, University of California, Los Angeles (UCLA), Los Angeles, CA 90095, USA
J. Compos. Sci. 2023, 7(11), 479; https://doi.org/10.3390/jcs7110479
Submission received: 16 September 2023
/
Revised: 3 November 2023
/
Accepted: 15 November 2023
/
Published: 17 November 2023
(This article belongs to the Section Polymer Composites)
Abstract
:Ultrasonic attenuation measurements were conducted on cross-ply and quasi-isotropic lay-ups of eight types of carbon-fiber reinforced composites (CFRPs) using through-transmission methods with diffraction correction. Attenuation values were substantially higher than those of unidirectional composites and other structural materials. Wave modes, fiber distributions, matrix resins, and consolidation methods affected total attenuation. Transverse mode, quasi-isotropic lay-up, and polyimide and thermoplastic resins generally produced higher attenuation. No clear trends from the fiber distribution were revealed, indicating that it is not feasible presently to predict the attenuation of various lay-ups from the unidirectional values. That is, direct attenuation tests for different laminate lay-ups are needed. This work expanded the existing attenuation database by properly determining the attenuation coefficients of two additional layup types of CFRP laminates. Results showed the merit of ultrasonic attenuation measurements for quality control and structural health monitoring applications. A crucial benefit of the through-transmission methods is that they enable the prediction of Lamb wave attenuation in combination with software like Disperse (ver. 2.0.20a, Imperial College, London, UK, 2013).
1. Introduction
Ultrasonic non-destructive evaluation (UNDE) provides tools for structural health monitoring (SHM) of fiber-reinforced composite (FRP) structures and for quality assurance during their fabrication [1,2,3,4,5,6]. For example, Philibert et al. [7] used Lamb wave transmission amplitude to detect flaws in carbon fiber-reinforced composites (CFRP). It is crucial to separate inherent attenuation from signal loss due to the presence of the flaws. If the latter is much less, UNDE is ineffective. In contrast to structural metallic alloys, FRPs exhibit highly anisotropic wave propagation behavior, and ultrasound waves are attenuated more strongly by mismatched constituent properties and the presence of voids and interlaminar flaws. Wave propagation and attenuation for FRPs have been studied for many years, with some successes [8,9,10,11,12,13,14,15,16,17,18,19,20,21,22,23,24,25,26,27,28,29]. Williams et al. [11] obtained attenuation coefficients for unidirectional CFRP. They also tried to explain them in terms of homogenized constituents, but without theoretical justification. Ultrasonic attenuation results obtained using tilted-beam transmission methods [18,19,23] were compiled in [29]. This method produced complex stiffness tensors, and damping factors were found to be two to ten times those of isotropic polymethyl methacrylate (PMMA) [18,19]. These results were generally comparable to those from direct measurements using through-transmission methods [30,31]. However, the samples in these early studies [18,19,23] were only identified as carbon-fiber (or glass-fiber)-reinforced composites, making it difficult for quantitative evaluation. It is also noted that most damping factors were deduced from secondary effects since interrogating waves mostly traveled in the normal direction of the surface.
Two recent studies [30,31] reported ultrasonic attenuation results for large numbers of engineering materials using through-transmission methods. Both longitudinal and transverse wave transmission modes were evaluated in nearly 300 samples. These included results for laminated and pultruded FRP samples, but the types of lay-ups were primarily unidirectional (UD) FRPs. Another study [32] examined the through-transmission methods in detail for the cases of ceramics and inorganic materials, comparing them with a buffer-rod method standardized as ASTM C1332-18 [33]. This work [32] showed that the buffer-rod method suffers from inconsistencies due to sample preparation, leaving the through-transmission methods as the most useful approach presently. Another benefit of the through-transmission methods arises from the inclusion of transverse attenuation measurements. This, in turn, allows one to predict the attenuation of Lamb waves [34]. The use of Disperse software (ver. 2.0.20a, Imperial College, London, UK, 2013) broadens its applicability further [35], as discussed in [34].
This report supplements the CFRP measurements in these two studies [30,31] by adding cross-ply (XP) and quasi-isotropic (QI) laminates as well as another UD CFRP. That is, a total of eight carbon-fiber-reinforced composites (CFRPs) were evaluated. The results were tabulated along with the previous attenuation data, with discussion on their implications for UNDE. These test results for XP and QI lay-ups are needed since no report of the ultrasonic attenuation on cross-ply and quasi-isotropic FRP laminates appears to exist in the literature. The present study addresses the urgent need for attenuation data for commonly utilized lay-ups of different types of CFRPs. At present, SHM studies cannot incorporate anticipated signal loss into the design stage. By conducting attenuation tests using the through-transmission methods, one can optimize sensor arrangements and other factors, including transmitter excitation, receiver sensitivity, and so on. It should be noted that the XP and QI lay-ups cover only a small fraction of current composite design practices. However, the three lay-ups represent the basic elements of laminated composites. In addition to the utility of UNDE, the present work is intended to motivate theoretical studies of ultrasonic attenuation in FRP laminates, despite the significant obstacles of properly accounting for fiber distributions, wave scattering, fiber-matrix mismatch, and interlaminar refraction. Such theoretical studies were scarce, as reviewed in [29,30,31].
2. Materials and Experimental Procedures
Three CFRP lay-ups (UD, XP, and QI) of an identical set of constituents, AS4 carbon fiber and 3501-6 epoxy, were used. All three AS4 carbon-fiber-reinforced composites were supplied by the NASA Langley Research Center (Hampton, VA, USA) [30]. Two more AS4 CFRPs had PMR15 polyimide and a polyphenylene sulfide (PPS) matrix. Both CFRPs with thermoset PMR15 (UD and QI) and thermoplastic PPS (QI) resins were made at Rohr Industries (San Diego, CA, USA). A T300 CFRP plate (QI) was obtained from Northrop (El Segundo, CA, USA). Another QI-CFRP from Nippon Oil Co. (Yokohama, Japan) was made from pitch-based carbon fibers, XN50 (Japan Graphite Fibers, Tokyo, Japan), with Nippon Oil 25C epoxy resin. The fiber content was 56%. This XN50 grade has a tensile modulus of 490 GPa, which is more than twice that of AS4 and T300 fibers. Previous studies [30,31] also reported the results of G50 and T700 CFRPs, both of which were made at UCLA laboratories from prepregs. Another T700 CFRP sample was made with T700/UF3369 epoxy prepreg in the UD lay-up (Toray, Tokyo, Japan). Also tested was an epoxy plate made from Epicote 828 resin and Epicote 878 hardener (Shell Epoxy, Tokyo, Japan) at Aoyama Gakuin University (Tokyo, Japan). This aerospace-grade epoxy is referred to as Epoxy2 to distinguish it from previously used consumer-grade epoxy (Epoxy1). Table 1 tabulates sample parameters.
The through-transmission methods were used as in [30,31]. Two sets of longitudinal wave transducers (Olympus V103 and V106, Olympus NDT, Waltham, MA, USA, and C16, NDT Systems, Huntington Beach, CA, USA) were used with Vaseline couplant [30]. For transverse mode tests, two sets of transverse wave transducers (Olympus V154 and V221, Olympus NDT) were used with shear couplant [31]. The test temperature was 25 ± 3 °C. Attenuation tests combined the output frequency spectra (in dB scale) of two set-ups, direct contact (Figure 1a) and through-transmission (Figure 1b), designated as R1 and R2. Here, input and output signals were digitized using PicoScope 5242D (Pico Technology, St. Neots, UK) and digitized at an 8 ns interval with a 15-bit resolution using signal averaging mode. A fast Fourier transform was performed to obtain R1 and R2 spectra using Noesis software (Enviroacoustics, Athens, Greece, ver. 5.8). A typical test set-up is shown in Figure 1c.
The attenuation coefficient, α, is given by
where x is sample thickness, T = −20 log (4Z Z′/(Z + Z′)2), with Z being the acoustic impedance of the transducer face and Z’ the acoustic impedance of the sample. D is the magnitude of diffraction correction, given by
where s = x v/f a2, with v being the wave velocity, f frequency, and Jn Bessel function of the first kind.
α = (R1 − R2 − D − T)/x,
D = −20 log ({[cos(2π/s) − J0(2π/s)]2 + [sin(2π/s) − J1(2π/s)]2}0.5),
Figure 2 shows typical attenuation vs. frequency plots, and the slopes fitted to the linear parts correspond to linear attenuation coefficients, Cd and Cdt (in dB/m/MHz), respectively. Attenuation coefficients, α and αt, are given by α = Cd f and αt = Cdt f, with f. Here, the longitudinal and transverse attenuation curves are plotted in solid blue and red, and the fitted slopes are plotted in dotted blue and red lines. Also plotted are diffraction corrections for the QI and XP cases in light blue and brown, marked DC. DC effects were large below 0.5 MHz but decreased to less than 10% of attenuation coefficients above 2 or 1 MHz for QI and XP, respectively. Even for highly attenuating CFRPs, DC cannot be ignored in the sub-MHz region. In fact, the rising attenuation at low frequencies reported in [11] was due to this DC effect. Also note that many SHM studies [2,3,4,7] use guided waves in the sub-MHz frequencies, making it imperative to account for DC effects.
In some attenuation spectra, frequency-cubed components were present, and α and αt are given by
α = Cd f + C3 f3 (longitudinal)
αt = Cdt f + C3t f3. (transverse)
This frequency-cubed attenuation was predicted by Biwa et al. [21,22], arising from multiple scattering due to normally incident waves on parallel fibers. In the longitudinal mode, the effects of multiple scattering were limited in some cases since Cd contributions were large. However, C3t values were large for the transverse mode in three cases (Sample R24a, R43, and R44). See [30,31] for further details on procedures and other references on attenuation measurement methods.
Error analysis of the through-transmission method was reported in [30]. Using nine PMMA samples, Cd values were within ±10%.
3. Results and Discussion
The results are summarized in Table A1 in Appendix A. Sample numbers continued from the previous studies [30,31], and newly added samples are designated from R37 to R53 and O42, with the prefixes R and O representing reinforced composites and organic materials. Samples R23–R25, R31, and R32 were additionally tested in the transverse mode. Non-linear attenuation behavior was observed in 11 CFRP cases. The deviation from the linear slope was fitted to the third power of frequency with coefficients, C3 and C3t, for the longitudinal and transverse modes, respectively. η = α v/πf is for the damping (loss) factor with or without the t subscript for the transverse mode. FRP lay-ups were designated by UD for unidirectional, XP for cross-ply, and QI for quasi-isotropic. Wave propagation directions are indicated by L, T, and S. For XP and QI lay-ups, S represents the 4- and 8-fold symmetry axes, and L and T are interchangeable. Here, L direction is used for the nominal 0°-direction or the longer sample dimension. For the transverse mode, the direction of shear polarization is given in Notes, using //F for the direction parallel to fibers and ⊥F for the direction normal to fibers. These can also be written in terms of L, T, and S, but the polarization with respect to fiber direction is directly related to wave-fiber interaction. Thus, this method is used here.
For AS4-epoxy CFRP, samples of all three lay-ups were evaluated, and the results are given in the first 12 rows. For the longitudinal mode, attenuation values at 1 MHz (= Cd + C3) in the L direction parallel to 0°-fibers (marked //F) increased in the order of UD, XP, and QI by a factor of four. This is shown in Figure 3a with blue bars. In T directions normal to fibers (⊥F) and S directions normal to laminate surfaces, the corresponding increases were smaller, but their Cd + C3 values were approximately twice that of UD-//F lay-up. For XP and QI lay-ups, relative differences among the three orientations were neither large nor small. For the transverse mode, attenuation values at 1 MHz (= Cdt + C3t) also increased with changing lay-ups, but their relative changes were less, as can be seen in Figure 3b. Notice also that the magnitudes of Cdt + C3t values were two or more times those of Cd + C3 values. For QI lay-ups, results for S orientation were opposite between the longitudinal and transverse modes. While Cd + C3 for S orientation decreased from L or T orientations, Cdt + C3t increased by one-third, going from L or T orientation to S orientation in the transverse case. This trend was also present for XP lay-up, but the effect was smaller. In the comparison of transverse attenuation, polarization effects on attenuation values were averaged. Whether shear motion is normal or parallel to fiber direction is expected to affect attenuation, and indeed, differences were observed as tabulated in Table A1 in Appendix A. Since no theoretical basis exists for this effect, the averaged values were used in Figure 3b, Figure 4b, and Figure 5b. For the prediction of guided wave attenuation in anisotropic media [24,35], the two polarization directions are treated separately. Thus, Table A1 lists attenuation values separately.
For the UD lay-up, five different types of CFRPs were evaluated, and the results are compared in Figure 4a,b. These are AS4 fibers with epoxy or PMR15 polyimide matrix, G50-epoxy, and T700 fibers with two different epoxies (marked as T700 and T700uf). In the fiber direction (L), indicated by blue bars, attenuation values were 77 to 155 dB/m or 527 to 807 dB/m at 1 MHz for the longitudinal or transverse mode. That is, transverse attenuation was four times (for AS4 PMR) to eight times (for T700uf) higher for a given CFRP type. In the surface normal (S) orientation, attenuation was the highest for all types of CFRPs among the three orientations. For the longitudinal mode, AS4-PMR and T700 showed substantially higher attenuation than AS4-3501, G50, and T700uf CFRPs, especially for the S orientation. In these comparisons for T and S orientations, the results of two polarizations (parallel and normal to fibers) were averaged, while the latter was generally higher (except for T700uf). High attenuation appears to be due to the matrix resins, although resin properties are unavailable for direct comparison. From the results of two T700-epoxy CFRPs, consolidation methods appear to affect attenuation. T700 samples were cured outside of an autoclave or without a hot press. In contrast, T700 uf samples were made using a hot press. The lack of adequate curing pressure must be the source of the highly anisotropic attenuation and a lower fiber volume observed in T700 samples.
Attempts to obtain neat resin samples were unsuccessful, but one epoxy sample of composite grade (Epicote 828) was tested, and the results are listed in Table A1 as Sample O42. Its attenuation values were higher than those of consumer-grade epoxy previously reported (Sample O9). The O42 data were similar to the observed CFRP attenuation of AS4-PMR15 and T700. In the case of transverse attenuation, even AS4- and G50-epoxy samples had five-times higher values than the longitudinal attenuation. In contrast, AS4-PMR15 and T700-epoxy samples had comparable attenuation between the longitudinal and transverse modes. The T700 sample in the S direction had the 4th highest attenuation value in this study. In contrast, T700uf samples behaved similarly to AS4-3501 samples.
For commonly utilized QI lay-up, four types of CFRPs—three with AS4 fibers and one with XN50 fibers—were tested. Results are compared in Figure 5. Figure 5a showed that the longitudinal attenuation generally increased from AS4-epoxy to AS4-PPS, but AS4-PMR15 had the highest value in the L direction or the in-plane 0°-fiber direction (blue bars). Changes in the S direction were larger, as shown in Figure 5a (green bars), with AS4-PPS giving the highest Cd value of all at 1935 dB/m at 1 MHz. Between AS4 and XN50 fibers, the tensile Young’s moduli varied by a factor of 2.1. Yet, their attenuation only varied by one-third, indicating the fiber modulus effect is weak. Results for transverse attenuation are shown in Figure 5b. In contrast to the longitudinal cases, attenuation values were similar among the four types of QI-CFRPs, with one exception. That is, AS4-PPS (L orientation) had the highest value of 2082 dB/m. Again, the fiber modulus effect was weak. These results indicated the absence of clear trends with respect to the value of attenuation on the basis of orientation and fiber moduli. Again, high attenuation appears to originate from the properties of the matrix materials, as the highest attenuation was observed in L-oriented QI-AS4-PPS. Strangely, the S orientation of AS4-PPS showed low attenuation at nearly ¼ of the maximum value for L //F. Again, the lack of neat resin samples prevented experimental confirmation of the resin effect.
The present results failed to show definitive trends regarding the attenuation of XP and QI lay-ups in relation to the UD data. This points to the need to experimentally evaluate the attenuation behavior of CFRPs. However, this also implies that such attenuation data can quantify the quality of manufacturing processes. For example, Figure 5a showed substantial changes in attenuation of PMR15 and PPS CFRPs between L and S orientations. It is difficult to attribute the variation to matrix properties alone if the fiber structures are unchanged. The opposite trends on PMR15 and PPS matrices are possibly due to variations in fiber distributions, which resulted from different consolidation steps. But these need further investigation by matrix burn-off or other matrix removal methods.
From the attenuation coefficients and wave velocities, damping factors, η and ηt, were calculated and listed in Table A1, using η = αv/πf. Note that α needs to be converted to Nepers/m units. Values of η ranged from 0.013 to 0.37 and ηt values from 0.018 to 0.13. Since the damping factors are proportional to wave velocities, the η values for the longitudinal mode tend to be larger, even though αt values are usually larger than the corresponding α values. Wave velocities listed in Table A1 can be converted to stiffness tensor components using formulas given by Prosser [12], since the material symmetries were limited to transversely isotropic and orthogonal in the present study. See also [31]. For stiffness tensor determination, it is necessary to properly rotate the coordinate system so that the main symmetry axis coincides with the L orientation for UD lay-up and the S orientation for XP and QI lay-ups, respectively.
Damping factors of composite materials have been studied for many decades [36,37,38]. Because of structural vibration interest, vibration frequencies were primarily in the sub-kHz domain, and mesoscale (or sub-millimeter) amplitude was commonly used. The use of dynamic mechanical analyzers (DMA) has become dominant [39,40]. Recent works reported damping factors of CFRPs determined using DMA-type methods [41,42,43,44,45]. Note that shear damping factors were not considered in these low-frequency damping studies since torsional vibration generators are not readily available and their need was weak. Reported damping factors were typically in the range of 0.01 to 0.1, although some values appeared strangely off-scale. For example, Kishi et al. [41] obtained η = 0.0008 for a 12-ply T700 CFRP. This corresponds to the η of Al alloys and optical glasses, which resonate more than a second when hit [30]. This value cannot be a reasonable estimate since no CFRP plate exhibits such ringing. Elastic moduli for CFRP samples obtained from cantilever beam bending were an order of magnitude lower in some studies, even for control CFRPs [46,47], requiring thorough reevaluation. A possible source of the low modulus is excessive bending strain, leading to resin flow. While the observed damping factors are in the same general range as the values determined from ultrasonic attenuation, this apparent agreement cannot be taken to indicate that a single mechanism operates over many decades of frequencies. In the case of ultrasonic attenuation, strain levels are 10−8 to 10−10 [48]. These are at least a million times smaller than the strain levels used in DMA [39,40]. A study covering a wide range of frequencies is also needed, as was conducted for the polymer viscoelasticity field [29,49]. Studies showed that the damping factor of polymethyl methacrylate changed from 0.09 at 1 Hz to 0.01 at 1 MHz [29]. Molecular rearrangements are responsible for increased damping at low frequencies.
Finally, the availability of ultrasonic attenuation data for three types of CFRP lay-ups enables the calculation of Lamb wave attenuation using appropriate software, such as Disperse [35]. A more advanced analytical procedure [24] is also available. The through-transmission methods can be used for many different CFRP laminates, allowing for Lamb wave attenuation characteristics for such CFRPs. Since the vast majority of CFRP uses plate-like structures, the method used here can predict ultrasonic signal transmission behavior, greatly advancing the fields of SHM and UNDE.
4. Conclusions
This study evaluated the ultrasonic attenuation of eight CFRP laminates, totaling 52 new tests. These included cross-ply and quasi-isotropic lay-ups and four new fiber-matrix combinations: AS4-PPS, XN50-epoxy, T700-UF3369 epoxy, and T300-epoxy CFRPs. Results were tabulated, and main features were compared for several different groupings. In most cases, high attenuation levels were found, making conventional UNDE challenging. Changes from unidirectional lay-up to cross-ply or quasi-isotropic lay-up added substantial attenuation. However, this effect was smaller for the transverse mode, which always produced higher attenuation than for the longitudinal mode. The observed changes are strongly influenced by the fiber distributions, their stacking sequences, and the matrix resins. Newer 2501-epoxy in T700 CFRP, PMR15, and PPS resins produced the largest attenuation effects within the present study. New attenuation data from this work should encourage additional systematic attenuation studies of various CFRPs together with matrix resin samples. These are the essential base data, leading to a theoretical understanding of wave-fiber interaction. The methods used here can be applied to any CFRP laminate, allowing the prediction of Lamb wave attenuation through computational procedures. This expands the scope of UNDE and SHM for typically plate-like CFRPs.
Funding
This research received no external funding.
Data Availability Statement
Data is contained within the article.
Acknowledgments
The author is grateful to Nanjo, A. of Nippon Oil Co. and Prosser, W.H. of NASA Langley Research Center for providing some of CFRP laminates used in this study.
Conflicts of Interest
The author declares no conflict of interest.
Appendix A
Attenuation results are given in Table A1 below. Each row represents a test sample with its number, grouped for longitudinal and transverse attenuation data, followed by ratios of attenuation coefficients and damping factors, and by thickness, mass density, and polarization direction for the transverse mode. Attenuation results from our previous studies [30,31] were also compiled for comparison.

Table A1.
Attenuation coefficients of longitudinal and transverse modes of fiber-reinforced composites.
Table A1.
Attenuation coefficients of longitudinal and transverse modes of fiber-reinforced composites.
| Test. | Material | Cd | C3 | v | η | Cdt | C3t | vt | ηt | Cdt/Cd | ηt/η | Thickness | Density | Notes |
|---|---|---|---|---|---|---|---|---|---|---|---|---|---|---|
| No | dB/m /MHz | dB/m /MHz3 | mm/µs | dB/m /MHz | dB/m /MHz3 | mm/µs | mm | Mg/m3 | ||||||
| R15 | CFRP AS4 UD L | 91.0 | 9.32 | 3.11 × 10⁻² | 531 | 2.15 | 4.18 × 10⁻² | 5.84 | 1.35 | 36.6 | 1.53 | pol = ⊥F | ||
| R15a | CFRP AS4 UD L | 91.0 | 9.32 | 3.11 × 10⁻² | 621 | 2.15 | 4.89 × 10⁻² | 6.82 | 1.57 | 29.5 | 1.53 | pol = ⊥F | ||
| R16 | CFRP AS4 UD T | 247 | 4.937 | 3.16 | 2.86 × 10⁻² | 451 | 2.09 | 3.45 × 10⁻² | 1.83 | 1.21 | 24.3 | 1.53 | pol = //F | |
| R16a | CFRP AS4 UD T | 247 | 4.937 | 3.16 | 2.86 × 10⁻² | 512 | 1.58 | 2.96 × 10⁻² | 2.07 | 1.04 | 20.0 | 1.53 | pol = ⊥F | |
| R17 | CFRP AS4 UD S | 196 | 3.15 | 2.26 × 10⁻² | 461 | 2.04 | 3.45 × 10⁻² | 2.35 | 1.52 | 20.0 | 1.53 | pol = //F | ||
| R17a | CFRP AS4 UD S | 196 | 3.15 | 2.26 × 10⁻² | 546 | 1.58 | 3.16 × 10⁻² | 2.79 | 1.40 | 28.0 | 1.53 | pol = ⊥F | ||
| R37 | CFRP AS4 XP L | 301 | 8.24 | 9.09 × 10⁻² | 571 | 2.16 | 4.52 × 10⁻² | 1.90 | 0.50 | 28.0 | 1.53 | pol = //F | ||
| R37a | CFRP AS4 XP L | 301 | 8.24 | 9.09 × 10⁻² | 482 | 1.82 | 3.21 × 10⁻² | 1.60 | 0.35 | 17.4 | 1.53 | pol = ⊥F | ||
| R38 | CFRP AS4 XP S | 298 | 3.20 | 3.49 × 10⁻² | 645 | 1.76 | 4.16 × 10⁻² | 2.16 | 1.19 | 26.0 | 1.53 | pol = //F | ||
| R39 | CFRP AS4 QI L | 384 | 7.74 | 1.09 × 10⁻¹ | 704 | 3.95 | 1.02 × 10⁻¹ | 1.83 | 0.94 | 26.0 | 1.53 | pol = //F | ||
| R39a | CFRP AS4 QI L | 384 | 7.74 | 1.09 × 10⁻¹ | 694 | 1.83 | 4.65 × 10⁻² | 1.81 | 0.43 | 17.7 | 1.53 | pol = ⊥F | ||
| R40 | CFRP AS4 QI S | 306 | 3.18 | 3.57 × 10⁻² | 922 | 1.77 | 5.98 × 10⁻² | 3.01 | 1.68 | 24.3 | 1.53 | pol = //F | ||
| R18 | CFRP G50 UD L | 110 | 11.30 | 4.55 × 10⁻² | 667 | 2.04 | 5.00 × 10⁻² | 6.06 | 1.09 | 13.3 | 1.58 | pol = ⊥F | ||
| R21 | CFRP G50 UD T | 129 | 2.83 | 1.30 × 10⁻² | 603 | 2.16 | 4.77 × 10⁻² | 4.67 | 3.63 | 29.0/19.9 | 1.58 | pol = //F | ||
| R21a | CFRP G50 UD T | 129 | 2.83 | 1.30 × 10⁻² | 366 | 550.0 | 1.36 | 1.82 × 10⁻² | 2.84 | 1.40 | 29.0/19.9 | 1.58 | pol = ⊥F | |
| R22 | CFRP G50 UD S | 148 | 2.79 | 1.51 × 10⁻² | 995 | 1.84 | 6.71 × 10⁻² | 6.72 | 4.43 | 28.9 | 1.58 | pol = ⊥F | ||
| R22a | CFRP G50 UD S | 148 | 2.79 | 1.51 × 10⁻² | 1050 | 1.30 | 5.00 × 10⁻² | 7.10 | 3.31 | 28.9 | 1.58 | pol = ⊥F | ||
| R36 | CFRP G50 XP S | 213 | 2.68 | 2.09 × 10⁻² | 709 | 1.62 | 4.20 × 10⁻² | 3.33 | 2.01 | 4.7 | 1.58 | pol = //F | ||
| R23 | CFRP AS4 PMR UD L | 155 | 11.33 | 6.43 × 10⁻² | 637 | 1.52 | 3.55 × 10⁻² | 4.11 | 0.49 | 14.5 | 1.45 | pol = ⊥F | ||
| R24 | CFRP AS4 PMR UD T | 1052 | 279.0 | 2.17 | 8.36 × 10⁻² | 1037 | 1.60 | 6.08 × 10⁻² | 0.99 | 0.73 | 19.0 | 1.45 | pol = //F | |
| R24a | CFRP AS4 PMR UD T | 1052 | 279.0 | 2.17 | 8.36 × 10⁻² | 790 | 2314 | 1.12 | 3.24 × 10⁻² | 0.75 | 0.39 | 19.0 | 1.45 | pol = ⊥F |
| R25 | CFRP AS4 PMR UD S | 865 | 151.4 | 2.30 | 7.30 × 10⁻² | 1308 | 1.74 | 8.34 × 10⁻² | 1.51 | 1.14 | 18.5 | 1.45 | pol = //F | |
| R25a | CFRP AS4 PMR UD S | 865 | 151.4 | 2.30 | 7.30 × 10⁻² | 911 | 473.1 | 1.11 | 3.71 × 10⁻² | 1.05 | 0.51 | 18.5 | 1.45 | pol = ⊥F |
| R41 | CFRP AS4 PMR QI L | 1205 | 7.25 | 3.20 × 10⁻¹ | 923 | 3.38 | 1.14 × 10⁻¹ | 0.77 | 0.36 | 16.6 | 1.45 | pol = //F | ||
| R41a | CFRP AS4 PMR QI L | 1205 | 7.25 | 3.20 × 10⁻¹ | 1033 | 1.62 | 6.13 × 10⁻² | 0.86 | 0.19 | 16.6 | 1.45 | pol = ⊥F | ||
| R42 | CFRP AS4 PMR QI S | 384 | 2.93 | 4.12 × 10⁻² | 516 | 1.66 | 3.14 × 10⁻² | 1.34 | 0.76 | 14.9 | 1.45 | pol = //F | ||
| R43 | CFRP AS4 PPS QI L | 1267 | 7.97 | 3.70 × 10⁻² | 635 | 1996 | 3.78 | 8.80 × 10⁻² | 0.50 | 2.38 | 5.26 | 1.48 | pol = //F | |
| R43a | CFRP AS4 PPS QI L | 1267 | 7.97 | 3.70 × 10⁻² | 1584 | 1.33 | 7.72 × 10⁻² | 1.25 | 2.09 | 5.26 | 1.48 | pol = ⊥F | ||
| R44 | CFRP AS4 PPS QI L | 970 | 7.13 | 2.53 × 10⁻¹ | 546 | 1536 | 3.24 | 6.48 × 10⁻² | 0.56 | 0.26 | 29.3 | 1.48 | pol = //F | |
| R44a | CFRP AS4 PPS QI L | 970 | 7.13 | 2.53 × 10⁻¹ | 1041 | 1.36 | 5.19 × 10⁻² | 1.07 | 0.20 | 29.3 | 1.48 | pol = ⊥F | ||
| R45 | CFRP AS4 PPS QI S | 1758 | 2.32 | 1.49 × 10⁻¹ | 692 | 1.27 | 3.22 × 10⁻² | 0.39 | 0.22 | 2.6 | 1.48 | pol = //F | ||
| R46 | CFRP AS4 PPS QI S | 1935 | 2.33 | 1.65 × 10⁻¹ | 645 | 1.27 | 3.00 × 10⁻² | 0.33 | 0.18 | 15.5 | 1.48 | pol = ⊥F | ||
| R47 | CFRP XN50 QI L | 553 | 10.83 | 2.19 × 10⁻¹ | 18.1 | 1.57 | ||||||||
| R48 | CFRP XN50 QI T | 508 | 9.08 | 1.69 × 10⁻¹ | 1288 | 2.77 | 1.31 × 10⁻¹ | 2.54 | 0.77 | 3.45 | 1.57 | pol = //F | ||
| R48a | CFRP XN50 QI T | 508 | 9.08 | 1.65 × 10⁻¹ | 994 | 1.41 | 6.16 × 10⁻² | 1.96 | 0.36 | 3.45 | 1.57 | pol = ⊥F | ||
| R49 | CFRP XN50 QI S | 383 | 2.63 | 3.70 × 10⁻² | 1341 | 1.27 | 6.93 × 10⁻² | 3.50 | 1.88 | 3.43 | 1.57 | pol = //F | ||
| R26 | CFRP T700 UD L | 76.6 | 9.19 | 2.57 × 10⁻² | 527 | 1.95 | 3.77 × 10⁻² | 6.88 | 1.47 | 23.8 | 1.48 | pol = ⊥F | ||
| R27 | CFRP T700 UD T | 825 | 2.91 | 8.80 × 10⁻² | 661 | 1.92 | 4.65 × 10⁻² | 0.80 | 0.53 | 18.9 | 1.48 | pol = //F | ||
| R27 | CFRP T700 UD T | 825 | 2.91 | 8.80 × 10⁻² | 1596 | 1.38 | 8.07 × 10⁻² | 1.95 | 0.92 | 18.9 | 1.48 | pol = ⊥F | ||
| R28 | CFRP T700 UD S | 1733 | 2.66 | 1.69 × 10⁻¹ | 1400 | 1.89 | 9.70 × 10⁻² | 0.81 | 0.54 | 15.5 | 1.48 | pol = //F | ||
| R28a | CFRP T700 UD S | 1733 | 2.66 | 1.69 × 10⁻¹ | 1857 | 1.64 | 1.12 × 10⁻¹ | 1.07 | 0.66 | 15.5 | 1.48 | pol = ⊥F | ||
| R50 | CFRP T700uf UD L | 99.5 | 9.50 | 3.46 × 10⁻² | 807 | 1.99 | 5.88 × 10⁻² | 8.11 | 1.70 | 13.4 | 1.55 | pol = //F | ||
| R51 | CFRP T700uf UD T | 315 | 3.04 | 3.51 × 10⁻² | 701 | 1.97 | 5.11 × 10⁻² | 2.23 | 1.46 | 12.4 | 1.55 | pol = //F | ||
| R51a | CFRP T700uf UD T | 315 | 3.04 | 3.51 × 10⁻² | 968 | 1.50 | 5.28 × 10⁻² | 3.07 | 1.51 | 12.4 | 1.55 | pol = ⊥F | ||
| R52 | CFRP T700uf UD S | 289 | 3.05 | 3.23 × 10⁻² | 886 | 1.97 | 6.40 × 10⁻² | 3.07 | 1.98 | 4.57 | 1.55 | pol = //F | ||
| R52a | CFRP T700uf UD S | 289 | 3.05 | 3.23 × 10⁻² | 645 | 1.54 | 3.64 × 10⁻² | 2.23 | 1.12 | 4.57 | 1.55 | pol = ⊥F | ||
| R53 | CFRP T300 XP S | 333 | 3.48 | 4.25 × 10⁻² | 2040 | 2.00 | 1.50 × 10⁻¹ | 6.13 | 3.53 | 7.7 | 1.51 | pol = //F | ||
| R1 | GRP rod L | 74.6 | 4.96 | 1.36 × 10⁻² | 478 | 1.71 | 3.00 × 10⁻² | 6.41 | 2.21 | 33.5 | 1.97 | pol = ⊥F | ||
| R4 | GRP rod S | 173 | 5.946 | 3.07 | 1.95 × 10⁻² | 952 | 1.64 | 5.70 × 10⁻² | 5.50 | 2.94 | 6.3 | 1.97 | pol = ⊥F | |
| R4a | GRP rod S | 173 | 5.946 | 3.07 | 1.95 × 10⁻² | 944 | 1.76 | 6.10 × 10⁻² | 5.46 | 3.13 | 6.3 | 1.97 | pol = //F | |
| R5 | GRP L | 121 | 5.06 | 2.24 × 10⁻² | 650 | 1.80 | 4.30 × 10⁻² | 5.37 | 1.91 | 7.0 | 2.07 | pol = //F | ||
| R13 | GRP XP L | 202 | 4.15 | 3.07 × 10⁻¹ | 1740 | 1.99 | 1.27 × 10⁻¹ | 8.61 | 0.41 | 7.0 | 1.81 | pol = //F | ||
| R14 | GRP XP S | 441 | 2.84 | 4.59 × 10⁻¹ | 3030 | 1.65 | 1.83 × 10⁻¹ | 6.87 | 3.99 | 2.2 | 1.81 | pol = //F | ||
| R34 | KFRP S | 1090 | 2.72 | 1.08 × 10⁻¹ | 1630 | 1.32 | 7.90 × 10⁻² | 1.50 | 0.73 | 9.2 | 1.34 | pol = //F | ||
| O1 | PMMA | 91.4 | 2.74 | 9.18 × 10–³ | 253 | 1.40 | 1.30 × 10⁻² | 2.77 | 1.42 | 1.18 | ||||
| O9 | Epoxy1 | 274 | 2.75 | 2.76 × 10⁻² | 1030 | 1.38 | 5.21 × 10⁻² | 3.76 | 1.89 | 9.1 | 1.39 | |||
| O42 | Epoxy2 | 582 | 2.69 | 5.74 × 10⁻² | 1750 | 1.24 | 7.95 × 10⁻² | 3.01 | 1.39 | 2.9 | 1.22 |
L—parallel to 0° fibers; T—parallel to 90° fibers; S—normal to laminate or rod surface; UD—unidirectional; XP—cross-plies; QI—quasi-isotropic; //F—parallel to fibers; ⊥F—normal to fibers in the transverse direction; pol—the direction of polarization of transverse waves.
References
- Kundu, T. (Ed.) Ultrasonic Nondestructive Evaluation, Engineering and Biological Material Characterization; CRC Press: Boca Raton, FL, USA, 2003; 848p. [Google Scholar]
- Giurgiutiu, V. Structural Health Monitoring of Aerospace Composites; Academic Press: New York, NY, USA, 2015; 470p. [Google Scholar]
- Rizzo, P.; Milazzo, A. (Eds.) European Workshop on Structural Health Monitoring; Special Collection of 2020 Papers—Volume 1; Springer Nature: Cham, Switzerland, 2021; 969p. [Google Scholar] [CrossRef]
- Howell, P.A. (Ed.) Nondestructive Evaluation (NDE) Methods and Capabilities Handbook; NASA/TM−2020-220568/Volume I; Langley Research Center: Hampton, VA, USA, 2020; 198p. [Google Scholar]
- Mehdikhani, M.; Gorbatikh, L.; Verpoest, I.; Lomov, S.V. Voids in fiber-reinforced polymer composites: A review on their formation, characteristics, and effects on mechanical performance. J. Compos. Mater. 2019, 53, 1579–1669. [Google Scholar] [CrossRef]
- Ashrith, H.S.; Jeevan, T.P.; Xu, J. A review on the fabrication and mechanical characterization of fibrous composites for engineering applications. J. Compos. Sci. 2023, 7, 252. [Google Scholar] [CrossRef]
- Philibert, M.; Yao, K.; Gresil, M.; Soutis, C. Lamb waves-based technologies for structural health monitoring of composite structures for aircraft applications. Eur. J. Mater. 2022, 2, 436–474. [Google Scholar] [CrossRef]
- Stone, D.E.; Clarke, B. Ultrasonic attenuation as a measure of void content in carbon-fibre reinforced plastics. Non-Destr. Test. 1975, 8, 137–145. [Google Scholar] [CrossRef]
- Martin, B.G. Ultrasonic wave propagation in fiber-reinforced solids containing voids. J. Appl. Phys. 1977, 48, 3368–3373. [Google Scholar] [CrossRef]
- Reynolds, W.N.; Wilkinson, S.J. The analysis of fibre-reinforced porous composite materials by the measurement of ultrasonic wave velocities. Ultrasonics 1978, 16, 159–163. [Google Scholar] [CrossRef]
- Williams, J.H., Jr.; Lee, S.S.; Nayeb-Hashemi, H. Ultrasonic wave propagation loss factor in composite in terms of constituent properties. J. Nondestruct. Eval. 1980, 1, 191–199. [Google Scholar] [CrossRef]
- Prosser, W.H. Ultrasonic Characterization of the Nonlinear Elastic Properties of Unidirectional Graphite/Epoxy Composites; NASA-CR-4100; National Aeronautics and Space Administration, Scientific and Technical Information Division: Washington, DC, USA, 1987; 184p. [Google Scholar]
- Jeong, H.; Hsu, D.K. Experimental analysis of porosity-induced ultrasonic attenuation and velocity change in carbon composites. Ultrasonics 1995, 33, 195–203. [Google Scholar] [CrossRef]
- Jeong, H. Effects of voids on the mechanical strength and ultrasonic attenuation of laminated composites. J. Compos. Mater. 1997, 31, 276–292. [Google Scholar] [CrossRef]
- Datta, S.K. Scattering of elastic waves by a distribution of inclusions. Arch. Mech. 1976, 28, 317. [Google Scholar]
- Datta, S.K. A Self-Consistent Approach to Multiple Scattering by Elastic Ellipsoidal Inclusions. J. Appl. Mech. 1977, 44, 657–662. [Google Scholar] [CrossRef]
- Kinra, V.; Petraitis, M.; Datta, S.K. Ultrasonic wave propagation in a random particulate composite. Int. J. Solids Struct. 1990, 16, 301–312. [Google Scholar] [CrossRef]
- Castaings, M.; Hosten, B. Air-coupled measurement of plane wave, ultrasonic plate transmission for characterising anisotropic, viscoelastic materials. Ultrasonics 2000, 38, 781–786. [Google Scholar] [CrossRef]
- Castaings, M.; Hosten, B.; Kundu, T. Inversion of ultrasonic, plane-wave transmission data in composite plates to infer viscoelastic material properties. NDT E Int. 2000, 33, 377–392. [Google Scholar] [CrossRef]
- Mouritz, A.P. Ultrasonic and interlaminar properties of highly porous composites. J. Compos. Mater. 2000, 34, 218–239. [Google Scholar] [CrossRef]
- Biwa, S. Independent scattering and wave attenuation in viscoelastic composites. Mech. Mater. 2001, 33, 635–647. [Google Scholar] [CrossRef]
- Biwa, S.; Watanabe, Y.; Ohno, N. Modelling of ultrasonic attenuation in unidirectional FRP. J. Soc. Mater. Sci. Jpn. 2001, 50, 62–68. [Google Scholar] [CrossRef]
- Neau, G.; Lowe, M.J.S.; Deschamps, M. Propagation of Lamb waves in anisotropic and absorbing plates: Theoretical derivation and experiments. AIP Conf. Proc. 2002, 615, 1062–1069. [Google Scholar]
- Quintanilla, F.H.; Fan, Z.; Lowe, M.; Craster, R.V. Guided waves’ dispersion curves in anisotropic viscoelastic single- and multi-layered media. Proc. R. Soc. A Math. Phys. Eng. Sci. 2015, 471, 20150268. [Google Scholar] [CrossRef]
- Ishii, Y.; Biwa, S.; Kuraishi, A. Influence of porosity on ultrasonic wave velocity, attenuation and interlaminar interface echoes in composite laminates: Finite element simulations and measurements. Compos. Struct. 2016, 152, 645–653. [Google Scholar] [CrossRef]
- Cobbs, S.D.; Bond, G.G. Development of porosity standards for CYCOM 5320-1 Out-of-autoclave composite laminates. In Proceedings of the SAMPE 2012, Baltimore, MD, USA, 21–24 May 2012. 15p. [Google Scholar]
- Samaratunga, D.; Severino, J.V.; Kenderian, K. Ultrasonic evaluation of porosity in out-of-autoclave carbon fiber–reinforced polymer composite material. Mater. Eval. 2021, 79, 1169–1178. [Google Scholar] [CrossRef]
- Song, J.; Kim, S.; Kim, S.; Cho, Y.; Kim, Y.H. Lamb wave propagation on a unidirectional CFRP plate: Comparison of FEM simulations, experiments, and analytical calculations. J. Mech. Sci. Technol. 2021, 35, 3863–3869. [Google Scholar] [CrossRef]
- Ono, K. Review on structural health evaluation with acoustic emission. Appl. Sci. 2018, 8, 958. [Google Scholar] [CrossRef]
- Ono, K. A comprehensive report on ultrasonic attenuation of engineering materials, including metals, ceramics, polymers, fiber-reinforced composites, wood, and rocks. Appl. Sci. 2020, 10, 2230. [Google Scholar] [CrossRef]
- Ono, K. Dynamic viscosity and transverse ultrasonic attenuation of engineering materials. Appl. Sci. 2020, 10, 5265. [Google Scholar] [CrossRef]
- Ono, K. Ultrasonic attenuation of ceramic and inorganic materials using the through-transmission method. Appl. Sci. 2022, 12, 13026. [Google Scholar] [CrossRef]
- ASTM C1332-18; Standard Practice for Measurement of Ultrasonic Attenuation Coefficients of Advanced Ceramics by Pulse-Echo Contact Technique. ASTM International: West Conshohocken, PA, USA, 2018; 12p.
- Ono, K. Experimental determination of Lamb-wave attenuation coefficients. Appl. Sci. 2022, 12, 6735. [Google Scholar] [CrossRef]
- Lowe, M. Disperse|Research Groups|Imperial College London. Available online: https://www.imperial.ac.uk/non-destructive-evaluation/products-and-services/disperse/ (accessed on 27 January 2022).
- Lin, D.; Ni, R.; Adams, R. Prediction and measurement of the vibrational damping parameters of carbon and glass fibre-reinforced plastics plates. J. Compos. Mater. 1984, 18, 132–152. [Google Scholar] [CrossRef]
- Berthelot, J.-M.; Assarar, M.; Sefrani, Y.; El-Mahi, A. Damping analysis of composite materials and structures. Compos. Struct. 2008, 85, 189–204. [Google Scholar] [CrossRef]
- Treviso, A.; Van Genechten, B.; Mundo, D.; Tournour, M. Damping in composite materials: Properties and models. Compos. Part B 2015, 78, 144–152. [Google Scholar] [CrossRef]
- Murayama, T. Dynamic Mechanical Analysis of Polymeric Material; Elsevier: Amsterdam, The Netherlands, 1978; 231p. [Google Scholar]
- Menard, K.P. Dynamic Mechanical Analysis: A Practical Introduction; CRC Press: Boca Raton, FL, USA, 2008; 240p. [Google Scholar]
- Kishi, H.; Kuwata, M.; Matsuda, S.; Asami, T.; Murakami, A. Damping properties of thermoplastic-elastomer interleaved carbon fiber-reinforced epoxy composites. Compos. Sci. Technol. 2004, 64, 2517–2523. [Google Scholar] [CrossRef]
- Gao, Y.; Li, Y.; Hong, Y.; Zhang, H.; He, X. Modeling of the damping properties of unidirectional carbon fibre composites. Polym. Polym. Compos. 2011, 19, 119–122. [Google Scholar] [CrossRef]
- Stark, W.; Jaunich, M.; McHugh, J. Dynamic mechanical analysis (DMA) of epoxy carbon-fibre prepregs partially cured in a discontinued autoclave analogue process. Polym. Test. 2015, 41, 140–148. [Google Scholar] [CrossRef]
- Rueppel, M.; Rion, J.; Dransfeld, C.; Fischer, C.; Masania, K. Damping of carbon fibre and flax fibre angle-ply composite laminates. Compos. Sci. Technol. 2017, 146, 1–9. [Google Scholar] [CrossRef]
- Kern, L.S.; Hine, P.J.; Gusev, A.A. Optimizing the damping properties of unidirectional composites by incorporating carbon fibers with a thin viscoelastic coating. Compos. Struct. 2019, 208, 879–890. [Google Scholar] [CrossRef]
- Fairlie, G.; Njuguna, J. Damping properties of flax/carbon hybrid epoxy/fibre-reinforced composites for automotive semi-structural applications. Fibers 2020, 8, 64. [Google Scholar] [CrossRef]
- Gong, L.; Zhang, F.; Peng, X.; Scarpa, F.; Huang, Z.; Tao, G.; Liu, H.-Y.; Zhou, H.; Zhou, H. Improving the damping properties of carbon fiber reinforced polymer composites by interfacial sliding of oriented multilayer graphene oxide. Compos. Sci. Technol. 2022, 224, 109309. [Google Scholar] [CrossRef]
- Ono, K.; Cho, H.; Vallen, H.; M’Closkey, R.T. Transmission sensitivities of contact ultrasonic transducers and their applications. Sensors 2021, 21, 4396. [Google Scholar] [CrossRef]
- Lee, T.; Lakes, R.S.; Lal, A. Resonant ultrasound spectroscopy for measurement of mechanical damping: Comparison with broadband viscoelastic spectroscopy. Rev. Sci. Instrum. 2000, 71, 2855–2861. [Google Scholar] [CrossRef]
Figure 1.
Attenuation test set-up. (a) Direct contact arrangement. (b) Through-transmission arrangement. (c) Transverse through-transmission test for QI AS4-epoxy sample in a surface-normal direction.
Figure 1.
Attenuation test set-up. (a) Direct contact arrangement. (b) Through-transmission arrangement. (c) Transverse through-transmission test for QI AS4-epoxy sample in a surface-normal direction.

Figure 2.
Representative attenuation spectra for QI and XP AS4-epoxy CFRP samples. QI longitudinal and XP transverse attenuation curves in solid blue and red. Fitted slopes are in a dotted blue line with Cd = 301 dB/m/MHz and a dotted red line with Cdt = 571 dB/m/MHz. Diffraction correction (DC) curves for QI and XP samples are given in light blue and brown.

Figure 3.
(a) Longitudinal attenuation of AS4-epoxy CFRP samples with unidirectional, cross-ply, and quasi-isotropic lay-ups. Blue, red, and green bars indicate the wave propagation directions of L (marked //F), T (⊥F), and S. (b) Transverse attenuation of AS4-epoxy CFRP samples. The values of two polarization directions were averaged for ⊥F and S. Bar height gives the attenuation value at 1 MHz.

Figure 4.
(a) Longitudinal attenuation of unidirectional CFRPs of AS4-3501 epoxy, AS4-PMR15, G50-epoxy, T700-2501 epoxy, and T700-UF3369 epoxy for propagation directions L, T, and S (in blue, red, and green bars). (b) Transverse attenuation of CFRPs as in a. The results of two polarization directions were averaged for T and S. Bar height gives the attenuation value at 1 MHz.
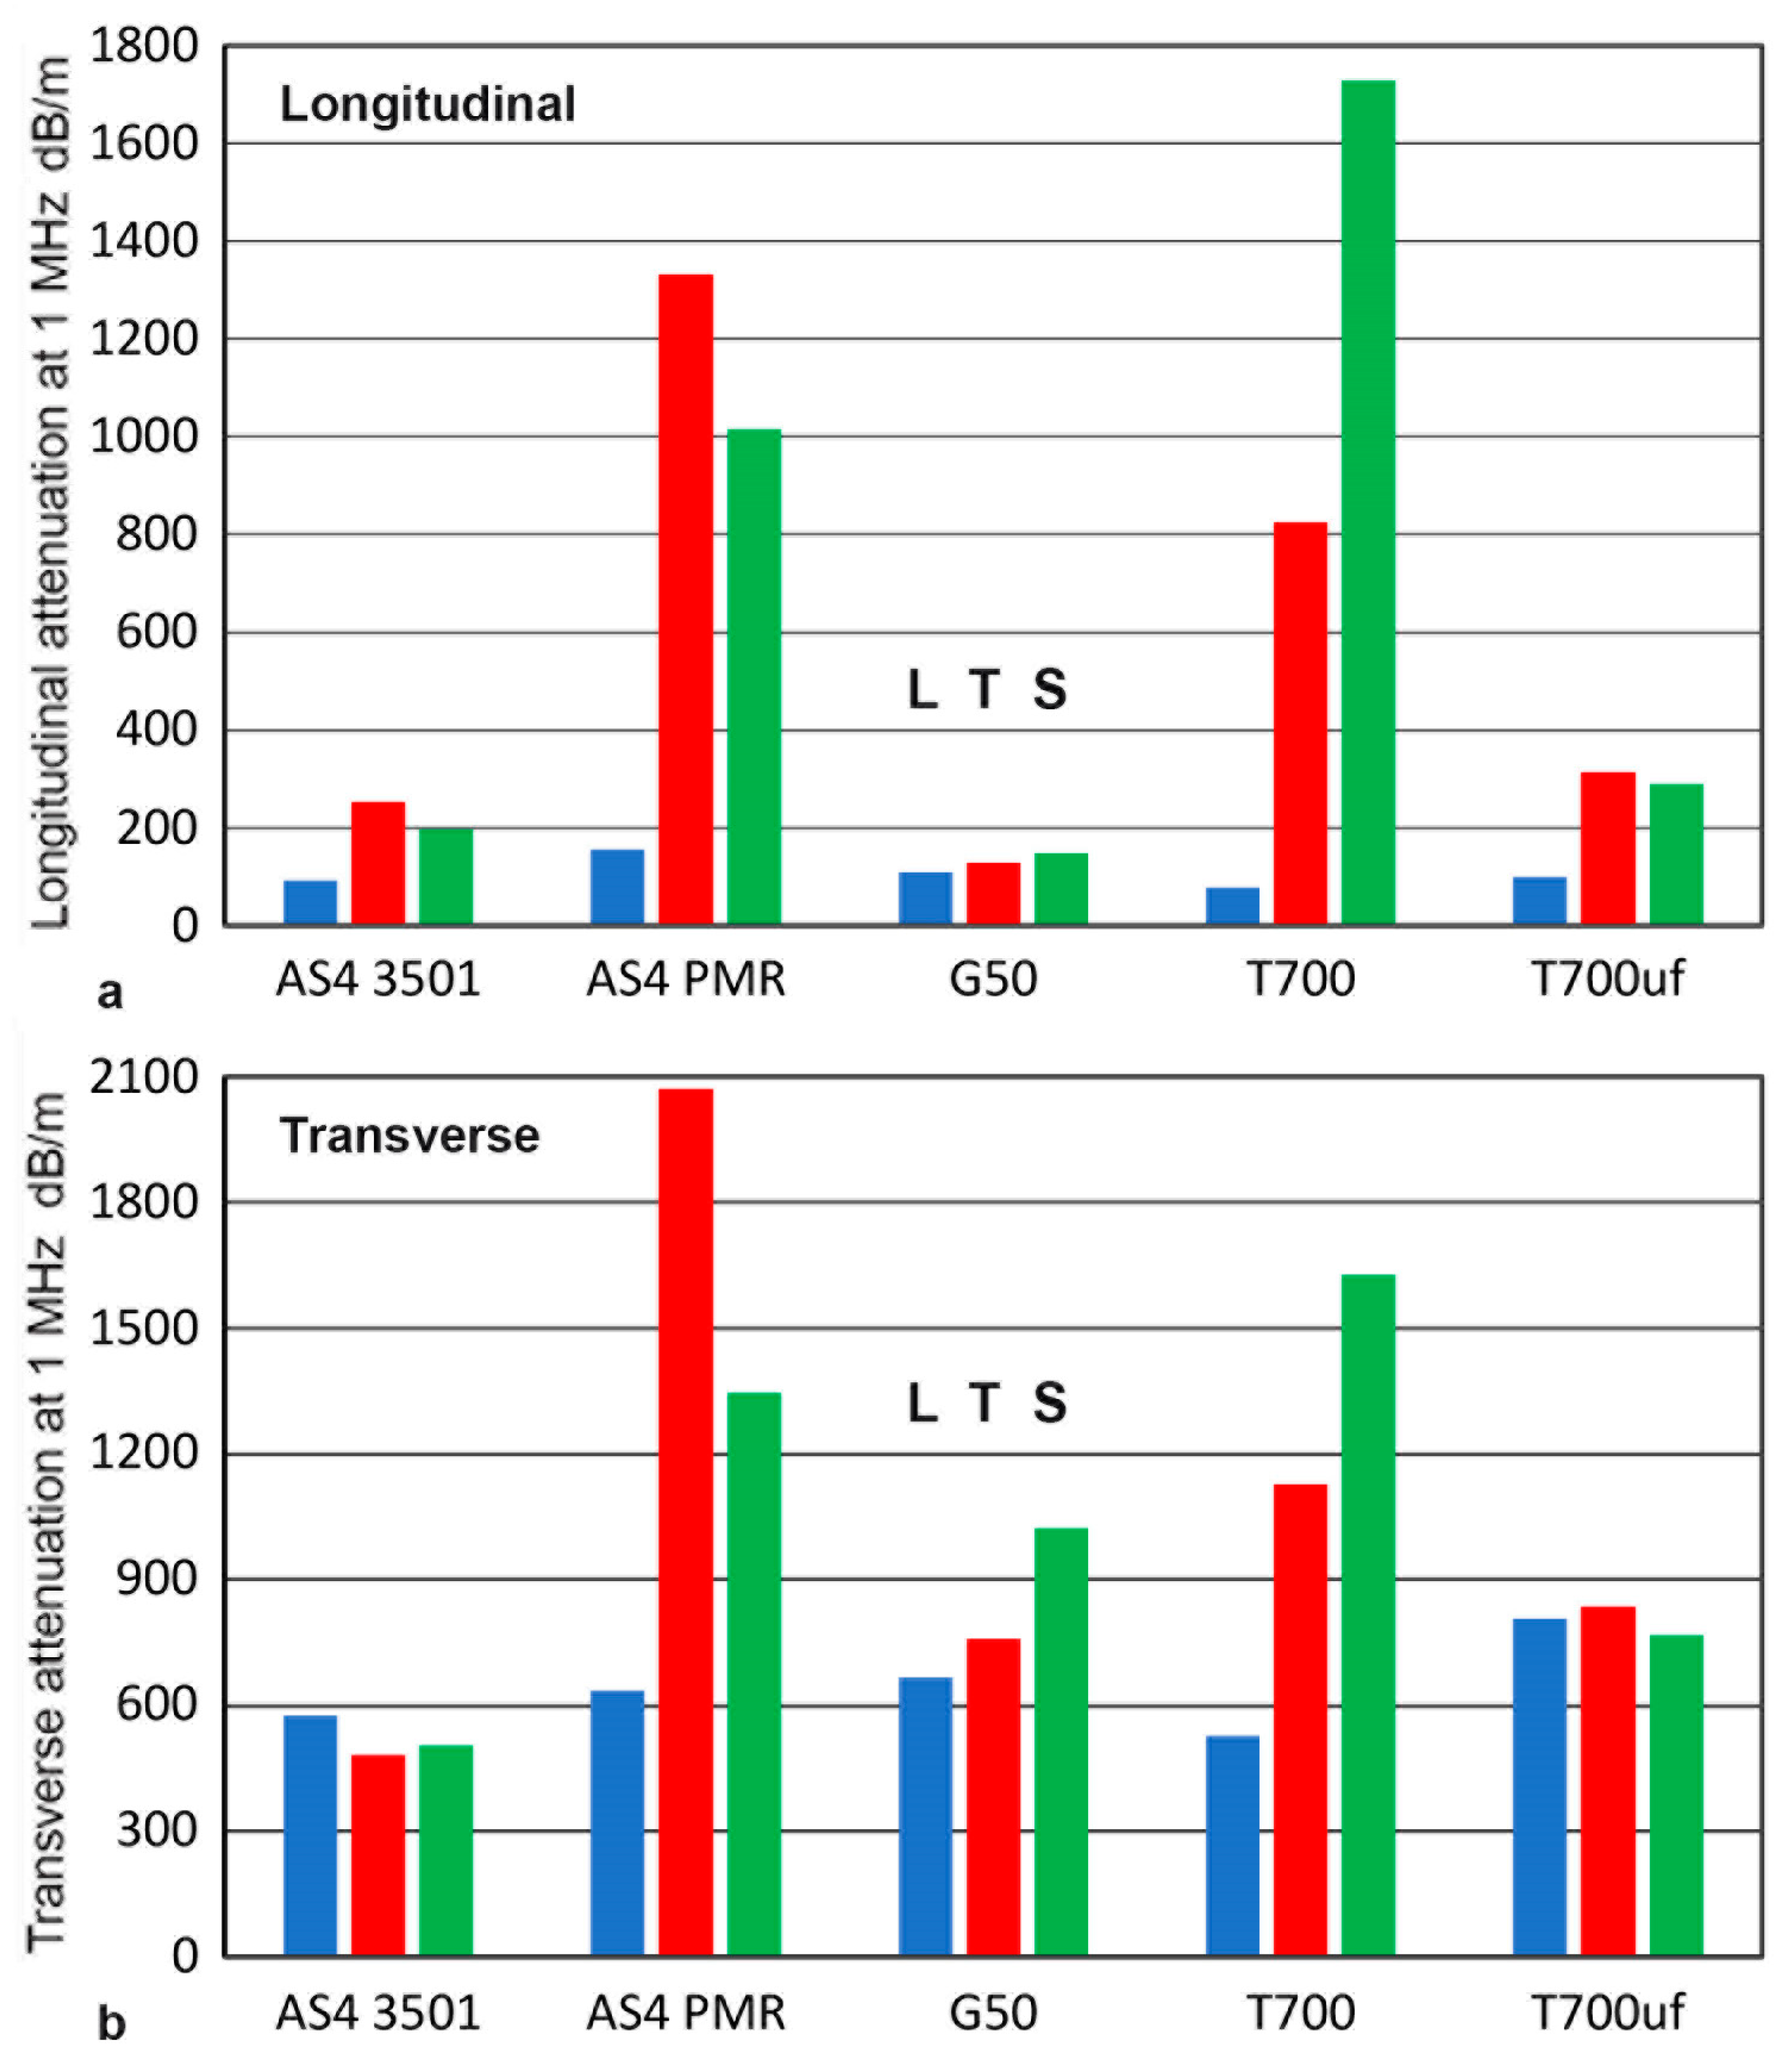
Figure 5.
(a) Longitudinal attenuation of quasi-isotropic CFRPs of AS4-epoxy, XN50-epoxy, AS4- PMR15, and AS4-PPS for wave directions L and S (in blue and green bars). (b) Transverse attenuation of CFRPs as in a. For L orientation, two polarization directions are marked as //F and ⊥F, given in blue and red bars, and S in green. Bar height gives the attenuation value at 1 MHz.

Table 1.
CFRP sample parameters.
| Fiber | Ef GPa | Matrix | Lay-Ups | Fiber Volume | Size mm | Supplier |
|---|---|---|---|---|---|---|
| AS4 | 235 | 3501-6 epoxy | UD | 56.8% | 29.5 × 24.3 × 20.0 | NASA Langley |
| AS4 | 235 | 3501-6 epoxy | XP | 56.8% | 28.0 × 17.4 × 26.0 | NASA Langley |
| AS4 | 235 | 3501-6 epoxy | QI | 56.8% | 26.0 × 17.7 × 23.0 | NASA Langley |
| G50 | 360 | F584 epoxy | UD | 60.0% | 29.0 × 19.9 × 28.9 | Hexcel/UCLA |
| G50 | 360 | F584 epoxy | XP | 60.0% | 91 × 45 × 4.7 | Hexcel/UCLA |
| AS4 | 235 | PMR15 | UD | 58.4% | 14.5 × 19.0 × 18.5 | Rohr Industries |
| AS4 | 235 | PMR15 | QI | 58.4% | 16.6 × 16.6 × 14.9 | Rohr Industries |
| AS4 | 235 | PPS | QI | 63.6% | 29.3 × 22.0 × 15.5 | Rohr Industries |
| XN50 | 490 | C25 epoxy | QI | 56.0% | 18.1 × 19.4 × 14.0 | Nippon Oil |
| T700 | 230 | 2501 epoxy | UD | 48.2% | 23.7 × 18.8 × 15.6 | Toray/UCLA |
| T700 | 230 | UF3369 epoxy | UD | 59.7% | 13.2 × 12.2 × 13.5 | Toray/UCLA |
| T300 | 230 | epoxy | XP | 59.0% | 127 × 127 × 7.7 | Northrup |
Disclaimer/Publisher’s Note: The statements, opinions and data contained in all publications are solely those of the individual author(s) and contributor(s) and not of MDPI and/or the editor(s). MDPI and/or the editor(s) disclaim responsibility for any injury to people or property resulting from any ideas, methods, instructions or products referred to in the content. |
© 2023 by the author. Licensee MDPI, Basel, Switzerland. This article is an open access article distributed under the terms and conditions of the Creative Commons Attribution (CC BY) license (https://creativecommons.org/licenses/by/4.0/).
Share and Cite
MDPI and ACS Style
Ono, K. Ultrasonic Attenuation of Carbon-Fiber Reinforced Composites. J. Compos. Sci. 2023, 7, 479. https://doi.org/10.3390/jcs7110479
AMA Style
Ono K. Ultrasonic Attenuation of Carbon-Fiber Reinforced Composites. Journal of Composites Science. 2023; 7(11):479. https://doi.org/10.3390/jcs7110479
Chicago/Turabian StyleOno, Kanji. 2023. "Ultrasonic Attenuation of Carbon-Fiber Reinforced Composites" Journal of Composites Science 7, no. 11: 479. https://doi.org/10.3390/jcs7110479