Article

Cu-Doped Porous ZnO-ZnAl2O4 Nanocomposites Synthesized by Polymer-Salt Method for Photocatalytic Water Purification

1
Faculty of Photonics, ITMO University, 197101 Saint-Petersburg, Russia
2
Faculty of Chemistry of Substances and Materials, Saint-Petersburg State Technological Institute, Technical University, 190013 Saint-Petersburg, Russia
3
JVC RPA Vavilov State Optical Institute, 192174 Saint-Petersburg, Russia
*
Authors to whom correspondence should be addressed.
J. Compos. Sci. 2023, 7(7), 263; https://doi.org/10.3390/jcs7070263
Submission received: 24 May 2023 / Revised: 9 June 2023 / Accepted: 19 June 2023 / Published: 21 June 2023
(This article belongs to the Special Issue Composite Materials for Water Purification)

Abstract

:
In this work, the adsorption and photocatalytic properties of ZnO-ZnAl2O4-CuO nanosized porous composites synthesized by the polymer-salt method have been studied. To evaluate the efficiency of adsorption, experiments were carried out on the decolorization of aqueous solutions of the Chicago Sky Blue diazo dye. The adsorption process is divided into two stages, at the first stage, the dye is rapidly adsorbed on the outer surface of the composite particles (kf = 0.0073 min−1), at the second stage, the dye diffuses into the pores of the material (kf = 0.0007 min−1). It was noted that the rate of photocatalytic decomposition of the dye (kf = 0.021 min−1) is higher than the rate of the adsorption process, which indicates the occurrence of photocatalytic decomposition of dye molecules both on the surface of the composites and in the liquid phase. With an increase in the light intensity, the photocatalytic process is significantly accelerated, linearly at low intensities, and at high intensities (I > 100 mW/cm2) the dependence becomes a power law.

1. Introduction

Photocatalytic processes are widely studied and used for water and air purification, water splitting and other practical applications [1,2,3,4,5]. Nanomaterials based on ZnO are effective photocatalysts that are used for water and air purification [4,5,6,7,8,9,10,11,12,13].
It is known that the photocatalytic process includes the light absorption by semiconductors, generation of electron-hole pairs, and formation of chemically active oxygen species (hydroxyl radicals OH, singlet oxygen, etc.), which oxidize organic contaminations on the surface of photocatalyst [1,2,3,14]. Therefore, the role of different processes proceeding on the semiconductor’s surface during photocatalytic processes is very important. The increase in the material’s specific surface area at the application of nanoscale semiconductors promotes their photocatalytic activity.
The decrease in the size of semiconductors ZnO crystals can be achieved by the optimization of their synthesis conditions [11,15] or by the formation of mixed photocatalytic ZnO-RxOy composites (R = Mg, Al, Y, Sn, etc.) [16,17,18]. The simultaneous formation of different crystals prohibits their growth and aggregation, and provides the formation of the material structure consisting of small particles with a high specific surface area.
ZnO-ZnAl2O4-CuO porous nanocomposites having high bactericidal properties were synthesized and studied in detail [19]. ZnAl2O4 nanoparticles demonstrate high photocatalytic properties [20,21,22,23,24,25,26,27,28] that determined their application as a component of the prepared composite. Cu additions improve the photocatalytic properties of ZnAl2O4 [29].
It is known [15,26,27,28,29,30] that besides chemical composition the material morphology plays an important role in the photocatalytic effectiveness. The application of the photocatalysts with specially designed morphology (nanowires, flower-like nanoparticles, porous photoactive matrixes, etc.) demonstrates high photocatalytic effectiveness [31,32]. So, porous photocatalysts have high adsorption capability and provide an effective decomposition of organic contaminants that determines their promise for practical environmental application [30,32]. However, the kinetics of photocatalytic and adsorption processes in porous matrixes has some specific features [20,30,32,33,34] that require those study.
To assess the photocatalytic properties of materials, a technique based on the study of their effect on the efficiency of organics decomposition in solution is used often [21,31,35,36]. Azo dyes represent the largest production volume of dye chemistry today, and their relative importance may even increase in the future [37]. They play a crucial role in the governance of the dye and printing market. However, the presence of these dyes and pigments can cause a significant alteration in the ecological conditions of the aquatic fauna and flora, because of the lack of their biodegradability [38]. Therefore, the application of azo dye as a modal contaminant for photocatalytic tests of developed composites is reasonable.
The aim of this work is to study the features of kinetics of diazo dye adsorption and photooxidation in the solutions containing additions of ZnO-ZnAl2O4-CuO composites.

2. Materials and Methods

The polymer-salt method which is applied for the synthesis of different nanoparticles [15,16,30,33] was used in this study. The aqueous solutions of Zn(NO3)2, Al(NO3)3 and CuSO4 were used as raw materials for the nanocomposites synthesis. The solution of polyvinylpyrrolidone (PVP) (K30; Mw = 25,000 ÷ 35,000) in propanol-2 was added to the mixture of aqueous solutions of metal salts. Liquid mixtures were stirred for 30 min at room temperature. After drying obtained polymer-salt composites were calcined in an air atmosphere at 680 °C for 2 h. Chemical compositions of initial solutions and obtained composites are given in Table 1. These two compositions have different Zn/Al molar ratio (Table 1) that provides the variation of the crystal structure, morphology and properties of prepared composites.
The morphology of composites was studied by SEM analysis using a microscope Supra 55VP. The analytical elemental chemical composition of glass was determined by the EDS method using setup Advanced Aztec Energy (Oxford Instruments). The differences between nominal and analytical chemical compositions were less than 6%.
The diffractometer Rigaku Ultima IV was used for X-ray diffraction (XRD) analysis of prepared materials. The diffraction patterns were scanned from 20° to 100° (2θ). The crystallite size was calculated using Scherrer’s equation:
d = 0.9   λ β   cos θ ,
where d is the average grain size of the crystallites, λ—is the incident wavelength, θ—is the Bragg angle (radians) and β is the full width at half maximum (FWHM) in radians.
It is known that chemically active singlet oxygen has the characteristic luminescence band in NIR spectral range (λmax = 1270 nm) [39]. An experimental luminescence setup, previously described in [40], was used for the study of singlet oxygen photo-generation in prepared materials. Two different LEDs (HPR40E set) (λmax = 370 nm; power density 0.35 W/cm2) and (λmax = 405 nm; power density 0.90 W/cm2) were used for luminescence excitation.
Diazo dye Chicago Sky Blue (CSB) (Sigma Aldrich, St. Louis, MO, USA) was used as a model of organic contamination in adsorption and photocatalytic experiments. This dye was used earlier for the estimation of the photocatalytic properties of different materials [30,33,41]. The mass of the powder portions used in the experiments was 0.01 g. The powder portions were mixed with 3 mL of an aqueous dye solution (all dye solutions will be aqueous) and placed in a quartz cuvette. The dye content in the initial solutions was 41 mg/L.
A mercury lamp (DR-240, Saransk, Russia) was used for UV irradiation of the cuvette with dye solution. The cuvette was disposed of at the different predetermined distances from the lamp to study the effect of the light intensity on the rate of a photocatalytic process. The power density of the radiation was varied from 45 to 600 mW/cm2.

3. Results and Discussion

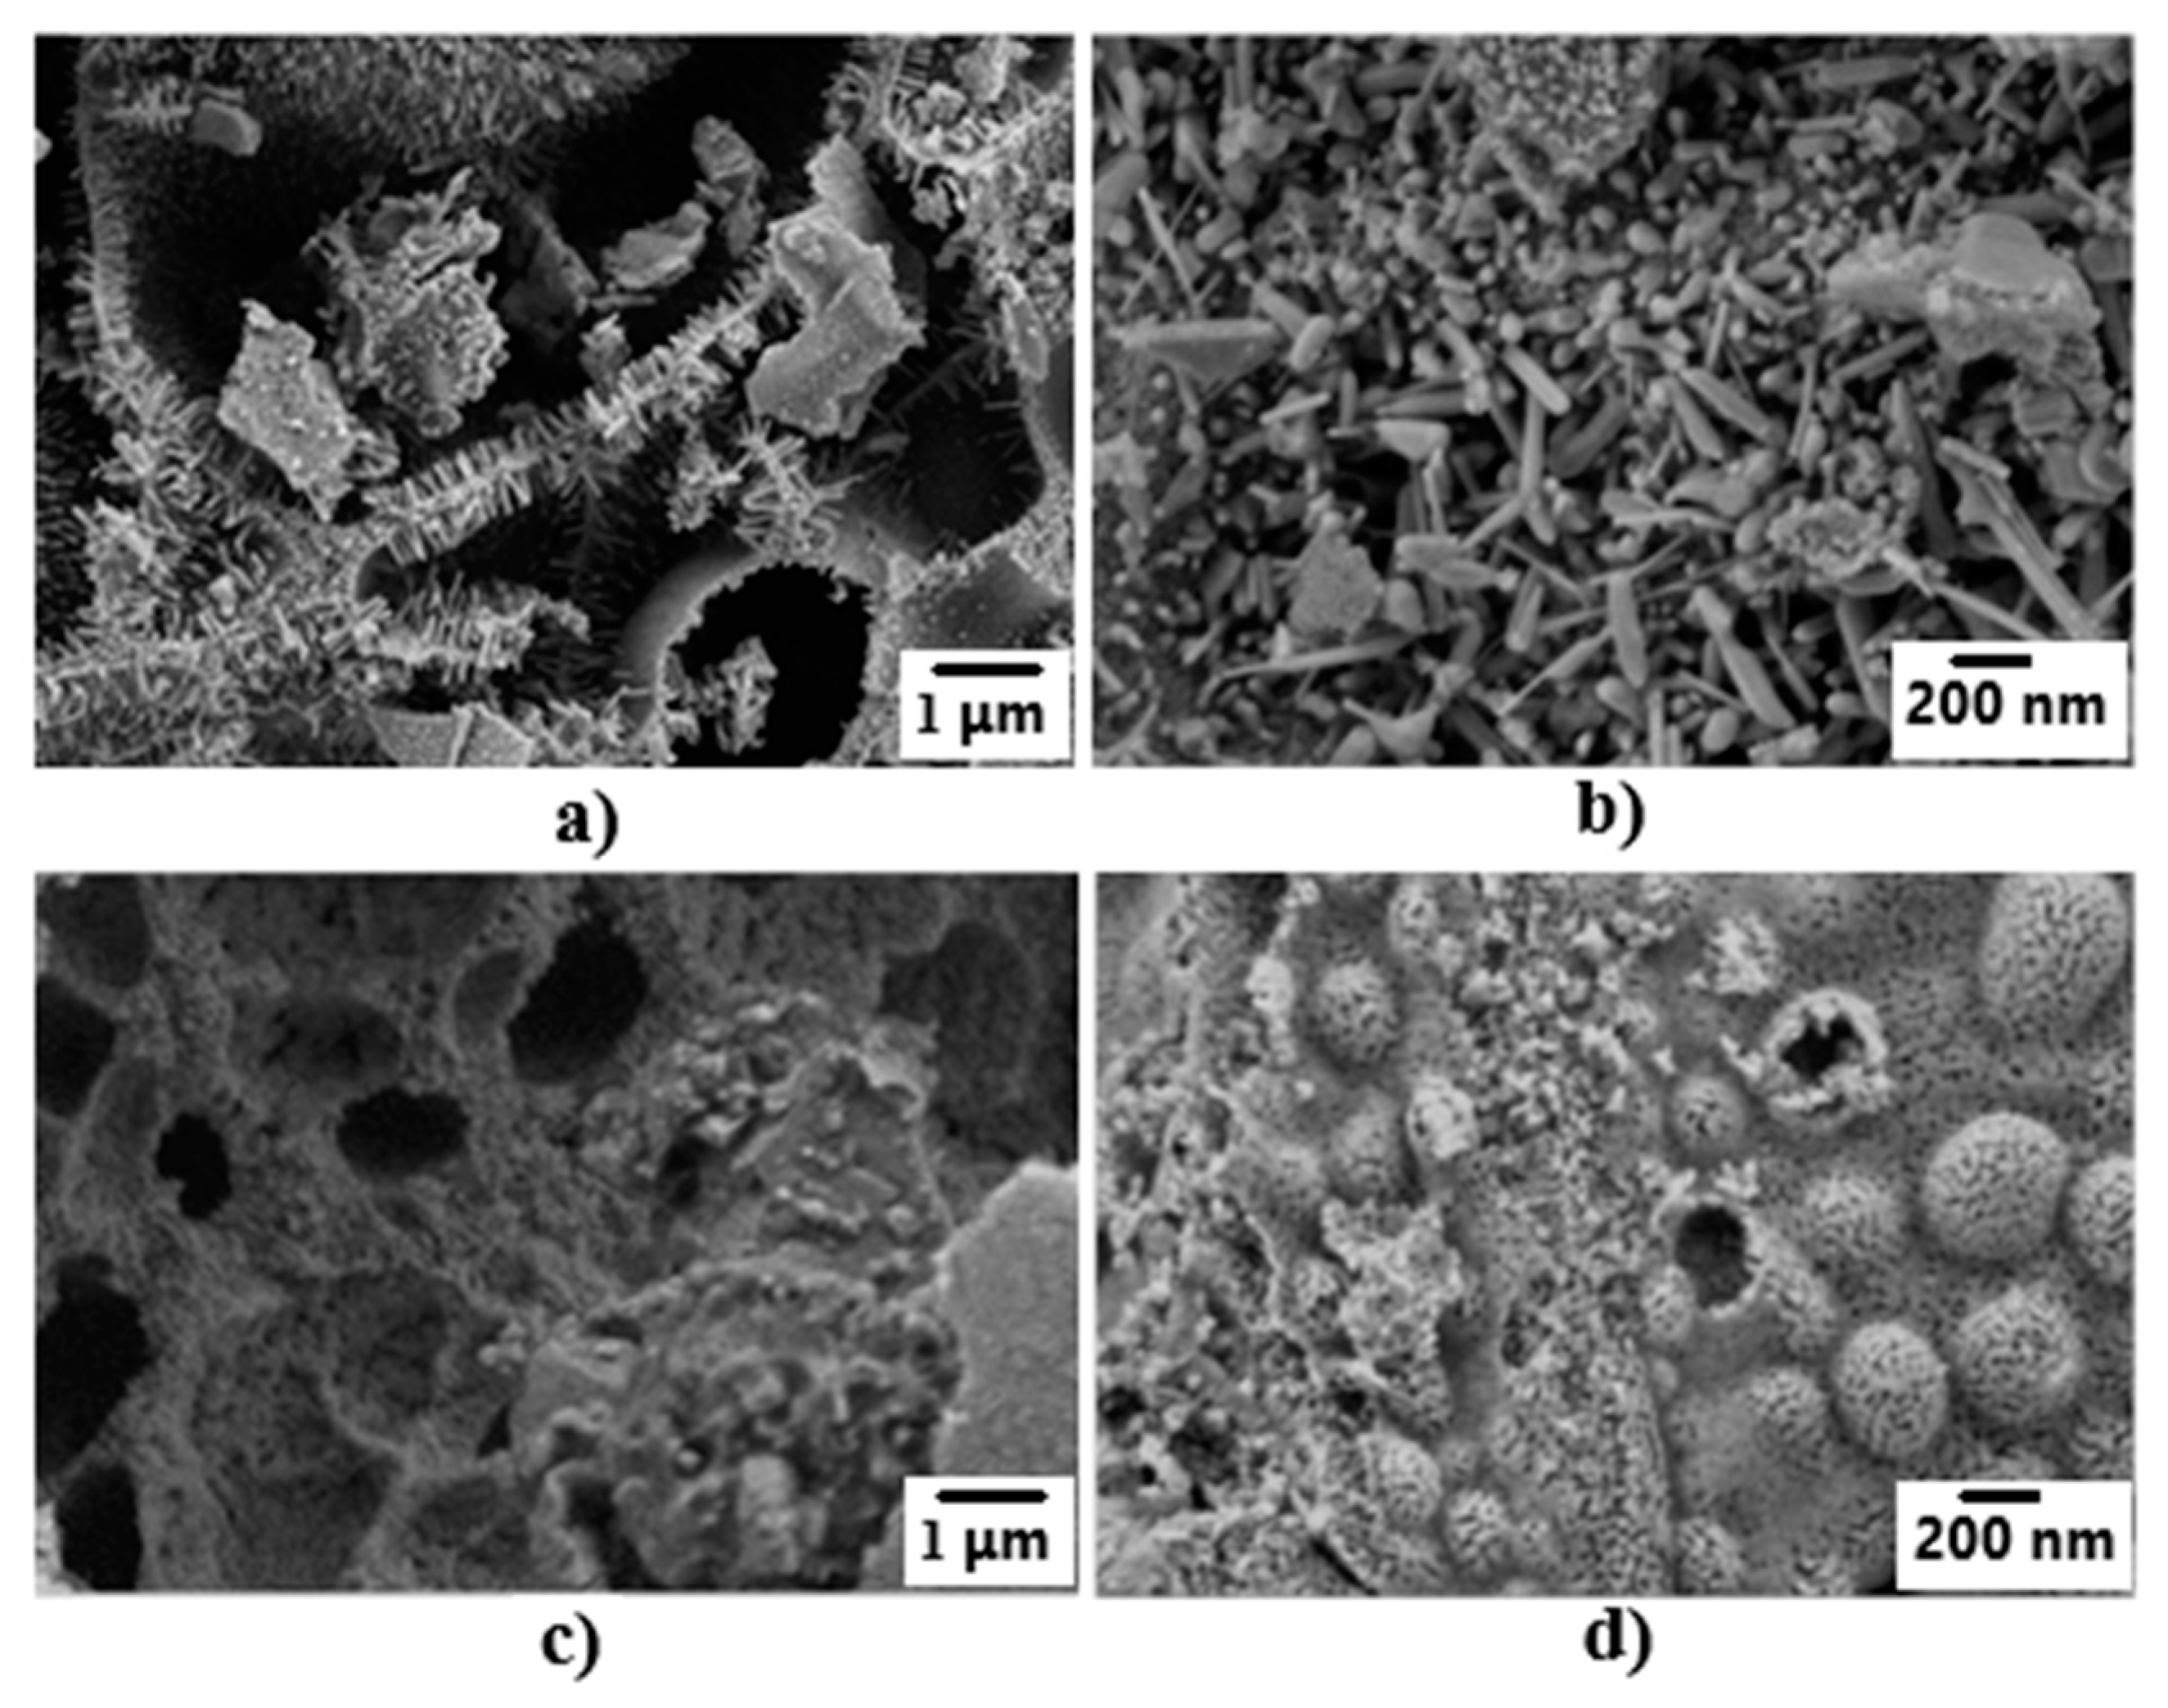
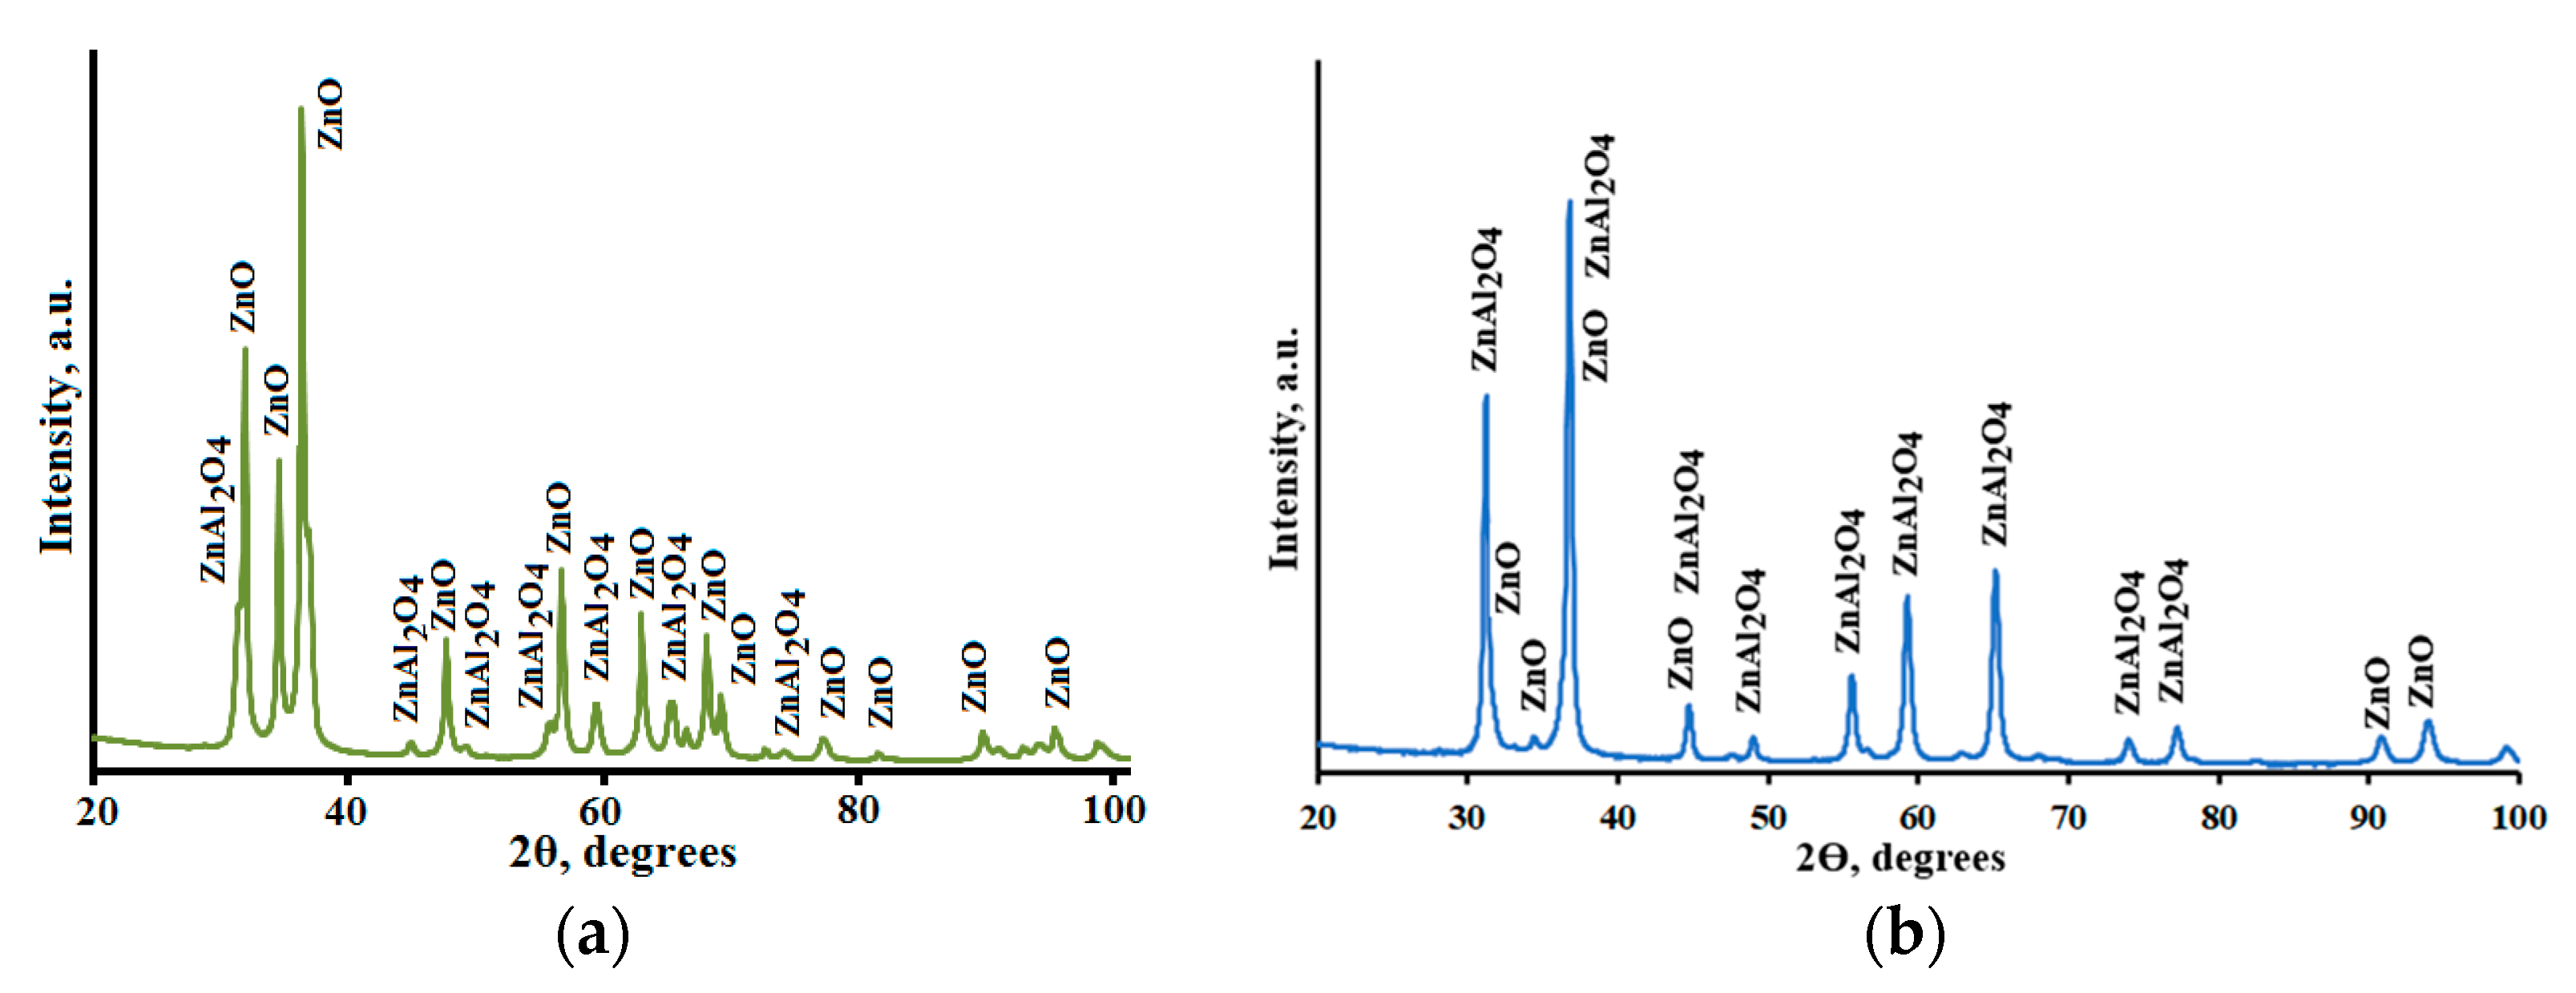
3.1. Crystal Structure and Morphology of ZnO-ZnAl2O4-CuO Composites

Figure 1 shows the SEM images of composites 1 (a,b) and 2 (c,d) at different magnifications. Both composites consist of small nanoparticles that determine the high value of their specific surface area. Composite 1 consists of small nanoparticles many of them having shape rods (Figure 1a,b). Numerous pores are observed in the structure of composite 2 (Figure 1c,d). The observed difference in powder morphologies is determined by the chemical compositions of prepared powders.
Figure 2 shows the XRD pattern of composites 1 (a) and 2 (b). Intensive peaks are characteristic of hexagonal ZnO crystals (JCPDS No. 36–1451) and small peaks related to cubic crystals of ZnAl2O4 (JCPDS No. 05-0669) are observed. The ratios between intensities of different ZnO peaks are close to standard values that indicate the absence of the texture in prepared materials. The average crystal size of ZnO crystals calculated using Scherrer’s equation is 25 nm. The calculated lattice constants of hexagonal ZnO crystals are: a = 3.2447 Å and c = 5.1955 Å, which is less than the lattice constants values given for pure ZnO in the review [42] (a = 3.2475 ÷ 3.2501 Å; c = 5.2042 ÷ 5.2075 Å).
Ionic radii of Cu2+ ions is slightly less than ionic radii of Zn2+ (0.57 and 0.60 Å, correspondingly) and Cu2+ easily replaces Zn2+ in the crystal structure which leads to the contraction of the crystal cell [43]. The absence of any peaks of Cu compounds (Figure 2) and lower values of lattice parameters a and c of formed ZnO crystals compared with the literature data [42] may indicate the incorporation of copper ions into the structure of ZnO crystals.
Intensive peaks of cubic ZnAl2O4 crystals and small peaks of ZnO crystals are observed in the XRD pattern of composite 2. The data of XRD correspond to the chemical compositions of prepared composites and show that these materials consist of small ZnO and ZnAl2O4 nanocrystals.

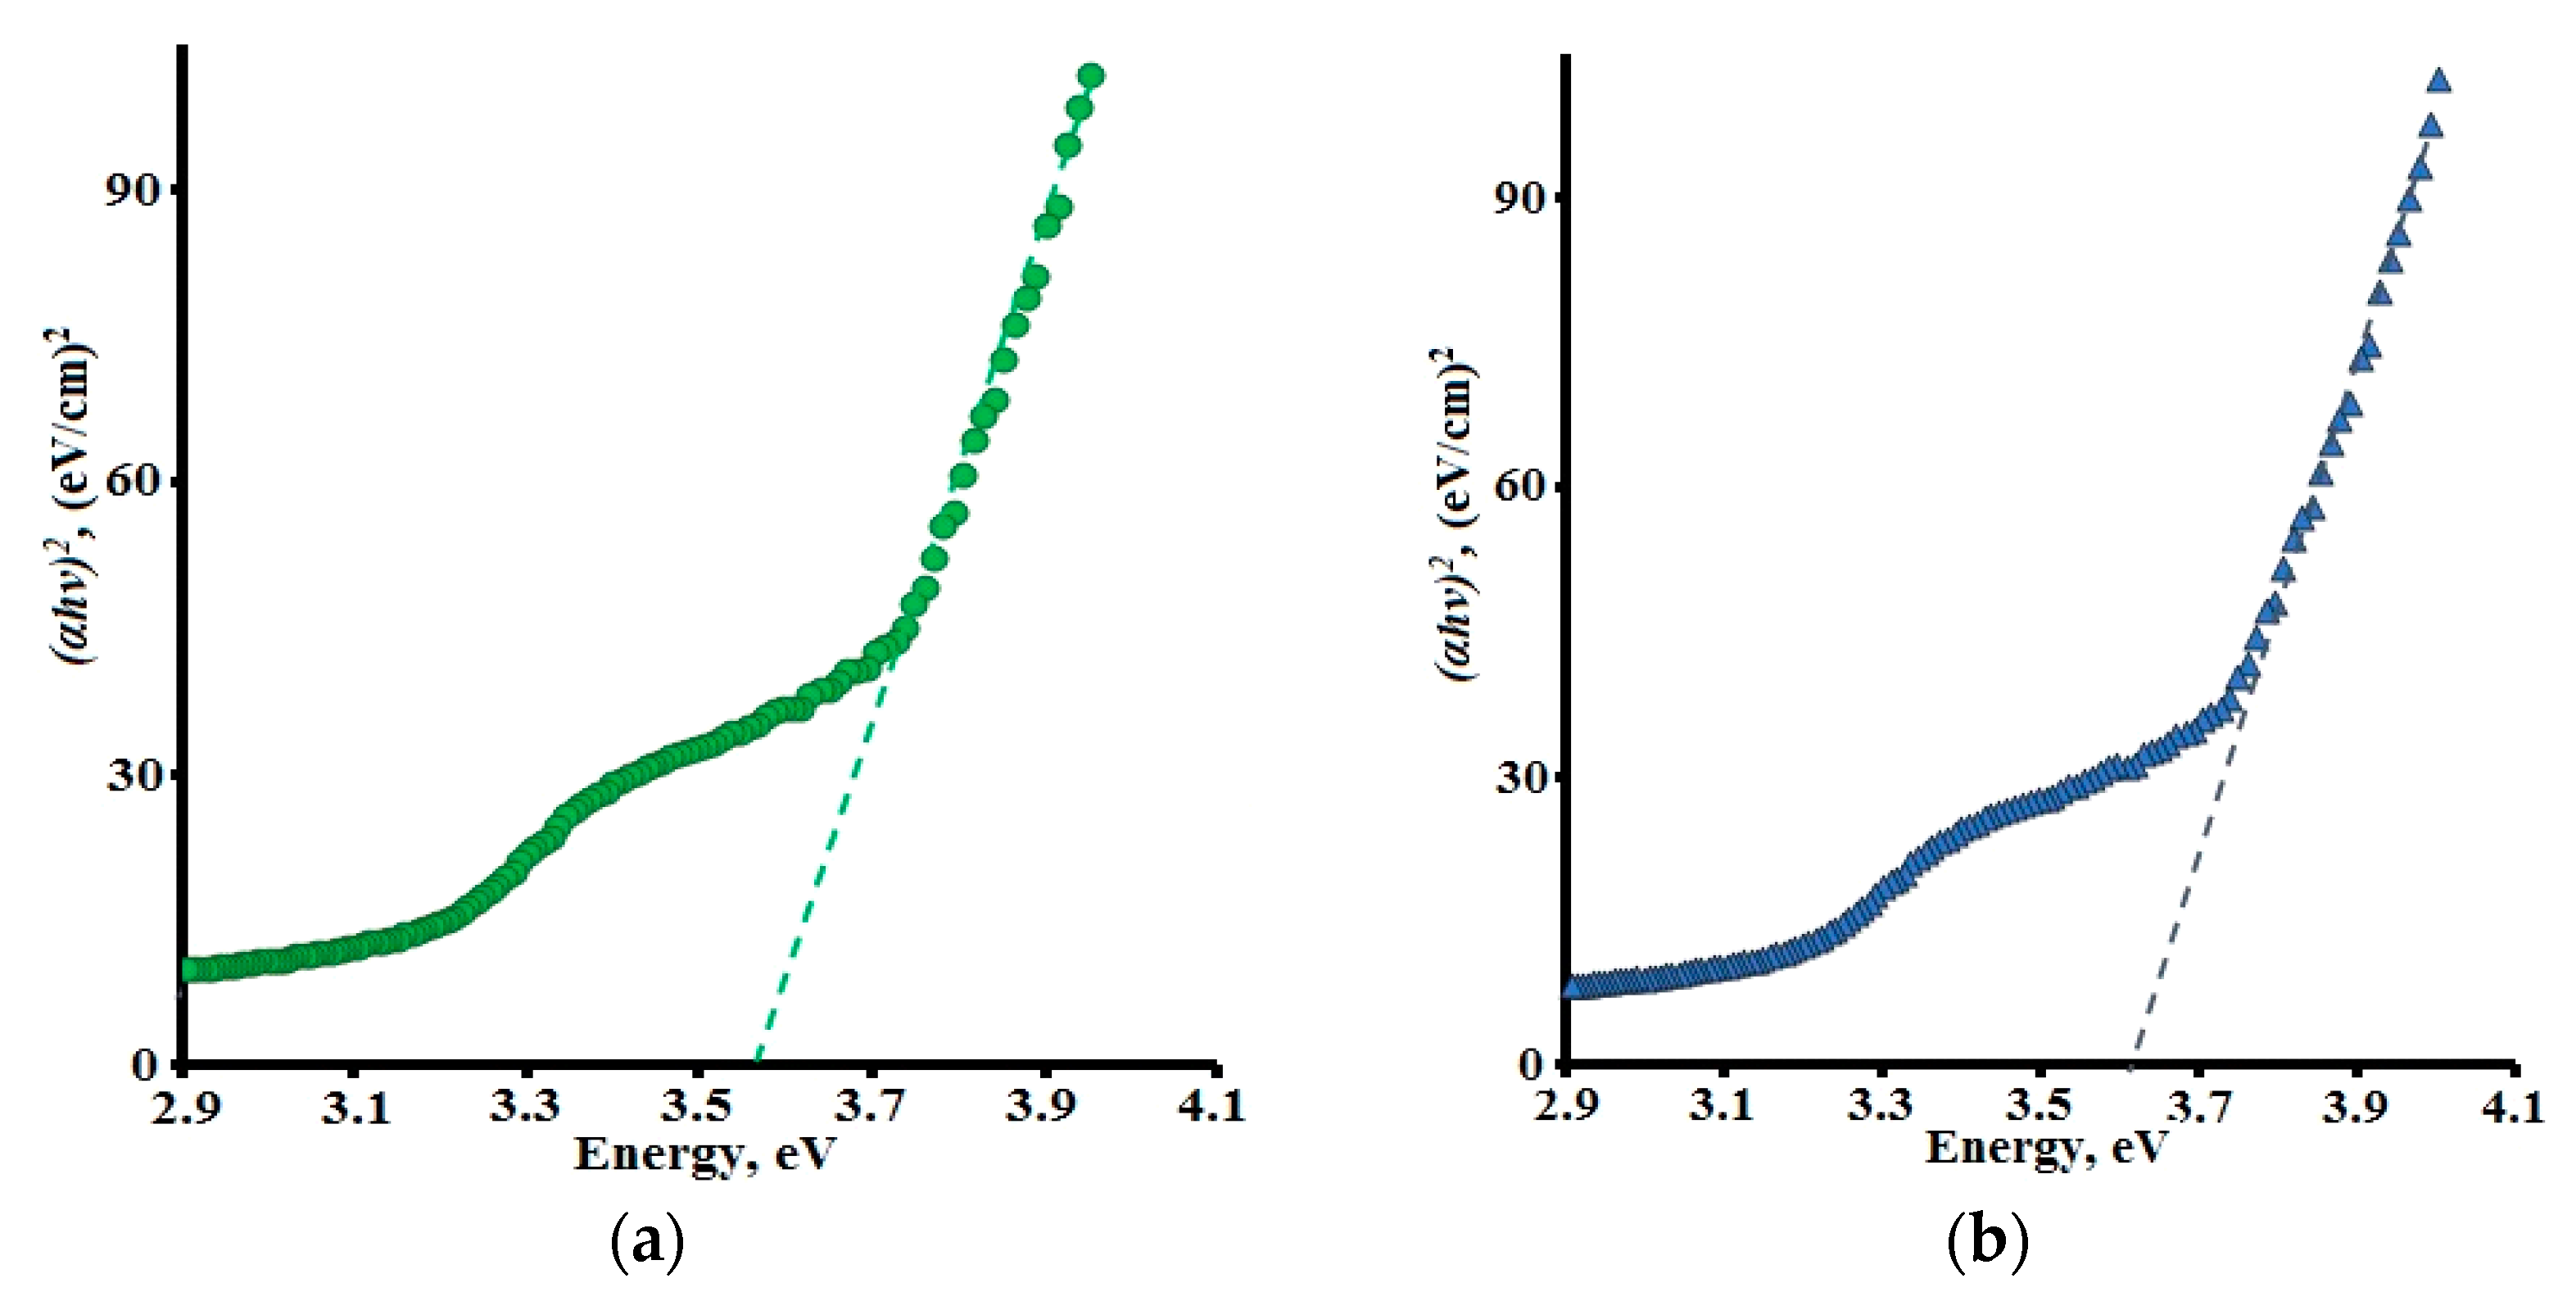
3.2. Band Gap Values

It is well-known that the band gap value is one of the most important parameters of photocatalytic material which significantly affects its photocatalytic effectiveness and determines requirements for the spectral range of exciting radiation. The measurements of composites absorption spectra showed that the absorption edges of both powders are ~370–380 nm.
To determine the material band gap value, Tauc’s equation was used [44]:
(αhν) 2 = A(hν-Eg)
where is a photon energy, Eg is a semiconductor band gap value, A is a constant, and α is an absorption coefficient. The graph construction in the coordinates (αhν)2 = f(hν) allowed us to define the band gap value of studying materials (Figure 3).
The band gap values of multicomponent ZnO-based semiconductors were described sufficiently by Vergard’s law at b = 0 [44,45,46]. For (100-x-y)ZnO-xAl2O3-yCuO material with x molar fraction of ZnAl2O3, y molar fraction of CuO and b = 0, Verlag’s law can be expressed by the equation:
Eg(ZnO-ZnAl2O4-CuO) = xEgZnO + yEgZnAl2O4 + (1-x-y)EgCuO,
where Eg(ZnO-ZnAl2O4-CuO) is a composite band gap value, EgZnAl2O4, EgCuO, and EgZnO are band gap values of ZnAl2O4, CuO and ZnO, respectively. The substitution of molar ratios of oxides and their band gap values (EgZnO ~ 3.37 eV [47], EgZnAl2O4 ~ 3.85 eV [48], EgFe2O3 = 1.51 eV [49]) into Equation (3) gives Eg(ZnO-ZnAl2O4-CuO) values 3.43 eV and 3.68 eV for composites 1 and 2, correspondingly.
As can be seen from Figure 3, experimental Eg values of composites 1 and 2 are ~3.55 and 3.63 eV. The differences between calculated and experimental Eg values are not significant. It is possible to conclude that Equation (3) described experimental data successfully.

3.3. Photostimulated Discoloration of Dye Solutions

3.3.1. Photolysis of Dye Molecules in Solutions

Figure 4 demonstrates the influence of UV irradiation on the absorption spectra of CSB solutions without the addition of composite (a) and with the addition of powder 2 (b). The intensity of the dye absorption band (λmax = 612 nm) decreases in the spectra of both solutions under UV irradiation.
The changes in absorption spectra of CSB solution without the addition of photocatalytic composite are determined by the dye photolysis in the solution. Figure 4a shows that these changes are small after 20 min of UV irradiation.
Figure 4b exposes the effect of UV irradiation on the absorption spectra of CSB solution containing powder 2. It is seen that the shape of dye absorption spectra has remained during irradiation. This fact suggests that forming intermediate products of dye decomposition have not remarkable light absorption in the visible spectral range. The behavior of spectral changes is similar to that reported for CSB photodecomposition in solutions with other photocatalysts [30,33,41].

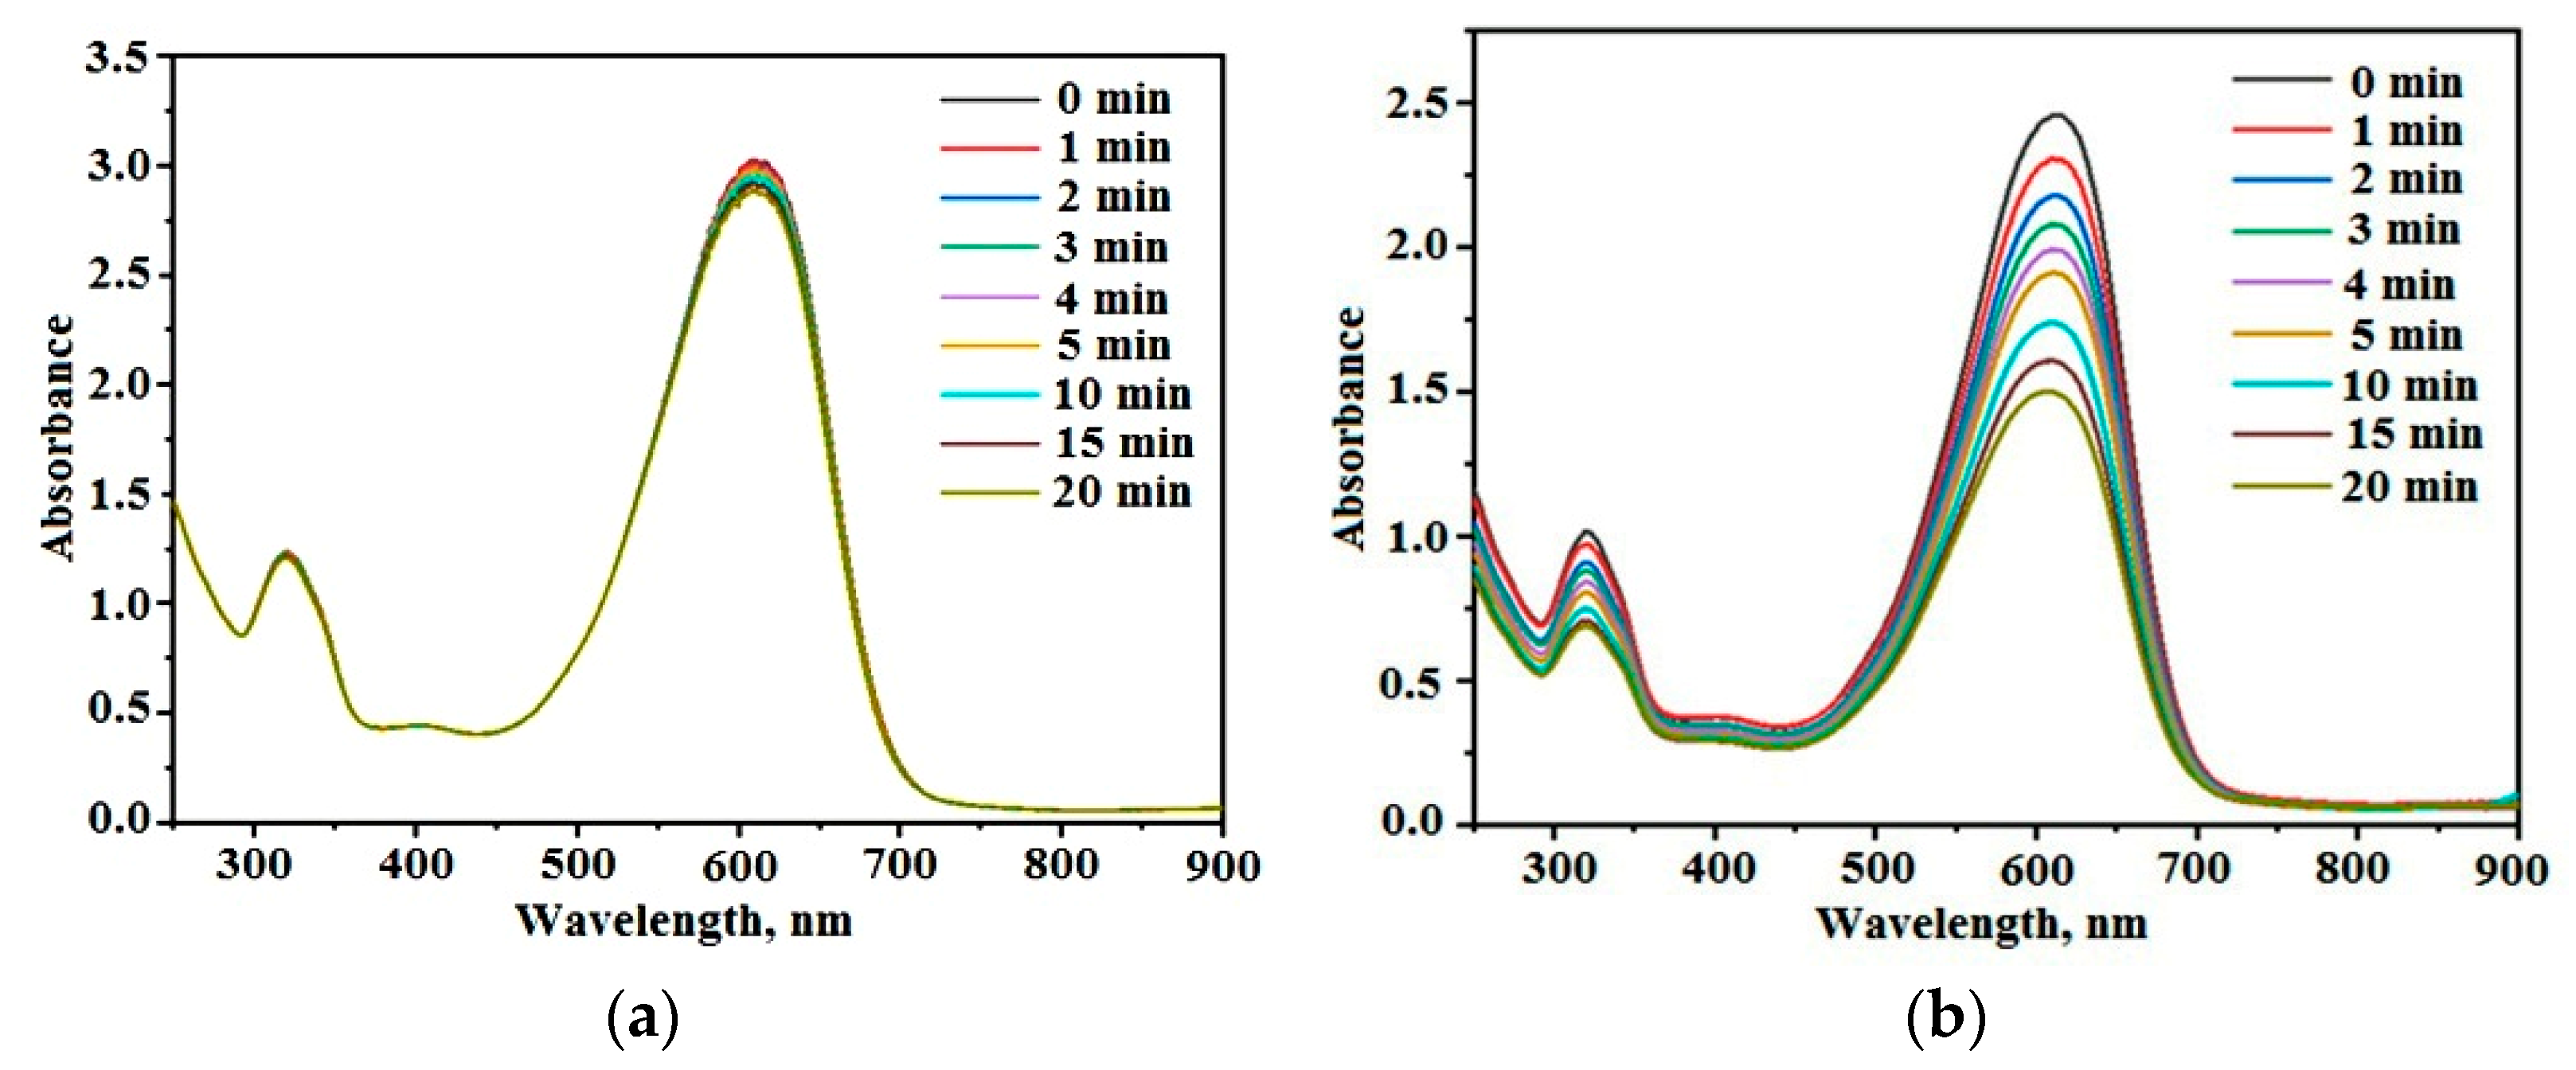
3.3.2. Photocatalytic Discoloration of Dye Solutions

The kinetic dependence of the photo decoloration of CSB solution without photocatalytic additions is shown in Figure 5 (curve 1). The decomposition of CSB in solution without photocatalysts proceeded slowly: less than 4% of dye molecules were decomposed after UV treatment for 20 min. Dye photolysis is a photochemical reaction proceeding without a photocatalyst. The kinetics of this process is described often by the equation of pseudo-first order:
C = C 0 × e k t ,
where C and C0—current and initial dye concentrations; k—constant rate of photochemical reaction; t—time.
Experimental data are described by the equation pseudo-first-order (3) with the constant rate k = 0.002 min−1 and determination coefficient R2 = 0.9319. Obtained experimental data showed that the photolysis of dye molecules in the solutions without photocatalytic additions is a slow process and the input of this process in the total dye decomposition during the photocatalytic process is small.
The rates of photocatalytic dye oxidation (Figure 5, curves 2 and 3) are significantly higher than the rate of dye photolysis without photocatalysts (curve 1). The input of the last process in the total dye decomposition during the photocatalytic process is small. The significant difference in dye decomposition rates observed at the use of composites 1 and 2 is related to the difference of their chemical composition and morphology (Figure 1 and Table 1).
The Langmuir–Hinshelwood (L–H) kinetic model is used often to describe semiconductor photocatalysis [1,50]. According to this model, the dye decomposition rate r is described by the kinetic equation: [1,2,3,4,25,49]:
r = d C d t = k 1 K a C 1 + K a C ,
where C—current dye concentration at the time t, k1—constant rate of dye decomposition, Ka—constant of adsorption-desorption equilibrium. At low dye content (C << 1 mM), Equation (5) is simplified to a pseudo-first-order equation [50,51,52]:
l n C | C 0 = k 1 K a t = k a p p t ,
where kapp—apparent constant rate of pseudo-first order. Kinetics dependencies of the photodecomposition of CSB in the solutions containing additions of powders are described sufficiently by Equation (6) with determination coefficients R2 = 0.9689 and 0.9877 for composites 1 and 2, correspondingly. These results agreed with the data of the work [52] in which was demonstrated that the L–H model corresponds to the kinetics of photodecomposition of an azo dye by porous photocatalysts at the initial stages of the process.
The comparison of the constant rates of CSB photodecomposition under UV irradiation (power density 20 ÷ 25 mW/sm2) in aqueous solutions with different photocatalytic additions are exposed in Table 2. These data show that all Zn-containing materials demonstrate photocatalytic activity. Hetero-structural semiconductor composites ZnO-SnO2 and ZnO-ZnAl2O4-CuO demonstrate the highest photocatalytic activity. The photocatalytic activity of composite 2 is significantly less.
Authors [24] proposed that the high photocatalytic properties of ZnO-ZnAl2O4 composites are attributed to the efficient spatial separation of the photo-generated electrons and holes between ZnO and ZnAl2O4 particles. It is possible to suggest that the observed relatively weak photocatalytic properties of composite 2 can be related to the small content of ZnO in the structure (Table 1).
The photocatalytic activity of synthesized oxide composites is determined by their ability to photogeneration of reactive oxygen species (ROS). In this work, the ability of the photogeneration of singlet oxygen by ZnO-ZnAl2O4-CuO composites was studied by the luminescent spectroscopy in NIR spectral range. Figure 6 shows the luminescence spectra of composite 1 in the NIR spectral range. The emission band with λmax = 1270 nm characteristic for singlet oxygen is observed in these spectra [39,40]. The comparison of Figure 6a,b shows that the luminescent band intensities are higher at the irradiation of blue light (λex = 405 nm). This is related to the higher power density of blue LED compare with UV LED (look at “Material and Methods” section).

3.3.3. Dye Adsorption from Solutions on the Surfaces of Composites

Observed solutions discoloration in the presence of photocatalytic composites is determined by a few different processes:
  • The dye photolysis in the liquid phase;
  • Its adsorption on the powder surface;
  • Photocatalytic dye decomposition.
Figure 7a demonstrates changes in absorption spectra of dye solution containing powder 1 during the adsorption process in the darkness. The behavior of these changes is similar to that observed during UV irradiation of dye solutions. Approximately 25–30% of dye molecules are adsorbed on the surface of the composite 1 during the first 120 min of the adsorption process. It is worth noticing that adsorption process and solution discoloration continued for 1 week (Figure 7a).
Kinetic models of adsorption on the surface of photocatalysts are used in the consideration of photocatalytic processes. The relatively simple kinetic models including the equations of the pseudo-first or pseudo-second-orders are used often [30,41].
The adsorption rate can be described by the kinetic equation of pseudo-first-order [30,34,53]:
d q t d t = k f × q e q t ,
where qt—the dye amount adsorbed by 1 g of the sorbent at the time t; qe—equilibrium adsorption capacity; kf—rate constant of the adsorption; t—adsorption duration.
According to Equation (7), the rate of adsorption decreases as the surface is filled with dye molecules.
It is necessary to pay attention to the value of the equilibrium adsorption capacity qe, which enters Equation (7). In some works [32,34] the qe is assigned a value determined as a result of short-term experiments (1 ÷ 2 h) by approximating the kinetic dependence based on the observed decrease in the adsorption rate. The data shown in Figure 7a indicate that the achievement of adsorption-desorption equilibrium on the surface of ZnO-ZnAl2O4-CuO composites requires a much longer adsorption process.
Figure 8 demonstrates the dependence ln(qe−qt) = f(t) for the dye adsorption on the surface of composite 1 during 48 h. This long-term dependence is described formally by kinetic Equation (4) with k1 = 0.0007 min−1 and R2 = 0.9525. However, the experimental points obtained at the initial stages of the adsorption deviate significantly from the linear dependence that indicates that the adsorption process has the complicated behavior.
The inset in Figure 8 shows the dependence ln(qe – qt) = f(t) for the initial stages of the dye adsorption on the surface of composite 1. However, the linear dependence exposed in the inset in Figure 8 does not correspond fully to experimental points. It is indicated by the relatively low R2 value (R2 = 0.9325). This linear dependence was used only formally for the evaluation of the photocatalytic rate at the initial stage of the process. The rate of adsorption in these stages is significantly (more than 10 times) higher (kf = 0.0073 min−1) than the average value.
Based on obtained data the kinetics of the adsorption process can be separated into two different stages:
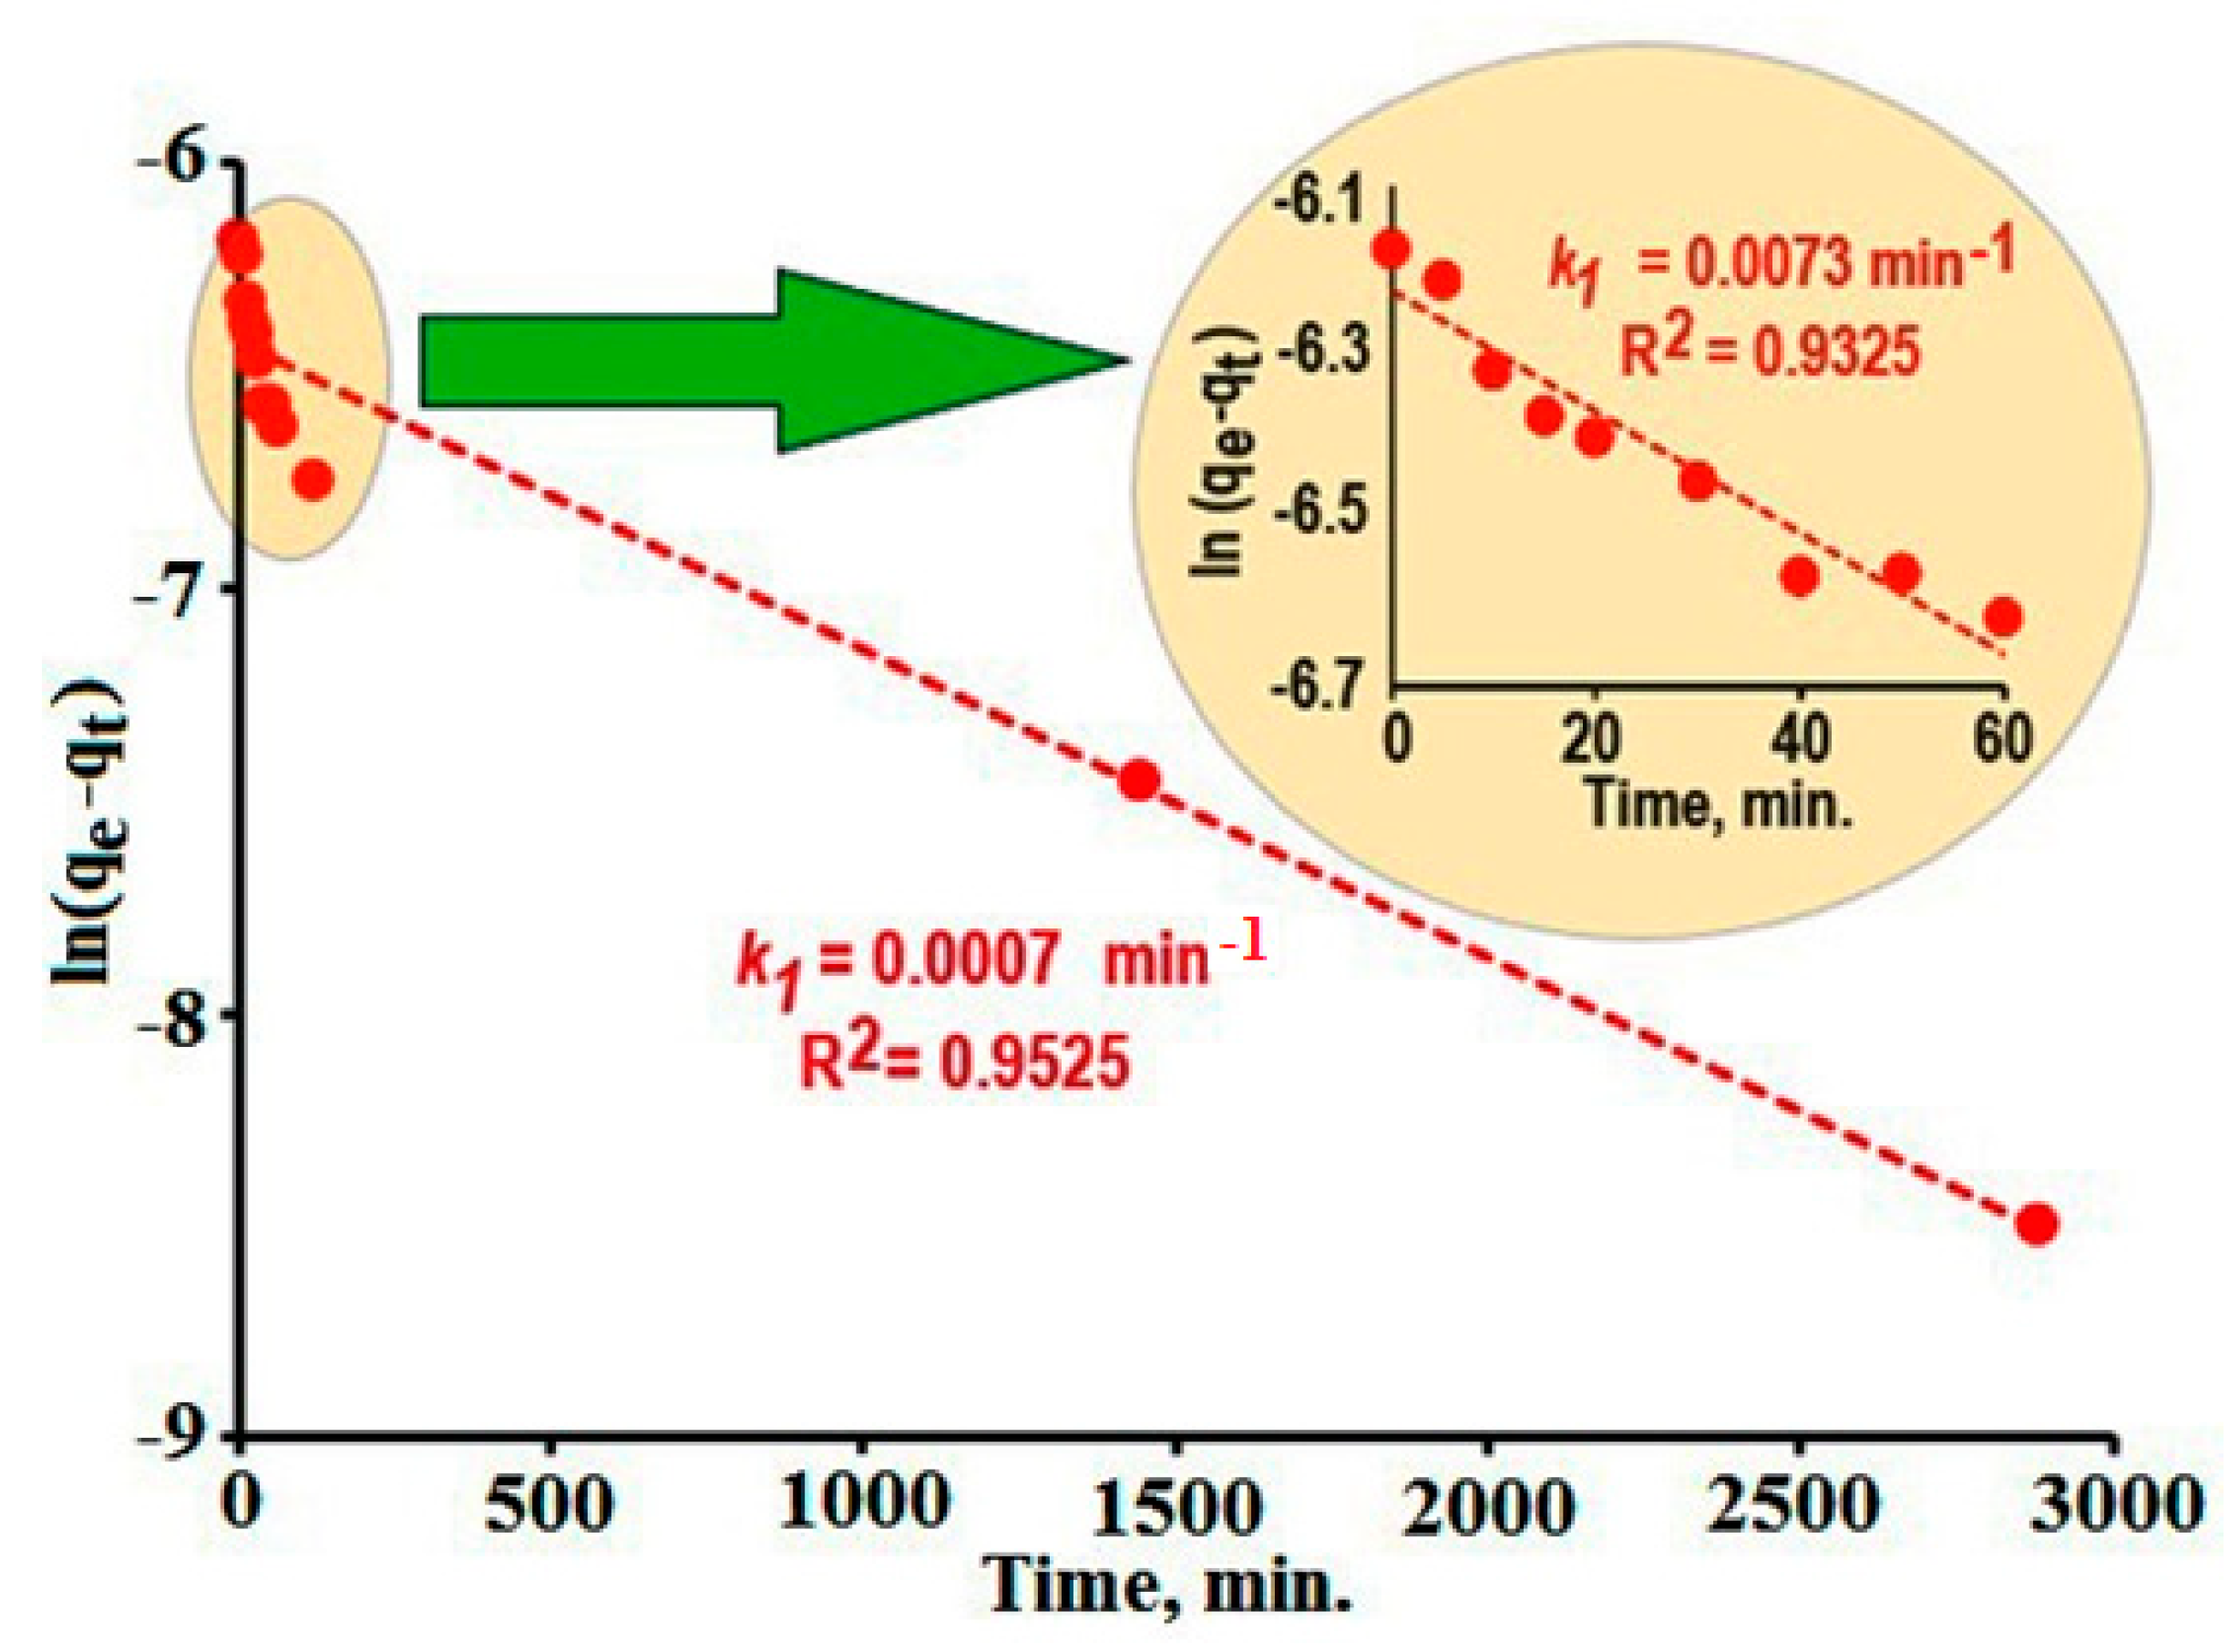
  • Fast adsorption observed at the initial stages of the process (duration of adsorption ~ 120 min);
  • Slow adsorption which is proceed at a more long-term process (duration of adsorption > 120 min).
It is possible to suggest that dye molecules fast adsorb on the external surface of composite particles at the first stage of the process. Following slow adsorption is determined by the labored diffusion of dye molecules into the tiny pores and caverns inside composite particles.
For the description of adsorption kinetics, the equation of pseudo-second-order is often used also. This equation can be written as:
d q t d t = k 2 × q e q t 2 ,
and in the integral form [35,51,54]:
t q t = 1 k 2 × q e 2   + t q e ,
where k2rate constant of the adsorption, qe—equilibrium adsorption capacity, qt—the dye amount adsorbed by 1 g of the sorbent at the time t. This model describes a much stronger dependence of the adsorption rate on the coverage degree of the sorbent surface with dye molecules. The graphs t/q = f(t) for the kinetics of dye adsorption on the surface of composite 1 showed a satisfactory agreement (R2 = 0.9899) between experimental data and Equation (9) (Figure 9).
In long-time (7 days) dye adsorption experiments the adsorption/desorption equilibrium was achieved. Based on the obtained results the values of equilibrium adsorption capacities of prepared powders were calculated. These values are 9.71 × 10⁻³ and 8.86 × 10⁻³ mmol/g for powders 1 and 2, correspondingly.
According to literature data [55] the surface area of the CSB dye molecule is 423 Å2. Assuming the monomolecular adsorption we calculated the values of specific surface areas of nanocomposites. These values are 247 and 137 m2/g for powders 1 and 2, correspondingly. Such values are relatively high and are observed often for different porous matrixes.
Based on the obtained results it is possible to conclude that the adsorption of diazo dye CSB from the aqueous solutions on the surface of porous ZnO-ZnAl2O4-CuO composites can be described formally (R2 > 0.9) by both kinetic models pseudo-first and pseudo-second-orders at initial stages of the process.

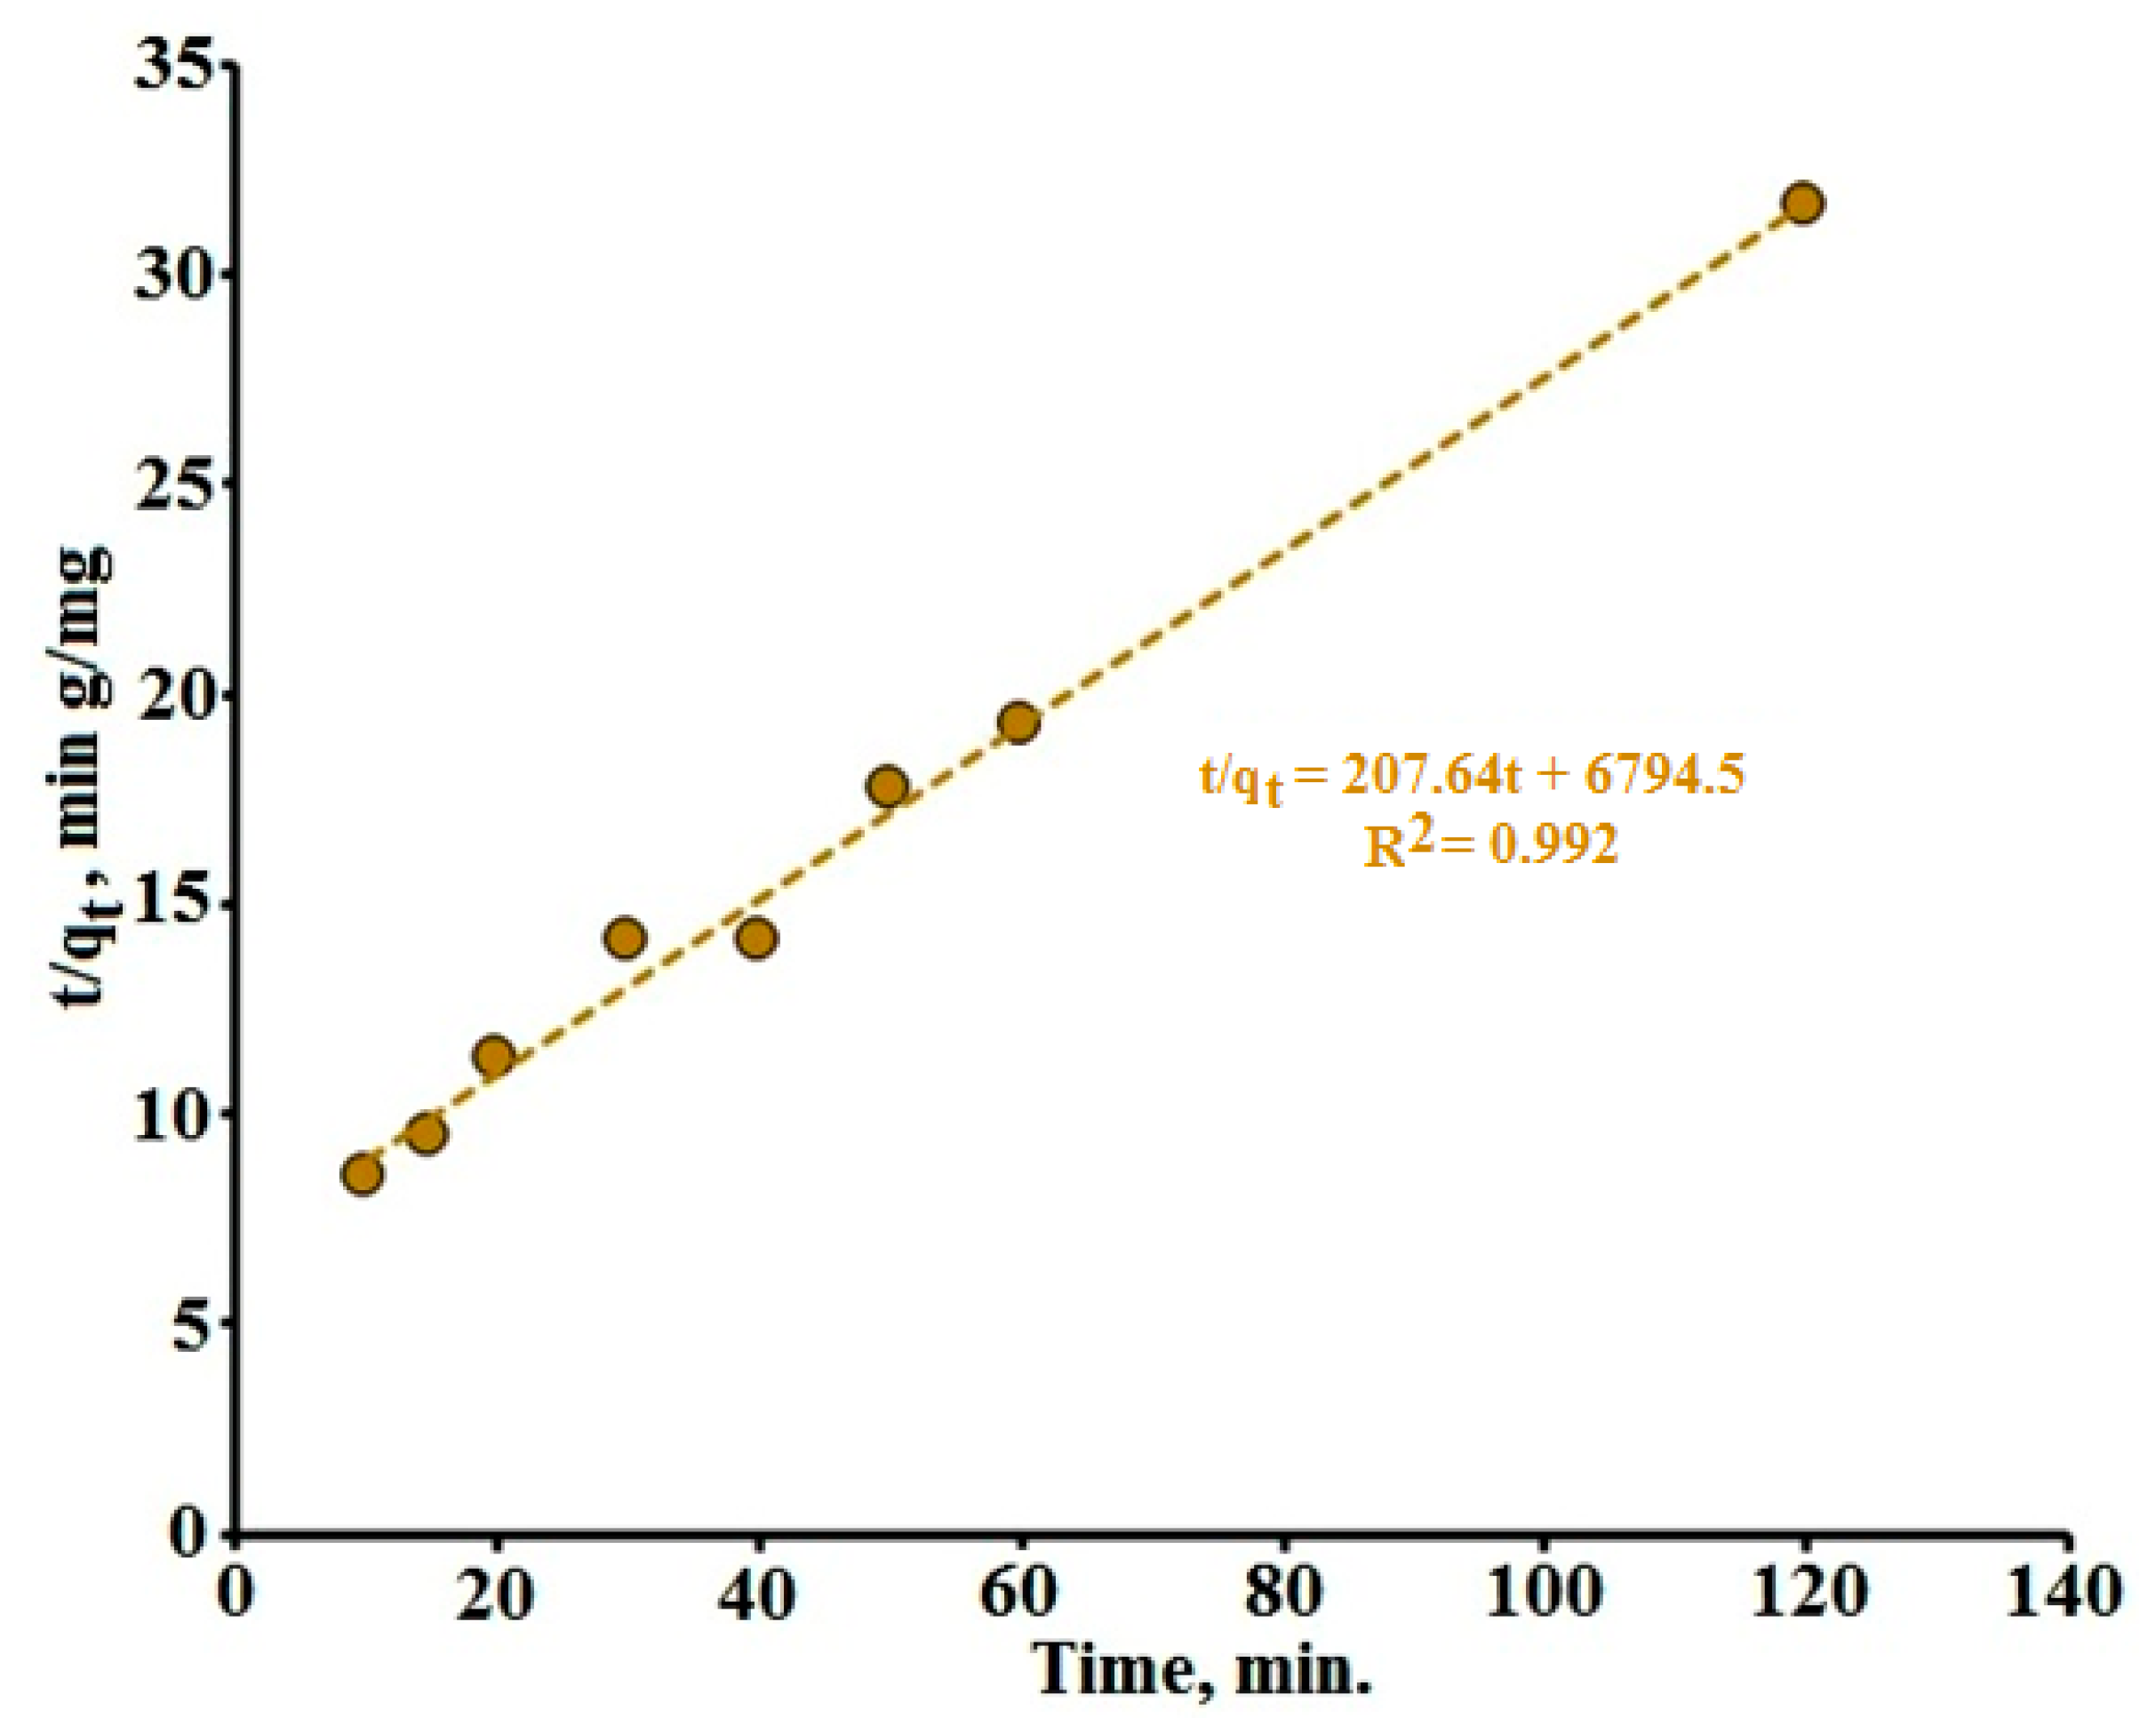
3.4. The Ratio of Adsorption and Photocatalysis Rates

Usually, the reactant species adsorption is considered the first stage of the photocatalytic process in a typical photocatalytic reaction [55,56]. Dye adsorption and its photodecomposition are considered successive stages of photocatalysis. Therefore, the total rate of photocatalytic dye decomposition could not be higher than the adsorption rate. However, this is not agreed with obtained experimental results.
The comparison of kinetic dependencies of dye adsorption from the solution on the surface of composites 1 (Figure 7b, curve 1) and 2 (Figure 7b, curve 2) and its photocatalytic decomposition using composites 1 (Figure 5, curve 3) and 2 (Figure 5, curve 4) indicates the remarkable difference of the rates of these processes. This comparison shows that the photocatalytic dye decomposition proceeds faster than the dye adsorption process. This phenomenon was observed earlier in [30] and was explained by the oxidation of some parts of dye molecules in the liquid phase by the chemically active oxygen species photogenerated by a photocatalyst. The photocatalytic degradation of the organic contaminant in an aqueous solution using a composite photocatalyst was observed also in [36]. Thus, it is possible to conclude that at the application of porous ZnO-ZnAl2O4-CuO composites photocatalytic dye degradation proceeds on the surface of photocatalysts so as in the liquid phase.

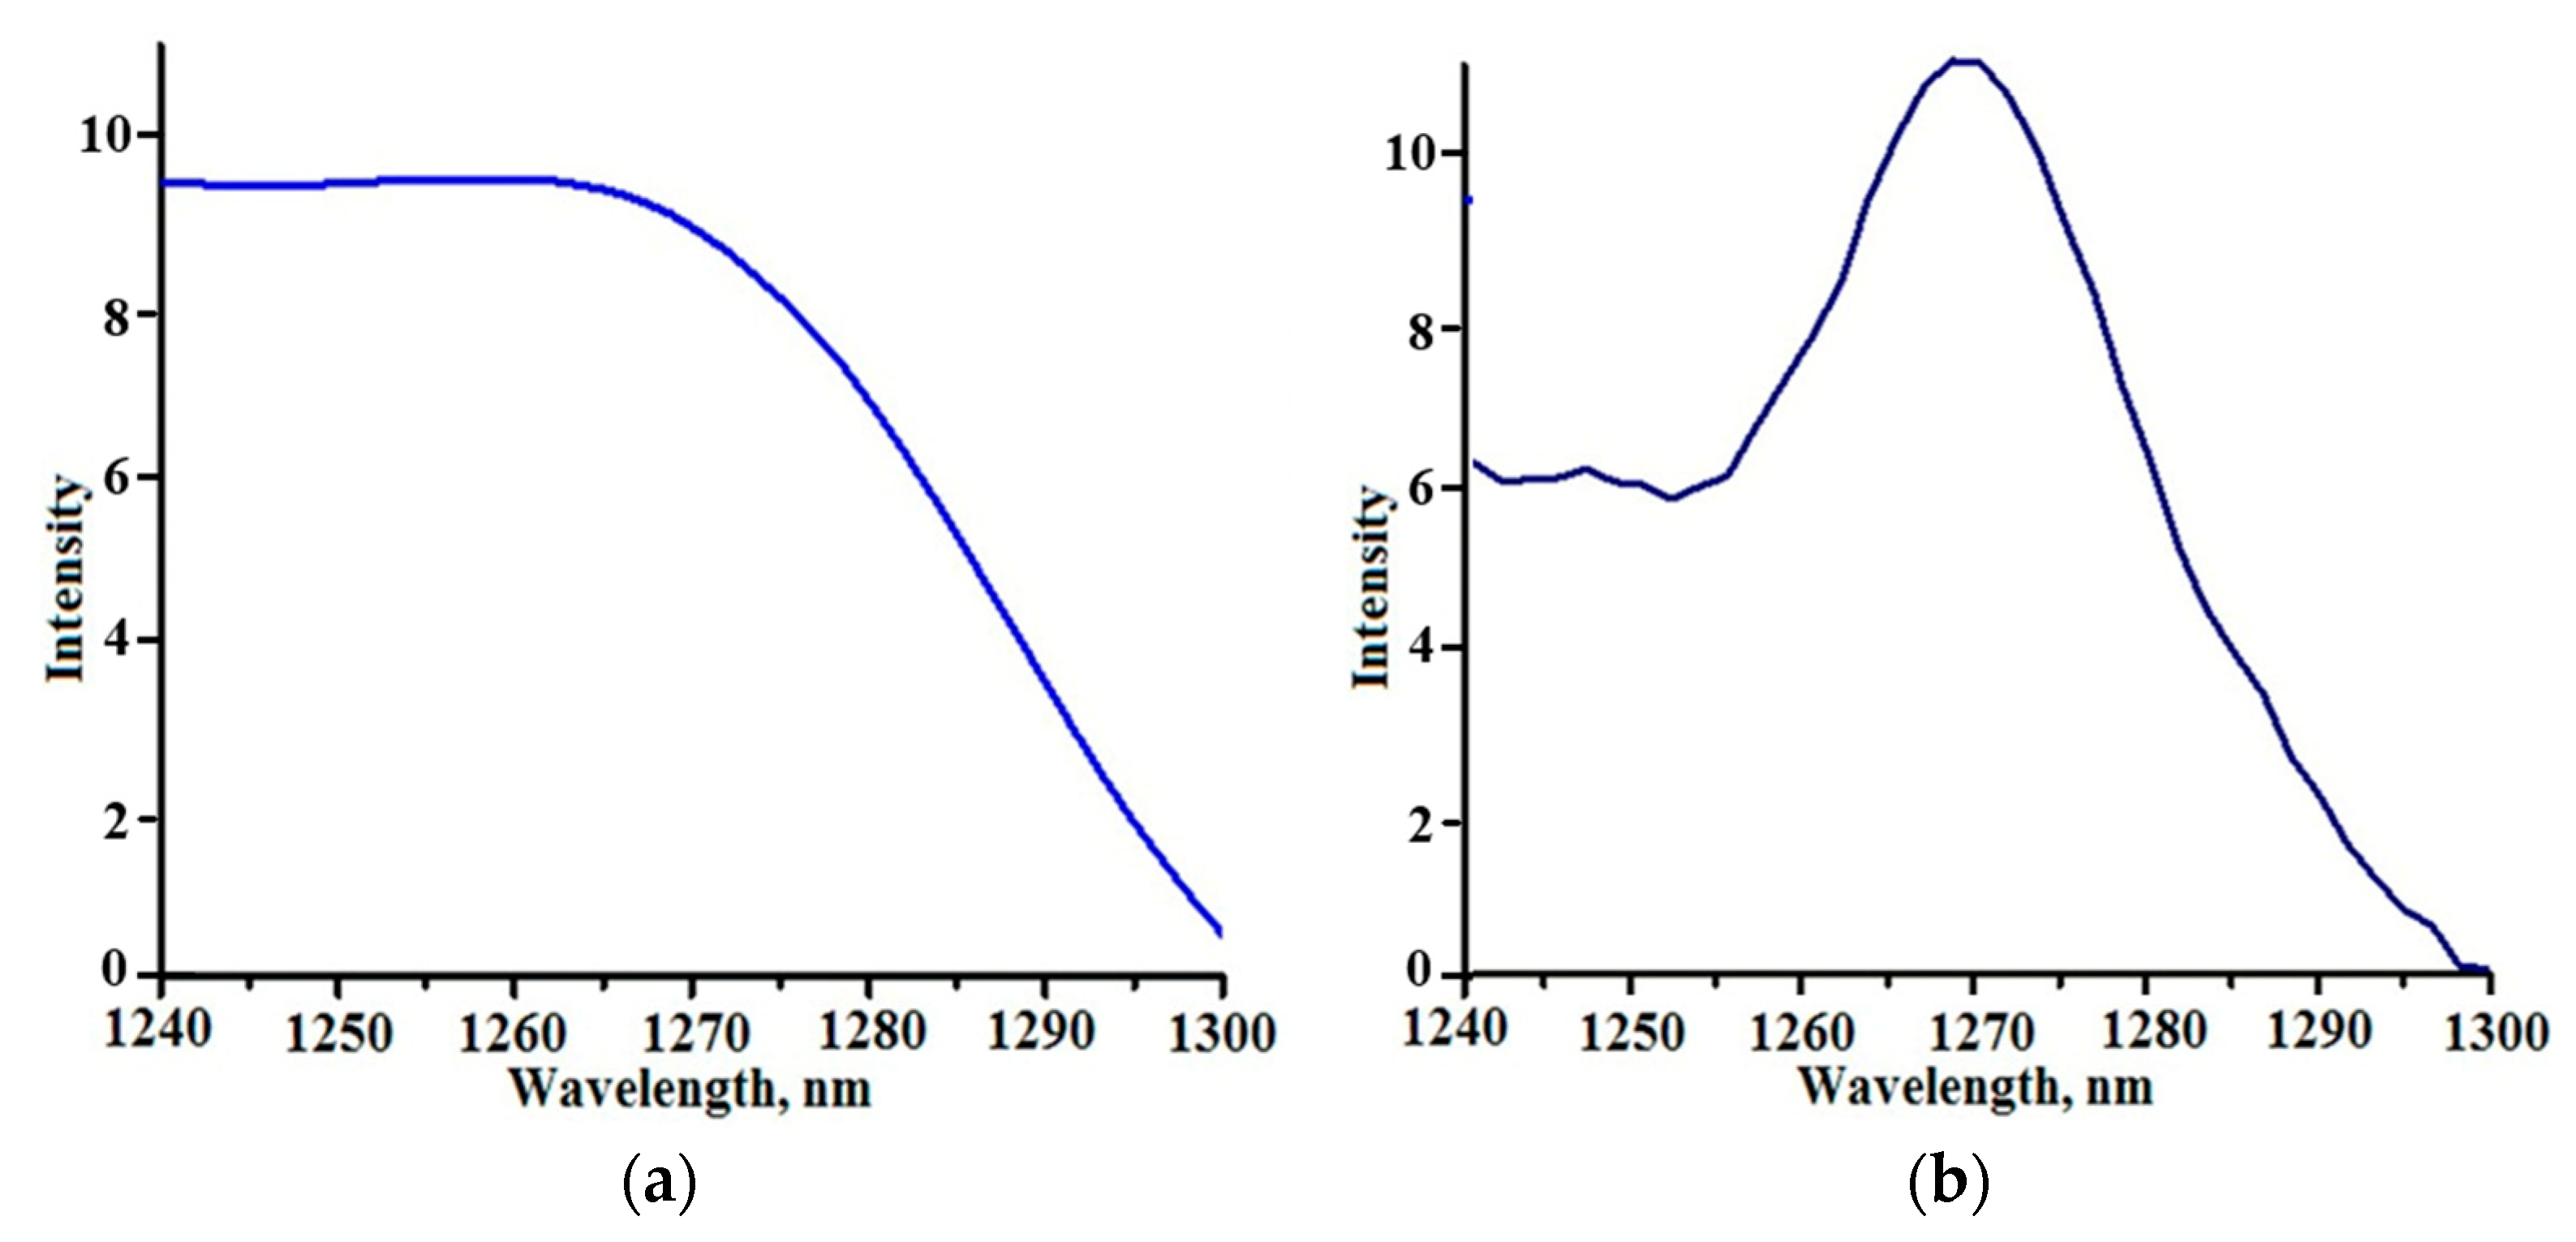
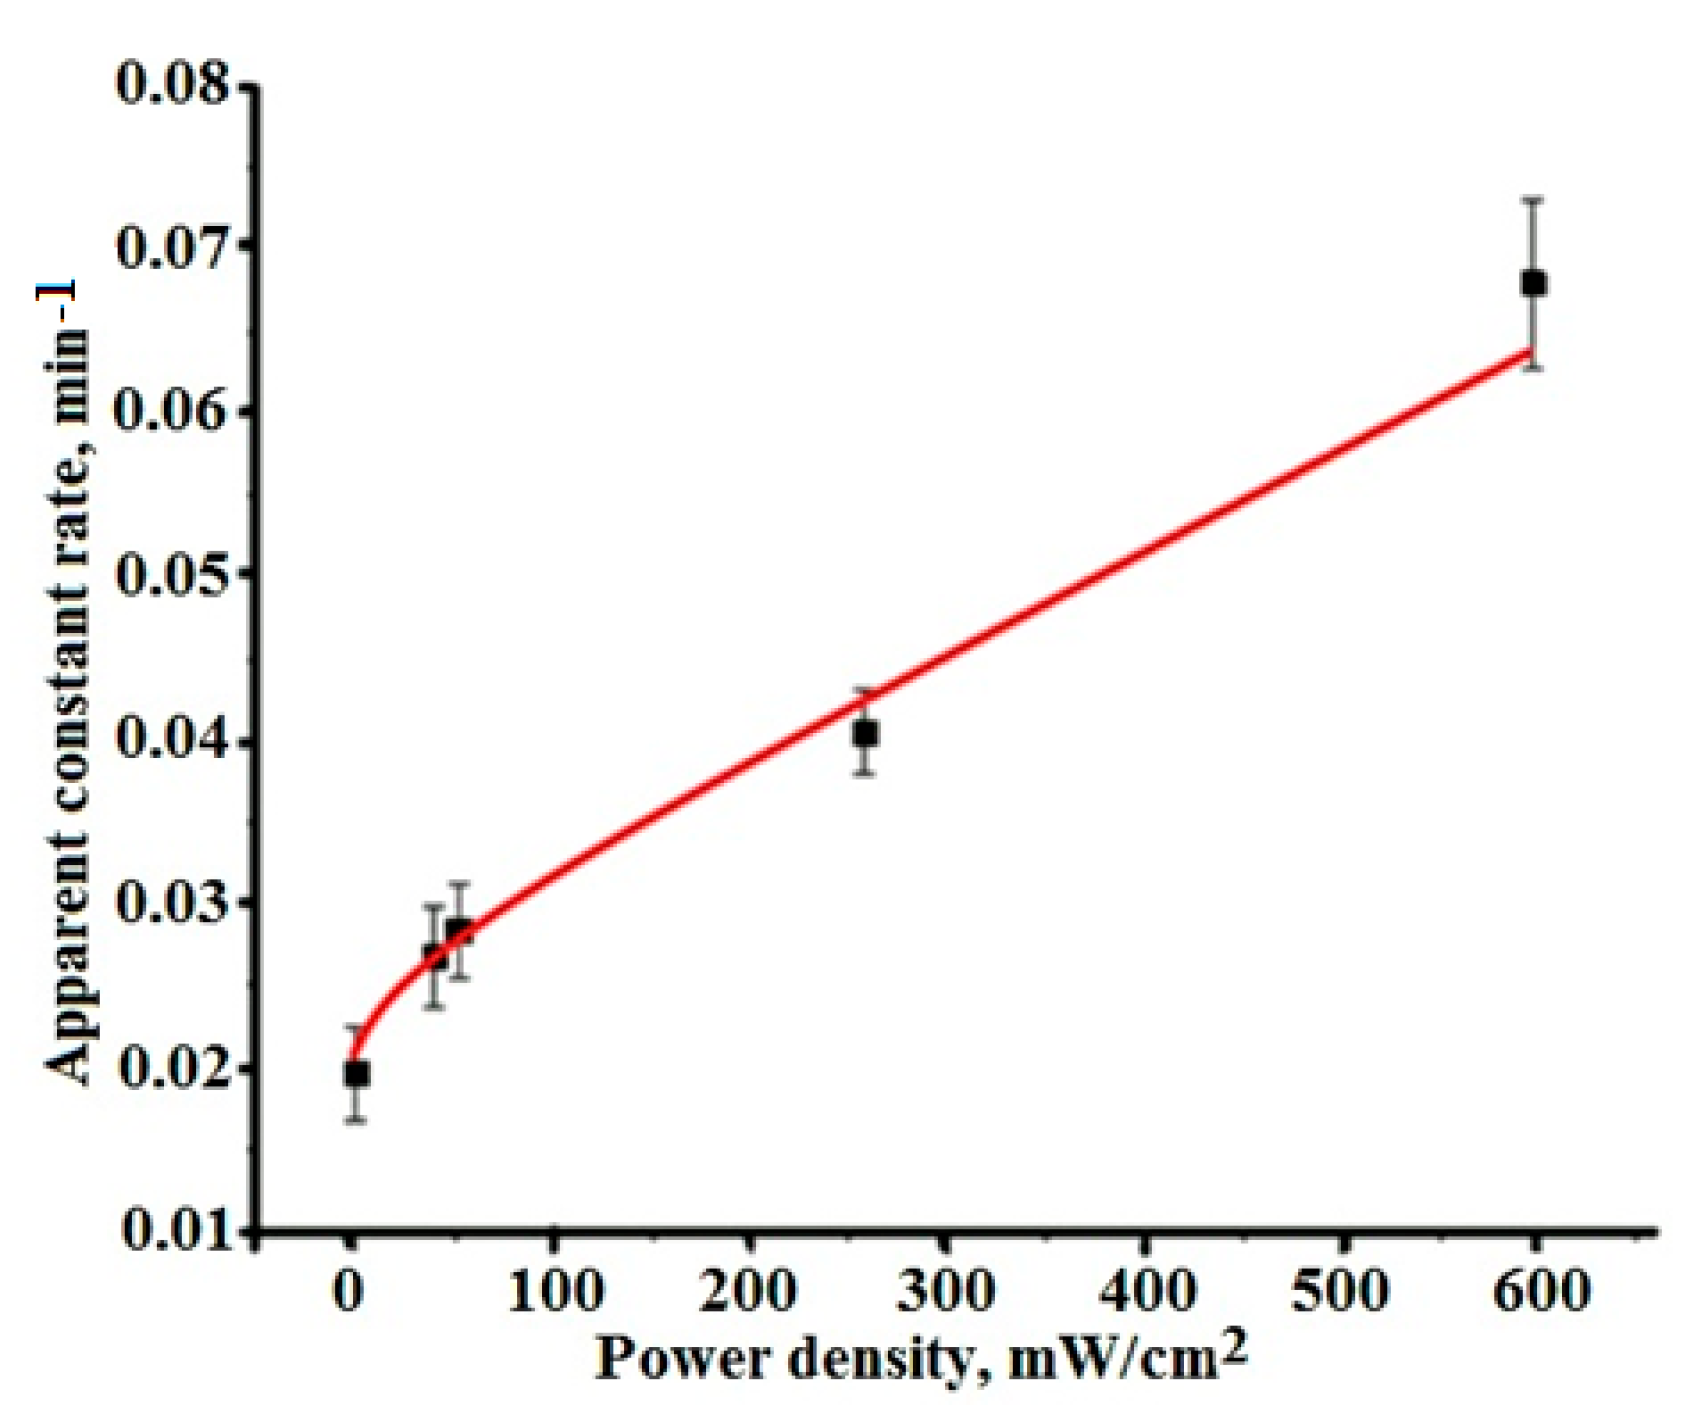
3.5. Influence of the Light Intensity on the Kinetics of Photocatalysis

It is known that light is the driving force of photocatalytic processes. Influence of light intensity I on the kinetics of photocatalytic decomposition of different organic compounds was studied in many works [1,2,3,4,5,6,7,8,9]. It was found that at the application of the L–H kinetic model obtained values k1 and Ka are dependent on the light intensity I and different approaches were used to describe these dependencies. Deng [1] and Puma et al. [9] separate the dependence r = f(I) to a few different regions determined by I values. At low light intensity a linear dependence of photodecomposition rate r from the light intensity I is observed (r ∝ I) [1]. At the increase in light intensity linear dependence r = f(I) transforms to a power law dependence r ∝ Iβ (0 ≤ β < 1) [1].
These features of r = f(I) dependencies are determined by the mechanisms of the processes proceeding at the semiconductor photocatalyst excitation. Photogenerated electron-hole pairs can recombine directly, or they can be trapped by the matter and take part in the photocatalytic process. Clearly, that high light intensity and more trapping of electron-hole pairs may increase the dye decomposition rate. The trapping of the electron-hole pairs and photocatalytic action dominate at low light intensity values while the recombination processes prevail at high light intensity values [1,10].
The dependence of kapp = f(I) for photocatalytic dye degradation using composite 1 is exposed in Figure 10. At low light intensity, the dependence is linear but at I > 100 mW/cm2 it transforms into a power law dependence. The observed behavior of kapp = f(I) dependence fully corresponds to the literature data.

4. Conclusions

Cu-doped ZnO-ZnAl2O4 composites synthesized by polymer-salt method consist of small (size less 100 nm) nanoparticles, have “pine needles”-like or porous structure and demonstrate some features of their adsorption and photocatalytic properties. Experiments on the adsorption of diazo dye Chicago Sky Blue from aqueous solutions on the surface of prepared composites showed that adsorption kinetics consists of two different stages. The first stage of this process is the fast dye adsorption on the external surface of composite particles followed by the slow diffusion and dye adsorption inside pores and caverns. The rate of photocatalytic dye decomposition is higher than the rate of the adsorption process. It suggests the photocatalytic decomposition of dye molecules proceeds on the surface of composites so as in the liquid phase. The chemical composition of Cu-doped ZnO-ZnAl2O4 composites and morphology play the most important role in their adsorptive and photocatalytic effectiveness.
The increase in light intensity significantly accelerates the photocatalytic process. At low light intensity, the dependence is linear but at I > 100 mW/cm2 it transforms into a power law dependence.

Author Contributions

Conceptualization, A.S. and S.E.; methodology, A.T. and A.S.; validation, N.N.; formal analysis, S.E.; investigation, A.T. and A.S.; resources, S.E. and N.N.; data curation, A.S. and S.E.; writing—original draft preparation, S.E.; writing—review and editing, A.S.; visualization, A.S. and S.E.; supervision, N.N. and V.V. project administration, A.S.; funding acquisition, S.E. and N.N. All authors have read and agreed to the published version of the manuscript.

Funding

The reported study was funded by Russian Science Foundation (project No. 20-19-00559).

Data Availability Statement

Our previous experimental results were published in different international journals (Ceramics International, Optical Materials, Optical Engineering, etc.).

Conflicts of Interest

The authors declare no conflict of interest.

References

  1. Deng, Y. Developing a Langmuir-Type Excitation Equilibrium Equation to Describe the Effect of Light Intensity on the Kinetics of the Photocatalytic Oxidation. Chem. Eng. J. 2018, 337, 220–227. [Google Scholar] [CrossRef]
  2. Mills, A.; Wang, J.; Ollis, D. Dependence of the Kinetics of Liquid-Phase Photocatalyzed Reactions on Oxygen Concentration and Light Intensity. J. Catal. 2006, 243, 1–6. [Google Scholar] [CrossRef]
  3. Yang, L.; Liu, Z. Study on Light Intensity in the Process of Photocatalytic Degradation of Indoor Gaseous Formaldehyde for Saving Energy. Energy Convers. Manag. 2007, 48, 882–889. [Google Scholar] [CrossRef]
  4. Bell, S.; Will, G.; Bell, J. Light Intensity Effects on Photocatalytic Water Splitting with a Titania Catalyst. Int. J. Hydrogen Energy 2013, 38, 6938–6947. [Google Scholar] [CrossRef]
  5. Jadaa, W.; Prakash, A.; Ray, A.K. Photocatalytic Degradation of Diazo Dye over Suspended and Immobilized TiO2 Catalyst in Swirl Flow Reactor: Kinetic Modeling. Processes 2021, 9, 1741. [Google Scholar] [CrossRef]
  6. Meng, Y.; Huang, X.; Wu, Y.; Wang, X.; Qian, Y. Kinetic Study and Modeling on Photocatalytic Degradation of Para-Chlorobenzoate at Different Light Intensities. Environ. Pollut. 2002, 117, 307–313. [Google Scholar] [CrossRef]
  7. Xu, Y.; Langford, C.H. Variation of Langmuir Adsorption Constant Determined for TiO2-Photocatalyzed Degradation of Acetophenone under Different Light Intensity. J. Photochem. Photobiol. Chem. 2000, 133, 67–71. [Google Scholar] [CrossRef]
  8. Li, Y.; Sun, S.; Ma, M.; Ouyang, Y.; Yan, W. Kinetic Study and Model of the Photocatalytic Degradation of Rhodamine B (RhB) by a TiO2-Coated Activated Carbon Catalyst: Effects of Initial RhB Content, Light Intensity and TiO2 Content in the Catalyst. Chem. Eng. J. 2008, 142, 147–155. [Google Scholar] [CrossRef]
  9. Li Puma, G.; Salvadó-Estivill, I.; Obee, T.N.; Hay, S.O. Kinetics Rate Model of the Photocatalytic Oxidation of Trichloroethylene in Air over TiO2 Thin Films. Sep. Purif. Technol. 2009, 67, 226–232. [Google Scholar] [CrossRef]
  10. Turchi, C. Photocatalytic Degradation of Organic Water Contaminants: Mechanisms Involving Hydroxyl Radical Attack. J. Catal. 1990, 122, 178–192. [Google Scholar] [CrossRef]
  11. Wang, X.; Ahmad, M.; Sun, H. Three-Dimensional ZnO Hierarchical Nanostructures: Solution Phase Synthesis and Applications. Materials 2017, 10, 1304. [Google Scholar] [CrossRef] [PubMed] [Green Version]
  12. Peighambardoust, S.J.; Boffito, D.C.; Foroutan, R.; Ramavandi, B. Sono-Photocatalytic Activity of Sea Sediment@400/ZnO Catalyst to Remove Cationic Dyes from Wastewater. J. Mol. Liq. 2022, 367, 120478. [Google Scholar] [CrossRef]
  13. Foroutan, R.; Peighambardoust, S.J.; Boffito, D.C.; Ramavandi, B. Sono-Photocatalytic Activity of Cloisite 30B/ZnO/Ag2O Nanocomposite for the Simultaneous Degradation of Crystal Violet and Methylene Blue Dyes in Aqueous Media. Nanomaterials 2022, 12, 3103. [Google Scholar] [CrossRef] [PubMed]
  14. Li, Y.; Zhang, W.; Niu, J.; Chen, Y. Mechanism of Photogenerated Reactive Oxygen Species and Correlation with the Antibacterial Properties of Engineered Metal-Oxide Nanoparticles. ACS Nano 2012, 6, 5164–5173. [Google Scholar] [CrossRef] [PubMed]
  15. Shelemanov, A.A.; Evstropiev, S.K.; Karavaeva, A.V.; Nikonorov, N.V.; Vasilyev, V.N.; Podruhin, Y.F.; Kiselev, V.M. Enhanced Singlet Oxygen Photogeneration by Bactericidal ZnO–MgO–Ag Nanocomposites. Mater. Chem. Phys. 2022, 276, 125204. [Google Scholar] [CrossRef]
  16. Evstropiev, S.K.; Karavaeva, A.V.; Petrova, M.A.; Nikonorov, N.V.; Vasilyev, V.N.; Lesnykh, L.L.; Dukelskii, K.V. Antibacterial Effect of Nanostructured ZnO-SnO2 Coatings: The Role of Microstructure. Mater. Today Commun. 2019, 21, 100628. [Google Scholar] [CrossRef]
  17. Hamrouni, A.; Moussa, N.; Parrino, F.; Di Paola, A.; Houas, A.; Palmisano, L. Sol–Gel Synthesis and Photocatalytic Activity of ZnO–SnO2 Nanocomposites. J. Mol. Catal. Chem. 2014, 390, 133–141. [Google Scholar] [CrossRef] [Green Version]
  18. Manoharan, C.; Pavithra, G.; Dhanapandian, S.; Dhamodharan, P. Effect of In Doping on the Properties and Antibacterial Activity of ZnO Films Prepared by Spray Pyrolysis. Spectrochim. Acta. A. Mol. Biomol. Spectrosc. 2015, 149, 793–799. [Google Scholar] [CrossRef]
  19. Tincu, A.; Shelemanov, A.A.; Evstropiev, S.K.; Nikonorov, N.V.; Dukelskii, K.V. Controlled Chemical Transformation and Crystallization Design for the Formation of Multifunctional Cu-Doped ZnO/ZnAl2O4 Composites. J. Inorg. Organomet. Polym. Mater. 2022, 33, 398–406. [Google Scholar] [CrossRef]
  20. Foletto, E.L.; Battiston, S.; Simões, J.M.; Bassaco, M.M.; Pereira, L.S.F.; de Moraes Flores, É.M.; Müller, E.I. Synthesis of ZnAl2O4 Nanoparticles by Different Routes and the Effect of Its Pore Size on the Photocatalytic Process. Microporous Mesoporous Mater. 2012, 163, 29–33. [Google Scholar] [CrossRef]
  21. Anchieta, C.G.; Sallet, D.; Foletto, E.L.; da Silva, S.S.; Chiavone-Filho, O.; do Nascimento, C.A.O. Synthesis of Ternary Zinc Spinel Oxides and Their Application in the Photodegradation of Organic Pollutant. Ceram. Int. 2014, 40, 4173–4178. [Google Scholar] [CrossRef]
  22. Battiston, S.; Rigo, C.; da Severo, E.C.; Mazutti, M.A.; Kuhn, R.C.; Gündel, A.; Foletto, E.L. Synthesis of Zinc Aluminate (ZnAl2O4) Spinel and Its Application as Photocatalyst. Mater. Res. 2014, 17, 734–738. [Google Scholar] [CrossRef]
  23. Zawadzki, M.; Staszak, W.; López-Suárez, F.E.; Illán-Gómez, M.J.; Bueno-López, A. Preparation, Characterisation and Catalytic Performance for Soot Oxidation of Copper-Containing ZnAl2O4 Spinels. Appl. Catal. Gen. 2009, 371, 92–98. [Google Scholar] [CrossRef]
  24. Zhao, X.; Wang, L.; Xu, X.; Lei, X.; Xu, S.; Zhang, F. Fabrication and Photocatalytic Properties of Novel ZnO/ZnAl2O4 Nanocomposite with ZnAl2O4 Dispersed inside ZnO Network. AIChE J. 2012, 58, 573–582. [Google Scholar] [CrossRef]
  25. Shahmirzaee, M.; Shafiee Afarani, M.; Arabi, A.M.; Iran Nejhad, A. In Situ Crystallization of ZnAl2O4/ZnO Nanocomposite on Alumina Granule for Photocatalytic Purification of Wastewater. Res. Chem. Intermed. 2017, 43, 321–340. [Google Scholar] [CrossRef]
  26. Yuan, X.; Cheng, X.; Jing, Q.; Niu, J.; Peng, D.; Feng, Z.; Wu, X. ZnO/ZnAl2O4 Nanocomposite with 3D Sphere-Like Hierarchical Structure for Photocatalytic Reduction of Aqueous Cr(VI). Materials 2018, 11, 1624. [Google Scholar] [CrossRef] [Green Version]
  27. Zhang, L.; Yan, J.; Zhou, M.; Yang, Y.; Liu, Y.-N. Fabrication and Photocatalytic Properties of Spheres-in-Spheres ZnO/ZnAl2O4 Composite Hollow Microspheres. Appl. Surf. Sci. 2013, 268, 237–245. [Google Scholar] [CrossRef]
  28. Zhao, H.; Dong, Y.; Jiang, P.; Wang, G.; Zhang, J.; Zhang, C. ZnAl2O4 as a Novel High-Surface-Area Ozonation Catalyst: One-Step Green Synthesis, Catalytic Performance and Mechanism. Chem. Eng. J. 2015, 260, 623–630. [Google Scholar] [CrossRef]
  29. Akika, F.Z.; Benamira, M.; Lahmar, H.; Trari, M.; Avramova, I.; Suzer, Ş. Structural and Optical Properties of Cu-Doped ZnAl2O4 and Its Application as Photocatalyst for Cr(VI) Reduction under Sunlight. Surf. Interfaces 2020, 18, 100406. [Google Scholar] [CrossRef]
  30. Saratovskii, A.S.; Bulyga, D.V.; Evstrop’ev, S.K.; Antropova, T.V. Adsorption and Photocatalytic Activity of the Porous Glass–ZnO–Ag Composite and ZnO–Ag Nanopowder. Glass Phys. Chem. 2022, 48, 10–17. [Google Scholar] [CrossRef]
  31. Vimonses, V.; Chong, M.N.; Jin, B. Evaluation of the Physical Properties and Photodegradation Ability of Titania Nanocrystalline Impregnated onto Modified Kaolin. Microporous Mesoporous Mater. 2010, 132, 201–209. [Google Scholar] [CrossRef]
  32. Minh, T.T.; Tu, N.T.T.; Van Thi, T.T.; Hoa, L.T.; Long, H.T.; Phong, N.H.; Pham, T.L.M.; Khieu, D.Q. Synthesis of Porous Octahedral ZnO/CuO Composites from Zn/Cu-Based MOF-199 and Their Applications in Visible-Light-Driven Photocatalytic Degradation of Dyes. J. Nanomater. 2019, 2019, 5198045. [Google Scholar] [CrossRef] [Green Version]
  33. Evstropiev, S.K.; Lesnykh, L.V.; Karavaeva, A.V.; Nikonorov, N.V.; Oreshkina, K.V.; Mironov, L.Y.; Maslennikov, S.Y.; Kolobkova, E.V.; Vasilyev, V.N.; Bagrov, I.V. Intensification of Photodecomposition of Organics Contaminations by Nanostructured ZnO-SnO2 Coatings Prepared by Polymer-Salt Method. Chem. Eng. Process.-Process Intensif. 2019, 142, 107587. [Google Scholar] [CrossRef]
  34. Kuang, Y.; Zhang, X.; Zhou, S. Adsorption of Methylene Blue in Water onto Activated Carbon by Surfactant Modification. Water 2020, 12, 587. [Google Scholar] [CrossRef] [Green Version]
  35. Gaya, U.I.; Abdullah, A.H. Heterogeneous Photocatalytic Degradation of Organic Contaminants over Titanium Dioxide: A Review of Fundamentals, Progress and Problems. J. Photochem. Photobiol. C Photochem. Rev. 2008, 9, 1–12. [Google Scholar] [CrossRef]
  36. El Mouchtari, E.M.; Bahsis, L.; El Mersly, L.; Anane, H.; Lebarillier, S.; Piram, A.; Briche, S.; Wong-Wah-Chung, P.; Rafqah, S. Insights in the Aqueous and Adsorbed Photocatalytic Degradation of Carbamazepine by a Biosourced Composite: Kinetics, Mechanisms and DFT Calculations. Int. J. Environ. Res. 2021, 15, 135–147. [Google Scholar] [CrossRef]
  37. Benkhaya, S.; M’rabet, S.; El Harfi, A. Classifications, Properties, Recent Synthesis and Applications of Azo Dyes. Heliyon 2020, 6, e03271. [Google Scholar] [CrossRef] [PubMed] [Green Version]
  38. Berradi, M.; Hsissou, R.; Khudhair, M.; Assouag, M.; Cherkaoui, O.; El Bachiri, A.; El Harfi, A. Textile Finishing Dyes and Their Impact on Aquatic Environs. Heliyon 2019, 5, e02711. [Google Scholar] [CrossRef]
  39. Daimon, T.; Nosaka, Y. Formation and Behavior of Singlet Molecular Oxygen in TiO2 Photocatalysis Studied by Detection of Near-Infrared Phosphorescence. J. Phys. Chem. C 2007, 111, 4420–4424. [Google Scholar] [CrossRef]
  40. Kiselev, V.M.; Kislyakov, I.M.; Burchinov, A.N. Generation of Singlet Oxygen on the Surface of Metal Oxides. Opt. Spectrosc. 2016, 120, 520–528. [Google Scholar] [CrossRef]
  41. Boltenkov, I.S.; Kolobkova, E.V.; Evstropiev, S.K. Synthesis and Characterization of Transparent Photocatalytic ZnO-Sm2O3 and ZnO-Er2O3 Coatings. J. Photochem. Photobiol. Chem. 2018, 367, 458–464. [Google Scholar] [CrossRef]
  42. Morkoç, H.; Özgür, Ü. Zinc Oxide: Fundamentals, Materials and Device Technology; Wiley-VCH: Weinheim, Germany, 2009; ISBN 978-3-527-40813-9. [Google Scholar]
  43. Lim, A.R. Effects of Paramagnetic Interactions by the Partial Replacement of Zn2+ Ions with Cu2+ Ions in Lead-Free Zinc-Based Perovskite (MA)2ZnCl4 Crystal by MAS NMR. AIP Adv. 2019, 9, 105115. [Google Scholar] [CrossRef] [Green Version]
  44. Evstropiev, S.K.; Soshnikov, I.P.; Kolobkova, E.V.; Evstropyev, K.S.; Nikonorov, N.V.; Khrebtov, A.I.; Dukelskii, K.V.; Kotlyar, K.P.; Oreshkina, K.V.; Nashekin, A.V. Polymer-Salt Synthesis and Characterization of MgO-ZnO Ceramic Coatings with the High Transparency in UV Spectral Range. Opt. Mater. 2018, 82, 81–87. [Google Scholar] [CrossRef]
  45. Koike, K.; Hama, K.; Nakashima, I.; Takada, G.; Ogata, K.; Sasa, S.; Inoue, M.; Yano, M. Molecular Beam Epitaxial Growth of Wide Bandgap ZnMgO Alloy Films on (111)-Oriented Si Substrate toward UV-Detector Applications. J. Cryst. Growth 2005, 278, 288–292. [Google Scholar] [CrossRef]
  46. Ohtomo, A.; Kawasaki, M.; Koida, T.; Masubuchi, K.; Koinuma, H.; Sakurai, Y.; Yoshida, Y.; Yasuda, T.; Segawa, Y. MgxZn1−xO as a II–VI Widegap Semiconductor Alloy. Appl. Phys. Lett. 1998, 72, 2466–2468. [Google Scholar] [CrossRef] [Green Version]
  47. Mang, A.; Reimann, K.; Rübenacke, S. Band Gaps, Crystal-Field Splitting, Spin-Orbit Coupling, and Exciton Binding Energies in ZnO under Hydrostatic Pressure. Solid State Commun. 1995, 94, 251–254. [Google Scholar] [CrossRef]
  48. Sampath, S.K.; Cordaro, J.F. Optical Properties of Zinc Aluminate, Zinc Gallate, and Zinc Aluminogallate Spinels. J. Am. Ceram. Soc. 2005, 81, 649–654. [Google Scholar] [CrossRef]
  49. Sawicka-Chudy, P.; Sibiński, M.; Wisz, G.; Rybak-Wilusz, E.; Cholewa, M. Numerical Analysis and Optimization of Cu2O/TiO2, CuO/TiO2, Heterojunction Solar Cells Using SCAPS. J. Phys. Conf. Ser. 2018, 1033, 012002. [Google Scholar] [CrossRef] [Green Version]
  50. Fox, M.A.; Dulay, M.T. Heterogeneous Photocatalysis. Chem. Rev. 1993, 93, 341–357. [Google Scholar] [CrossRef]
  51. Konstantinou, I.K.; Albanis, T.A. TiO2-Assisted Photocatalytic Degradation of Azo Dyes in Aqueous Solution: Kinetic and Mechanistic Investigations. Appl. Catal. B Environ. 2004, 49, 1–14. [Google Scholar] [CrossRef]
  52. Ibhadon, A.O.; Greenway, G.M.; Yue, Y.; Falaras, P.; Tsoukleris, D. The Photocatalytic Activity and Kinetics of the Degradation of an Anionic Azo-Dye in a UV Irradiated Porous Titania Foam. Appl. Catal. B Environ. 2008, 84, 351–355. [Google Scholar] [CrossRef]
  53. Lagergren, S. About the Theory of So-Called Adsorption of Soluble Substances. Kung Sven Veten Hand. Sven. Vetenskapsakad. Handingarl 1989, 24, 1–39. [Google Scholar]
  54. Uribe-López, M.C.; Hidalgo-López, M.C.; López-González, R.; Frías-Márquez, D.M.; Núñez-Nogueira, G.; Hernández-Castillo, D.; Alvarez-Lemus, M.A. Photocatalytic Activity of ZnO Nanoparticles and the Role of the Synthesis Method on Their Physical and Chemical Properties. J. Photochem. Photobiol. Chem. 2021, 404, 112866. [Google Scholar] [CrossRef]
  55. PubChem Release 2021.05.07. Available online: https://pubchem.ncbi.nlm.nih.gov (accessed on 7 May 2021).
  56. Abebe, B.; Murthy, H.C.A.; Amare, E. Summary on Adsorption and Photocatalysis for Pollutant Remediation: Mini Review. J. Encapsulation Adsorpt. Sci. 2018, 08, 225–255. [Google Scholar] [CrossRef] [Green Version]
Figure 1. SEM images of composites 1 (a,b) and 2 (c,d) at different magnifications.
Jcs 07 00263 g001
Figure 2. XRD pattern of composite 1 (a) and 2 (b).
Jcs 07 00263 g002
Figure 3. The dependencies of (αhν)2 = f() for composites 1 (a) and 2 (b).
Jcs 07 00263 g003
Figure 4. Influence of UV irradiation on the absorption spectra of CSB solutions without addition of composite (a) and with the addition of powder 2 (b).
Jcs 07 00263 g004
Figure 5. Kinetics dependencies of CSB solution discoloration during UV irradiation without powders (curve 1) and CSB solutions containing powders 2 (curve 2) and 1 (curve 3).
Jcs 07 00263 g005
Figure 6. Luminescence spectra of composite 1 in NIR spectral range. Luminescence excitation: (a) λex = 370 nm; power density 0.35 W/cm2; (b) λex = 405 nm; power density 0.90 W/cm2).
Jcs 07 00263 g006
Figure 7. (a) Changes of absorption spectra of dye solution containing powder 1 during adsorption process. Adsorption duration, min: 0 (curve 1); 20 (curve 2); 120 (curve 3); 1440 (curve 4); 2880 (curve 5); 10,080 (curve 6), (b) Kinetic dependencies of the dye adsorption on the powders 2 (curve 1) and 1 (curve 2).
Jcs 07 00263 g007
Figure 8. Dependence ln(qeqt) = f(t) for the dye adsorption on the surface of composite 1. Inset: Dependence ln(qeqt) = f(t) for initial stages of the dye adsorption on the surface of composite 1.
Jcs 07 00263 g008
Figure 9. Dependence t/qt = f(t), based on the experimental data of dye adsorption on the surface of the composite 1.
Jcs 07 00263 g009
Figure 10. The dependence of kapp = f(I) for photocatalytic dye degradation using composite.
Jcs 07 00263 g010
Table 1. Chemical compositions of initial solutions and obtained composites.
SampleChemical Composition of Solutions, mol.%Chemical Composition of Powders, mol.%
H2OPVPPropanol-2Zn(NO3)2
∙6H2O
Al(NO3)3
∙9H2O
CuSO4
·5H2O
ZnOZnAl2O4CuO
180.5330.00219.0100.3200.1330.00280.1619.830.04
280.5610.00219.0100.1620.2580.00220.8179.180.01
Table 2. The comparison of the constant rates of CSB photodecomposition under UV irradiation (power density 20 ÷ 25 mW/sm2) in aqueous solutions with different photocatalytic additions.
PhotocatalystsConstant Rate, min−1References
ZnO 100%0.022[29]
ZnO 93.2 mol.% + SnO2 6.8 mol.%0.026[29]
ZnO 95.7 mol.% + Er2O3 4.3 mol.%0.012[41]
ZnO 95.3 mol.% + Er2O3 4.7 mol.%0.017[41]
ZnO 96.2 mol.% + Sm2O3 3.8 mol.%0.014[41]
ZnO 80.16 mol.% + ZnAl2O4 19.83 mol.% + CuO 0.04 mol.%0.021present work
ZnO 20.81 mol.% + ZnAl2O4 79.18 mol.% + CuO 0.01 mol.%0.005present work
Disclaimer/Publisher’s Note: The statements, opinions and data contained in all publications are solely those of the individual author(s) and contributor(s) and not of MDPI and/or the editor(s). MDPI and/or the editor(s) disclaim responsibility for any injury to people or property resulting from any ideas, methods, instructions or products referred to in the content.

