Article

Method for Concrete Structure Analysis by Microscopy of Hardened Cement Paste and Crack Segmentation Using a Convolutional Neural Network

by
Alexey N. Beskopylny
1,*,
Evgenii M. Shcherban’
2,
Sergey A. Stel’makh
3,
Levon R. Mailyan
3,
Besarion Meskhi
4,
Irina Razveeva
3,
Alexey Kozhakin
5,
Nikita Beskopylny
6,
Diana El’shaeva
3 and
Sergey Artamonov
7
1
Department of Transport Systems, Faculty of Roads and Transport Systems, Don State Technical University, 344003 Rostov-on-Don, Russia
2
Department of Engineering Geology, Bases and Foundations, Don State Technical University, 344003 Rostov-on-Don, Russia
3
Department of Unique Buildings and Constructions Engineering, Don State Technical University, 344003 Rostov-on-Don, Russia
4
Department of Life Safety and Environmental Protection, Faculty of Life Safety and Environmental Engineering, Don State Technical University, 344003 Rostov-on-Don, Russia
5
OOO VDK, SKOLKOVO, Bolshoi Boulevard, 42, 121205 Moscow, Russia
6
Department Hardware and Software Engineering, Faculty of IT-Systems and Technology, Don State Technical University, 344003 Rostov-on-Don, Russia
7
Department of Elasticity Theory, Faculty of Mechanics and Mathematics, Lomonosov Moscow State University, Leninskiye Gory, 1, 119991 Moscow, Russia
*
Author to whom correspondence should be addressed.
J. Compos. Sci. 2023, 7(8), 327; https://doi.org/10.3390/jcs7080327
Submission received: 18 July 2023 / Revised: 7 August 2023 / Accepted: 9 August 2023 / Published: 11 August 2023
(This article belongs to the Section Composites Modelling and Characterization)

Abstract

:
In recent years, the trend of applying intelligent technologies at all stages of construction has become increasingly popular. Particular attention is paid to computer vision methods for detecting various aspects in monitoring the structural state of materials, products and structures. This paper considers the solution of a scientific problem in the area of construction flaw detection using the computer vision method. The convolutional neural network (CNN) U-Net to segment violations of the microstructure of the hardened cement paste that occurred after the application of the load is shown. The developed algorithm makes it possible to segment cracks and calculate their areas, which is necessary for the subsequent evaluation of the state of concrete by a process engineer. The proposed intelligent models, which are based on the U-Net CNN, allow segmentation of areas containing a defect with an accuracy level required for the researcher of 60%. It has been established that model 1 is able to detect both significant damage and small cracks. At the same time, model 2 demonstrates slightly better indicators of segmentation quality. The relationship between the formulation, the proportion of defects in the form of cracks in the microstructure of hardened cement paste samples and their compressive strength has been established. The use of crack segmentation in the microstructure of a hardened cement paste using a convolutional neural network makes it possible to automate the process of crack detection and calculation of their proportion in the studied samples of cement composites and can be used to assess the state of concrete.

1. Introduction

Currently, the market for intelligent technologies used in the construction industry is growing at a tremendous pace. At the same time, not only is the number of implemented systems increasing but also the directions of their use. The use of intelligent solutions with elements of predictive analytics, big data analysis, optimization algorithms, computer vision and other similar methods allows companies to achieve benefits that positively affect the overall economic effect and competitiveness [1,2].
Let us consider, using the example of world experience, the ways of applying artificial intelligence (AI) algorithms in the construction industry, which are widely used in industrial and civil construction, as well as in architectural engineering [3]. The combination of the construction process and information technology is considered by researchers to solve the following problems: safety management at a construction site based on data obtained, including in real time [4,5,6]; automated assessment of personnel performance for their certification [7]; automated monitoring of construction equipment [8,9,10]; prediction of the physical and mechanical properties of building materials [11,12,13,14,15,16] and creation of multi-criteria decision-making models and recommender systems [15,17,18]. A special role in the automation and digitalization of construction processes is played by computer vision systems (computer vision—CV), which can recognize and analyze images obtained using photo or video cameras [19]. One of the main trends in the market of computer systems is their introduction into the manufacture and monitoring of building materials and structures to automate their quality control [20,21,22,23,24]. Thus, in [20], a system was proposed for automatic detection and evaluation of cracks on the runway surface, obtained using images of unmanned aerial vehicles (UAVs) using a deep convolutional neural network (CNN) YOLOv2. Once “a crack was detected, the main features were obtained by image segmentation and morphological operations”. The YOLOv2 detector was tuned using 3279 images, and the average precision (AP) was 0.89. In [21], “pathologies in concrete structures, such as cracks, efflorescence, corrosion spots and exposed steel rods” were visually detected on the concrete surface using the neural network architecture of the one-stage YOLOv4 detector. Detection results are evaluated using a mean accuracy index (mAP) “for five classes of concrete pathology, reaching 11.80% for cracks, 19.22% for fragmentation, 5.62% for efflorescence, 27.24% for exposed core and 24.44% for corrosion”. The article [22] presents a scheme for detecting areas of blurred, fuzzy cracks in concrete using AlexNet, VGG-16 and ResNet-50. According to the authors, the presented results will add more functionality for visual inspection of structures and monitoring using UAVs in the future. In [23], “a solution is proposed for detecting and modeling cracks in concrete structures using a stereo camera” whereby crack pixels are identified using semantic segmentation networks based on a U-Net network trained on a user dataset. Precision and recall reached 96% and 85% in this study. To identify cracks, the U-NET network was also used in [19,25,26,27]. In [24], the efficiency of crack detection was estimated by training the U-Net, DeepLabV3, DeepLabV3+, DANet and FCN-8 networks. Separate models gave an intersection over union (IoU) score in the range of approximately 0.4 to 0.6 for the test dataset, and for the meta model augmented with stacking ensemble training, the IoU score was 0.74.
Among the advantages of implementing computer vision systems in construction monitoring and flaw detection processes, it is worth highlighting “a high level of reliability, stability of work, which corresponds and in some cases even exceeds expert”, round-the-clock availability and decision-making speed [1,28,29]. Intelligent solutions help to process a large flow of information, including in real time, which can be used in production processes, in the process of analyzing accumulated and current data, creating predictive models, calculations and other tasks that arise in the construction industry [30,31,32].
The analysis carried out showed a growing trend in the application of intelligent technologies at all stages of construction: from the manufacturing stage and the initial prediction of the mechanical properties of materials and products to tools for assessing the reliability of buildings and structures according to various criteria during monitoring [33,34,35,36,37,38]. Special attention is paid to computer vision methods for detecting various aspects in monitoring the structural state of a material [39,40,41,42,43,44].
In this research article, the solution of a scientific problem from the area of building flaw detection using the computer vision method is considered, namely, the use of a U-Net convolutional neural network (CNN) for segmenting violations of the microstructure of a hardened cement paste that arose after the application of a load is shown. The developed algorithm makes it possible to segment cracks and calculate their areas, which is necessary for subsequent analysis by a process engineer when assessing the quality of the test sample of hardened cement paste and the state of concrete.
The scientific novelty of the research lies in:
Creating an original set of images of hardened cement paste;
Increasing the number of images to improve the generalizing ability of the model by applying an original augmentation algorithm [45];
Optimization of the parameters of the intellectual model based on the convolutional neural network of the U-Net architecture;
Calculation of the segmented defect area.
The following tasks were formulated to create a method for segmenting cracks using microstructural photos:
Preparation of a database of images of hardened cement paste using laboratory equipment;
Substantiation and description of the chosen SNS architecture;
Carrying out the process of augmentation to expand the training dataset;
Implementation, optimization, debugging and testing of the algorithm using SNS architecture U-Net;
Determination of the quality metrics of the implemented model;
Calculation of the area of a segmented defect, taking into account the parameters of laboratory equipment;
Establishing the relationship between the recipe, the proportion of defects in the form of cracks in the microstructure of the samples and their compressive strength.
The theoretical significance of the study lies in the expansion of ideas about the possibilities of applying computer vision technology in the construction industry. The practical significance of the work lies in the development of an applied, cross-platform and scalable algorithm that can serve as the basis for building flaw detection.

2. Materials and Methods

2.1. Characterization of Laboratory Samples

Cracks are fractures or abruptions that occur in building materials like concrete, metals, rocks and other solids. They appear as a result of structural stresses, temperature changes, chemical reactions or mechanical damage. Cracks, in terms of size, can range from microcracks to large holes and can greatly affect the strength and durability of a material. Cracks are mostly random, quite often unpredictable and therefore difficult to model and evaluate. However, they develop linearly or as a set of lines with a grid, breaking the uniformity of the surface and internal structure of concrete. The appearance and development of cracks in the concrete of building structures can lead to surface defects, structural disturbances, water penetration, reduced thermal and noise characteristics and many other consequences up to loss of bearing capacity and destruction. Therefore, in order to prevent and mitigate the detrimental effect of cracks on the characteristics of concrete and products made from it, it is necessary to be able to analyze and predict the causes and mechanisms of their formation [46].
The characteristics of the CEM I 52.5 N cement used in the study (Lipetskcement, Lipetsk, Russia) are presented in Table 1.
The chemical composition of microsilica MS-85 [47,48,49,50] (Novolipetsk Iron and Steel Works, Lipetsk, Russia) used as a modifier for hardened cement paste samples is shown in Table 2.
The largest proportion of microsilica was made up of particles ranging in size from 5 to 25 μm.
Glass fiber pretreated with a surfactant (Armplast, Nizhny Novgorod, Russia) was used as a reinforcing component. Table 3 shows the characteristics of the fiber.
Characteristics of the components of the samples are provided by the manufacturers.
In the study, cube samples were made with a rib length of 100 mm of hardened cement paste of 3 modifications:
(1)
Control: cement and water in the proportion of 25% by weight of cement;
(2)
Control + GF: cement, water (26% by weight of cement), glass fiber (GF) (3% by weight of cement);
(3)
Control + GF + MS: cement, water (28% by weight of cement), microsilica (10% by weight of cement); fiberglass (3% by weight of cement).
These compositions were selected based on the normative proportions for the preparation of standard consistency cement paste [51], as well as on the basis of previous studies [52], which considered the structure of a hardened cement paste containing microsilica and glass fibers, that is, the optimal dosages of these components obtained in these works.
For each modification, 6 samples were made, in total 18 samples.
The production of samples of the control composition was carried out as follows: dosing of all raw materials; mixing cement with water in a mixer for 30 s; stopping and collecting the cement paste from the walls of the mixer into the total mass and further mixing for 90 s; putting the paste into the mold and compacting on the vibrating platform within 60 s; the mold with the samples was kept for a day, then the samples were removed from the molds and kept in a bath with water in the “forming surface up” position for 27 days so that they did not touch each other and with the water level above the samples by at least 20 mm. The water temperature during storage of the samples was maintained in the range of (20 ± 1) °C. For the control + GF and control + GF + MS compositions, the dosed components—cement, fiber and microsilica—were mixed in a dry form, then mixing water was introduced and mixed in a similar way. The molding and storage conditions for the control + GF and control + GF + MS formulations are the same as for the control formulation.
Three samples of each modification were subjected to static loading on a P-50 press (PKC ZIM, Armavir, Russia). A load of 10 tons was applied to each of these samples and fixed for 30 s. After that, the load was reduced to 0, and the samples were sawn into three equal parts. The load was set at about 50% of the expected collapse load. It was important to simulate the onset of formation and development of cracks in the structure of the samples. The magnitude of the applied load will affect the number and proportion of defects in the samples but will not affect the results of detection and calculation of the areas of these cracks. From the central third (middle) of the sample, a sample was sawn out for microstructure examination using an electron microscope (Carl Zeiss Microscopy, Jena, Germany). The samples were examined with a magnification of 100–4000 times. The remaining three samples of each modification were tested on a press until destruction and fixation of the compressive strength.
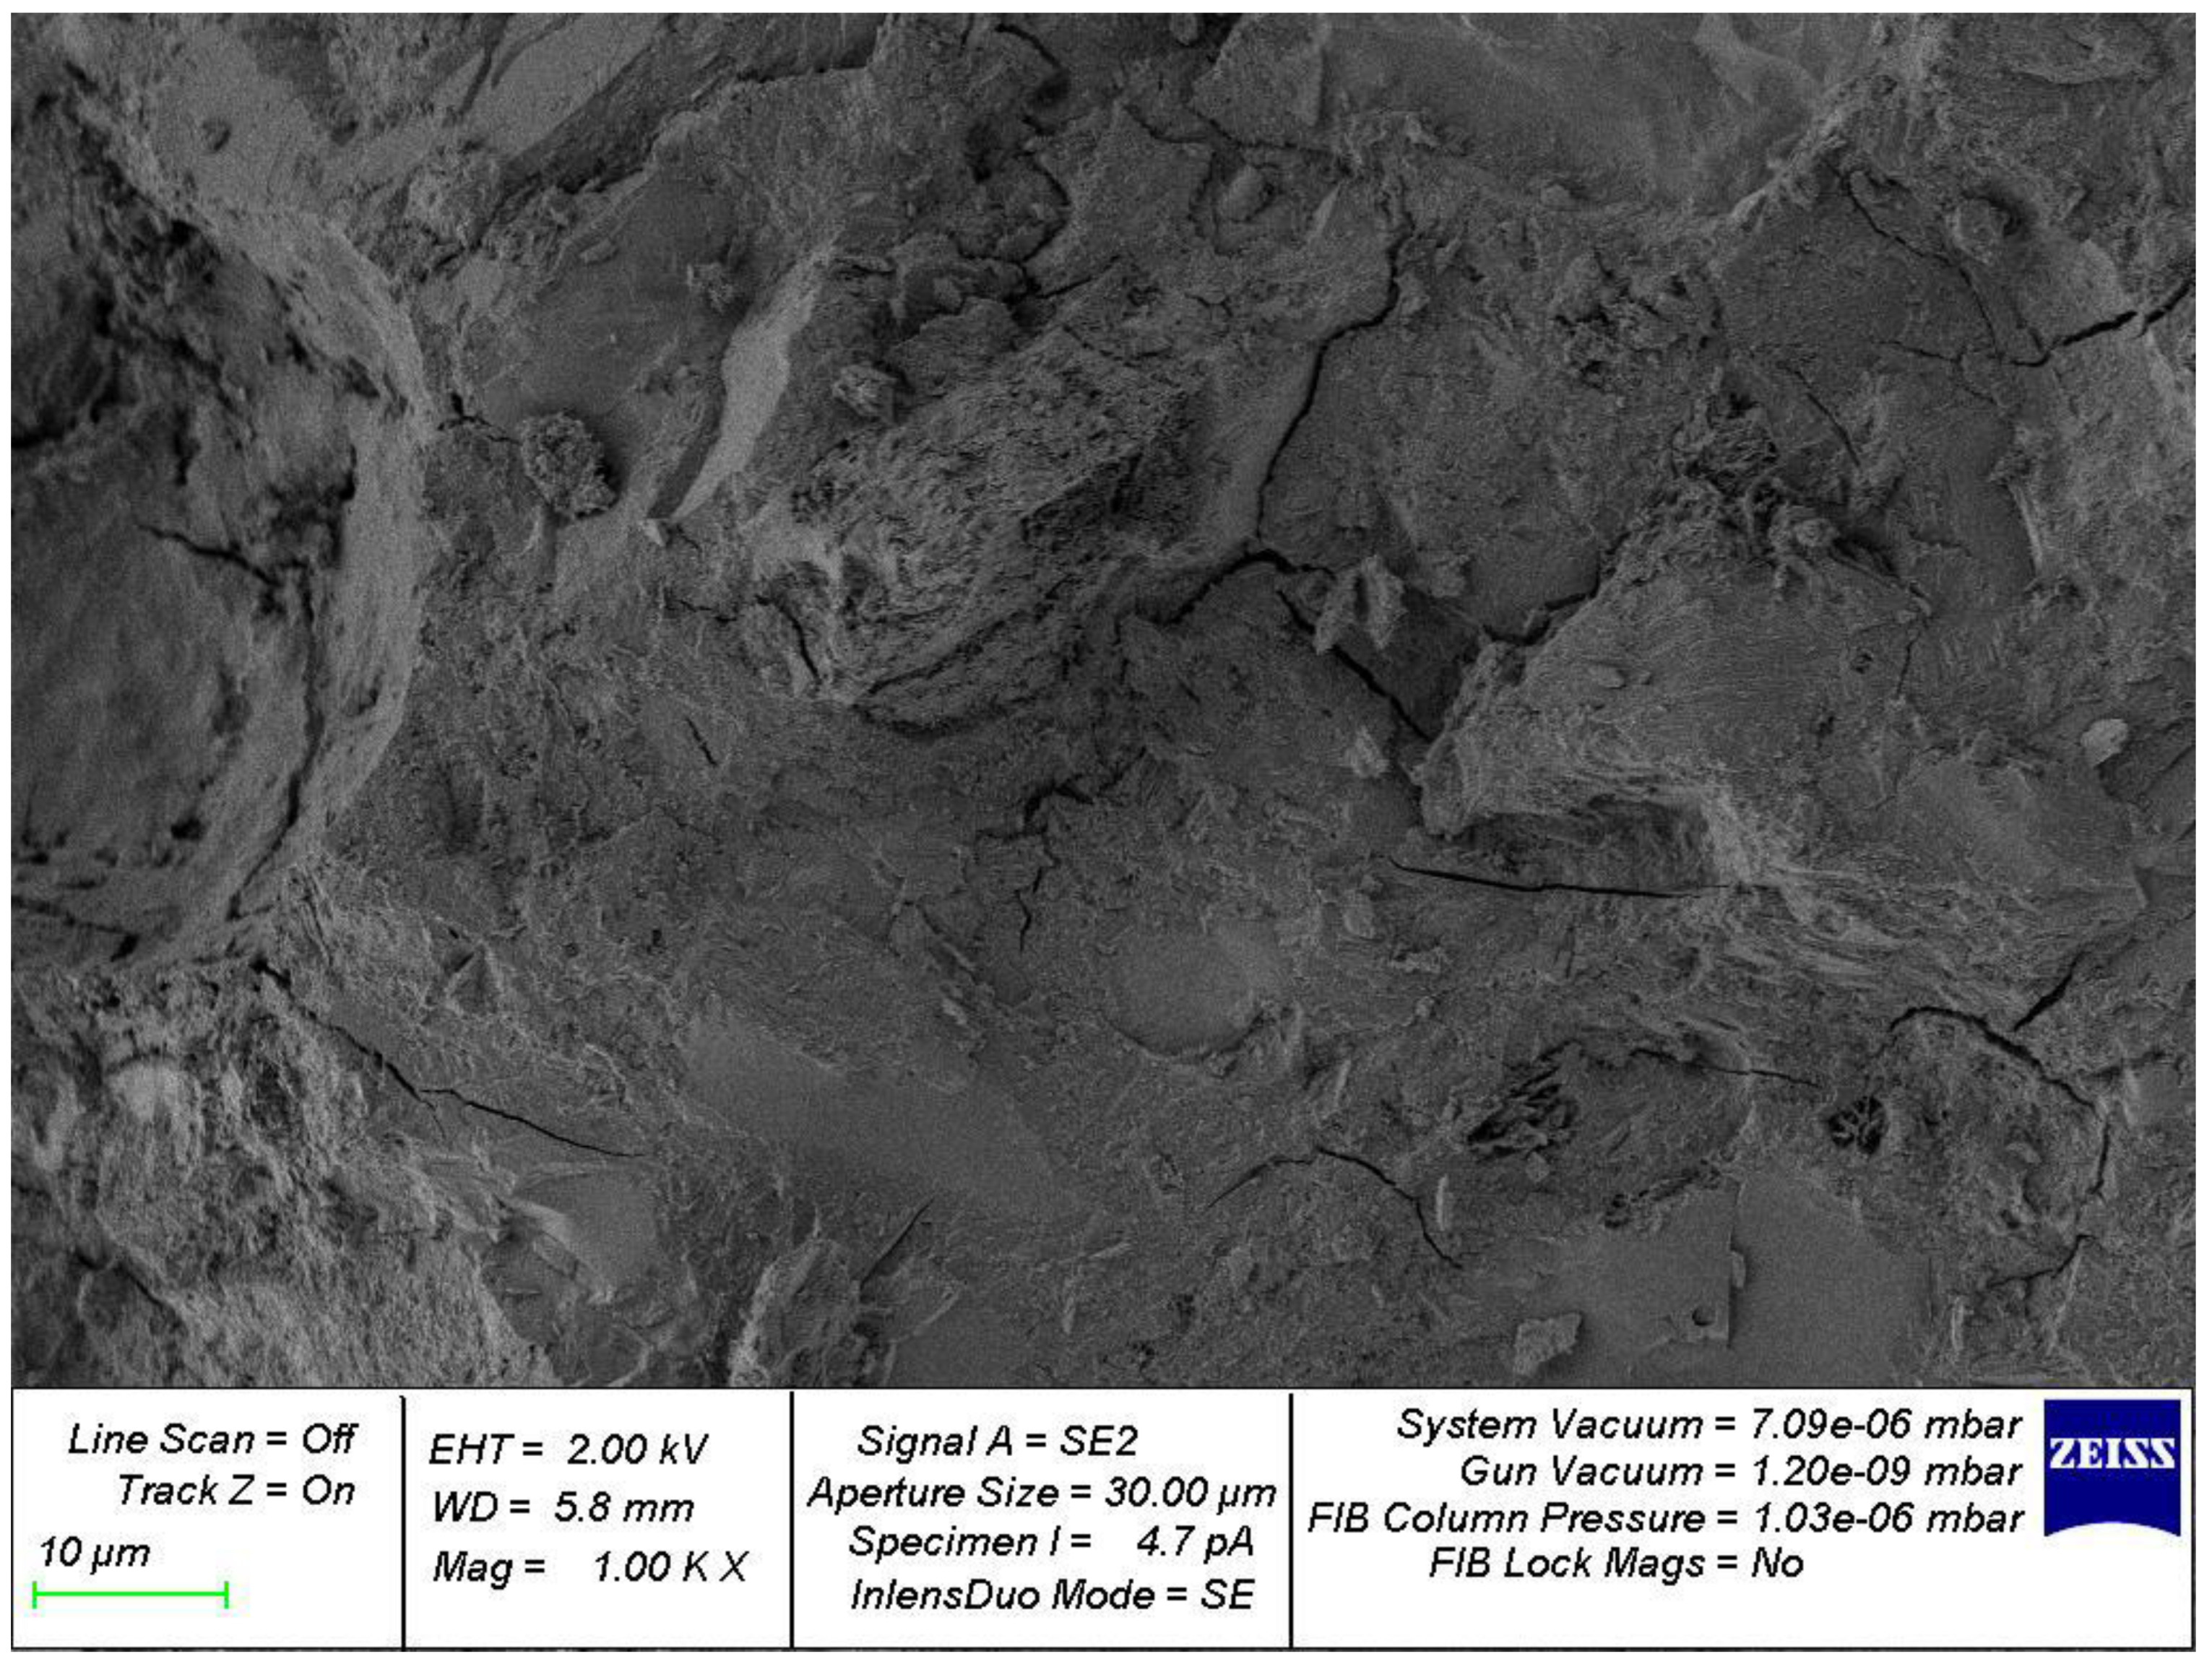
Figure 1 shows defects on a sample of hardened cement paste cracks that appeared after applying a load of 10 tons to the sample. Such defects can also occur in case of violation of production technology, improper transportation or non-compliance with storage conditions. Identification of a defect of this kind is one of the key criteria in the study of the structure of materials, products and structures.
To automate the process of detecting cracks and calculating their areas during visual inspection, it is proposed to develop a computer vision algorithm that performs the functions of a process engineer.

2.2. Development of an Intelligent Algorithm Based on a Convolutional Neural Network

There are a number of other image processing technologies besides CNNs, for example traditional image processing techniques such as filters, transforms and computer vision algorithms. Such methods require specialized image processing skills and fine-tuning of parameters for each individual task. In turn, the CNN is the most modern, versatile and fast way to process and analyze images at the current moment in the development of science and technology.
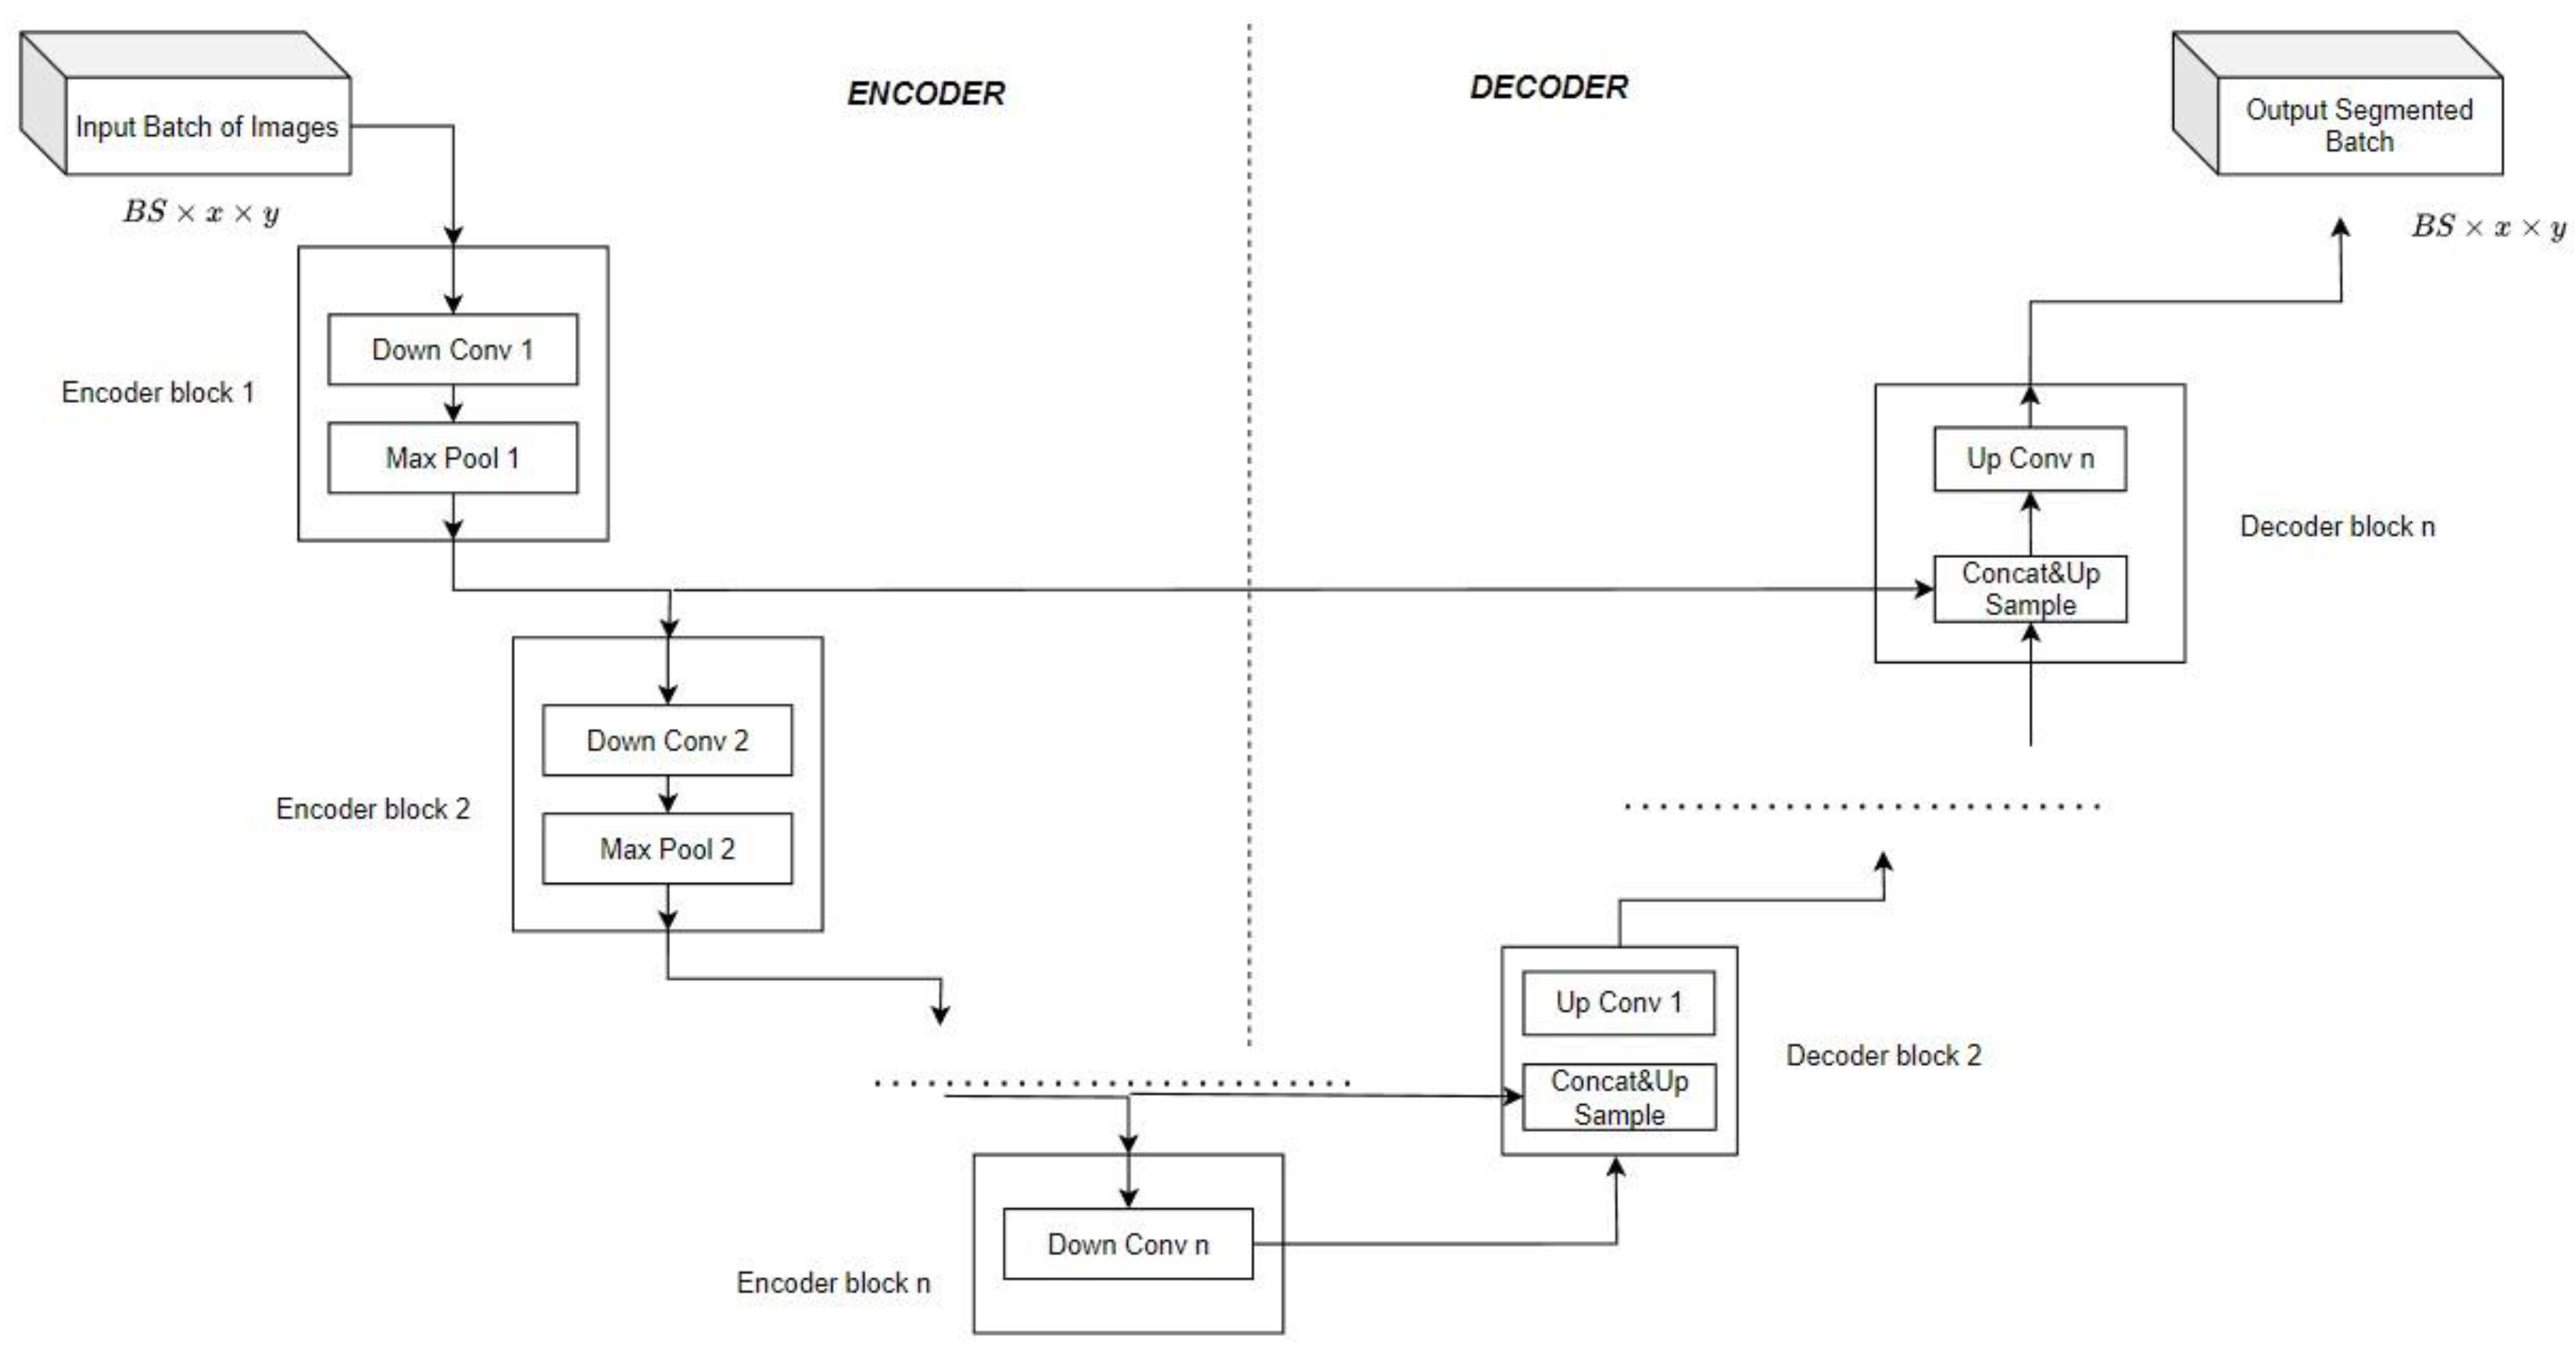
U-Net is an architecture developed in 2015 to solve the problem of biomedical data segmentation (Figure 2).
U-Net is a neural network architecture built on the basis of convolutional layers and poolings. Convolutional layers are non-linear transformations of input matrices obtained by applying non-linear activation functions to linear combinations of elements of the original matrix, selected in a special order. Pullings, on the other hand, are the aggregation of information from the original matrix using the functions of choosing the maximum from a subset of the elements of the original matrix. The input and output of both operations is a matrix. Both of these operations can lead both to a decrease in the dimension of the matrix and to its increase. The trained parameters of the neural network are the coefficients of a linear combination of elements of the original matrix, which are contained in the so-called convolution kernel. U-Net is a sequence of transformations of the original matrix that describes the image pixel by pixel, using the sequential alternate application of convolutions and poolings, which are usually considered in terms of an encoder and a decoder.
The U-Net neural network consists of two consecutive blocks: an encoder and a decoder. The task of the encoder is to find a low-dimensional description of the original image in the latent space of high-level features. The encoder selects the most significant features of the image for the task under consideration and encodes them in a non-interpretable way. The task of the decoder is to decipher the features generated by the encoder and determine, based on these latent high-level features, which areas of the original image should be selected as segmentation elements. The encoder of the U-Net model is a sequence of convolutional layers that sequentially compress the original image by 2n times, where n is the so-called encoder depth. In our work, n = 5. This value of n is often used in practice, since it has been empirically found that it is optimal for a wide range of problems. The decoder is a mirror image of the encoder; it consists of the same number of convolutional layers and poolings, applied in reverse order to obtain the original size image at the output. The convolutional blocks of the decoder and encoder are connected using skip connections, which helps to deal with the fading gradient problem that is relevant for many deep neural networks, especially in computer vision [53]. If there is a large dataset and there are no restrictions on computing resources, the encoder and decoder are trained in pairs from scratch; that is, they are initialized with some random weights. In the case of a lack of training data, the transfer learning technique is used. The idea is to use an encoder from another neural network trained to solve a multi-class classification problem on a large dataset. This approach makes it possible to use an encoder that is able to extract high-quality high-level features in advance and then train the decoder to solve the segmentation problem based on such features. In our work, we used an encoder from the ResNet-50 neural network, pre-trained on the ImageNet dataset (https://image-net.org/, accessed on 10 August 2023). The data are available to researchers free of charge for non-commercial use.
At the output of the U-Net CNN, we obtain an image of the original size, in which each pixel is marked with a color corresponding to a certain class. In our case, there are only 2 classes: a defect (crack) and a background.
In this study, two models are considered, which are based on the architecture of the U-Net neural network:
(1)
Model 1 is a U-Net CNN, where augmentation will be probabilistic; that is, for each batch sample for training, we will apply the following transformations: random cropping of images; image rotation by 90°, vertical rotation/horizontal rotation/rotation by a random angle with a probability of 0.75, adding Gaussian noise sampled from a normal distribution with a probability of 0.7. There is no augmentation on the validation and test sets; preprocessing is reduced to the possibility of using paddings if necessary. This approach allows minimizing the negative effects of retraining the model, as well as minimizing the computational resources required for its training.
(2)
Model 2 is a U-Net CNN, the input of which is a set of 1000 images, divided in the ratio 70/20/10 into training, validation and test sets, created using the author’s augmentation code [45].
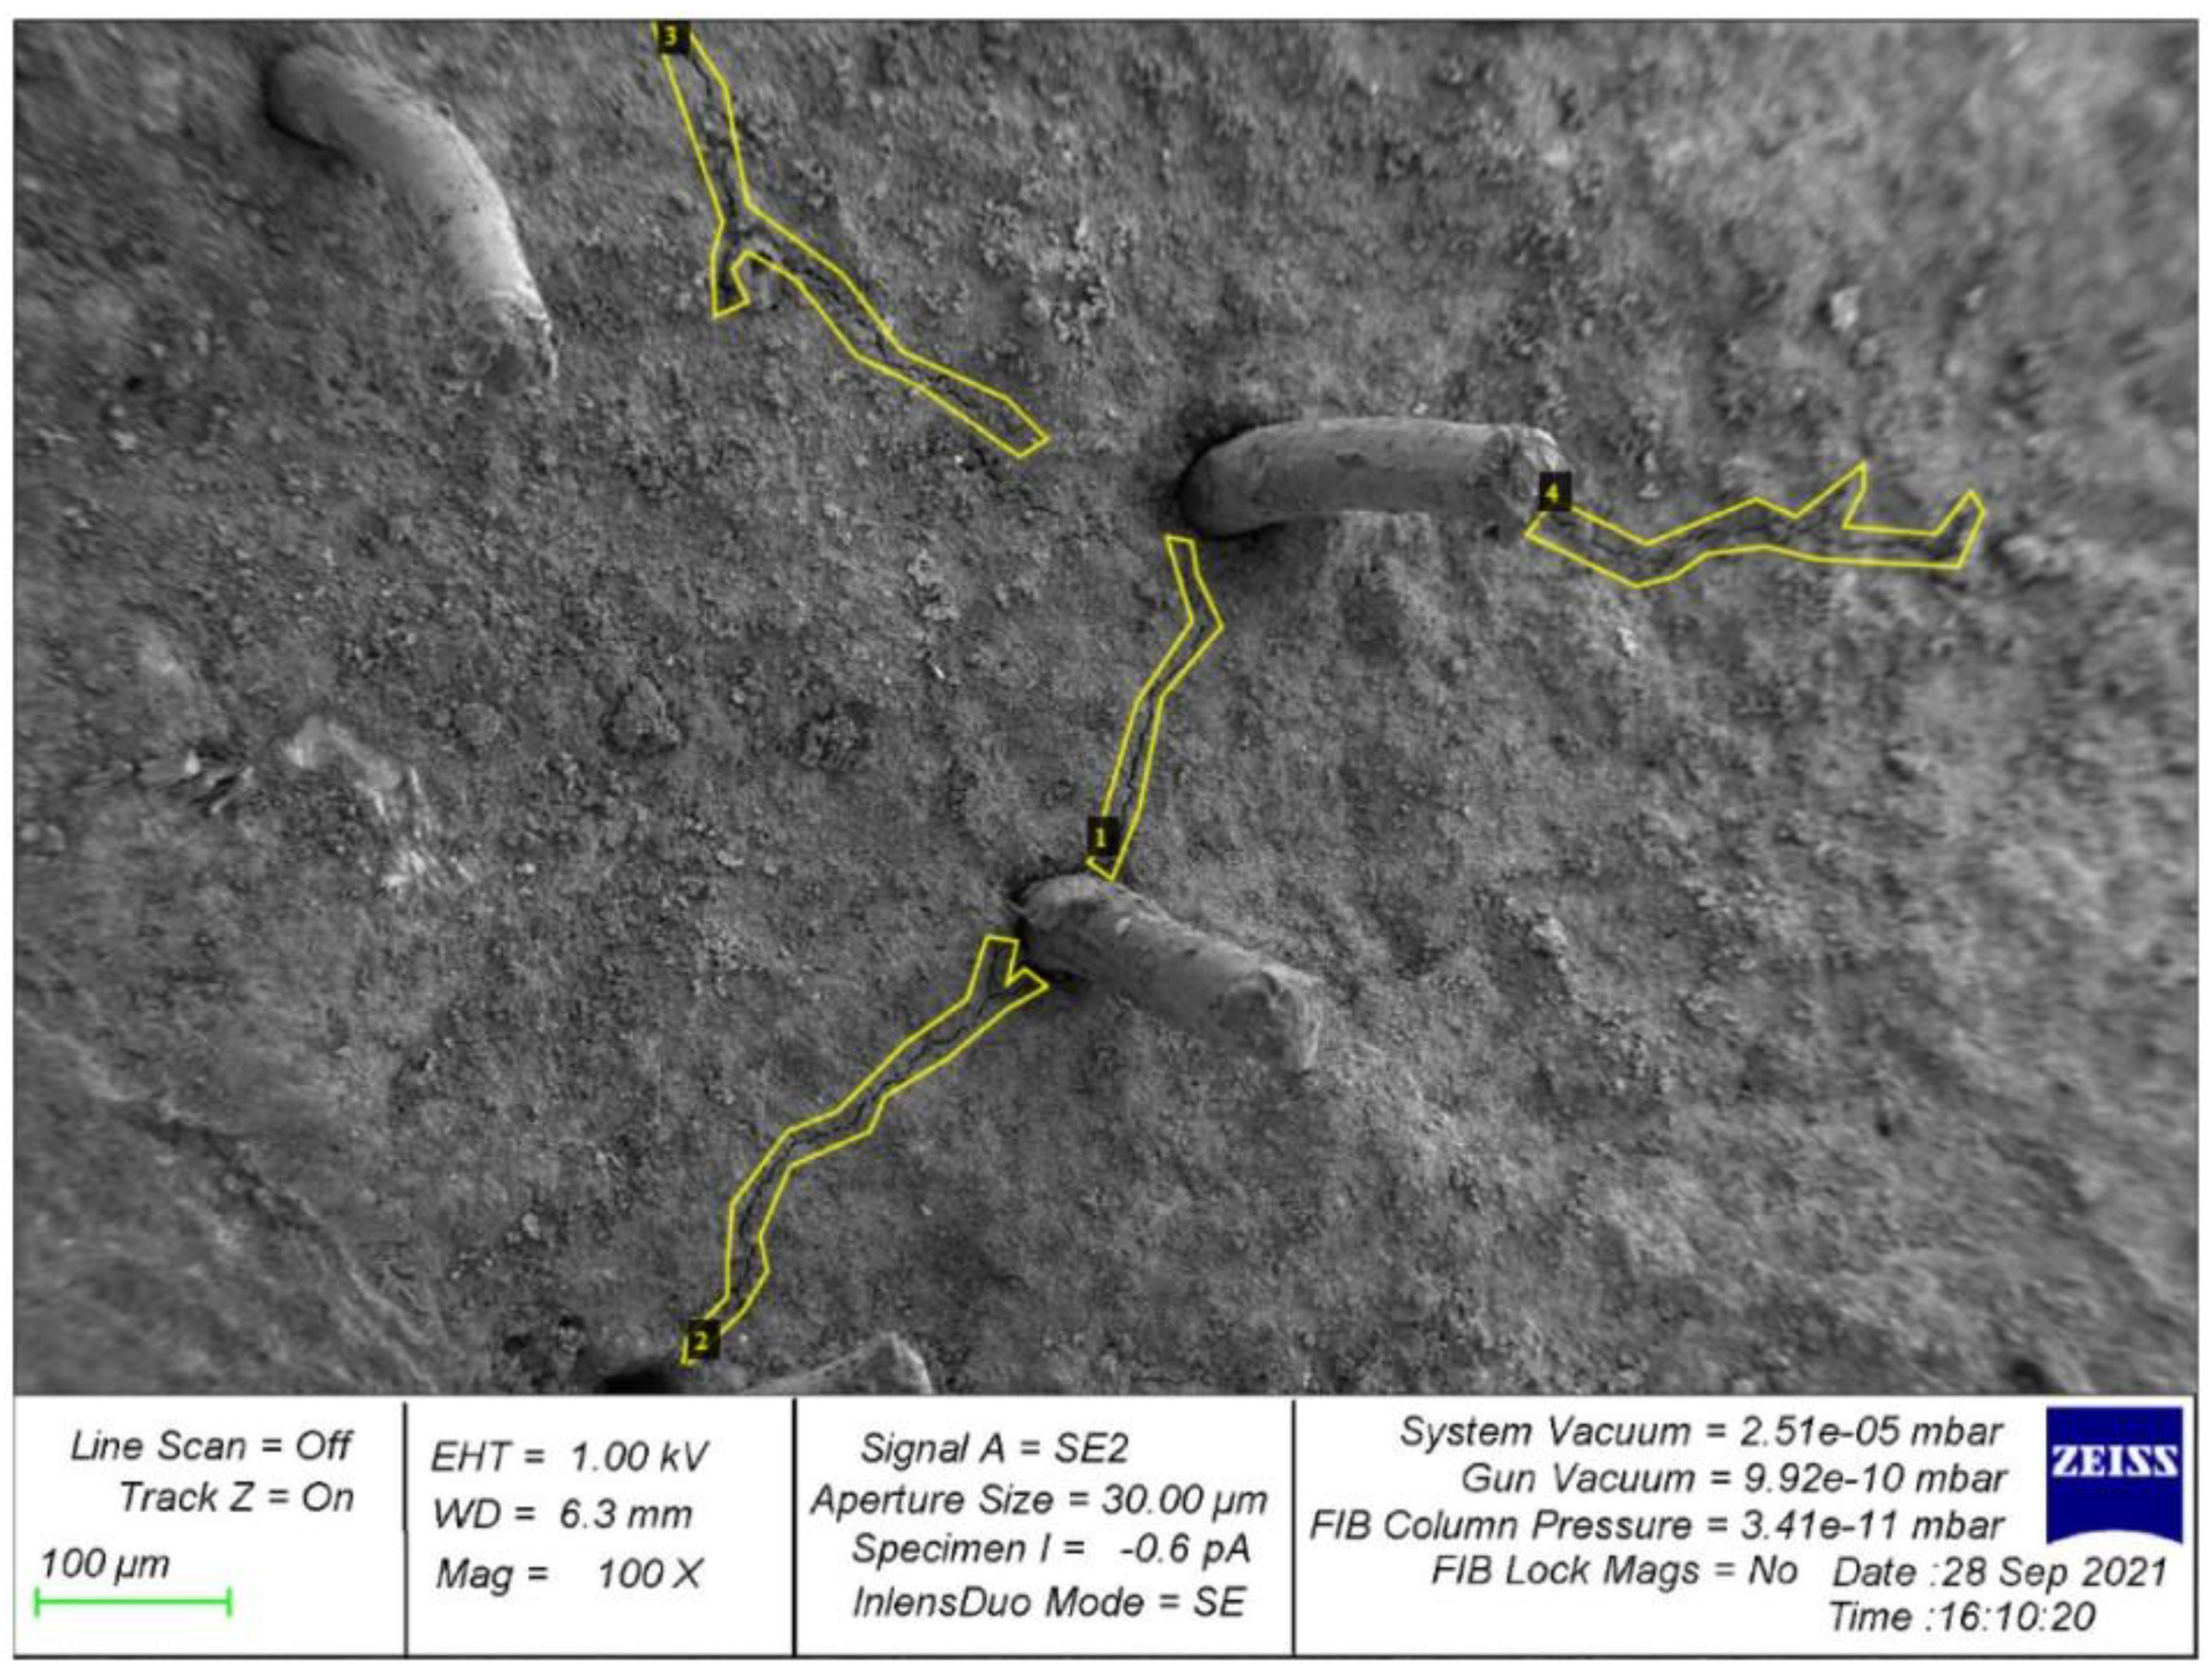
When preparing data for inputting both models, it is necessary to carry out the process of marking images (image annotation)—this is one of the key stages in creating an effective computer vision system. This process converts the information into a format that can be understood by the image analysis algorithm. During the marking process, the original image is supplemented with metadata about the location of the defect in case it is fixed by an expert technologist [54,55]. Figure 3 shows an image annotated with the VGG image annotator. It is worth noting that a number of images have the effect of “blur” (visible in the area of crack No. 4), which in the future will give resistance to this external factor when using the developed algorithm in real conditions.
An important step in the implementation of a convolutional neural network of the U-Net architecture is the selection of parameters during its training. The main parameters for both models are presented in Table 4.
The models were trained by optimizing the Dice Loss loss function. This loss function is based on a segmentation quality metric called the Dice coefficient (1). The Dice coefficient is twice the ratio of the number of pixels with a correctly identified segmentation mask to the sum of the number of pixels that are either identified as a segmentation element by our model or are actually related to them.
D S C = 2 | X Y | | X | + | Y |
Based on such a metric, a loss function called Dice Loss (2) is built:
D i c e   L o s s = 1 2 | X Y | + S m o o t h | X | + | Y | + S m o o t h
where X is the set of image pixels that, according to the markup, belong to the crack area, and Y is the set of image pixels that belong to the crack area, according to the segmentation of the model. The additional term Smooth is used to smooth the calculation result.
To train the models, the Adam stochastic optimization method [56] was used, which has demonstrated its effectiveness in many problems. The peculiarity of this method is that it simultaneously uses the adaptation of the gradient descent step taking into account the accumulated gradients, as the Adagrad, Adadelta, Rmsprop and similar methods do, and the idea of momentum accumulation, as Momentum and Nesterov Adaptive Gradient (NAG) do. The value 10−4 was used as the learning rate parameter. The training process took 300 epochs, was carried out on the basis of NVIDIA Tesla T4 accelerators and took 180 min for the first model and 220 min for the second. The gradient descent step was performed on a batch of size 10, applying probabilistic augmentation to each image within the batch in the case of model 1 and on a batch of size 10 in the case of model 2.
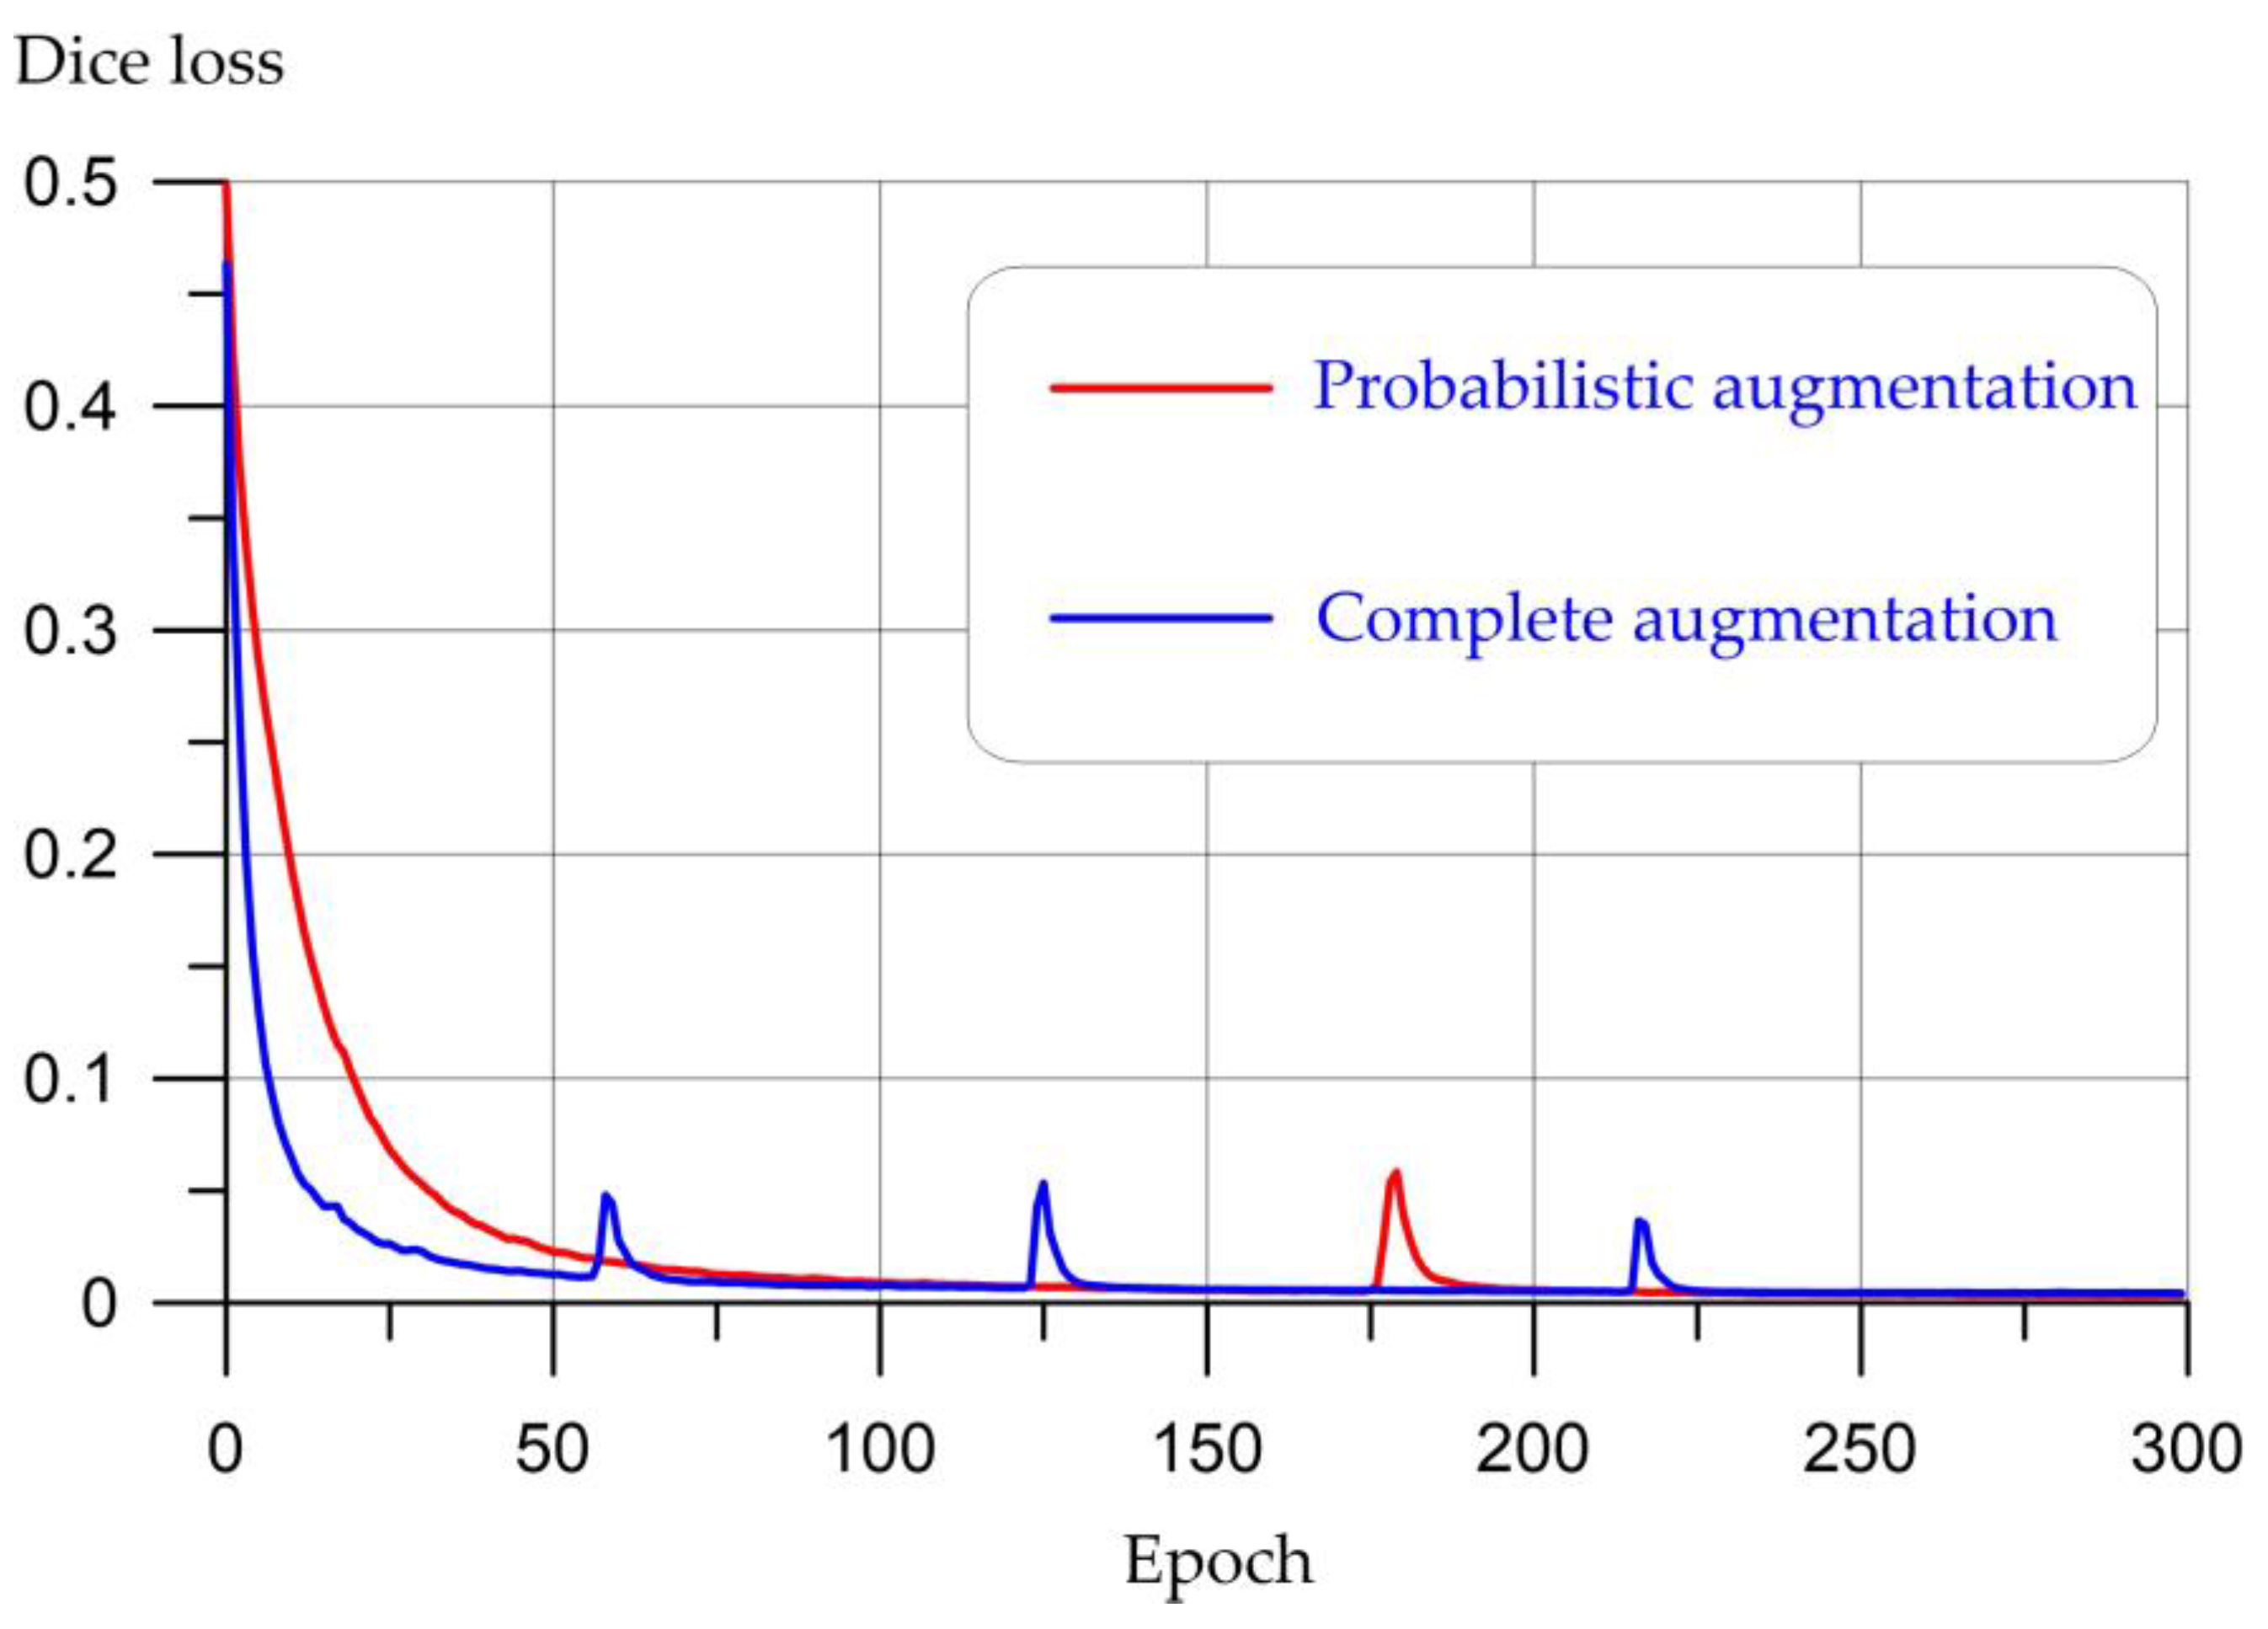
Figure 4 and Figure 5 show the training graphs of the CNN for model 1 and model 2 on the training and validation sets, where the OX axis shows the learning epochs, and the value of the loss function on the training and validation sets, respectively, is plotted on the OY axis.
Analyzing the graph, we can conclude that the optimization algorithm has reached convergence, as evidenced by small changes in the loss function from epoch to epoch at the end of training on the training set. At the same time, there was no increase in the value of the loss function on the validation set, which in turn indicates the absence of overfitting.

3. Results and Discussion

3.1. Quality Metrics for Crack Segmentation in Hardened Cement Paste

In this study, the metrics P, R, F1, Dice and IoU are considered, since these metrics can give a comprehensive picture of the different properties of the proposed fracture segmentation solution. The P (3) metric is designed to determine the percentage of false positives: the larger this metric, the fewer false positives our algorithm allowed. In our case, this metric reflects the percentage of the pixels detected as a crack image that actually contained a crack image from the marker’s point of view.
P = T P T P + F P
where TP—true positive: the algorithm correctly assigned the pixel to the considered class; FP—false positive: the algorithm incorrectly assigned the pixel to the considered class.
The R (4) metric, on the other hand, shows what percentage of pixels with a crack image were detected by our system. Both of these metrics are important, since each of them reflects one of the key aspects of the problem, if we consider it as a pixel classification problem.
R = T P T P + F N
where FN—false negative: the algorithm incorrectly states that the pixel does not belong to the class in question.
Meanwhile, considering any of these metrics separately cannot give us an idea of the quality of the trained model, since a trivial algorithm is able to maximize any of these metrics while minimizing the other. A compromise metric is needed that combines the result of P and R. This is the metric F1 (5), which is the harmonic mean of P and R.
F 1 = 2 × P × R P + R
The segmentation metric intersection over union—IoU (6)—is the ratio of the intersection of the found and marked areas to the union of these areas. The higher the value of this metric, the better.
I o U = X Y X Y
The results of assessing the quality of models on a test sample are presented in Table 5.
The metrics shown in Table 5 were used as measures of similarity between forecasts of models 1 and 2 and manual labeling. These are standard metrics used in segmentation problems to assess the similarity of predicted areas with labeled ones.
Figure 6 shows the results of the developed algorithms. The models show segmented areas containing a defect—a crack.
As shown in Figure 6a, the main crack 1 around the fiber and upward is detected by both models, while the thin crack 2 on the right side of the images is detected more clearly by model 1. Cracks 3 and 4 are detected by both model 1 and model 2. It should be noted that the labeling in this task is a subjective factor that adversely affects the metrics indicated in Table 5. The obtained segmentation results should be evaluated according to the precision level set by the technologist. According to the technologist, for high-quality segmentation of the main contour of both small and large cracks, precision is required to be at least 60%, which was achieved for both models. This means that the developed models meet the needs of the problem of detecting a defect in the structure of a composite and have practical applied value.
Thus, segmentation models based on the U-Net convolutional neural network have demonstrated their ability to solve the problem of segmentation and defect detection in an image. Both models can be applied to solve the problem; however, according to the metrics presented in Table 5, model 2 demonstrates slightly better segmentation quality indicators, namely: the difference in recall is 0.05 in favor of model 2, the Dice coefficient and IoU of model 2 are better by 0.02 and F1 is better by 0.01. Although there is no significant difference in the metrics, it is worth noting that model 1 makes it possible to detect not only significant damage but also small cracks, which is important in this kind of research.
The results in [22] are interesting in terms of high recall metrics, which means that the model is able to detect most of the desired defects. Meanwhile, it is worth noting two points. First, high recall rates are associated with rather low precision rates. This may be due to the tendency of the model to detect redundant image segments as having a defect, although there may not be a defect. In our work, we pay great attention to maintaining a balance between precision and recall, focusing primarily on F1 measures and IoU. Another difference of the approach [22] is the fundamentally larger volume of the dataset and the absence of the use of augmentation techniques to expand it. This dataset contains almost 200 images, while our original dataset is much smaller, and therefore we needed to use additional techniques to solve the problem of small data volume. This situation meets the needs of the industry due to the fact that the collection and labeling of data is an expensive and time-consuming procedure. The results of the experiment in the study [57] show that the mIoU and mPA of the proposed method reach 88.3% and 92.7%, respectively. The high performance is justified by the modification of known segmentation algorithms and their combination, as well as by the large training dataset. At the same time, it should be noted that cracks presented as defects are easy to detect as a result of visual inspection of the images. In the present study, micrographs with many cracks, sometimes invisible to the human eye, are presented, but the developed algorithms cope with the task.
There are a number of areas for improving the quality of segmentation, measured in the metrics discussed in this article. The models trained in the framework of this work are able to detect defects and segment the areas of their concentration; however, sometimes they lead to inaccuracies, mainly associated with false positive detections of the detector, as evidenced by the excess of the recall metric over precision.
The first and main direction in the development of models is to increase the training sample and improve the quality of markup by reducing the subjectivity of the process. The models showed their potential quite well, having managed not to overtrain on a small dataset and also managed to learn how to solve the segmentation problem with a sufficient level of quality.
Another way to improve the model can be to add various visual effects to the augmentation process. It is also possible to use more advanced encoders or fine-tune existing ones, which is also expected to give an increase in quality if the dataset is expanded.

3.2. Calculating the Area of a Segmented Region

The area of the segmented area is calculated by estimating the area of one image pixel based on the parameters of the equipment used. Each image shown has a risk with the designation of the image scale. Based on this risk, the area occupied by each pixel of the image is calculated. This area depends on the characteristic size of the area being photographed, as well as on the resolution of the image. Based on this value, the total area of the segmented image area obtained from the neural network is calculated.
For example, for Figure 6c of the test sample, segmentation was performed based on the trained neural network. Based on the known parameters of laboratory equipment, it was calculated that the area of one pixel is approximately equivalent to 7.4 × 10⁻³ µm2. Based on the obtained segmentation pattern, the fraction of the image occupied by the defect was determined to be 4.9%, which is equal to 450.7 µm2.
The proportion of the image occupied by the defect (δ) was calculated by the formula:
δ = S d S × 100
where Sd is the image area occupied by the defect; S is the area of the entire image.
The results of calculating the fraction occupied by cracks and comparing them with the results of calculating the compressive strength of the samples are presented in Table 6.
Analysis of the results presented in Table 5 allows us to draw the following conclusions. The proportion occupied by cracks after applying a load of 10 tons on the sample decreases after the addition of silica fume and fiber. The control + GF + MS sample has the smallest proportion occupied by cracks. The decrease in the proportion occupied by cracks is mainly accompanied by an increase in the compressive strength of the specimens. The dependence of the change in compressive strength (R) on the proportion of cracks (δ) in the photographs of the microstructure of the samples is shown in Figure 7.
Figure 7 shows that with an increase in the proportion occupied by defects in the form of cracks in photographs of the microstructure of the studied samples, the compressive strength decreases. First of all, this is due to the different nature of the destruction of composites with and without fiber. The control composition (control) in the microstructure has the highest proportion of defects in the form of cracks and is 8.3%, and the compressive strength values are the lowest. The composition with fiber (control + GF) has a lower proportion of defects in the form of cracks compared to the samples of the control composition and is 4.9%. At the same time, the compressive strength of samples with fiber increased by 12%. For compositions with fiber and microsilica, the proportion occupied by cracks was 2.2%, and the increase in compressive strength was 28%. Based on the foregoing, it can be concluded that a decrease in the proportion occupied by defects in the form of cracks in the images of the microstructure of the studied samples is directly related to the type of additive in the composition of the composite. Thus, in the case of fiber-reinforced samples, the decrease in the fraction of cracks is associated with the peculiarities of the operation of glass fiber in the composite structure. Fiberglass-reinforced samples resist loads better; therefore, composites with fiber under compressive loads have fewer defects in the form of microcracks.
Thus, a relationship has been established between the formulation of the studied samples, the proportion of defects in the form of cracks in the microstructure of the samples and their compressive strength. A decrease in the proportion occupied by cracks in photographs of the microstructure of the samples is characterized by an increase in compressive strength and is directly related to the type of additive in the composite.
The use of crack segmentation in cement composites using a convolutional neural network makes it possible to automate the process of detecting cracks and calculating their proportion in the studied samples of cement composites and can be used to assess the state of concrete.
Analyzing the results obtained and comparing the developed method with existing methods for assessing the quality and condition of concrete, the following should be noted. Detection and timely recognition of cracks and other microstructural elements in the analysis of micro- and macrostructures of concrete allows not only timely diagnosis of developing destructive processes in concrete but also predicting its life cycle and managing its durability, maximizing the use of the concrete resource. Existing manual or other methods based on visual and instrumental assessments, that is, having a significant influence of the human factor, cannot fully effectively manage the life cycle of reinforced concrete and concrete structures. At the same time, understanding the essential role of the fundamental nature of the formation and development of structure formation and properties of concrete, the following aspect should be noted: concrete is a unique material based on the principle of hydration of Portland cement binder and strength increase over a long time. At the same time, the destructive processes that occur under improper loading, improper operation and potential incorrectly applied climatic conditions to a particular concrete prevent the fundamental process and law of concrete strength development to be fully revealed. In many ways, this is hindered just by the emerging structural defects at the microlevel, which cannot be detected without opening the concrete and microscopic examination. At the same time, by detecting such defects invisible to the eye at an early stage using SEM analysis, and in particular using a special-purpose neural network, this process will become more manageable. In addition, if it is not possible to take photographs similar to those studied in this work, then the following technologies can be used:
(1)
Use of additional devices: images obtained from sensors capable of detecting cracks or changes in hardened cement paste, cement-sand mortar and concrete can be used. For example, ultrasonic or laser sensors can detect imperfections in a material that are not visible on the surface.
(2)
Multimodal approach: thermal images and infrared images can be used as a dataset for further processing by a neural network.
(3)
Evaluation by other characteristics: using other characteristics, such as thermal conductivity data, mechanical characteristics, or sound signals emanating from the surface of the material and then generating graphs that can be further processed using a CNN.
Thus, the technique reflects the most modern state of concrete diagnostics and paves the way for timely and rational management of the life cycle and durability of concrete and reinforced concrete structures. An important aspect is the relationship between the concepts: structural quality, packing density of the particles of the structure, the absence of defects in the structure of concrete at the micro and macro levels and, ultimately, its strength and other performance characteristics. Concrete as a stone material, working mainly in compression, significantly depends on its strength characteristics in the presence of micro- and macrocracks, as well as other defects that significantly threaten its durability resource.
Thus, an important issue is the search for relationships between emerging cracks, detected in a timely or untimely manner by various methods, and the strength of concrete. As mentioned above, the strength of concrete is a somewhat paradoxical characteristic, which is characterized by a constant increase due to the physical and chemical processes of hardening, hydration of Portland cement and, at the same time, a slight decrease under the condition of developing cracks in the concrete structure due to operational or other influences. Important aspects are also the correct care of concrete in the initial period, the right concrete formulation and the right operating conditions.

4. Conclusions

The article describes the process of creating computer vision algorithms that allow segmenting crack areas in a hardened cement paste and calculating the area occupied by them. Based on this analysis, conclusions can be drawn about the strength characteristics of the studied materials. For the study, our own empirical base is proposed, which is photographs of the microstructure of the hardened cement paste, which was subjected to loading. The study considers two models based on the U-Net convolutional neural network: model 1 with probabilistic augmentation and model 2 with a dataset generated using the author’s algorithm.
The results of the study led to the following conclusions.
(1)
The proposed intelligent algorithms, which are based on the U-Net CNN, allow segmentation of areas containing a defect, a crack, with an accuracy level required for the researcher of 60%.
(2)
Evaluation of the quality of the results of the work of model 1 and model 2 suggests the following: both models can be used to solve this problem; however, model 2 showed slightly better results. The difference in performance between models is 0.05 in favor of model 2 in terms of recall, Dice coefficient and IoU are also 0.02 higher in model 2 and F1 is better by 0.01. Although the difference in metrics is not significant, it is worth noting that model 1 is able to detect both significant damage and small cracks, which is an important aspect for this study.
(3)
According to the results of the study, it is possible not only to segment the areas of cracks but also to calculate the area occupied by damage.
(4)
The relationship between the formulation, the proportion of defects in the form of cracks in the microstructure of hardened cement paste samples and their compressive strength has been established. A decrease in the proportion occupied by cracks in photographs of the microstructure of the samples is characterized by an increase in compressive strength and is directly related to the type of additive in the composite. The use of crack segmentation in the microstructure of a hardened cement paste using a convolutional neural network makes it possible to automate the process of crack detection and calculation of their proportion in the studied samples of cement composites and can be used to assess the state of concrete.
The continuation of the research is planned in the direction of obtaining and analyzing new dependences of the strength and long-term properties of concrete on the parameters of defects in its microstructure by creating and training a neural network.
In addition to the research and practical usefulness of the study, the following should be noted. Such results, which present a new method for analyzing the structure of concrete, will significantly develop the fundamental science, materials science, in terms of the structure formation of concrete. This is important because concrete is a complex conglomerate. The formation of its structure is a process that depends on many factors. This method will significantly simplify research processes in scientific laboratories.
The fundamental principle of composition–structure–properties in this regard acquires an even more refined meaning because, until now, in general, the quality of the concrete structure and the prediction of its durability have depended on macro-level factors: the structure of concrete at the phase boundaries or problem areas. Using the method proposed by us, it is possible to detect “bottlenecks” as early as the stage of structure formation at the micro level and thereby improve the quality of not only production but also research processes.

5. Patents

Beskopylny, A.N.; Mailyan, L.R.; Stel’makh, S.A.; Shcherban’, E.M.; Razveeva, I.F.; Beskopylny, N.A.; Dotsenko, N.A.; El’shaeva, D.M. The program for determining the mechanical properties of highly functional lightweight fiber-reinforced concrete based on artificial intelligence methods. Russian Federation Computer program 2022668999, 14 October 2022. Available online: https://www.fips.ru/registers-doc-view/fips_servlet?DB=EVM&DocNumber=2022668999&TypeFile=html (accessed on 17 July 2023).
Beskopylny, A.N.; Stel’makh, S.A.; Shcherban’, E.M.; Razveeva, I.F.; Kozhakin, A.N.; Beskopylny, N.A.; Onore, G.S. Image Augmentation Program. Russian Federation Computer program 2022685192, 21 December 2022. Available online: https://www.fips.ru/registers-doc-view/fips_servlet?DB=EVM&DocNumber=2022685192&TypeFile=html (accessed on 17 July 2023).

Author Contributions

Conceptualization, S.A.S., E.M.S., A.N.B. and I.R.; methodology, S.A.S., E.M.S. and I.R.; software, I.R., A.K. and N.B.; validation, I.R., A.K., S.A.S., E.M.S. and A.N.B.; formal analysis, I.R., S.A. and N.B.; investigation, L.R.M., S.A.S., E.M.S., A.N.B., N.B., A.K., S.A. and I.R.; resources, B.M.; data curation, S.A.S., E.M.S., A.K., S.A., D.E. and I.R.; writing—original draft preparation, I.R., S.A.S., E.M.S., D.E. and A.N.B.; writing—review and editing, I.R., S.A.S., E.M.S. and A.N.B.; visualization, I.R., S.A.S., E.M.S., A.N.B., D.E. and N.B.; supervision, L.R.M. and B.M.; project administration, L.R.M. and B.M.; funding acquisition, A.N.B. and B.M. All authors have read and agreed to the published version of the manuscript.

Funding

This research received no external funding.

Data Availability Statement

The study did not report any data.

Acknowledgments

The authors would like to acknowledge the administration of Don State Technical University for their resources and financial support.

Conflicts of Interest

The authors declare no conflict of interest.

References

  1. Khan, M.A.-M.; Kee, S.-H.; Pathan, A.-S.K.; Nahid, A.-A. Image Processing Techniques for Concrete Crack Detection: A Scientometrics Literature Review. Remote Sens. 2023, 15, 2400. [Google Scholar] [CrossRef]
  2. Dorafshan, S.; Thomas, R.J.; Maguire, M. Comparison of deep convolutional neural networks and edge detectors for image-based crack detection in concrete. Constr. Build. Mater. 2018, 186, 1031–1045. [Google Scholar] [CrossRef]
  3. Lagaros, N.D.; Plevris, V. Artificial Intelligence (AI) Applied in Civil Engineering. Appl. Sci. 2022, 12, 7595. [Google Scholar] [CrossRef]
  4. Lee, J.; Lee, S. Construction Site Safety Management: A Computer Vision and Deep Learning Approach. Sensors 2023, 23, 944. [Google Scholar] [CrossRef]
  5. Halder, S.; Afsari, K.; Serdakowski, J.; DeVito, S.; Ensafi, M.; Thabet, W. Real-Time and Remote Construction Progress Monitoring with a Quadruped Robot Using Augmented Reality. Buildings 2022, 12, 2027. [Google Scholar] [CrossRef]
  6. Fang, W.; Love, P.E.; Ding, L.; Xu, S.; Kong, T.; Li, H. Computer Vision and Deep Learning to Manage Safety in Construction: Matching Images of Unsafe Behavior and Semantic Rules. IEEE Trans. Eng. Manag. 2021, 9527760, 1–13. [Google Scholar] [CrossRef]
  7. Ercan, M.F.; Wang, R.B. Computer Vision-Based Inspection System for Worker Training in Build and Construction Industry. Computers 2022, 11, 100. [Google Scholar] [CrossRef]
  8. Harichandran, A.; Raphael, B.; Mukherjee, A. Equipment activity recognition and early fault detection in automated construction through a hybrid machine learning framework. Comput. Aided Civ. Infrastruct. Eng. 2023, 38, 253–268. [Google Scholar] [CrossRef]
  9. Lu, X.; Fei, J. Velocity tracking control of wheeled mobile robots by iterative learning control. Int. J. Adv. Robot. Syst. 2016, 13, 1. [Google Scholar] [CrossRef] [Green Version]
  10. Zhou, X.; Lei, X. Fault Diagnosis Method of the Construction Machinery Hydraulic System Based on Artificial Intelligence Dynamic Monitoring. Mob. Inf. Syst. 2021, 2021, 1093960. [Google Scholar] [CrossRef]
  11. Stel’makh, S.A.; Shcherban’, E.M.; Beskopylny, A.N.; Mailyan, L.R.; Meskhi, B.; Razveeva, I.; Kozhakin, A.; Beskopylny, N. Prediction of Mechanical Properties of Highly Functional Lightweight Fiber-Reinforced Concrete Based on Deep Neural Network and Ensemble Regression Trees Methods. Materials 2022, 15, 6740. [Google Scholar] [CrossRef]
  12. Beskopylny, A.N.; Stel’makh, S.A.; Shcherban’, E.M.; Mailyan, L.R.; Meskhi, B.; Razveeva, I.; Chernil’nik, A.; Beskopylny, N. Concrete Strength Prediction Using Machine Learning Methods CatBoost, k-Nearest Neighbors, Support Vector Regression. Appl. Sci. 2022, 12, 10864. [Google Scholar] [CrossRef]
  13. Chepurnenko, A.S.; Kondratieva, T.N.; Deberdeev, T.R.; Akopyan, V.F.; Avakov, A.A.; Chepurnenko, V.S. Prediction of Rheological Parameters of Polymers, Using Gradient Boosting Algorithm Catboost. Vse Mater. Entsiklopedicheskii Sprav. 2023, 6, 21–29. [Google Scholar] [CrossRef]
  14. Shi, M.; Shen, W. Automatic Modeling for Concrete Compressive Strength Prediction Using Auto-Sklearn. Buildings 2022, 12, 1406. [Google Scholar] [CrossRef]
  15. Matić, B.; Marinković, M.; Jovanović, S.; Sremac, S.; Stević, Ž. Intelligent Novel IMF D-SWARA—Rough MARCOS Algorithm for Selection Construction Machinery for Sustainable Construction of Road Infrastructure. Buildings 2022, 12, 1059. [Google Scholar] [CrossRef]
  16. Beskopylny, A.N.; Mailyan, L.R.; Stel’makh, S.A.; Shcherban’, E.M.; Razveeva, I.F.; Beskopylny, N.A.; Dotsenko, N.A.; El’shaeva, D.M. The Program for Determining the Mechanical Properties of Highly Functional Lightweight Fiber-Reinforced Concrete Based on Artificial Intelligence Methods. Russian Federation Computer Program 2022668999. 14 October 2022. Available online: https://www.fips.ru/registers-doc-view/fips_servlet?DB=EVM&DocNumber=2022668999&TypeFile=html (accessed on 14 June 2023).
  17. Rahman, A.U.; Saeed, M.; Mohammed, M.A.; Majumdar, A.; Thinnukool, O. Supplier Selection through Multicriteria Decision-Making Algorithmic Approach Based on Rough Approximation of Fuzzy Hypersoft Sets for Construction Project. Buildings 2022, 12, 940. [Google Scholar] [CrossRef]
  18. Anthony, B., Jr. A case-based reasoning recommender system for sustainable smart city development. AI Soc. 2021, 36, 159–183. [Google Scholar] [CrossRef]
  19. Zhao, S.; Kang, F.; Li, J. Non-Contact Crack Visual Measurement System Combining Improved U-Net Algorithm and Canny Edge Detection Method with Laser Rangefinder and Camera. Appl. Sci. 2022, 12, 10651. [Google Scholar] [CrossRef]
  20. Maslan, J.; Cicmanec, L. A System for the Automatic Detection and Evaluation of the Runway Surface Cracks Obtained by Unmanned Aerial Vehicle Imagery Using Deep Convolutional Neural Networks. Appl. Sci. 2023, 13, 6000. [Google Scholar] [CrossRef]
  21. Nogueira Diniz, J.d.C.; Paiva, A.C.d.; Junior, G.B.; de Almeida, J.D.S.; Silva, A.C.; Cunha, A.M.T.d.S.; Cunha, S.C.A.P.d.S. A Method for Detecting Pathologies in Concrete Structures Using Deep Neural Networks. Appl. Sci. 2023, 13, 5763. [Google Scholar] [CrossRef]
  22. Kim, J.-Y.; Park, M.-W.; Huynh, N.T.; Shim, C.; Park, J.-W. Detection and Length Measurement of Cracks Captured in Low Definitions Using Convolutional Neural Networks. Sensors 2023, 23, 3990. [Google Scholar] [CrossRef] [PubMed]
  23. Shokri, P.; Shahbazi, M.; Nielsen, J. Semantic Segmentation and 3D Reconstruction of Concrete Cracks. Remote Sens. 2022, 14, 5793. [Google Scholar] [CrossRef]
  24. Lee, T.; Kim, J.-H.; Lee, S.-J.; Ryu, S.-K.; Joo, B.-C. Improvement of Concrete Crack Segmentation Performance Using Stacking Ensemble Learning. Appl. Sci. 2023, 13, 2367. [Google Scholar] [CrossRef]
  25. An, Q.; Chen, X.; Wang, H.; Yang, H.; Yang, Y.; Huang, W.; Wang, L. Segmentation of Concrete Cracks by Using Fractal Dimension and UHK-Net. Fractal Fract. 2022, 6, 95. [Google Scholar] [CrossRef]
  26. Yu, C.; Du, J.; Li, M.; Li, Y.; Li, W. An improved U-Net model for concrete crack detection. Mach. Learn. Appl. 2022, 10, 100436. [Google Scholar] [CrossRef]
  27. Liu, Z.; Cao, Y.; Wang, Y.; Wang, W. Computer vision-based concrete crack detection using U-net fully convolutional networks. Autom. Constr. 2019, 104, 129–139. [Google Scholar] [CrossRef]
  28. Wang, C.; Han, Z.; Wang, Y.; Wang, C.; Wang, J.; Chen, S.; Hu, S. Fine Characterization Method of Concrete Internal Cracks Based on Borehole Optical Imaging. Appl. Sci. 2022, 12, 9080. [Google Scholar] [CrossRef]
  29. Ding, W.; Zhu, L.; Li, H.; Lei, M.; Yang, F.; Qin, J.; Li, A. Relationship between Concrete Hole Shape and Meso-Crack Evolution Based on Stereology Theory and CT Scan under Compression. Materials 2022, 15, 5640. [Google Scholar] [CrossRef]
  30. Zhou, S.; Pan, Y.; Huang, X.; Yang, D.; Ding, Y.; Duan, R. Crack Texture Feature Identification of Fiber Reinforced Concrete Based on Deep Learning. Materials 2022, 15, 3940. [Google Scholar] [CrossRef]
  31. Arbaoui, A.; Ouahabi, A.; Jacques, S.; Hamiane, M. Concrete Cracks Detection and Monitoring Using Deep Learning-Based Multiresolution Analysis. Electronics 2021, 10, 1772. [Google Scholar] [CrossRef]
  32. Beskopylny, A.; Lyapin, A.; Anysz, H.; Meskhi, B.; Veremeenko, A.; Mozgovoy, A. Artificial Neural Networks in Classification of Steel Grades Based on Non-Destructive Tests. Materials 2020, 13, 2445. [Google Scholar] [CrossRef] [PubMed]
  33. Climent, M.-Á.; Miró, M.; Eiras, J.-N.; Poveda, P.; de Vera, G.; Segovia, E.-G.; Ramis, J. Early Detection of Corrosion-Induced Concrete Micro-cracking by Using Nonlinear Ultrasonic Techniques: Possible Influence of Mass Transport Processes. Corros. Mater. Degrad. 2022, 3, 235–257. [Google Scholar] [CrossRef]
  34. Chen, B.; Zhang, H.; Wang, G.; Huo, J.; Li, Y.; Li, L. Automatic concrete infrastructure crack semantic segmentation using deep learning. Autom. Constr. 2023, 152, 104950. [Google Scholar] [CrossRef]
  35. Bae, H.; An, Y.-K. Computer vision-based statistical crack quantification for concrete structures. Measurement 2023, 211, 112632. [Google Scholar] [CrossRef]
  36. Qu, S.; Hilloulin, B.; Saliba, J.; Sbartaï, M.; Abraham, O.; Tournat, V. Imaging concrete cracks using Nonlinear Coda Wave Interferometry (INCWI). Constr. Build. Mater. 2023, 391, 131772. [Google Scholar] [CrossRef]
  37. Mir, B.A.; Sasaki, T.; Nakao, K.; Nagae, K.; Nakada, K.; Mitani, M.; Tsukada, T.; Osada, N.; Terabayashi, K.; Jindai, M. Machine learning-based evaluation of the damage caused by cracks on concrete structures. Precis. Eng. 2022, 76, 314–327. [Google Scholar] [CrossRef]
  38. Gehri, N.; Mata-Falcón, J.; Kaufmann, W. Refined extraction of crack characteristics in large-scale concrete experiments based on digital image correlation. Eng. Struct. 2022, 251, 113486. [Google Scholar] [CrossRef]
  39. Golding, V.P.; Gharineiat, Z.; Munawar, H.S.; Ullah, F. Crack Detection in Concrete Structures Using Deep Learning. Sustainability 2022, 14, 8117. [Google Scholar] [CrossRef]
  40. Islam, M.M.M.; Kim, J.-M. Vision-Based Autonomous Crack Detection of Concrete Structures Using a Fully Convolutional Encoder–Decoder Network. Sensors 2019, 19, 4251. [Google Scholar] [CrossRef] [Green Version]
  41. Noori Hoshyar, A.; Rashidi, M.; Liyanapathirana, R.; Samali, B. Algorithm Development for the Non-Destructive Testing of Structural Damage. Appl. Sci. 2019, 9, 2810. [Google Scholar] [CrossRef] [Green Version]
  42. Han, X.; Zhao, Z.; Chen, L.; Hu, X.; Tian, Y.; Zhai, C.; Wang, L.; Huang, X. Structural damage-causing concrete cracking detection based on a deep-learning method. Constr. Build. Mater. 2022, 337, 127562. [Google Scholar] [CrossRef]
  43. Xiang, C.; Wang, W.; Deng, L.; Shi, P.; Kong, X. Crack detection algorithm for concrete structures based on super-resolution reconstruction and segmentation network. Autom. Constr. 2022, 140, 104346. [Google Scholar] [CrossRef]
  44. Park, S.E.; Eem, S.-H.; Jeon, H. Concrete crack detection and quantification using deep learning and structured light. Constr. Build. Mater. 2020, 252, 119096. [Google Scholar] [CrossRef]
  45. Beskopylny, A.N.; Stel’makh, S.A.; Shcherban’, E.M.; Razveeva, I.F.; Kozhakin, A.N.; Beskopylny, N.A.; Onore, G.S. Image Augmentation Program. Russian Federation Computer Program 2022685192. 21 December 2022. Available online: https://www.fips.ru/registers-doc-view/fips_servlet?DB=EVM&DocNumber=2022685192&TypeFile=html (accessed on 14 June 2023).
  46. de León, G.; Fiorentini, N.; Leandri, P.; Losa, M. A New Region-Based Minimal Path Selection Algorithm for Crack Detection and Ground Truth Labeling Exploiting Gabor Filters. Remote Sens. 2023, 15, 2722. [Google Scholar] [CrossRef]
  47. GOST R 58894-2020; Silica Fume for Concretes and Mortars. Specifications. Standartinform: Moscow, Russia, 2021. Available online: https://docs.cntd.ru/document/1200173805 (accessed on 16 June 2023).
  48. BS EN 13263-1:2005+A1:2009; Silica Fume for Concrete—Part 1: Definitions, Requirements and Conformity Criteria. European Standards: Plzen, Czech, 2010. Available online: https://www.en-standard.eu/bs-en-13263-1-2005-a1-2009-silica-fume-for-concrete-definitions-requirements-and-conformity-criteria/ (accessed on 16 June 2023).
  49. BS EN 934-2:2009+A1:2012; Admixtures for Concrete, Mortar and Grout—Part 2: Concrete Admixtures—Definitions, Requirements, Conformity, Marking and Labeling. European Standards: Plzen, Czech, 2012. Available online: https://www.en-standard.eu/bs-en-934-2-2009-a1-2012-admixtures-for-concrete-mortar-and-grout-concrete-admixtures-definitions-requirements-conformity-marking-and-labelling/ (accessed on 16 June 2023).
  50. ASTM C 1240-20; Standard Specification for Silica Fume Used in Cementitious Mixtures. ASTM International: West Conshohocken, PA, USA, 2020. Available online: https://www.astm.org/c1240-20.html (accessed on 16 June 2023).
  51. MSZ EN 196-3:2017; Methods of Testing Cement—Part 3: Determination of Setting Times and Soundness. Slovenian Institute for Standardization: Ljubljana, Slovenian, 2017. Available online: https://docs.cntd.ru/document/554094953 (accessed on 28 July 2023).
  52. Shcherban’, E.M.; Stel’makh, S.A.; Beskopylny, A.; Mailyan, L.R.; Meskhi, B.; Varavka, V. Nanomodification of Lightweight Fiber Reinforced Concrete with Micro Silica and Its Influence on the Constructive Quality Coefficient. Materials 2021, 14, 7347. [Google Scholar] [CrossRef]
  53. He, K.; Zhang, X.; Ren, S.; Sun, J. Deep Residual Learning for Image Recognition. arXiv 2015, arXiv:1512.03385. [Google Scholar]
  54. Beskopylny, A.N.; Shcherban’, E.M.; Stel’makh, S.A.; Mailyan, L.R.; Meskhi, B.; Razveeva, I.; Kozhakin, A.; El’shaeva, D.; Beskopylny, N.; Onore, G. Detecting Cracks in Aerated Concrete Samples Using a Convolutional Neural Network. Appl. Sci. 2023, 13, 1904. [Google Scholar] [CrossRef]
  55. Beskopylny, A.N.; Shcherban’, E.M.; Stel’makh, S.A.; Mailyan, L.R.; Meskhi, B.; Razveeva, I.; Kozhakin, A.; El’shaeva, D.; Beskopylny, N.; Onore, G. Discovery and Classification of Defects on Facing Brick Specimens Using a Convolutional Neural Network. Appl. Sci. 2023, 13, 5413. [Google Scholar] [CrossRef]
  56. Kingma, D.P.; Ba, J. Adam: A Method for Stochastic Optimization. arXiv 2017, arXiv:1412.6980. [Google Scholar]
  57. Li, J.; Lu, X.; Zhang, P.; Li, Q. Intelligent Detection Method for Concrete Dam Surface Cracks Based on Two-Stage Transfer Learning. Water 2023, 15, 2082. [Google Scholar] [CrossRef]
Figure 1. Crack in hardened cement paste.
Jcs 07 00327 g001
Figure 2. U-Net architecture.
Jcs 07 00327 g002
Figure 3. Annotated image: 1, 2, 3, 4—sequence numbers of cracks (assigned to them automatically when marking).
Jcs 07 00327 g003
Figure 4. Graph of model training on the training set.
Jcs 07 00327 g004
Figure 5. Model training schedule on the validation set.
Jcs 07 00327 g005
Figure 6. Results of the detector operation: (a,b) original image; (c,d) the result of model 1; (e,f) result of model 2; 1, 2, 3, 4—sequence numbers of cracks (assigned to them automatically when marking); red—area of defects in the form of cracks, green—crack-free microstructure area.
Jcs 07 00327 g006aJcs 07 00327 g006b
Figure 7. Dependence of the change in compressive strength on the proportion of cracks in the photographs of the microstructure of the samples: 1—control; 2—control + GF; 3—control + GF + MS.
Jcs 07 00327 g007
Table 1. Characteristics of Portland cement.
PropertyValue
Physics and Mechanics
Compressive strength at the age of 28 days (MPa)55.5
Setting times (min)
start140
end260
Specific surface area (m2/kg)338
Soundness (mm)0.5
Fineness, passage through a sieve No 008 (%)98.1
Chemical
C3S (alite)66
C2S (belite)15
C3A (tricalcium aluminate)7
C4AF (tetracalcium aluminoferrite)12
Table 2. Chemical composition of microsilica.
Material Oxide Content (%)
SiO2Al2O3Fe2O3CaOMgONa2OK2OSO3Loss on Ignition
MS-8583.51.61.01.30.80.61.23.16.9
Table 3. Characteristics of fiberglass.
Tensile Strength (MPa)Fiber Diameter (µm)Fiber Length (mm)Modulus of Elasticity (GPa)Density (kg/m3)Elongation to Break (%)
310013127226004.6
Table 4. Parameters for training the U-Net convolutional neural network.
NumParameterValue
Model 1Model 2
1Number of images in the training set200700 (70%)
2Number of images in the validation set54200 (20%)
3Number of images in the test set100100 (10%)
4BatchSize1010
5Number of epochs300300
6Number of iterations600021,000
7Learning rate10−410−4
8Overfitting detectorearly stoppingearly stopping
9SolverAdamAdam
Table 5. Quality metrics for models based on the U-Net convolutional neural network.
ModelPrecisionRecallF1IoUDice
Mean value for the test sample for model 10.650.750.660.510.66
Mean value for the test sample for model 20.650.80.670.530.68
Table 6. Comparison of strength and cracks of specimens.
Sample ModificationCrack Area (%)Compressive Strength (MPa)
Control8.322.5
Control + GF4.925.2
Control + MS + GF2.228.8
Disclaimer/Publisher’s Note: The statements, opinions and data contained in all publications are solely those of the individual author(s) and contributor(s) and not of MDPI and/or the editor(s). MDPI and/or the editor(s) disclaim responsibility for any injury to people or property resulting from any ideas, methods, instructions or products referred to in the content.

