Article

Multicaloric Effect in 0–3-Type MnAs/PMN–PT Composites

by
Abdulkarim A. Amirov
1,*,
Alexander S. Anokhin
2,
Mikhail V. Talanov
3,
Vladimir V. Sokolovskiy
4,5,
Magzhan. K. Kutzhanov
5,
Houbing Huang
6,
Larisa A. Reznichenko
7,
Andrey V. Es’kov
2 and
Akhmed M. Aliev
1
1
Amirkhanov Institute of Physics, Dagestan Scientific Center of Russian Academy of Sciences, 367003 Makhachkala, Russia
2
International Laboratory “Materials and Structures for Electro- and Magnetocaloric Energy Conversion”, ITMO University, 197101 St. Petersburg, Russia
3
Laboratory of Terahertz Spectroscopy, Moscow Institute of Physics and Technology, 141701 Dolgoprudny, Russia
4
Department of Physics, Chelyabinsk State University, 454001 Chelyabinsk, Russia
5
Research Laboratory of Inorganic Nanomaterials, National University of Science and Technology “MISIS”, 119049 Moscow, Russia
6
School of Materials Science and Engineering, Advanced Research Institute of Multidisciplinary Science, Beijing Institute of Technology, 100081 Beijing, China
7
Research Institute of Physics, Southern Federal University, 344090 Rostov-on-Don, Russia
*
Author to whom correspondence should be addressed.
J. Compos. Sci. 2023, 7(9), 400; https://doi.org/10.3390/jcs7090400
Submission received: 10 August 2023 / Revised: 6 September 2023 / Accepted: 12 September 2023 / Published: 20 September 2023
(This article belongs to the Special Issue Multiferroic Composite Structures)

Abstract

:
The new xMnAs/(1 − x)PMN–PT (x = 0.2, 0.3) multicaloric composites, consisting of the modified PMN–PT-based relaxor-type ferroelectric ceramics and ferromagnetic compound of MnAs were fabricated, and their structure, magnetic, dielectric properties, and caloric effects were studied. Both components of the multicaloric composite have phase transition temperatures around 315 K, and large electrocaloric (~0.27 K at 20 kV/cm) and magnetocaloric (~13 K at 5 T) effects around this temperature were observed. As expected, composite samples exhibit a decrease in magnetocaloric effect (<1.4 K at 4 T) in comparison with an initial MnAs magnetic component (6.7 K at 4 T), but some interesting phenomena associated with magnetoelectric interaction between ferromagnetic and ferroelectric components were observed. Thus, a composite with x = 0.2 exhibits a double maximum in isothermal magnetic entropy changes, while a composite with x = 0.3 demonstrates behavior more similar to MnAs. Based on the results of experiments, the model of the multicaloric effect in an MnAs/PMN–PT composite was developed and different scenario observations of multicaloric response were modeled. In the framework of the proposed model, it was shown that boosting of caloric effect could be achieved by (1) compilation of ferromagnetic and ferroelectric components with large caloric effects in selected mass ratio and phase transition temperature; and (2) choosing of magnetic and electric field coapplying protocol. The 0.3MnAs/0.7PMN–PT composite was concluded to be the optimal multicaloric composite and a phase shift ∆φ = −π/4 between applied manetic fields can provide a synergetic caloric effect at a working point of 316 K.

1. Introduction

Recently, new materials exhibiting giant caloric effects of various nature have been actively investigated, due to their prospective applications as energy-efficient and environmentally friendly cooling systems based on solid-state cooling technologies [1,2,3,4,5,6,7,8]. In these materials, known as caloric, the adiabatic temperature change (ΔTAD) (isothermal entropy change (ΔS) is observed at applied external stimuli (magnetic field, electric field, mechanical (uniaxial, isotropic) load). These phenomena refer to the single caloric effects and are known as magnetocaloric (MCE), electrocaloric (ECE), and mechanocaloric (MechCE) effects, which have potential applications in solid-state cooling technologies. The novel concept based on the coexistence of caloric effects was recently proposed, and phenomena concluded in the observation of combined caloric effects with different external stimuli were noted as multicaloric [9,10,11,12]. Materials that exhibit more than two caloric effects are named multicalorics, and are actively studied as advanced objects for energy applications and straintronics [13,14]. From another point of view, it is well known that multiferroics materials coexistence with various types of ferro (magnetic, electric, elastics) ordering [15,16]. Thus, multicalorics can be classified as multiferroics and generally can be divided into natural and composite. The prospects for applications of composite technologies in the design of multicaloric materials with magnetoelectric (ME) coupling were discussed and the approaches based on composite technologies were proposed as possible ways to control caloric effects [17,18,19,20].
A frontal idea proposed in our work is aimed at the design of multicaloric composites, which consist of two phases: ferroelectric (FE) and ferromagnetic (FM) components with large caloric performance. As the simplest model object of multicaloric material, the ME composite with a 0–3-type connection scheme can be used (Figure 1). A multicaloric composite with a 0–3-type connection consists of FM microparticles with large MCE embedded in an FE matrix of material with large ECE. FM microparticles have random shapes and are randomly distributed in the FE matrix. In the proposed model, both FM and FE components have phase transition (PT) temperatures in the same temperature range.
This research is devoted to the design, fabrication, and study of caloric effects in the proposed 0–3 type of multicaloric composite. The cross-caloric effects due to the ME coupling between FM and FE at PT temperatures are expected. An FM with giant MCE as FM component and a modified solid solution of PMN–PT ferroelectric ceramic with PT near room temperature was proposed for the design and study of a new 0–3-type multicaloric composite.

2. Experimental Details

The 0–3-type multiferroic composites (x)MnAs/(1 − x)PMN–PT (x = 0.2; 0.3), consisting of the modified PMN–PT relaxor-type ferroelectric ceramics with formula Pb(1 − z)Baz(Mg1/3Nb2/3)m(Zn1/3Nb2/3)y(Ni1/3Nb2/3)nTixO3 (z = 0.10, m = 0.4541, y = 0.0982, n = 0.1477, x = 0.3), and ferromagnetic compound of MnAs, were fabricated by a cold-pressing method of powders in selected mass ratio. For this procedure, powders of FE and FM components were milled, sieved, and mixed in a selected ratio for 4 h. Then, the obtained final powder was pressed under 3 GPa hydrostatic pressure at room temperature with an exposure time of 12 h.
The FE component of composite Pb0.9Ba0.1(Mg1/3Nb2/3)0.4541(Zn1/3Nb2/3)0.0982(Ni1/3Nb2/3)0.1477Ti0.3O3 was prepared by conventional solid-state synthesis using a columbite precursor route [21]. The choice of this composition is due to the desire to combine low temperature (close to room temperature) of transition into the ferroelectric state with high piezoelectric parameters [22]. Synthesis of the columbite-like compositions MgNb2O6, NiNb2O6, and ZnNb2O6 from the oxides MgO, NiO, ZnO, and Nb2O5 included two stages: ZnNb2O6 and MgNb2O6 were synthesized at temperatures of T1 = 1273 K and T2 = 1373 K for 6 and 4 h, respectively; for NiNb2O6, the synthesis temperatures were T1 = 1273 K and T2 = 1513 K for 6 and 2 h, respectively. Solid solutions of the final composition were produced by single-phase synthesis of the columbite compositions that had been obtained earlier and also by the synthesis of PbO, TiO2, and BaCO3 at T = 1223 K for 4 h. Sintering was carried out using conventional ceramic technology at a temperature of 1453 K. X-ray diffraction analysis confirmed the absence of traces of impurity phases on the XRD patterns [22]. The relative density of the sintered ceramics was ~95% of the theoretical value.
The FM component of composite manganese monoarsenide MnAs was synthesized by directly melting a stoichiometric mixture of high-purity arsenic and manganese (total content of impurities, ≤10−4 wt.%) in graphitized silica ampules [23,24,25].
Both components have the temperature of FE and FM phase transition (PT) around room temperature and this was the reason why these components were selected as components of the designed composite [22,26]. In total, for further studies, two samples used as pristine FE and FM components of composite and two samples of multicaloric composites with 20 wt.% (0.2MnAs/0.8PMN–PT) and 30 wt.% (0.3MnAs/0.7PMN–PT) of FM component were selected.
The chemical composition and the microstructure of the samples were examined using a JSM F7600 scanning electron microscope (SEM) (JEOL Ltd., Akishima, Japan) equipped with an X-max energy dispersive spectroscopy (EDS) detector (Oxford Instruments, Abingdon, UK). The structure was characterized by X-ray diffraction (XRD) using Cu Kα radiation at room temperature.
The magnetic measurements were carried out using the VSM technique (LakeShore 7400). The MCE was measured by direct method on a homemade setup using a superconducting 8 T magnetic field source [27]. The adiabatic temperature change of the sample in a varying magnetic field was measured using a differential thermocouple (type T), fabricated by electric welding of the flattened to plate with a thickness of 3 μm copper and constantan wires (Ø 25 μm). The thermocouple signal that passed through the SR554 transformer preamplifier was measured by the SR830 Lock-in. A cryogen-free superconducting magnet system with a maximum field of 8 T served as a source of the magnetic field. The heating rate of the samples in MCE experiments was about 1 K/min.
The ECE effect was measured using the direct method as adiabatic temperature change ∆TADECE under varied electric fields. The control of the initial temperature during measurements was carried out using a liquid thermostat Julabo FP32-ME. The electric field on the sample was applied using a high-voltage amplifier Trek 609E-6 and a pulse generator Agilent 33522A. The temperature change due to the ECE was measured by the contact method using a platinum thermistor connected to a nanovoltmeter Agilent 34420A. Rectangular voltage pulses with a duty cycle of 50% were applied to the sample. The duration of the pulse period was twice as long as the thermal relaxation time of the sample and was 120 seconds. The experimental setup and measurement procedure are described elsewhere [28,29]. Polarization hysteresis P(E) measurements were carried out using the Sawyer–Tower method in a quasistatic mode.
Dielectric measurements were performed using test stands fitted with an Agilent E4980A LCR meter (at temperatures ranging from 298 to 873 K) and a Wayne Kerr 6500B impedance analyzer (in the temperature interval of 10–325 K) [22]. For dielectric measurements, a disk-shaped sample with a diameter of 10 mm and a thickness of 1 mm was formed. Electric contacts were made by deposition of Ag paste with further curing. The small-signal piezoelectric coefficient d33 was measured using a Berlincourt-type d33 meter APC YE2730A. The main electrophysical parameters (dielectric constant of polarized samples, ε33T, the dielectric loss tangent, tan δ, the planar electromechanical coupling coefficient, Kp, the mechanical quality factor, Qm, the sound velocity, VE1, and Young’s modulus, YE11) were determined on polarized samples (polarized at E = 30 kV/cm) by the resonance–antiresonance method using an impedance analyzer (Wayne Kerr 6500B).

3. Results and Discussion

The normalized XRD patterns of the fabricated composites (x)MnAs/(1 − x)PMN–PT (x = 0.2; 0.3) and their initial FM and FE components of MnAs and modified PMN–PT at room temperature are shown in Figure 2. Observed XRD spectra for initial components confirm the hexagonal NiAs-type structure for MnAs and pseudocubic for Pb0.9Ba0.1(Mg1/3Nb2/3)0.45(Zn1/3Nb2/3)0.098(Ni1/3Nb2/3)0.14Ti0.3O3, which is in agreement with data from the literature [22,30]. The composite fabrication process does not lead to the appearance of the impurity phases and, as seen, only intensity peaks corresponding to the FM (MnAs) and FE (PMN–PT) components of composites are observed. Some intensity peaks for MnAs and PMN–PT overlapped, and a reduction of unique for MnAs intensity peaks in composite samples was observed.
The SEM images of the fabricated composites (x)MnAs–(1 − x)PMN–PT (x = 0.2; 0.3) and their initial FM and FE components of MnAs and modified PMN–PT are shown in Figure 3.
Both 0.2MnAs/0.8PMN–PT and 0.3MnAs/0.7PMN–PT samples have a composite microstructure, and agglomerates of MnAs microparticles (some big agglomerates in Figure 3c,d are circled in red) dispersed in PMN–PT matrix are observed. All inclusions of MnAs particle agglomerates have random shapes and the increase in the concentration of MnAs is observed on SEM images of 0.2MnAs/0.8PMN–PT and 0.3MnAs/0.7PMN–PT samples. Figure 4 shows the temperature dependence of the dielectric constant (ε) of the studied pristine FE sample of modified PMN–PT ceramics, measured at various frequencies (f) of an AC electric field on cooling. It is seen that the ε(T) behavior is typical of relaxor ferroelectrics: temperature of the dielectric maximum (Tm) shifts towards high temperature with increasing f and its shape is smoothed.
The frequency dependence of Tm for the ceramics studied is well described by the empirical Vogel–Fulcher law:
f = f0 exp[−Ea/k(Tm − TVF)]
where (for classical relaxors like PbMg1/3Nb2/3O3) f0 is the frequency of attempts to overcome the potential barrier, Ea is the activation energy, k is the Boltzmann constant, and TVF corresponds to the freezing temperature of the dipole dynamics and the transition from ergodic to nonergodic relaxor state. For the studied ceramic, TVF = 293 K, which means that it is in an intermediate state between the ergodic relaxor and nonergodic (or ferroelectric) at room temperature.
In addition, other features of relaxor ferroelectrics are observed. In particular, the parameter Δ (Δ = Tm2 − Tm1, where Tm1, Tm2, the temperatures of the maxima of ε(T) dependence obtained at f1 = 1 kHz and f2 = 100 kHz) is large enough (9 K). Also, the diffuseness parameters of the ε(T) dependence take the typical values for relaxor ferroelectrics: δ = 52.2 K and γ = 1.75 (this parameter ranges from 1 for normal ferroelectrics to 2 for ideal relaxor ferroelectrics [31]). The Burns temperature (TB) was determined from the deviation of the ε(T) dependence from the Curie–Weiss law during cooling and amounted to about 555 K. This is more than 200 K higher than Tm, which is also characteristic of relaxor ferroelectrics (like PbMg1/3Nb2/3O3) [32]. All of the above allows us to attribute the investigated solid section to the relaxor ferroelectrics.
At sufficiently large values of the external electric field, the ferroelectric state can be stabilized. The measured electrophysical (dielectric constant of polarized samples ε33T, the dielectric loss tangent, tan δ, the planar electromechanical coupling coefficient Kp, the mechanical quality factor Qm, the sound velocity, VE1, Young’s modulus YE11) and piezoelectric (piezoelectric coefficient d33) parameters are collected in Table 1. Table 1 shows that the sample is characterized by relatively high values of dielectric (ε and ε33T > 10,000) and mechanical (Qm > 350) parameters while maintaining the average values of the piezoelectric coefficients. The listed features, as well as high dielectric and electromechanical responses to external electric fields, allow us to consider the studied composition as a component of a magnetoelectric composite.
The normalized magnetization M/Ms (Ms—magnetization in 1 T at 300 K) curves as a function of temperature at 1 T magnetic fields for pristine MnAs and its composites in heating protocol are shown in Figure 5. As seen from the graphs, by increasing the temperature, an abrupt decrement of the magnetization is observed in the 310–320 K temperature region. This behavior corresponds to the first-order magnetic phase transition (FOMPT) from ferromagnetic to paramagnetic and is accompanied by a structural transition from hexagonal NiAs-type to an orthorhombic MnP-type structure (α (B81) → β (B31)). The FOMPT temperature for MnAs at the selected magnetic field is in agreement with the data from the literature [26,33].
With increasing of the applied magnetic field, the FOMPT temperature shifts toward a high-temperature region. In MnAs, a magnetic field shifts the transition toward high temperatures with the rate of dTt0dH = ~3.3 K/T according to the reported data [33,34]. As seen from Figure 4a, for both composites, the FOMPT temperatures (~313 K for x = 0.3 and ~316.5 K for x = 0.3) are shifted to high-temperature regions in comparison with pristine MnAs (~312 K). The transition temperatures were estimated from M(T) curves by calculation of their temperature derivative dM/dT. M(T) dependence for 0.3MnAs/0.7PMN–PT looks more like MnAs, while a more broadened transition is observed for the 0.2MnAs/0.8PMN–PT sample. As is known, the MnAs are very pressure-sensitive and the effect of pressure on FOMPT temperature detail was studied by Goodenough and Kafalas [35]. They found that increasing pressure decreases the FOMPT temperature of MnAs with a rate dTt/dp~−9 K/kbar (p is changed from 0.001 kbar to 1.12 kbar). In our case, we do not observe the effect typical of applying isotropic pressure, which can be induced as a result of intergranular mechanical stresses forced on the FM component from the FE matrix. Moreover, both FM and FE components have PT temperatures around the same temperature, where maximal volume changes are typical, and it is complicated to explain the total pressure effect as a result of FM and PM phase interaction. Broadening of FOMPT and some shifting of transition temperature to the high-temperature region may be related to intergranular mechanical interactions between FM and FE microparticles when the matrix of FE particles inhibits the FOMPT.
Figure 6 shows the magnetization isotherms used to estimate the MCE by indirect method for pristine MnAs (a) and composite 0.2MnAs/0.8PMN–PT (b), 0.3MnAs/0.7PMN–PT (c) samples. To estimate indirectly MCE, the well-known Maxwell relation μ0(M/T)H = (∂S/∂H)T was used, which yields the formula for magnetic entropy change ΔSm at applied field change from 0 to H:
Δ S m = μ 0 0 H M T d H
For this purpose, the series of isothermal magnetization curves M(μ0H) at different temperatures in the interval from 296 to 330 K were measured. ∆Sm was calculated using the numerical approximation in Equation (3). To define the integral, the trapezoidal rule was considered, while the numerical derivative was performed assuming the two-point method according to Equation (2):
Δ S m T i + 1   + T i   2 , H j m a x = μ 0 j = 1 j m a x M T i + 1   ,   H j M T i   ,   H j T i + 1 + T i   H j + 1 H j
Figure 6. Magnetization isotherms of (x)MnAs/(1 − x)PMN–PT (x = 0.2; 0.3) composites (b,c) and their initial magnetic component MnAs (a) in the 300–330 K temperature interval.
Jcs 07 00400 g006aJcs 07 00400 g006b
The temperature dependences of the isothermal magnetic entropy change ∆Sm, calculated from the Maxwell relations, are shown in Figure 7. For all samples, as expected, a maximum of ∆Sm is observed in the region of the magnetic phase transition temperature of MnAs. The maximum value of the ∆Sm for pristine MnAs is about ~10.8 J kg−1K−1 (1 T); large ∆Sm~25 J kg−1K−1 (2 T) were reported elsewhere [36]. For composite samples, the maximum values of ∆Sm decrease significantly to ~0.12 J kg−1K−1 for 0.2MnAs/0.8PMN–PT and ~1.56 J kg−1K−1 for the 0.3MnAs/0.7PMN–PT. It is related to the mass ratio of MnAs, which responded to MCE, while the FE component of the composite is nonmagnetic and does not directly contribute to the MCE. The largest changes in ∆Sm maximum at ∆μ0H = 5 T from 47 J kg−1K−1 under 0 kbar to 267 J kg−1K−1 under 2.23 kbar applied hydrostatic pressure were observed by S. Gama et al. [37].
The temperature dependence of the magnetic entropy changes ∆Sm for the 0.2MnAs/0.8PMN–PT composite sample shows two broad maxima: the first in the region of 306 K, and the second in the region of 320 K. The larger maximum is associated with the magnetic phase transition of MnAs, which is shifted towards a high-temperature region compared with a pristine MnAs sample. The nature of small maximum may be related to the intergranular interaction of the FM and FE components of the composite, which can be considered as a multicaloric response as a result of the combination of external stimuli of different natures (magnetic and mechanical).
Figure 8 shows the temperature dependences of the adiabatic temperature changes ∆TADMCE at different applied magnetic fields for pristine MnAs samples and both composites. As expected, the largest value of MCE is observed in pristine MnAs (Figure 8c), and reaches ∆TADMCE = 13.06 K at a field change of 5 T, which is in agreement with the data from the literature [36]. For all samples, the behavior remains typical for materials with magnetostructural phase transitions, and a maximum of ∆TMCE is observed around FOMPT temperature. With the field increasing, the area of the MCE extends only toward high temperatures. In the field of 3 T, there is a sharp increase in the value of MCE, which can be explained by the fact that, in addition to changing the magnetic entropy, there is an additional mechanism that contributes to the total MCE. It can be assumed that in this case, that is due to a structural transition from the orthorhombic structure of the MnP type to the low-temperature hexagonal structure of the NiAs type, which is accompanied by a sharp change in the volume of the crystal lattice.
It is worth paying attention to the fact that the magnitudes of the ∆TADMCE shows unusual behavior for composites: for 0.2MnAs/0.8PMN–PT and 0.3MnAs/0.7PMN–PT samples at 1 T the magnitudes of the MCE are approximately the same (~0.4 K), then with increasing of the magnetic field there is an increase in the gap in the magnitude of the MCE in favor of 0.2MnAs/0.8PMN–PT, although this sample contains a smaller amount of magnetic phase than 0.3MnAs/0.7PMN–PT. This behavior may be associated with intergranular mechanical interactions between the FM and FE phases, which are most pronounced in the region of the phase transition temperature and in strong magnetic fields, including an additional contribution to the interaction mechanisms.

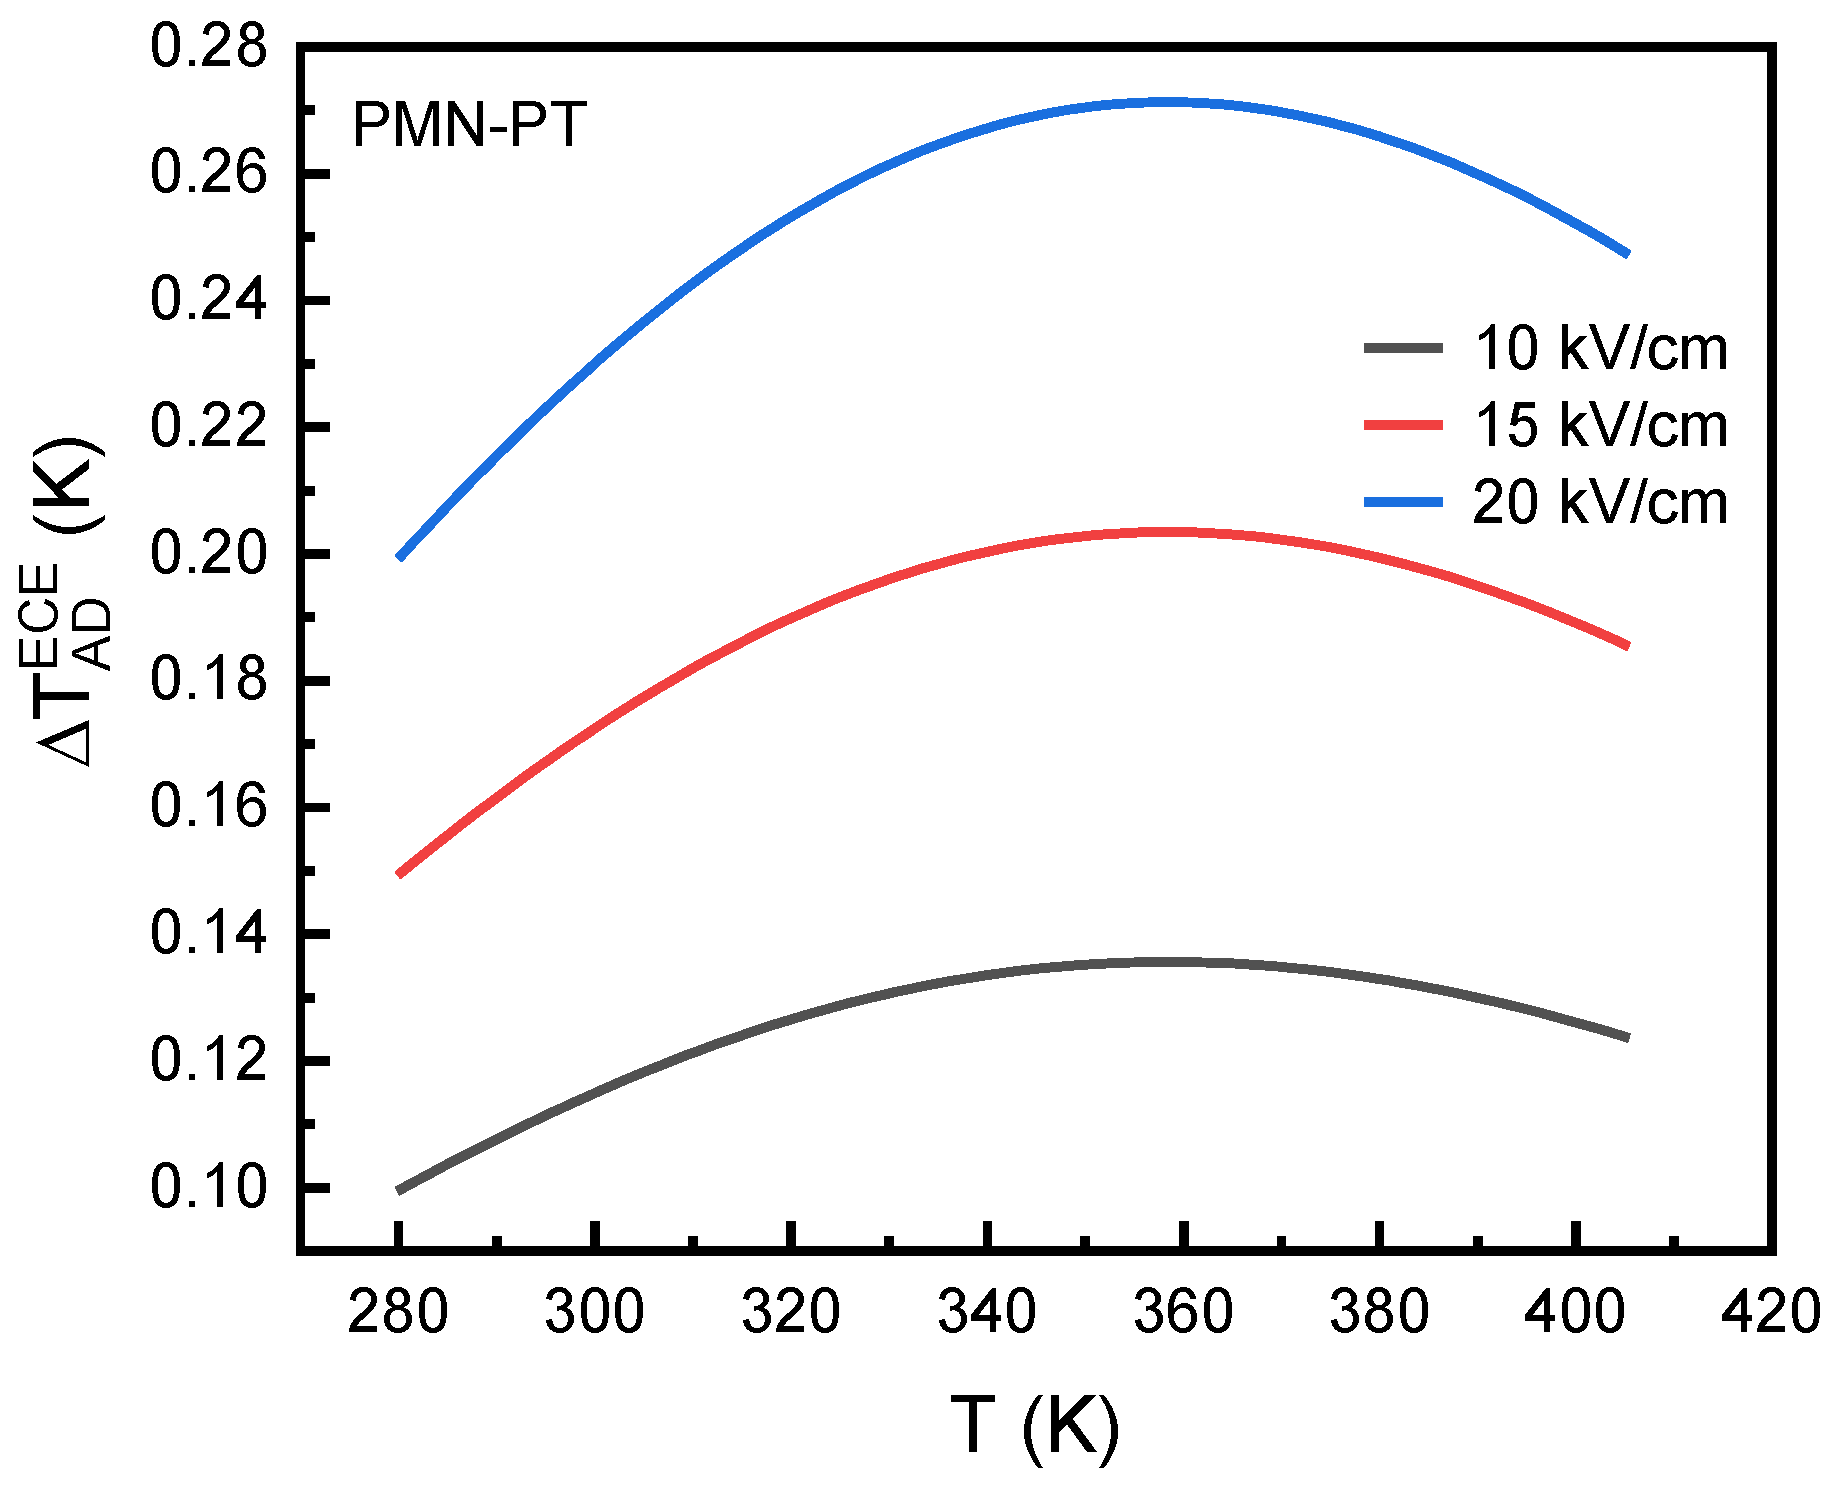
3.1. Electrocaloric Effect

The P(E) hysteresis loops measured at different temperatures for the pristine FE component are shown in Figure 9a. Due to high leakage currents and problems with the stabilization of temperature, the P(E) measurements for composite samples failed. As seen from Figure 9, the P(E) hysteresis loops have a slim shape typical of relaxor ferroelectrics. Both the remnant polarization and coercive field are gradually decreased when temperature rises (T > TVF). The temperature dependences of polarization at different electric fields are demonstrated as the behavior typical for relaxor-type ferroelectrics (Figure 9b).
Figure 10 shows the temperature dependencies of the adiabatic temperature changes ∆TADFE at different applied electric fields for the pristine FE component of the modified PMN–PT ceramic. As seen, ∆TADFE(T) shows a broad maximum around Tm and the maximum of the effect becomes more noticeable at ~0.27 K with an increase in the applied electric field up to 20 kV/cm. Observed temperature dependencies of ∆TADFE(T) and values of ∆TADFE are comparable with relaxor ferroelectric (1 − x)Pb(Mg 1/3Nb2/3)O3–xPbTiO3 solid-solution systems [38]. These systems are one of the promising electrocaloric materials with large ECE in room-temperature regions [39,40,41]. As a magnetic material with FOMPT, the ferroelectric relaxor solid solution also has a sensitivity to mechanical stress [42]. Therefore, in the case of our 0–3 multicaloric composite, the reverse scenario can be observed when stress-mediated tuning of ECE as a result of magnetostriction or anomalous volume changes around the FOMPT temperature are observed.
Due to the leakage currents and Joule heating, it was complicated to provide stable and correct measurements of the direct ECE in composite samples in the full 280–400 K temperature range. Moreover, high electric fields increase the risk of the electrical breakdown of the composite samples. Test measurements of the ∆TADFE around 340 K for the 0.2MnAs/0.8PMN–PT sample show the value to be ~0.1 K.

3.2. Model of Multicaloric Effect

In a thermodynamic cycle based on a multicaloric effect (multiCE), two general scenarios for the application of external stimuli can be used: (1) simultaneous and (2) sequential. The central goal of the simultaneous application of external stimuli is to obtain a synergistic effect in which there is an increase in the total caloric effect due to its occurrence in each of the subsystems. However, in practice, the implementation of this scenario is problematic both from the point of view of the experimental setup and the choice of a material with suitable phase transition temperatures. Sequential application of external fields is used to improve the efficiency of systems based on the ordinary caloric effect in which the second field plays an assisted role. For example, the possibility of using a sequential application of a magnetic field and uniaxial compression to minimize the negative consequences of hysteresis effects was demonstrated in the example of Heulser alloys [12,43]. The concept proposed in our work is based on the design of a multicaloric composite material with magnetic and ferroelectric phase transitions close to each other, which is suitable for both scenarios of application of external fields. In the proposed model, we consider the dynamics of the multiCE, when a time-resolved adiabatic temperature change is observed as a result of applying magnetic and electric fields. In our model, we consider MCE as a primary caloric effect, while ECE plays an assisted role. The mechanical interactions between phases are problematic for modeling in multicaloric composites and require the measurement of ME coefficients [44,45,46]. Moreover, ME coefficients are sensitive to boundary effects between FM and FE components of composite, and the ratio of mechanical coupling depends on the fabrication protocol. Thus, taking into account this fact, our model was simplified and mechanical interactions between FM and FE components were not considered in the model. For this purpose, we consider a model of a multicaloric composite with 0.3/0.7 composition corresponding to a 0.3MnAs/0.7PMN–PT sample. This composition better matches the proposed model because this sample shows less dependence on the FE matrix pressure than the 0.2MnAs/0.8PMN–PT sample and its MCE behavior looks more like that for pristine MnAs. The adiabatic temperature changes induced by ECE and MCE for initial FE and FM components and their thermophysical parameters collected from the literature data are summarized in Table 2.
For this purpose, a three-dimensional model of a multicaloric composite of the 0–3 connectivity type was created. The model considered in the simulation has a three-dimensional structure consisting of a set of cubic continuously connected cells consisting of a continuous ferroelectric medium with spherical ferromagnetic inclusions in their centers (Figure 11).
Modeling was conducted to solve the thermal conductivity (Equations (4) and (5)):
ρ · C H , E · d T d t + k · T = Q
Q = C H , E · Δ T M C E , E C E ρ
The equation was solved numerically by the finite element method (FEM). The thermal contact between the FM particles and the FE matrix was considered ideal, that is, the usual condition of continuity of the heat flow was observed. Ideal thermal insulation was provided at the boundaries of the extreme cells, i.e., the structure as a whole was in adiabatic conditions. Heat capacities of materials (CE(T,E), CH(T,H)) and thermal conductivity k(T) were estimated from the literature data, and magneto- and electrocaloric effects (ΔTMCE, Δμ0H = const (T), ΔTECE, ΔE = const (T)) were obtained by direct study of experimental samples. The geometric dimensions of the cell correlate with microstructural studies and the composition of the composite is 0.3/0.7. Thus, the side of the cubic cell is 45.5 μm and the diameter of the FM sphere is 30 μm, which is comparable with sizes of the FM clusters observed in SEM images for 0.3MnAs/0.7PMN–PT samples. Taking into account the small size of the cell and moderate values of the thermal conductivity of the components (units of W/m·K), the changes in thermal energy associated with the FM and FE were almost instantly distributed evenly throughout the structure, which, taking into account the timescales during modeling (0.1–10 s), allowed us to neglect the effects of lag. Calculations show that in the result of MCE in the FM component, when magnetics are applied, heat is almost instantly distributed through the ferroelectric matrix, as a result of which the MCE in the composite is significantly reduced. The values of changes in the electric and magnetic field strengths were 20 kV/cm and 4 T, respectively.
When the electric and magnetic fields change together, the mutual influence of the FM and FE components of the composite is detected due to heat exchange through thermal conductivity. When modeling the MCE in the composite, it was found that the temperature dependence of the MCE in shape corresponds to the MCE in pure material, and the maximum value of the MCE in the composite was about 1.5 K at 4 T, which is comparable to the value of the MCE with the same magnitude change in the magnetic field strength in the experiment (1.4 K) (Figure 12). The difference in the form of the temperature dependence of MCE is because in the model we did not take into account intergranular interaction between FM and FE components of composites when the broad FOMPT was observed for composite samples.
Two scenarios (Case 1 and Case 2) were considered in modeling:
  • The magnetic field varies according to a sinusoidal law, the diagram of the change in electric intensity corresponds to a meander (the duty cycle is 0.5, the duration of the front/decline is 10%), and the frequency of electric field pulses is 20 times higher than the frequency of the magnetic field (4 Hz and 0.2 Hz, respectively). The case was considered in which the ECE was equal to zero and was equal to that experimentally obtained at a field of 20 kV/cm (100%) and 500% of the experimental (which can be obtained by increasing the intensity).
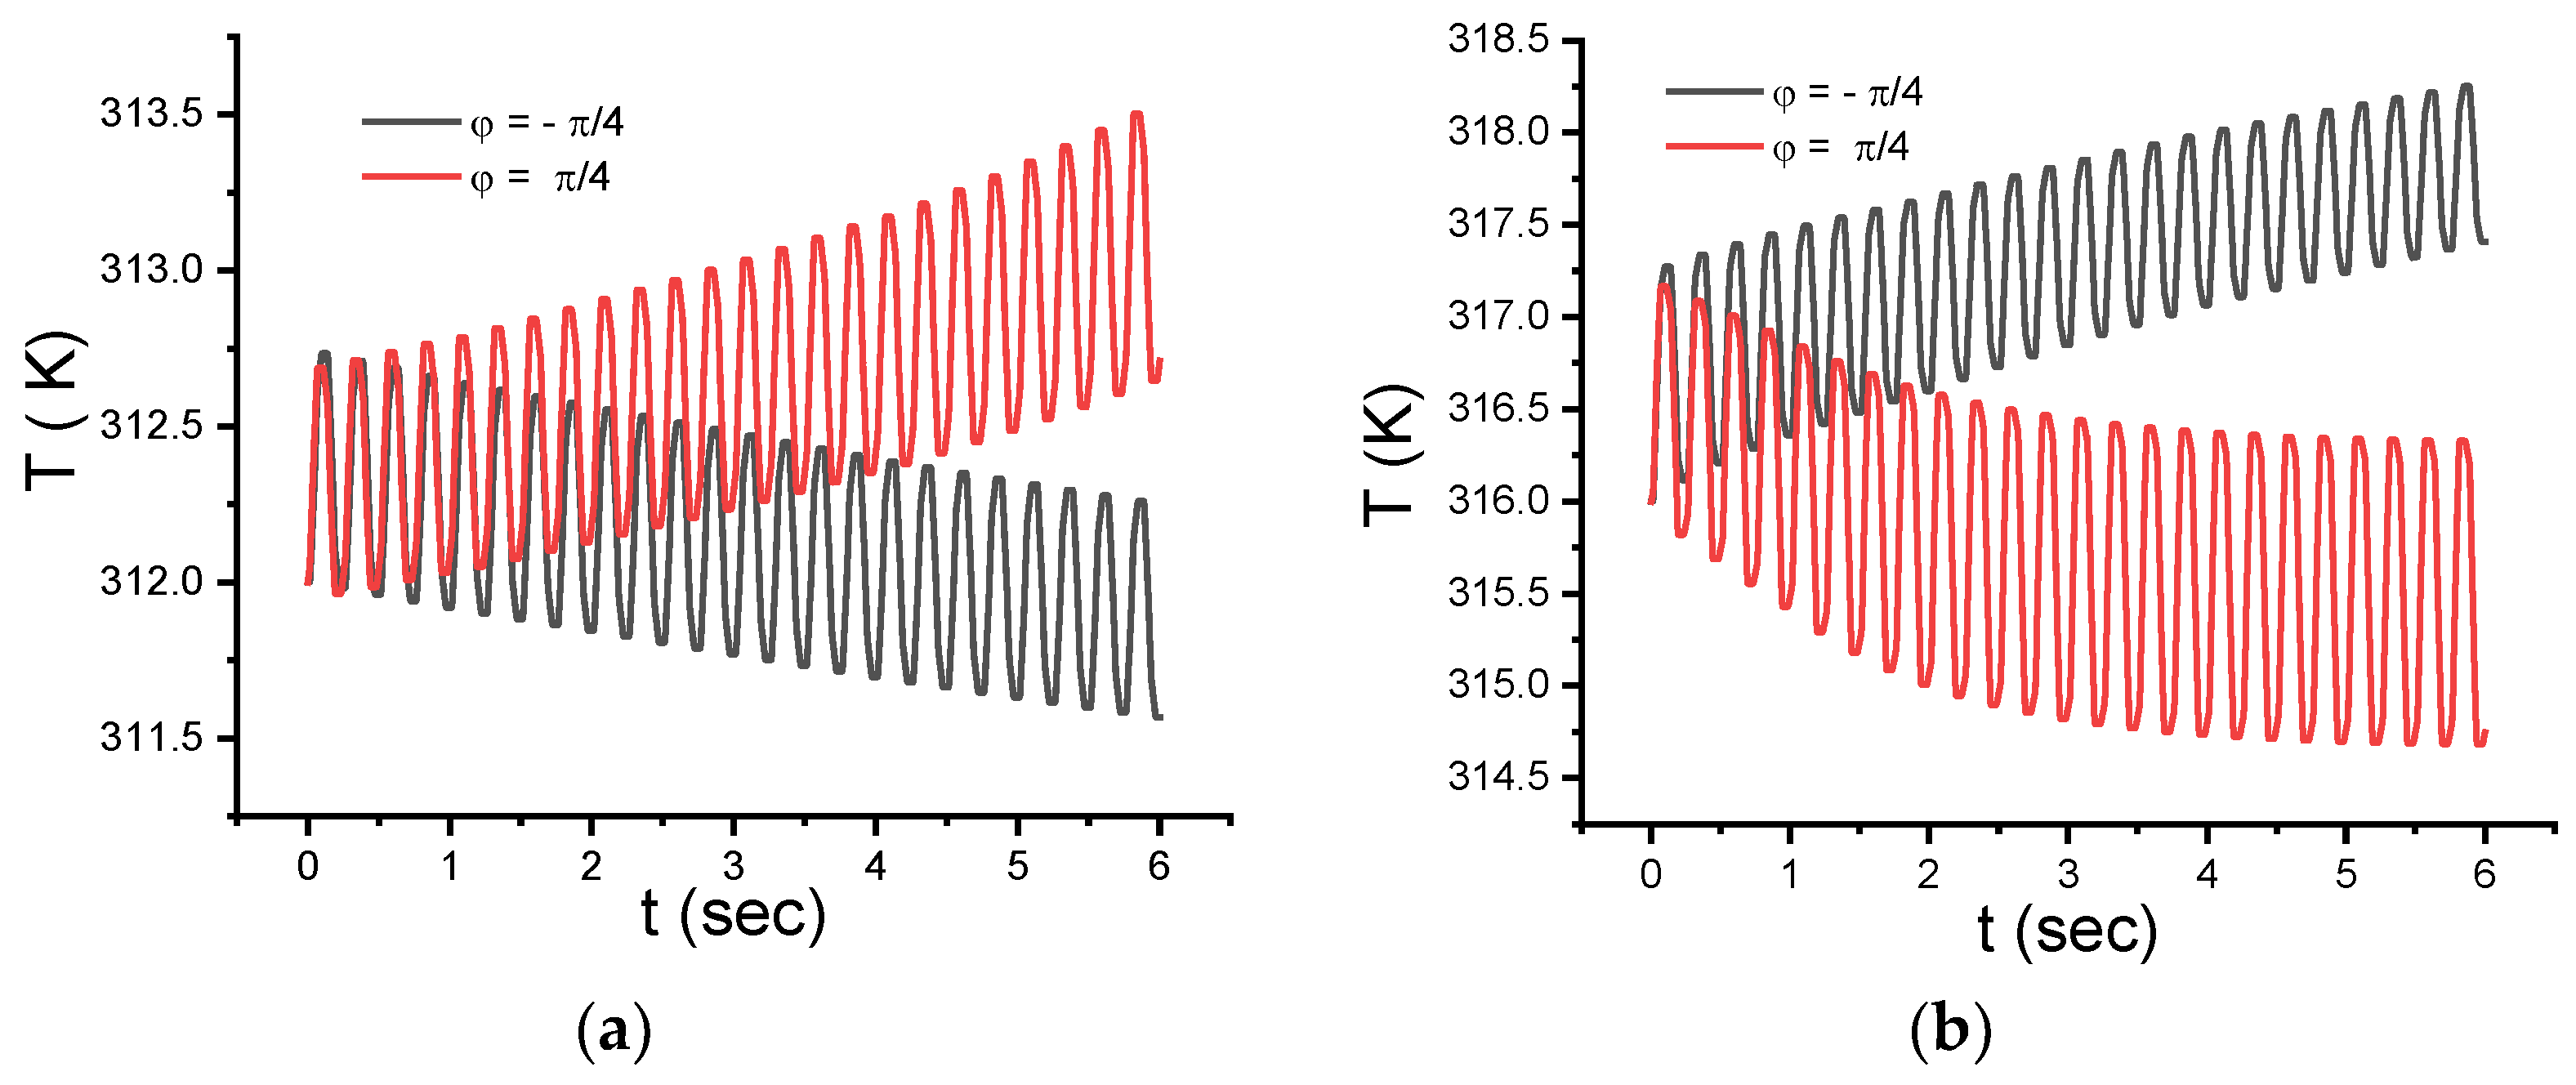
  • The diagram of changes in electric and magnetic strengths corresponds to a meander (with the same parameters as in the first case). The pulse frequencies of the electric and magnetic fields were 4 Hz, while the phase shift between the change in the electric and magnetic fields varied.
For the second case, the initial temperature was selected at points slightly above and slightly below the maximum MCE in the magnetic phase. As a result, the temperature change of the composite was mainly determined by the MCE due to its order of magnitude greater in comparison with the ECE in the ferroelectric matrix.
In the first case, it was found that due to the periodic release and absorption of heat associated with the ECE, the amount of heat released and absorbed due to the MCE changed due to the periodic displacement of the initial temperature of FM component of the composite, which manifests itself in a change in the temperature averaged by the ECE pulse and in a change in the envelopes of the temperature diagram of the FM component (Figure 13).
The time profiles for MCE, ECE, and multiCE for Case 2 are shown in Figure 14, and it is demonstrated that the phase shift ∆φ = −π/4 between applied magnetic and electric fields can provide a synergetic effect and enhance the multiCE at a working point of 316 K, which is above FOMPT (Figure 14).
In the second case, it was found that with a small phase shift (up to π/2), a smooth change in the average temperature of the entire structure occurs, and the sign of the temperature change is associated with both the sign of the phase shift and the initial temperature of the composite (Figure 15). This result is due to a shift in the starting temperature point of the FM component due to the ECE in the result of heat release and absorption.
Briefly, as a conclusion, based on the results of experiments and calculations, we can assume that the boosting of caloric effect in ME composite systems can be achieved by:
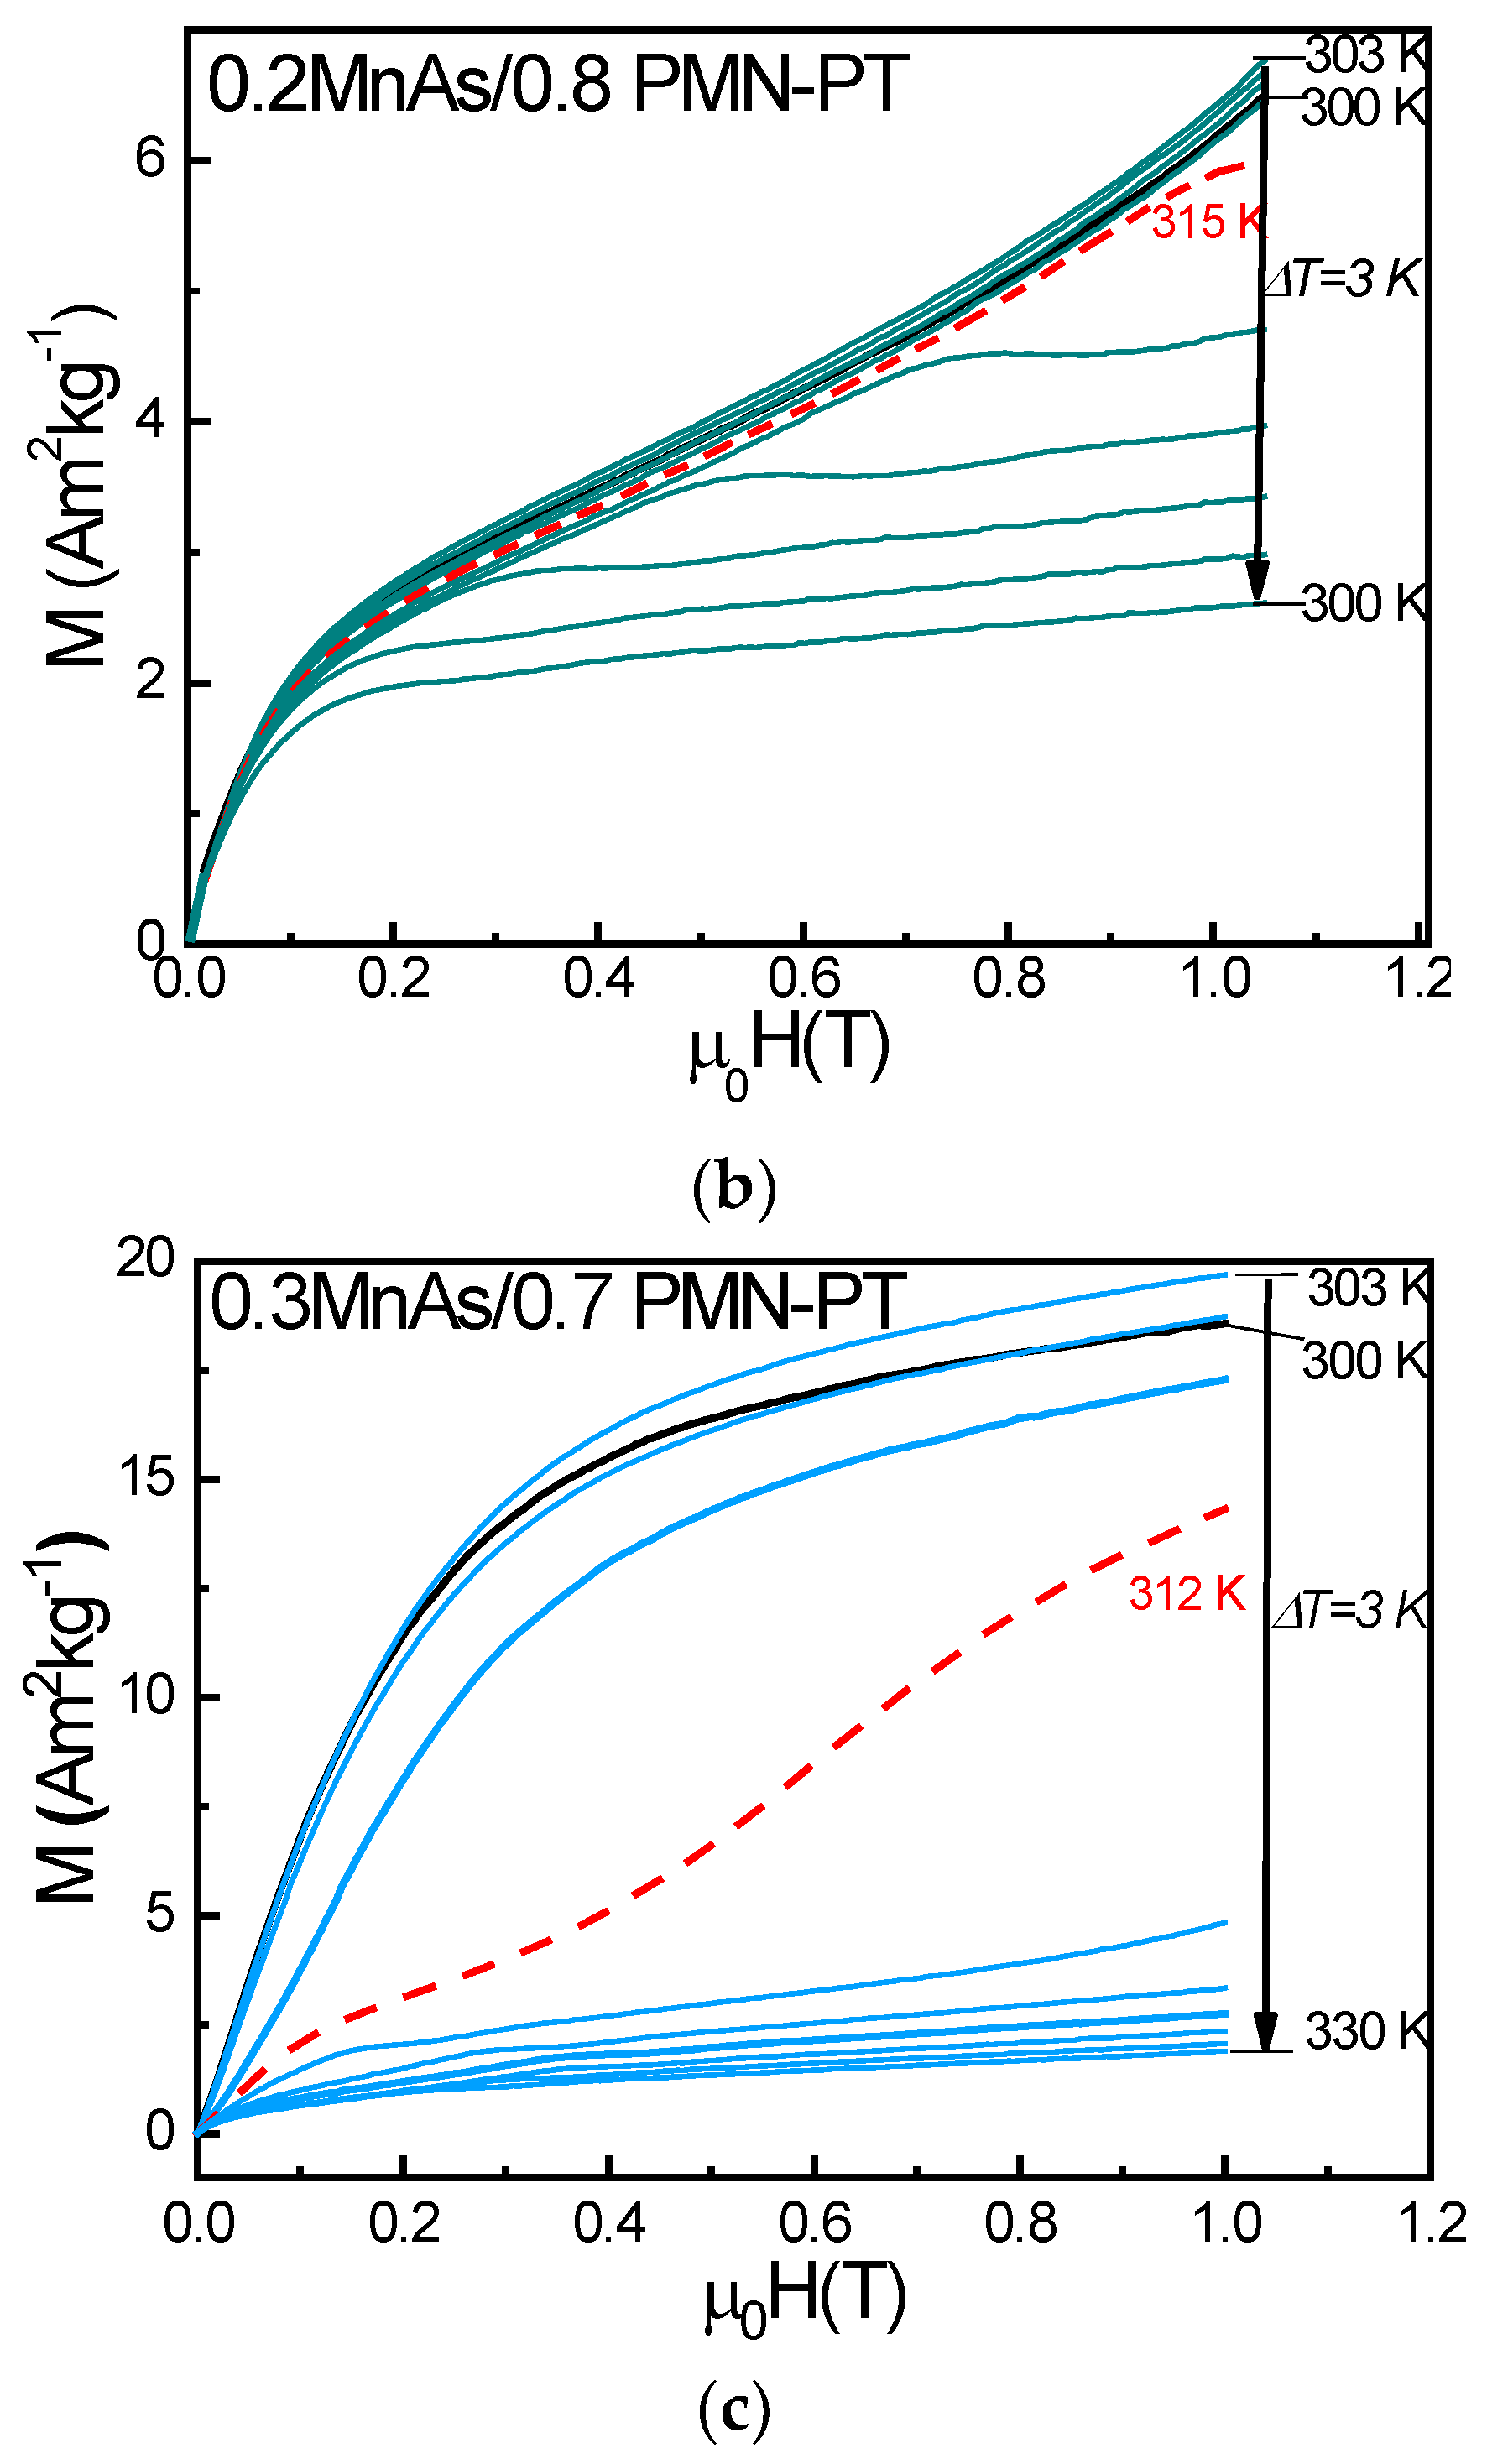
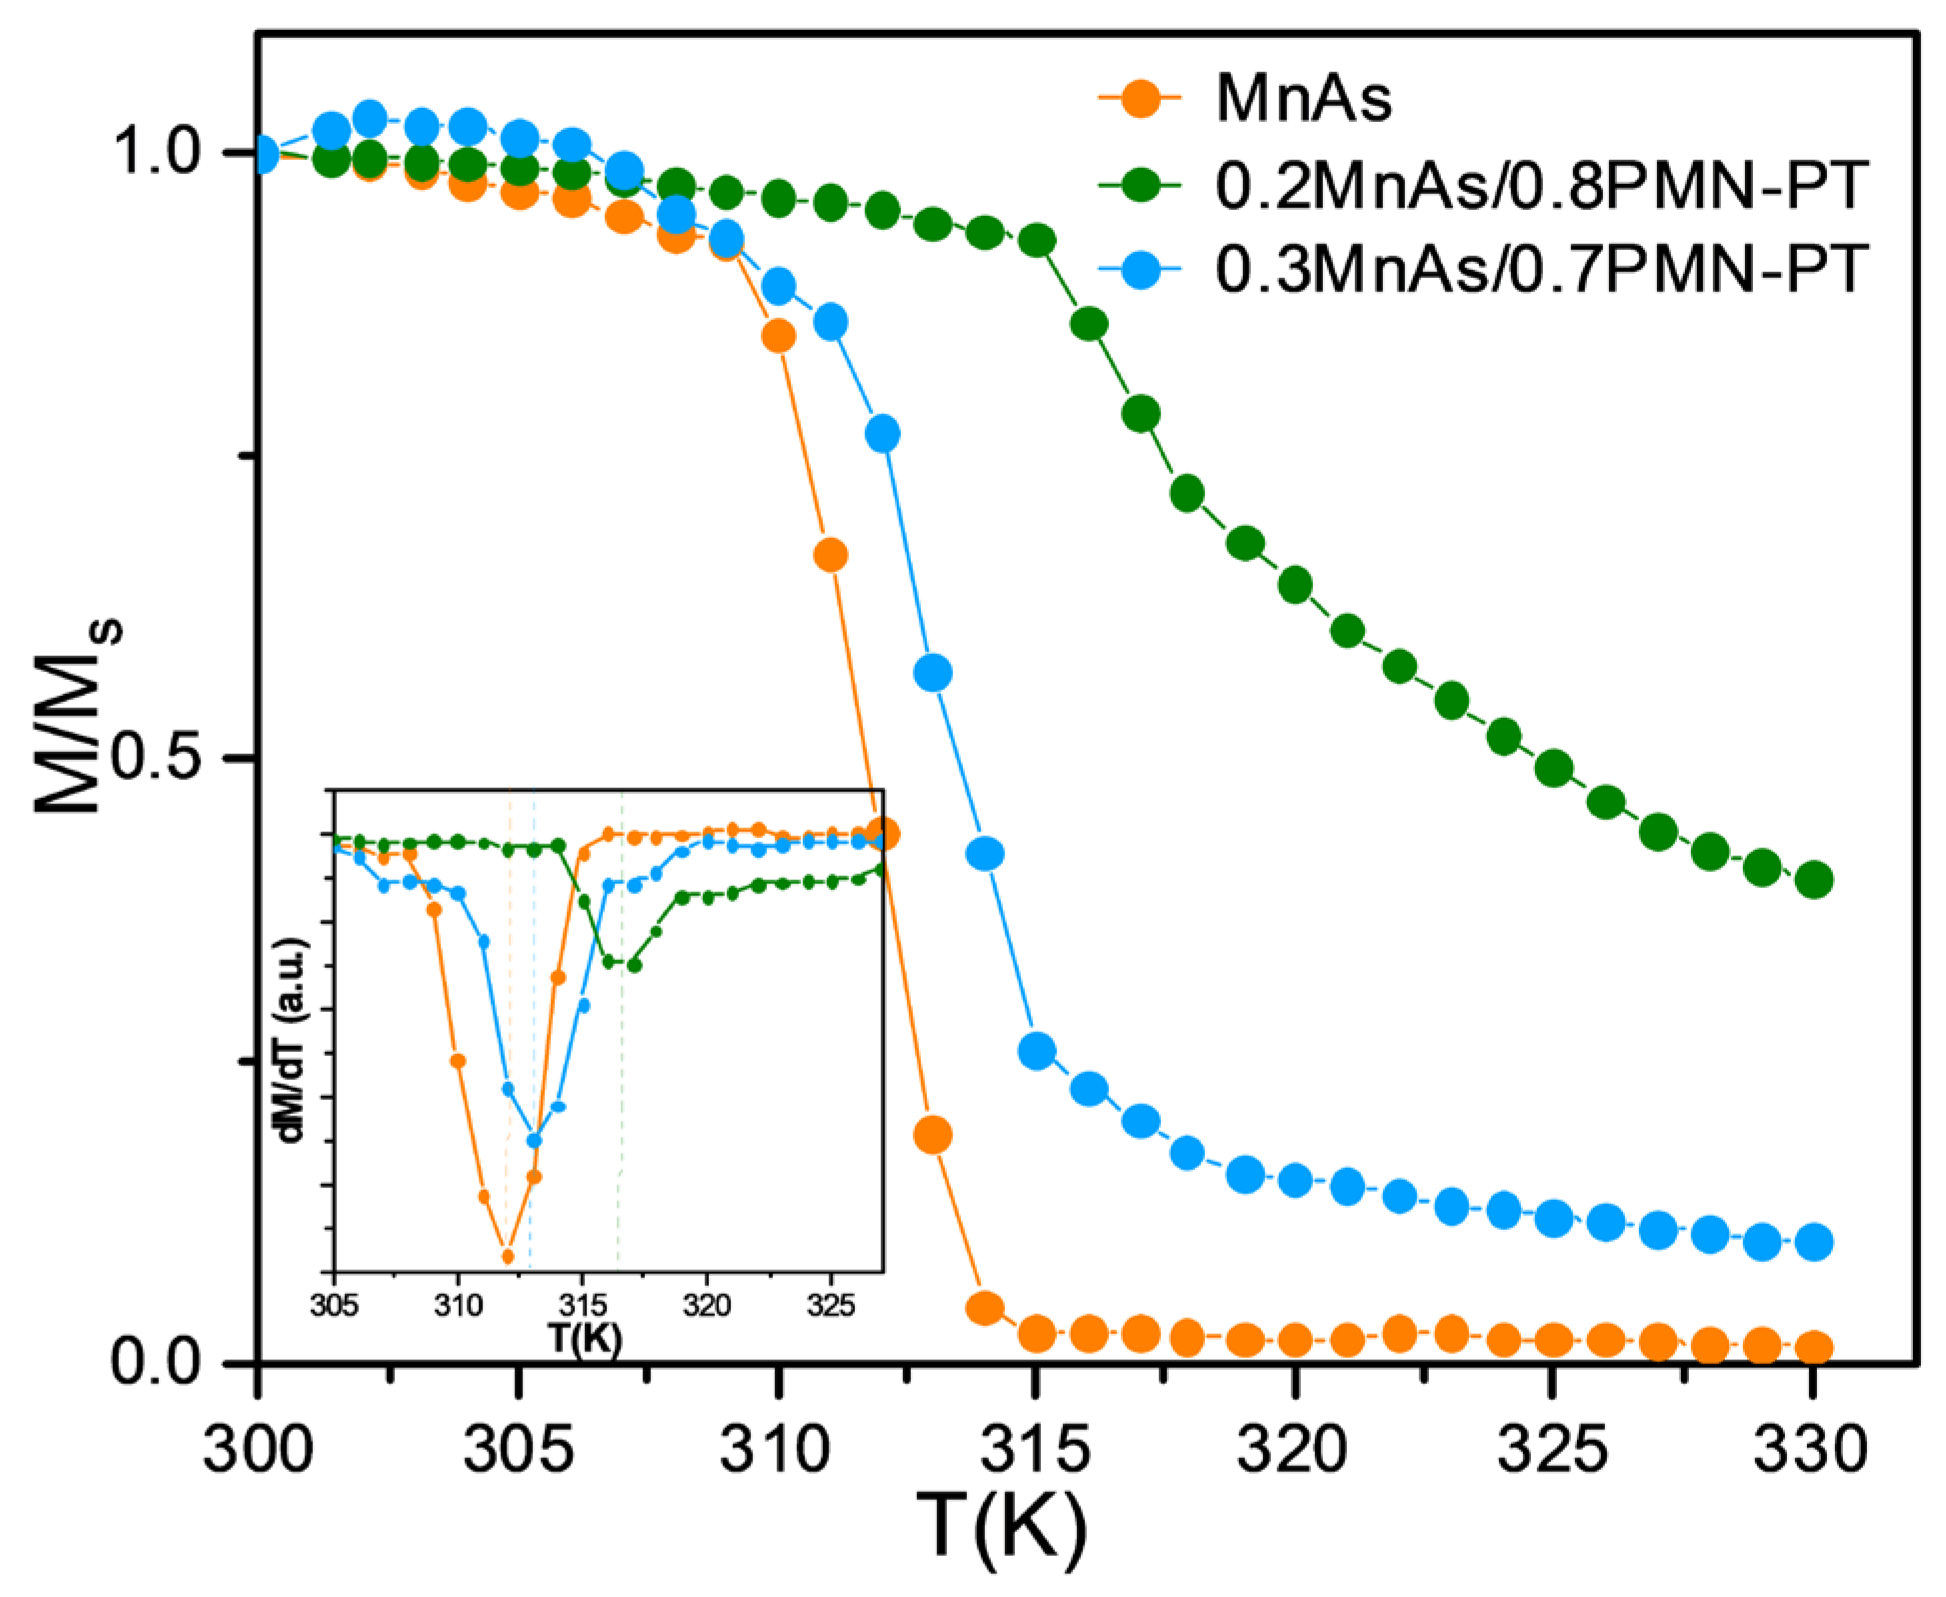
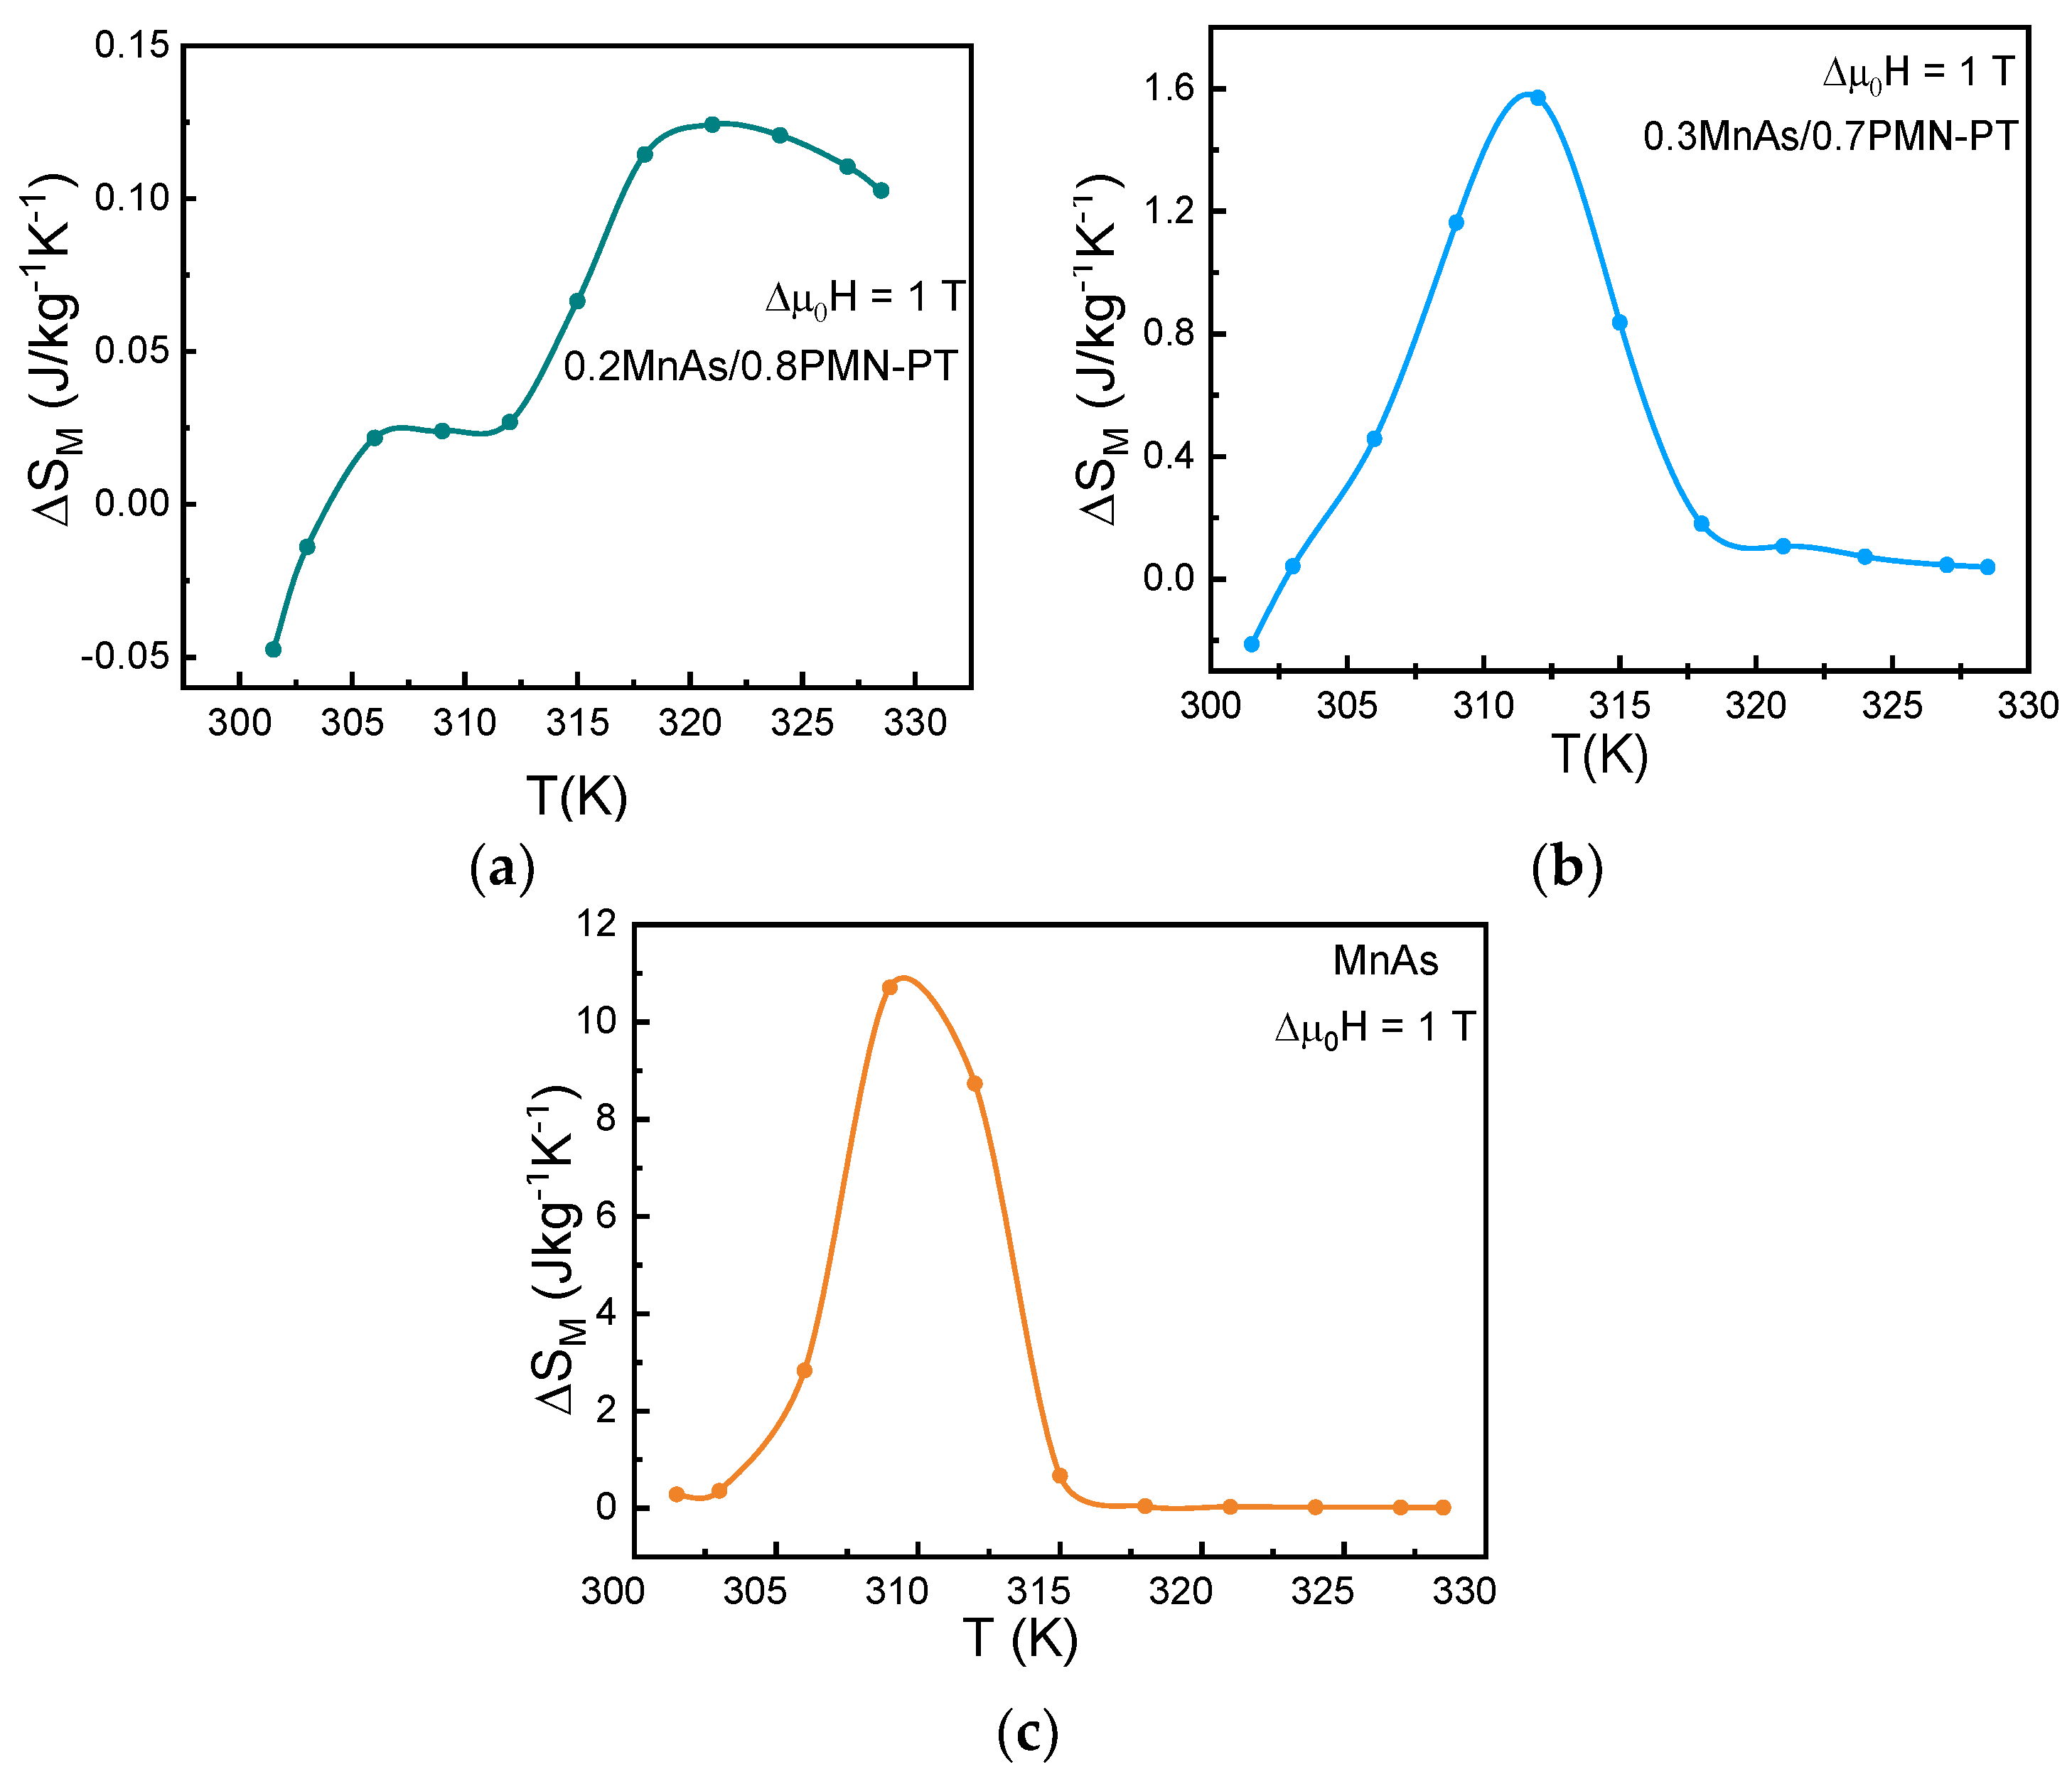
  • Compilation of FM and FE components with large caloric effects in selected mass ratio and PT temperature (sample with x = 0.3 more suitable for proposed concept).
  • Choosing of magnetic and electric field coapplying protocol (phase shifted of coapplied external fields).
  • Mechanical interactions between components should be taken into account in the design and research of new composite systems with a large multicaloric response.
The proposed concept can be used in the design of solid-state cooling devices used on multicaloric materials with coapplied external fields, where MCE is used as the primary effect while ECE plays an assisted role and is used for tuning and control of the working temperature point.

Author Contributions

Conceptualization, A.A.A.; methodology, A.A.A.; software, A.S.A., V.V.S. and M.K.K.; validation, A.A.A., A.S.A. and V.V.S.; formal analysis, A.A.A., A.V.E. and H.H.; investigation, A.S.A., A.A.A., M.V.T., A.M.A. and M.K.K.; resources, L.A.R., A.M.A. and A.V.E.; data curation, A.A.A.; writing—original draft preparation, A.A.A., A.S.A., M.V.T. and H.H.; writing—review and editing, A.S.A., A.A.A., H.H. and M.V.T.; visualization, M.K.K., A.S.A. and V.V.S.; supervision, L.A.R., A.M.A. and A.V.E.; project administration, A.A.A.; funding acquisition, L.A.R. and A.V.E. All authors have read and agreed to the published version of the manuscript.

Funding

The reported study (MCE, ECE, multiCE experiment and calculations) was funded by RFBR (the research project № 20-58-26015). Part of this work (SEM analyses) was carried out during the implementation of the strategic project “Biomedical materials and bioengineering” within the framework of the Strategic Academic Leadership Program “Priority 2030” at NUST “MISIS”. V.S. acknowledges the Ministry of Science and Higher Education of the Russian Federation within the Russian State Assignment, under Contract 075-01493-23-00 (the MCE calculations).

Institutional Review Board Statement

Not applicable.

Informed Consent Statement

Not applicable.

Data Availability Statement

The data presented in this study are available on request from the corresponding author.

Acknowledgments

The authors are grateful to S. Shevirtalov (Laboratory of Novel Magnetic Materials, Immanuel Kant Baltic Federal University) for help with magnetization measurements and T. Arslanov (Amirkhanov Institute of Physics, Dagestan Scientific Center of Russian Academy of Sciences) for providing the MnAs sample.

Conflicts of Interest

The authors declare no conflict of interest.

References

  1. Tishin, A.M.; Spichkin, Y.I. The Magnetocaloric Effect and Its Applications; CRC Press: Boca Raton, FL, USA, 2016. [Google Scholar] [CrossRef]
  2. Cazorla, C. Novel mechanocaloric materials for solid-state cooling applications. Appl. Phys. Rev. 2019, 6, 041316. [Google Scholar] [CrossRef]
  3. Kholkin, A.L.; Pakhomov, O.V.; Semenov, A.A.; Tselev, A. The Electrocaloric Effect: Materials and Applications; Elsevier: Amsterdam, The Netherlands, 2023. [Google Scholar] [CrossRef]
  4. Franco, V.; Blázquez, J.; Ipus, J.; Law, J.; Moreno-Ramírez, L.; Conde, A. Magnetocaloric effect: From materials research to refrigeration devices. Prog. Mater. Sci. 2018, 93, 112–232. [Google Scholar] [CrossRef]
  5. Shao, C.; Amirov, A.A.; Huang, H. A review on different theoretical models of electrocaloric effect for refrigeration. Front. Energy 2023, 17, 478–503. [Google Scholar] [CrossRef]
  6. Moya, X.; Kar-Narayan, S.; Mathur, N.D. Caloric materials near ferroic phase transitions. Nat. Mater. 2014, 13, 439–450. [Google Scholar] [CrossRef] [PubMed]
  7. Silva, D.J.; Ventura, J.; Araújo, J.P. Caloric devices: A review on numerical modeling and optimization strategies. Int. J. Energy Res. 2021, 45, 18498–18539. [Google Scholar] [CrossRef]
  8. Mañosa, L.; Planes, A. Materials with Giant Mechanocaloric Effects: Cooling by Strength. Adv. Mater. 2017, 29, 1603607. [Google Scholar] [CrossRef] [PubMed]
  9. Vopson, M.M. Multicaloric effect: An outlook. Phys. B Condens. Matter 2017, 513, 103–105. [Google Scholar] [CrossRef]
  10. Stern-Taulats, E.; Castán, T.; Mañosa, L.; Planes, A.; Mathur, N.D.; Moya, X. Multicaloric materials and effects. MRS Bull. 2018, 43, 295–299. [Google Scholar] [CrossRef]
  11. Czernuszewicz, A.; Kaleta, J.; Lewandowski, D. Multicaloric effect: Toward a breakthrough in cooling technology. Energy Convers. Manag. 2018, 178, 335–342. [Google Scholar] [CrossRef]
  12. Gottschall, T.; Gràcia-Condal, A.; Fries, M.; Taubel, A.; Pfeuffer, L.; Mañosa, L.; Planes, A.; Skokov, K.P.; Gutfleisch, O. A multicaloric cooling cycle that exploits thermal hysteresis. Nat. Mater. 2018, 17, 929–934. [Google Scholar] [CrossRef]
  13. Amirov, A.A.; Tishin, A.M.; Pakhomov, O.V. Multicalorics—New materials for energy and straintronics (Review). Phys. Solid State 2022, 64, 383. [Google Scholar] [CrossRef]
  14. Hou, H.; Qian, S.; Takeuchi, I. Materials, physics and systems for multicaloric cooling. Nat. Rev. Mater. 2022, 7, 633–652. [Google Scholar] [CrossRef]
  15. Pyatakov, A.P.; Zvezdin, A.K. Magnetoelectric and multiferroic media. Uspekhi Fiz. Nauk. 2012, 182, 593. [Google Scholar] [CrossRef]
  16. Spaldin, N.A. Multiferroics: Past, present, and future. MRS Bull. 2017, 42, 385–389. [Google Scholar] [CrossRef]
  17. Binek, C.; Burobina, V. Near-room-temperature refrigeration through voltage-controlled entropy change in multiferroics. Appl. Phys. Lett. 2013, 102, 031915. [Google Scholar] [CrossRef]
  18. Wang, Y.; Hu, J.; Lin, Y.; Nan, C.-W. Multiferroic magnetoelectric composite nanostructures. NPG Asia Mater. 2010, 2, 61–68. [Google Scholar] [CrossRef]
  19. Schmid, H. Multi-ferroic magnetoelectrics. Ferroelectrics 1994, 162, 317–338. [Google Scholar] [CrossRef]
  20. Gupta, R.; Kotnala, R.K. A review on current status and mechanisms of room-temperature magnetoelectric coupling in multiferroics for device applications. J. Mater. Sci. 2022, 57, 12710–12737. [Google Scholar] [CrossRef]
  21. Swartz, S.L.; Shrout, T.R. Fabrication of perovskite lead magnesium niobate. Mater. Res. Bull. 1982, 17, 1245–1250. [Google Scholar] [CrossRef]
  22. Talanov, M.V.; Shilkina, L.A.; Verbenko, I.A.; Reznichenko, L.A. Impact of Ba2+ on Structure and Piezoelectric Properties of PMN–PZN–PNN–PT Ceramics Near the Morphotropic Phase Boundary. J. Am. Ceram. Soc. 2014, 98, 838–847. [Google Scholar] [CrossRef]
  23. Marenkin, S.F.; Trukhan, V.M.; Fedorchenko, I.V.; Trukhanov, S.V.; Shoukavaya, T.V. Magnetic and electrical properties of Cd3As2 + MnAs composite. Russ. J. Inorg. Chem. 2014, 59, 355–359. [Google Scholar] [CrossRef]
  24. Marenkin, S.F.; Aronov, A.N.; Fedorchenko, I.V.; Zheludkevich, A.L.; Khoroshilov, A.V.; Vasil’ev, M.G.; Kozlov, V.V. Ferromagnetic-to-Paramagnetic Phase Transition of MnAs Studied by Calorimetry and Magnetic Measurements. Inorg. Mater. 2018, 54, 863–867. [Google Scholar] [CrossRef]
  25. Fedorchenko, I.; Ril, A.; Marenkin, S.; Rabinovich, O.; Legotin, S.; Didenko, S.; Skupiñski, P.; Kilanski, L.; Dobrowolski, W. Phase diagram of the ZnSiAs2–MnAs system. J. Cryst. Growth 2017, 468, 683–687. [Google Scholar] [CrossRef]
  26. Aliev, A.M.; Khanov, L.N.; Gamzatov, A.G.; Batdalov, A.B.; Kurbanova, D.R.; Yanushkevich, K.I.; Govor, G.A. Giant magnetocaloric effect in MnAs1–xPx in a cyclic magnetic field: Lattice and magnetic contributions and degradation of the effect. Appl. Phys. Lett. 2021, 118, 072404. [Google Scholar] [CrossRef]
  27. Aliev, A.M.; Batdalov, A.; Khanov, L.; Koledov, V.; Shavrov, V.; Tereshina, I.; Taskaev, S. Magnetocaloric effect in some magnetic materials in alternating magnetic fields up to 22 Hz. J. Alloys Compd. 2016, 676, 601–605. [Google Scholar] [CrossRef]
  28. Es’kov, A.V.; Belyavskii, P.Y.; Anokhin, A.S.; Pakhomov, O.V.; Semenov, A.A.; Myl’nikov, I.L.; Nikitin, A.A.; Bui, M.T.; Cherkasskii, M.A.; Plotnikov, V.V. Experimental investigation of the electrocaloric response in ferroelectric materials. Tech. Phys. 2016, 61, 1112–1114. [Google Scholar] [CrossRef]
  29. Anokhin, A.S.; Es’kov, A.V.; Pakhomov, O.V.; Semenov, A.A.; Lähderanta, E.; Tselev, A.; Kholkin, A.L. Investigation of time and frequency characteristics of the electrocaloric response in ferroelectric materials. J. Phys. Conf. Ser. 2020, 1697, 012195. [Google Scholar] [CrossRef]
  30. Kuhrt, C.; Schittny, T.; Magnetic, B.-T. Phase Diagram of Anion Substituted MnAs. Magnetocaloric Experiments. Phys. Status Solidi 1985, 91, 105–113. [Google Scholar] [CrossRef]
  31. Uchino, K.; Nomura, S. Critical exponents of the dielectric constants in diffused-phase-transition crystals. Ferroelectrics 1982, 44, 55–61. [Google Scholar] [CrossRef]
  32. Burns, G.; Dacol, F. Glassy polarization behavior in ferroelectric compounds Pb(Mg13Nb23)O3 and Pb(Zn13Nb23)O3. Solid State Commun. 1983, 48, 853–856. [Google Scholar] [CrossRef]
  33. Koshkid’Ko, Y.; Dilmieva, E.; Cwik, J.; Rogacki, K.; Kowalska, D.; Kamantsev, A.; Koledov, V.; Mashirov, A.; Shavrov, V.; Valkov, V.; et al. Giant reversible adiabatic temperature change and isothermal heat transfer of MnAs single crystals studied by direct method in high magnetic fields. J. Alloys Compd. 2019, 798, 810–819. [Google Scholar] [CrossRef]
  34. Pytlik, L.; Ziȩba, A. Magnetic phase diagram of MnAs. J. Magn. Magn. Mater. 1985, 51, 199–210. [Google Scholar] [CrossRef]
  35. Goodenough, J.B.; Kafalas, J.A. High-Pressure Study of the First-Order Phase Transition in MnAs. Phys. Rev. 1967, 157, 389–395. [Google Scholar] [CrossRef]
  36. Wada, H.; Tanabe, Y. Giant magnetocaloric effect of MnAs1−xSbx. Appl. Phys. Lett. 2001, 79, 3302–3304. [Google Scholar] [CrossRef]
  37. Gama, S.; Coelho, A.A.; de Campos, A.; Carvalho, A.M.G.; Gandra, F.C.G.; von Ranke, P.J.; de Oliveira, N.A. Pressure-Induced Colossal Magnetocaloric Effect in MnAs. Phys. Rev. Lett. 2004, 93, 237202. [Google Scholar] [CrossRef]
  38. Peräntie, J.; Tailor, H.N.; Hagberg, J.; Jantunen, H.; Ye, Z.-G. Electrocaloric properties in relaxor ferroelectric (1 − x)Pb(Mg1/3Nb2/3)O3–xPbTiO3 system. J. Appl. Phys. 2013, 114, 174105. [Google Scholar] [CrossRef]
  39. Saranya, D.; Chaudhuri, A.R.; Parui, J.; Krupanidhi, S.B. Electrocaloric effect of PMN–PT thin films near morphotropic phase boundary. Bull. Mater. Sci. 2009, 32, 259–262. [Google Scholar] [CrossRef]
  40. Le Goupil, F.; Berenov, A.; Axelsson, A.-K.; Valant, M.; Alford, N.M. Direct and indirect electrocaloric measurements on <001>-PbMg1/3Nb2/3O3–30PbTiO3 single crystals. J. Appl. Phys. 2012, 111, 124109. [Google Scholar] [CrossRef]
  41. Vrabelj, M.; Uršič, H.; Kutnjak, Z.; Rožič, B.; Drnovšek, S.; Benčan, A.; Bobnar, V.; Fulanović, L.; Malič, B. Large electrocaloric effect in grain-size-engineered 0.9Pb(Mg1/3Nb2/3)O3–0.1PbTiO3. J. Eur. Ceram. Soc. 2016, 36, 75–80. [Google Scholar] [CrossRef]
  42. Chauhan, A.; Patel, S.; Vaish, R. Enhanced Electrocaloric Effect in Pre-stressed Ferroelectric Materials. Energy Technol. 2015, 3, 177–186. [Google Scholar] [CrossRef]
  43. Gottschall, T.; Benke, D.; Fries, M.; Taubel, A.; Radulov, I.A.; Skokov, K.P.; Gutfleisch, O. A Matter of Size and Stress: Understanding the First-Order Transition in Materials for Solid-State Refrigeration. Adv. Funct. Mater. 2017, 27, 1606735. [Google Scholar] [CrossRef]
  44. Mikhaleva, E.; Flerov, I.; Kartashev, A.; Gorev, M.; Cherepakhin, A.; Sablina, K.; Mikhashenok, N.; Volkov, N.; Shabanov, A. Caloric effects and phase transitions in ferromagnetic-ferroelectric composites xLa0.7Pb0.3MnO3–(1 − x)PbTiO3. J. Mater. Res. 2013, 28, 3322–3331. [Google Scholar] [CrossRef]
  45. Mikhaleva, E.; Eremin, E.; Flerov, I.; Kartashev, A.; Sablina, K.; Mikhashenok, N. Magnetization and magnetocaloric effect in La0.7Pb0.3MnO3 ceramics and 0.85(La0.7Pb0.3MnO3)–0.15(PbTiO3) composite. J. Mater. Res. 2014, 30, 278–285. [Google Scholar] [CrossRef]
  46. Flerov, I.N.; Mikhaleva, E.A.; Gorev, M.V.; Kartashev, A.V. Caloric and multicaloric effects in oxygen ferroics and multiferroics. Phys. Solid State 2015, 57, 429–441. [Google Scholar] [CrossRef]
  47. Tocado, L.; Palacios, E.; Burriel, R. Entropy determinations and magnetocaloric parameters in systems with first-order transitions: Study of MnAs. J. Appl. Phys. 2009, 105, 093918. [Google Scholar] [CrossRef]
  48. Fujieda, S.; Hasegawa, Y.; Fujita, A.; Fukamichi, K. Thermal transport properties of magnetic refrigerants La(FexSi1−x)13 and their hydrides, and Gd5Si2Ge2 and MnAs. J. Appl. Phys. 2004, 95, 2429–2431. [Google Scholar] [CrossRef]
  49. Uršič, H.; Vrabelj, M.; Fulanovič, L.; Bradeško, A.; Drnovšek, S.; Malič, B. Specific heat capacity and thermal conductivity of the electrocaloric (1 − x)Pb(Mg1/3Nb2/3)O3–xPbTiO3 ceramics between room temperature and 300 °C. Inf. MIDEM 2015, 45, 260–265. [Google Scholar]
  50. Tachibana, M.; Takayama-Muromachi, E. Thermal conductivity and heat capacity of the relaxor ferroelectric [PbMg1/3Nb2/3O3]1−x[PbTiO3]x. Phys. Rev. B Condens. Matter Mater. Phys. 2009, 79, 100104. [Google Scholar] [CrossRef]
Figure 1. Model of 0–3-type multicaloric composite.
Jcs 07 00400 g001
Figure 2. XRD patterns of the (x)MnAs/(1 − x)PMN–PT (x = 0.2; 0.3) composites and their initial components MnAs and PMN–PT.
Jcs 07 00400 g002
Figure 3. SEM images of initial components MnAs (a) and PMN–PT (b) and their composites (x)MnAs/(1 − x)PMN–PT: x = 0.2 (c), x = 0.3 (d).
Jcs 07 00400 g003aJcs 07 00400 g003b
Figure 4. Temperature dependences of relative dielectric permittivity (ε) of the Pb0.9Ba0.1(Mg1/3Nb2/3)0.4541(Zn1/3Nb2/3)0.0982(Ni1/3Nb2/3)0.1477Ti0.3O3 ceramics measured at various f.
Jcs 07 00400 g004
Figure 5. The normalized magnetization M/Ms (Ms—magnetization in 1 T at 300 K) curves as a function of temperature at 1 T magnetic fields for pristine MnAs and its composites in heating protocol. (insert image) The temperature derivatives dM/dT as a function of temperature, calculated from normalized magnetization vs. temperature curves.
Jcs 07 00400 g005
Figure 7. The temperature dependencies of the magnetic entropy change ∆Sm of (x)MnAs/(1 − x)PMN–PT (x = 0.2; 0.3) composites (a,b) and their initial magnetic component MnAs (c) in 1 T magnetic field.
Jcs 07 00400 g007
Figure 8. The temperature dependencies of the adiabatic temperature change ∆TADMCE of (x)MnAs/(1 − x)PMN–PT (x = 0.2; 0.3) composites (a,b) and their initial magnetic component MnAs (c).
Jcs 07 00400 g008
Figure 9. The P(E) hysteresis loops measured at different temperatures (a) and temperature dependences of polarization at different applied electric fields (b) for pristine FE component of modified PMN–PT ceramics.
Jcs 07 00400 g009
Figure 10. Temperature dependencies of adiabatic temperature change ∆TADFE at different applied electric fields (ECE) for pristine FE components of modified PMN–PT ceramics.
Jcs 07 00400 g010
Figure 11. 3D model of multicaloric composite 0.3MnAs/0.7PMN–PT used for FEM.
Jcs 07 00400 g011
Figure 12. Temperature dependences of MCE for 0.3MnAs/0.7PMN–PT: experiment and calculation.
Jcs 07 00400 g012
Figure 13. Temperature dependences of multiCE and their lower envelope lines (calculations for Case 1).
Jcs 07 00400 g013
Figure 14. The time profile for MCE, ECE, and multiCE for Case 2 at working point magnetic phase transition temperature.
Jcs 07 00400 g014
Figure 15. Temperature dependences of multiCE with different regimes of phase-shifted applications of magnetic and electric fields at working points up to (a) and above (b) magnetic phase transition temperatures (calculations for Case 2).
Jcs 07 00400 g015
Table 1. Dielectric, piezoelectric, and ferroelastic properties of the Pb0.9Ba0.1(Mg1/3Nb2/3)0.4541(Zn1/3Nb2/3)0.0982(Ni1/3Nb2/3)0.1477Ti0.3O3 ceramics [22].
εε33Ttan δd33
(pC/N)
KpQmVE1
(km/s)
10,22010,1500.0651000.143643.48
Table 2. Thermophysical and caloric parameters (∆TADFE (∆E)—maximum of adiabatic temperature changes for ECE at transition temperature TCFE in applied ∆E electric field; ∆TADFM (∆μ0H)—maximum of adiabatic temperature changes for MCE at transition temperature TCFM in applied ∆μ0H magnetic field; ρ—density; Cp—specific heat capacity; λ—thermal conductivity) of FM and FE components used in multicaloric MnAs/PMN–PT composites (*—for Cp and λ, the corresponding parameters for a basic solid solution system PMN–PT are used).
Components∆TADFE (∆E),
K(kV/cm)
∆TADFM (∆μ0H),
K(T)
ρ,
kg/m3
Cp,
J·kg−1K−1
λ,
W·m−1·K−1
MnAs6.7 (4)
(in our experiment)
6310 [33]500–650 [47]~2 [48]
PMN–PT0.27 (20)
(in our experiment)
7560
(in our experiment)
300–340 *
(estimation from [49,50])
~1.3 *
(estimation from [49,50])
0.3MnAs/0.7PMN–PT-1.4 K (4)
(in our experiment)
-
Disclaimer/Publisher’s Note: The statements, opinions and data contained in all publications are solely those of the individual author(s) and contributor(s) and not of MDPI and/or the editor(s). MDPI and/or the editor(s) disclaim responsibility for any injury to people or property resulting from any ideas, methods, instructions or products referred to in the content.

