Experimental Research on the Impact Resistance Mechanical Properties and Damage Mechanism of Rubberized Concrete under Freeze–Thaw Cycling

Abstract
:Featured Application
Abstract
1. Introduction
2. Materials and Methods
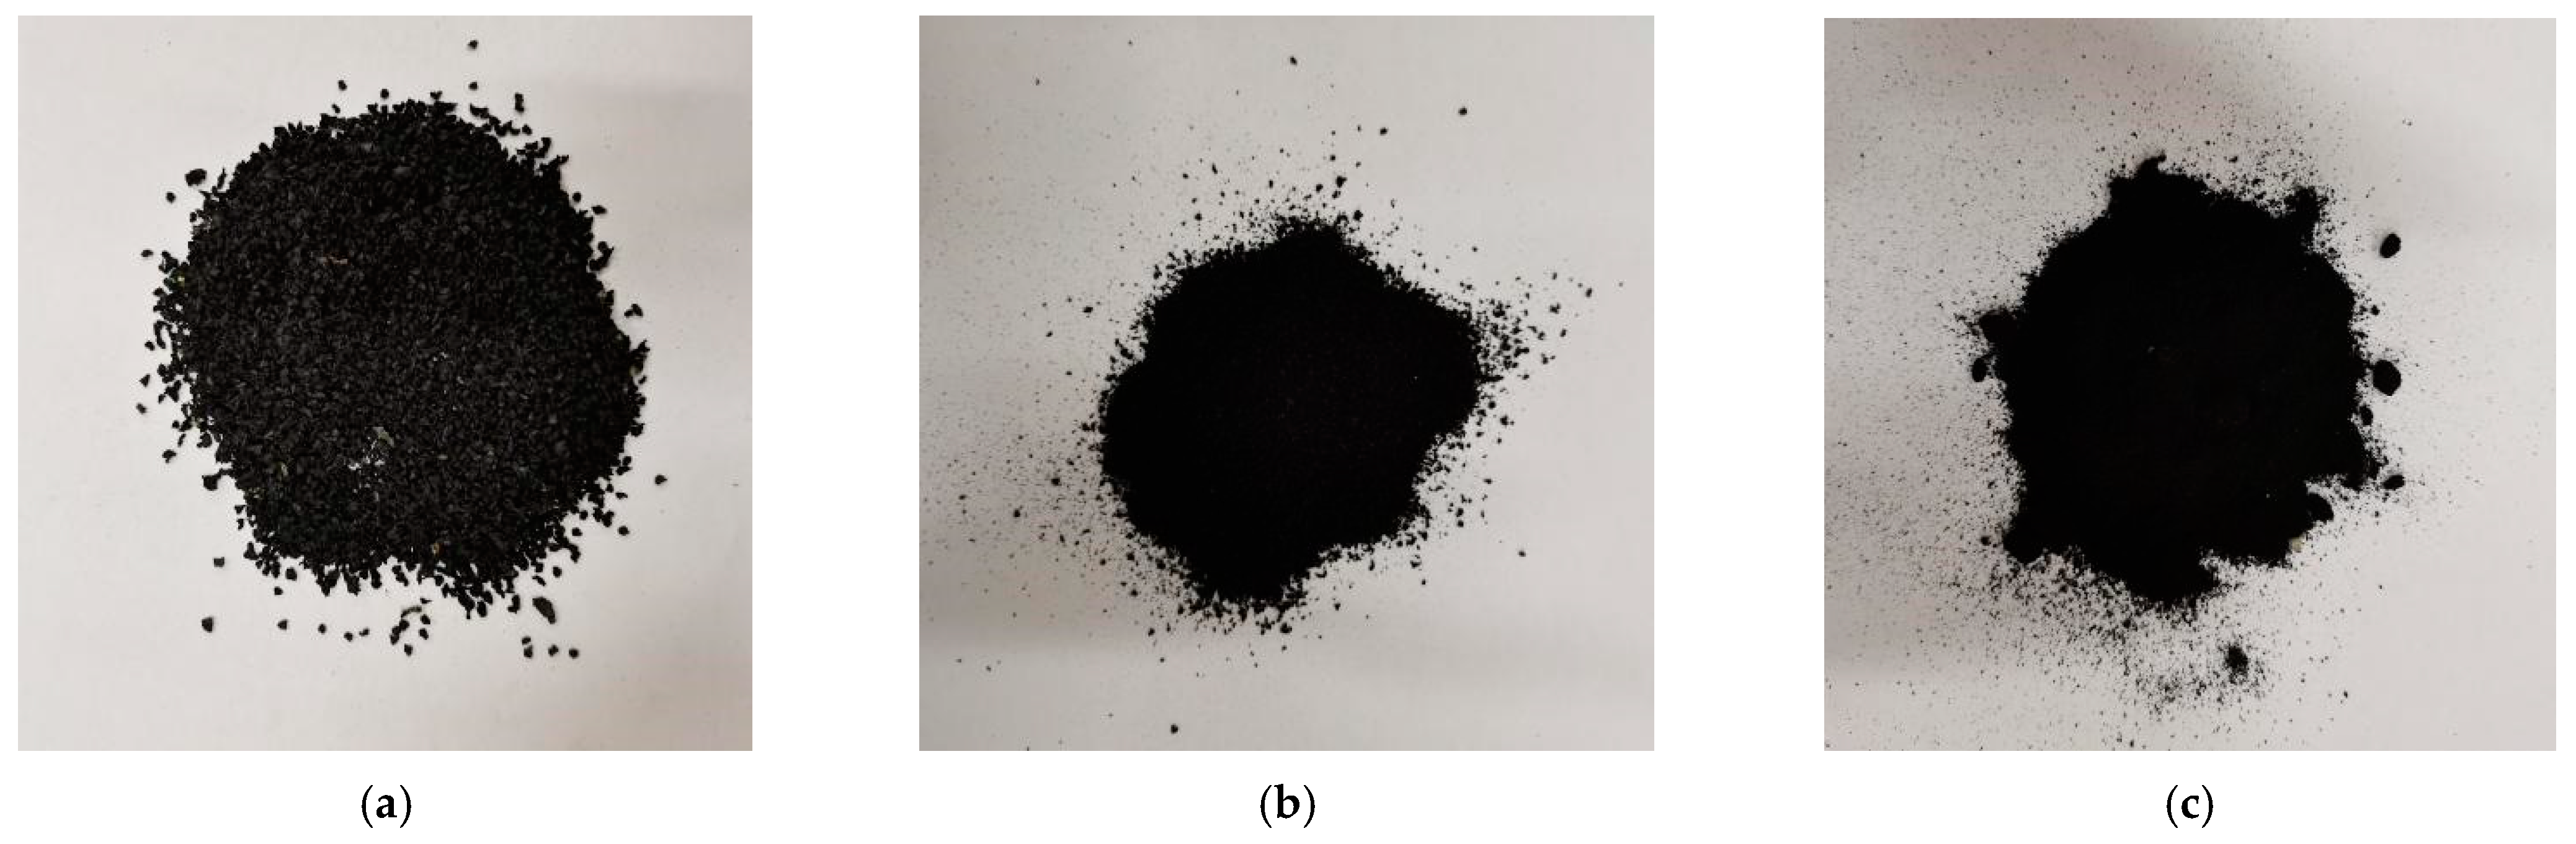
2.1. Raw Material
2.2. Specimen Preparation
- (1)
- (2)
- Each freeze–thaw cycle time was 4 h, with rapid freezing for 2.5 h and then rapid melting for 1.5 h. The temperature of the low-temperature freezing equipment was set to −20 °C. The test block containing saturated water was frozen in the low-temperature freezing equipment, and the melting was carried out in the clear water. A constant-temperature heating rod was added to the clear water to accelerate the melting and thawing speed of the test block.
- (3)
- Every 25 freeze–thaw cycles were a sequence. After each freeze–thaw sequence, 3 compressive test blocks and 9 impact test blocks were taken out from each group for mechanical testing. After each freeze–thaw sequence, the scum on the surface of the test block was washed with water, and the surface moisture was dried with a wet towel to measure the quality change.
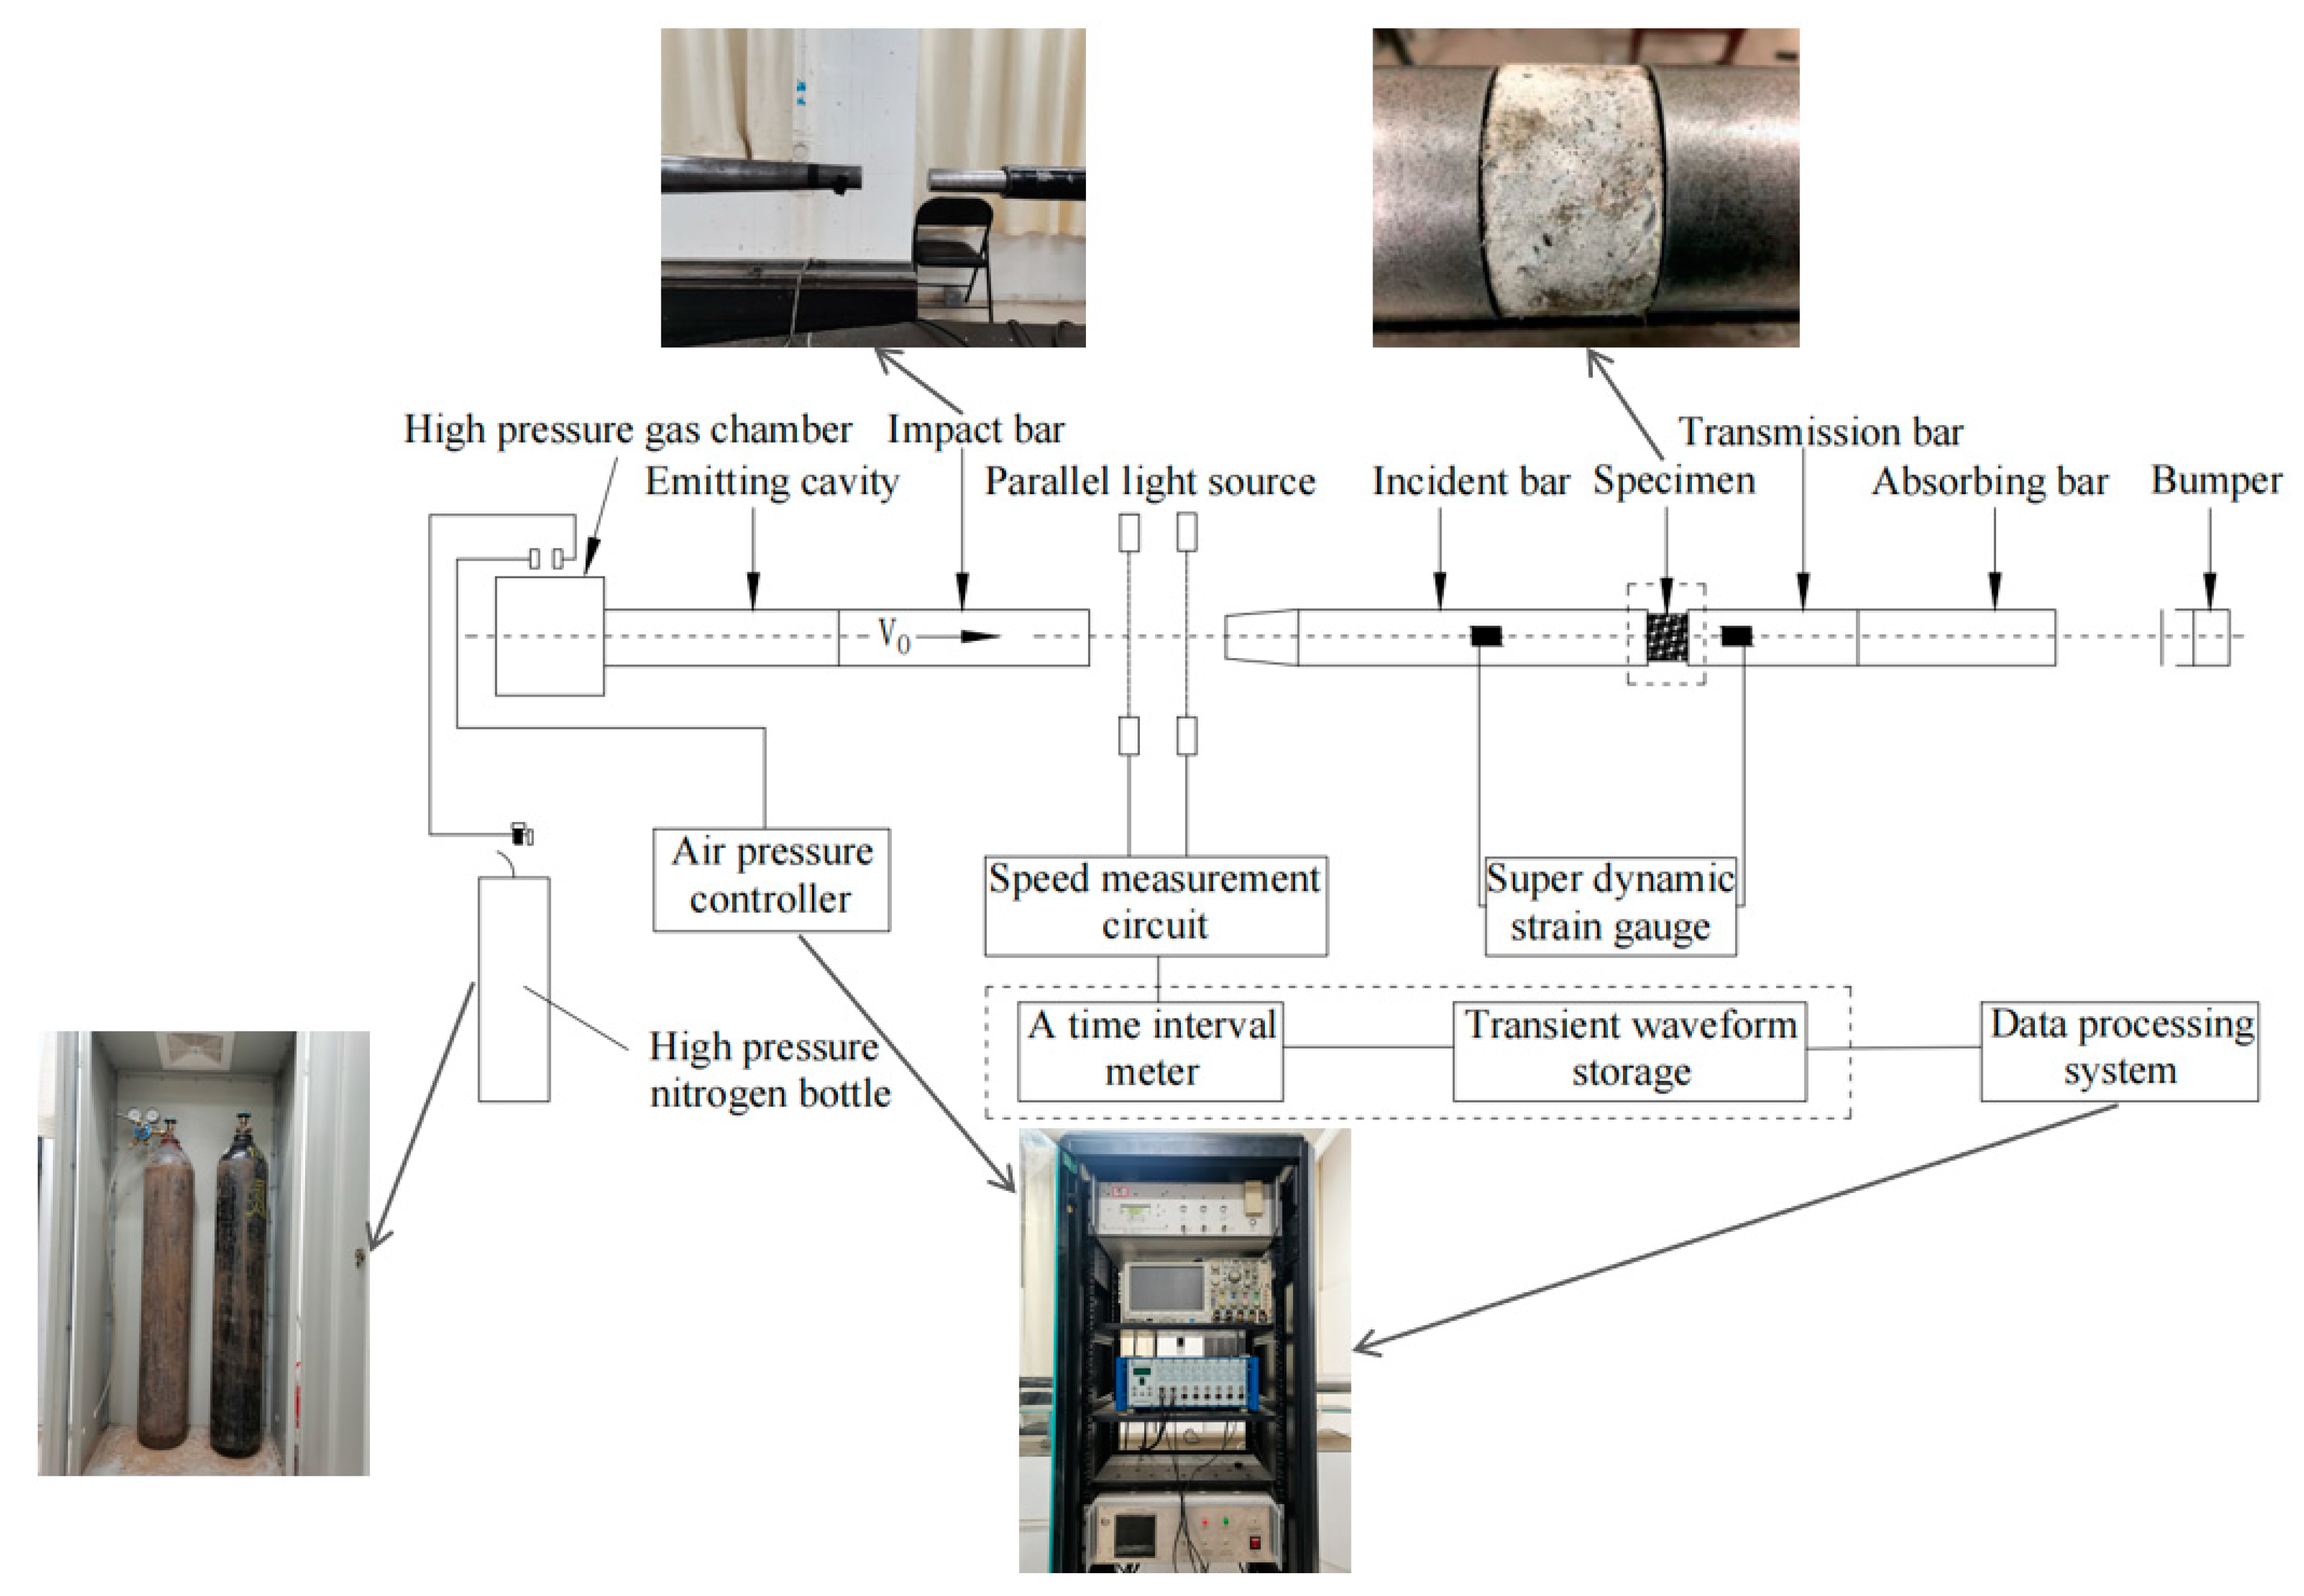
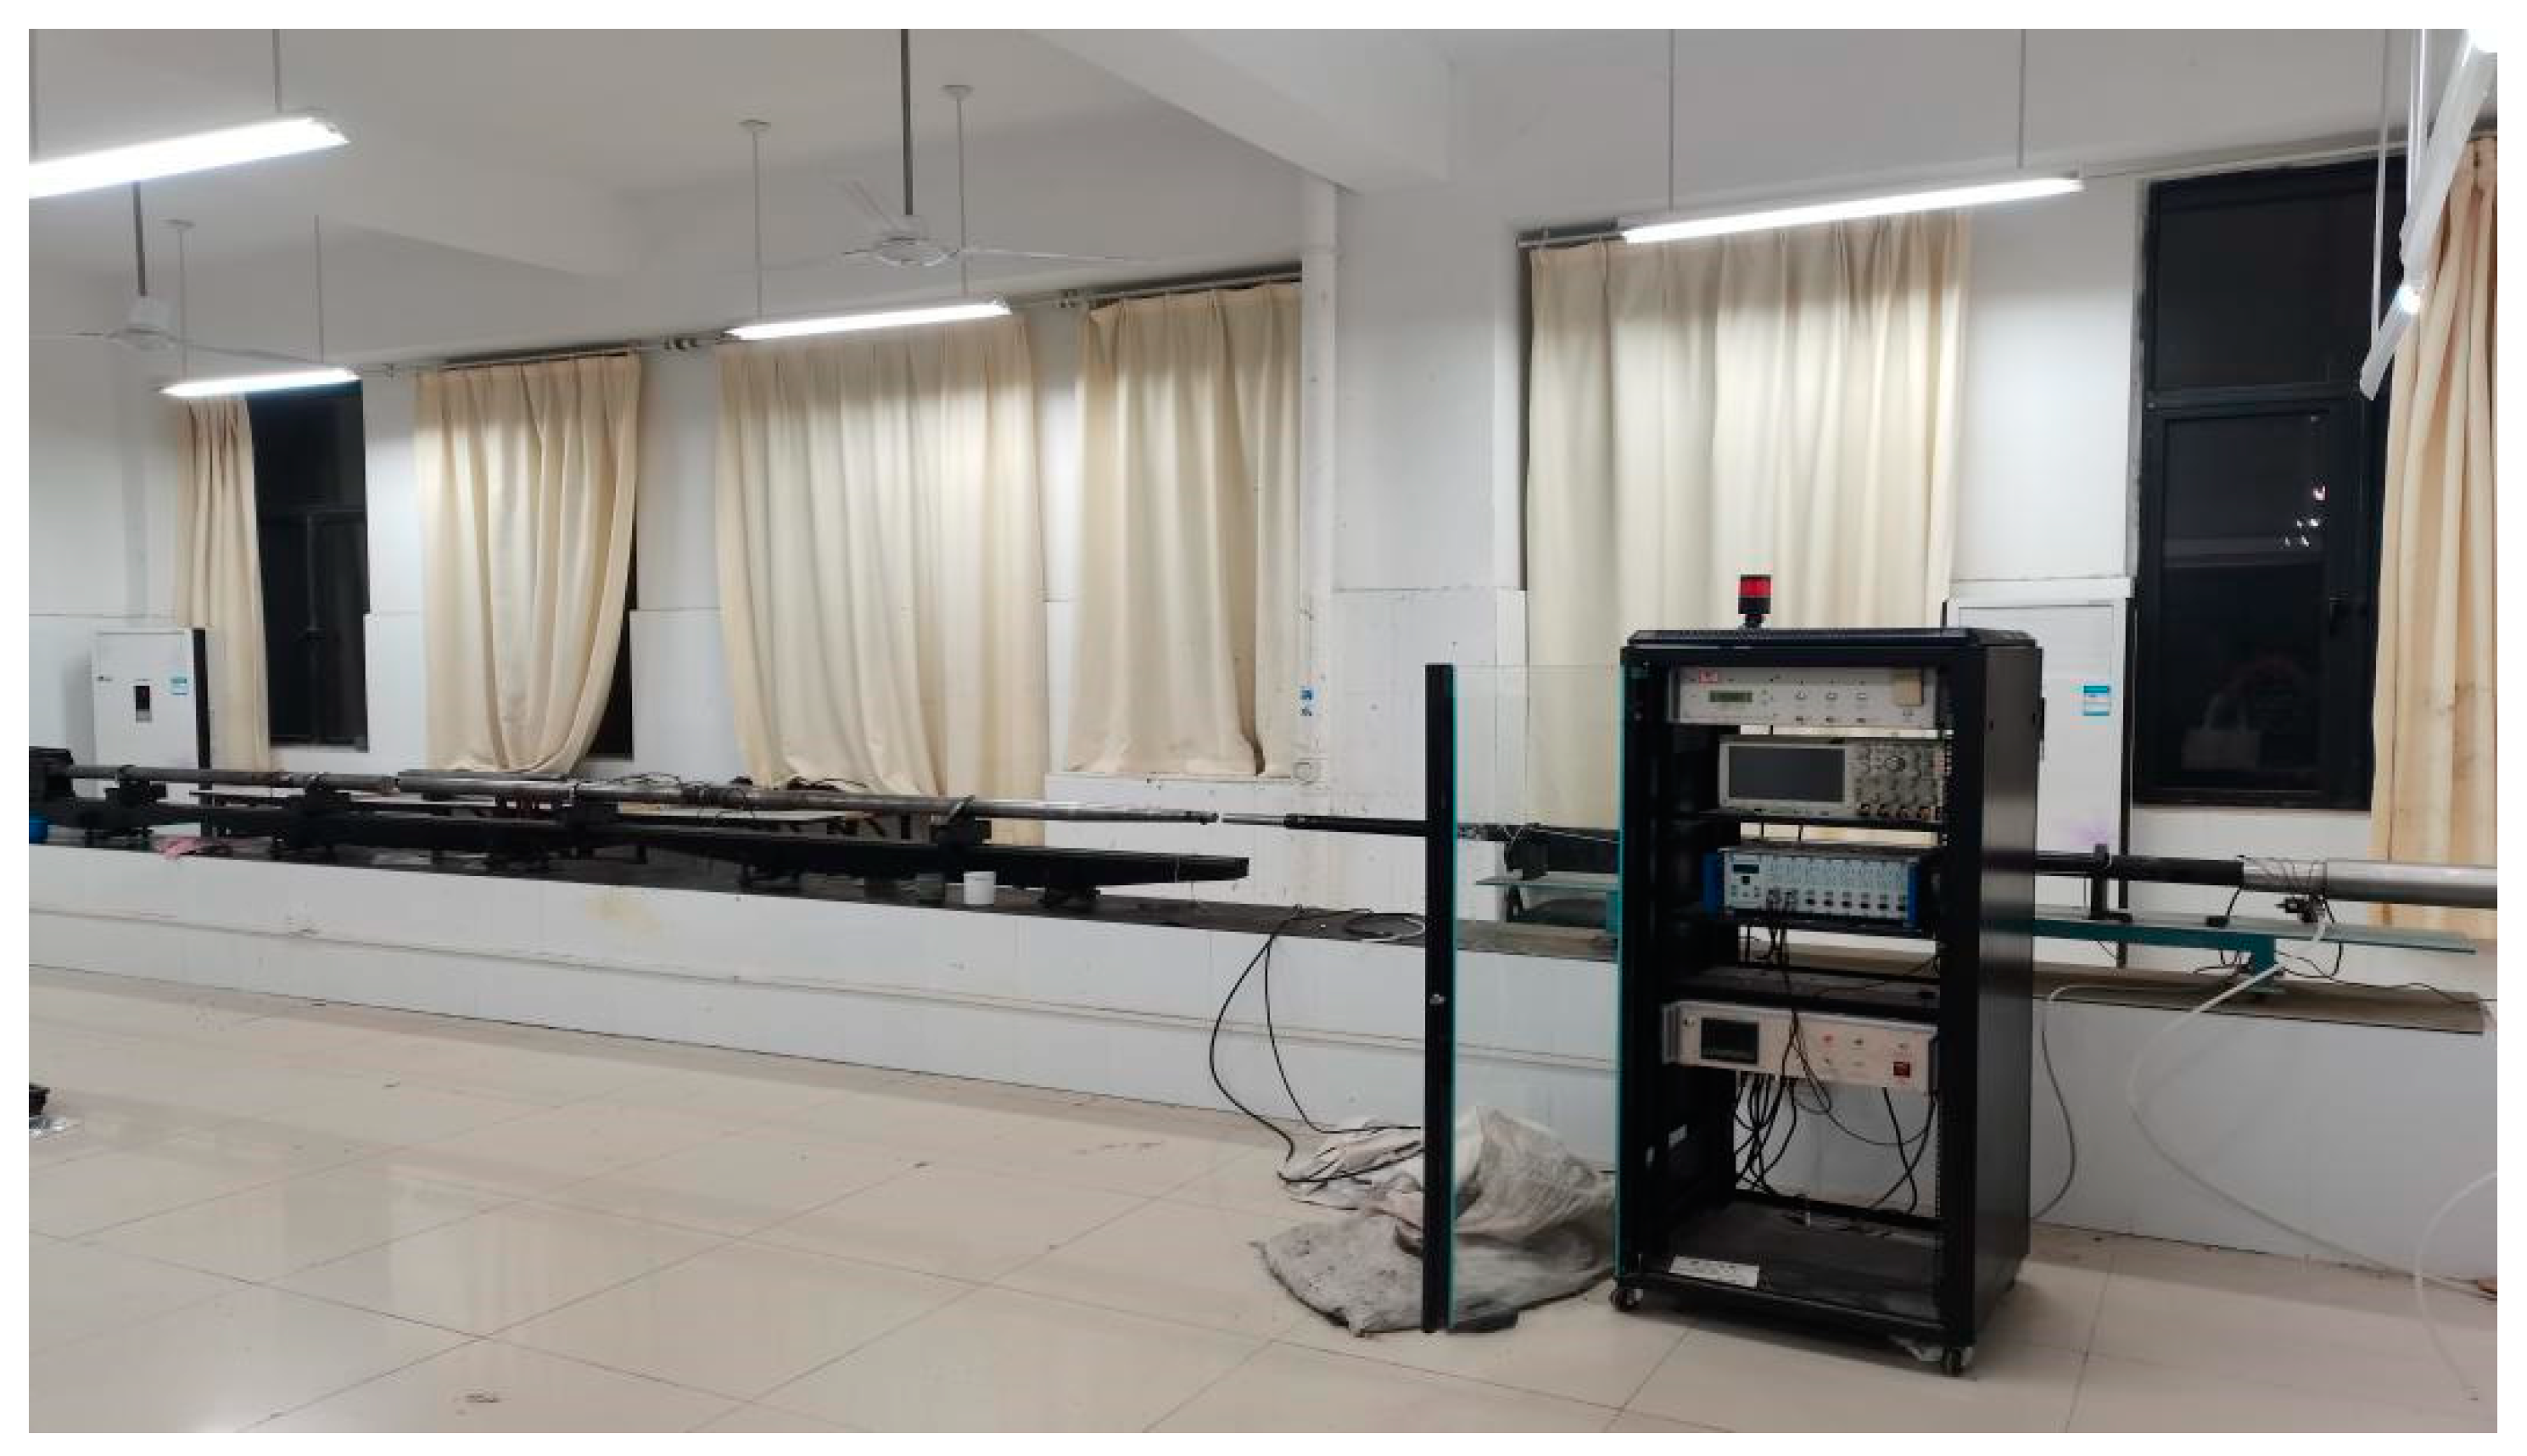
2.3. Test Equipment and Scheme
3. Dynamic Impact Test Results and Analysis
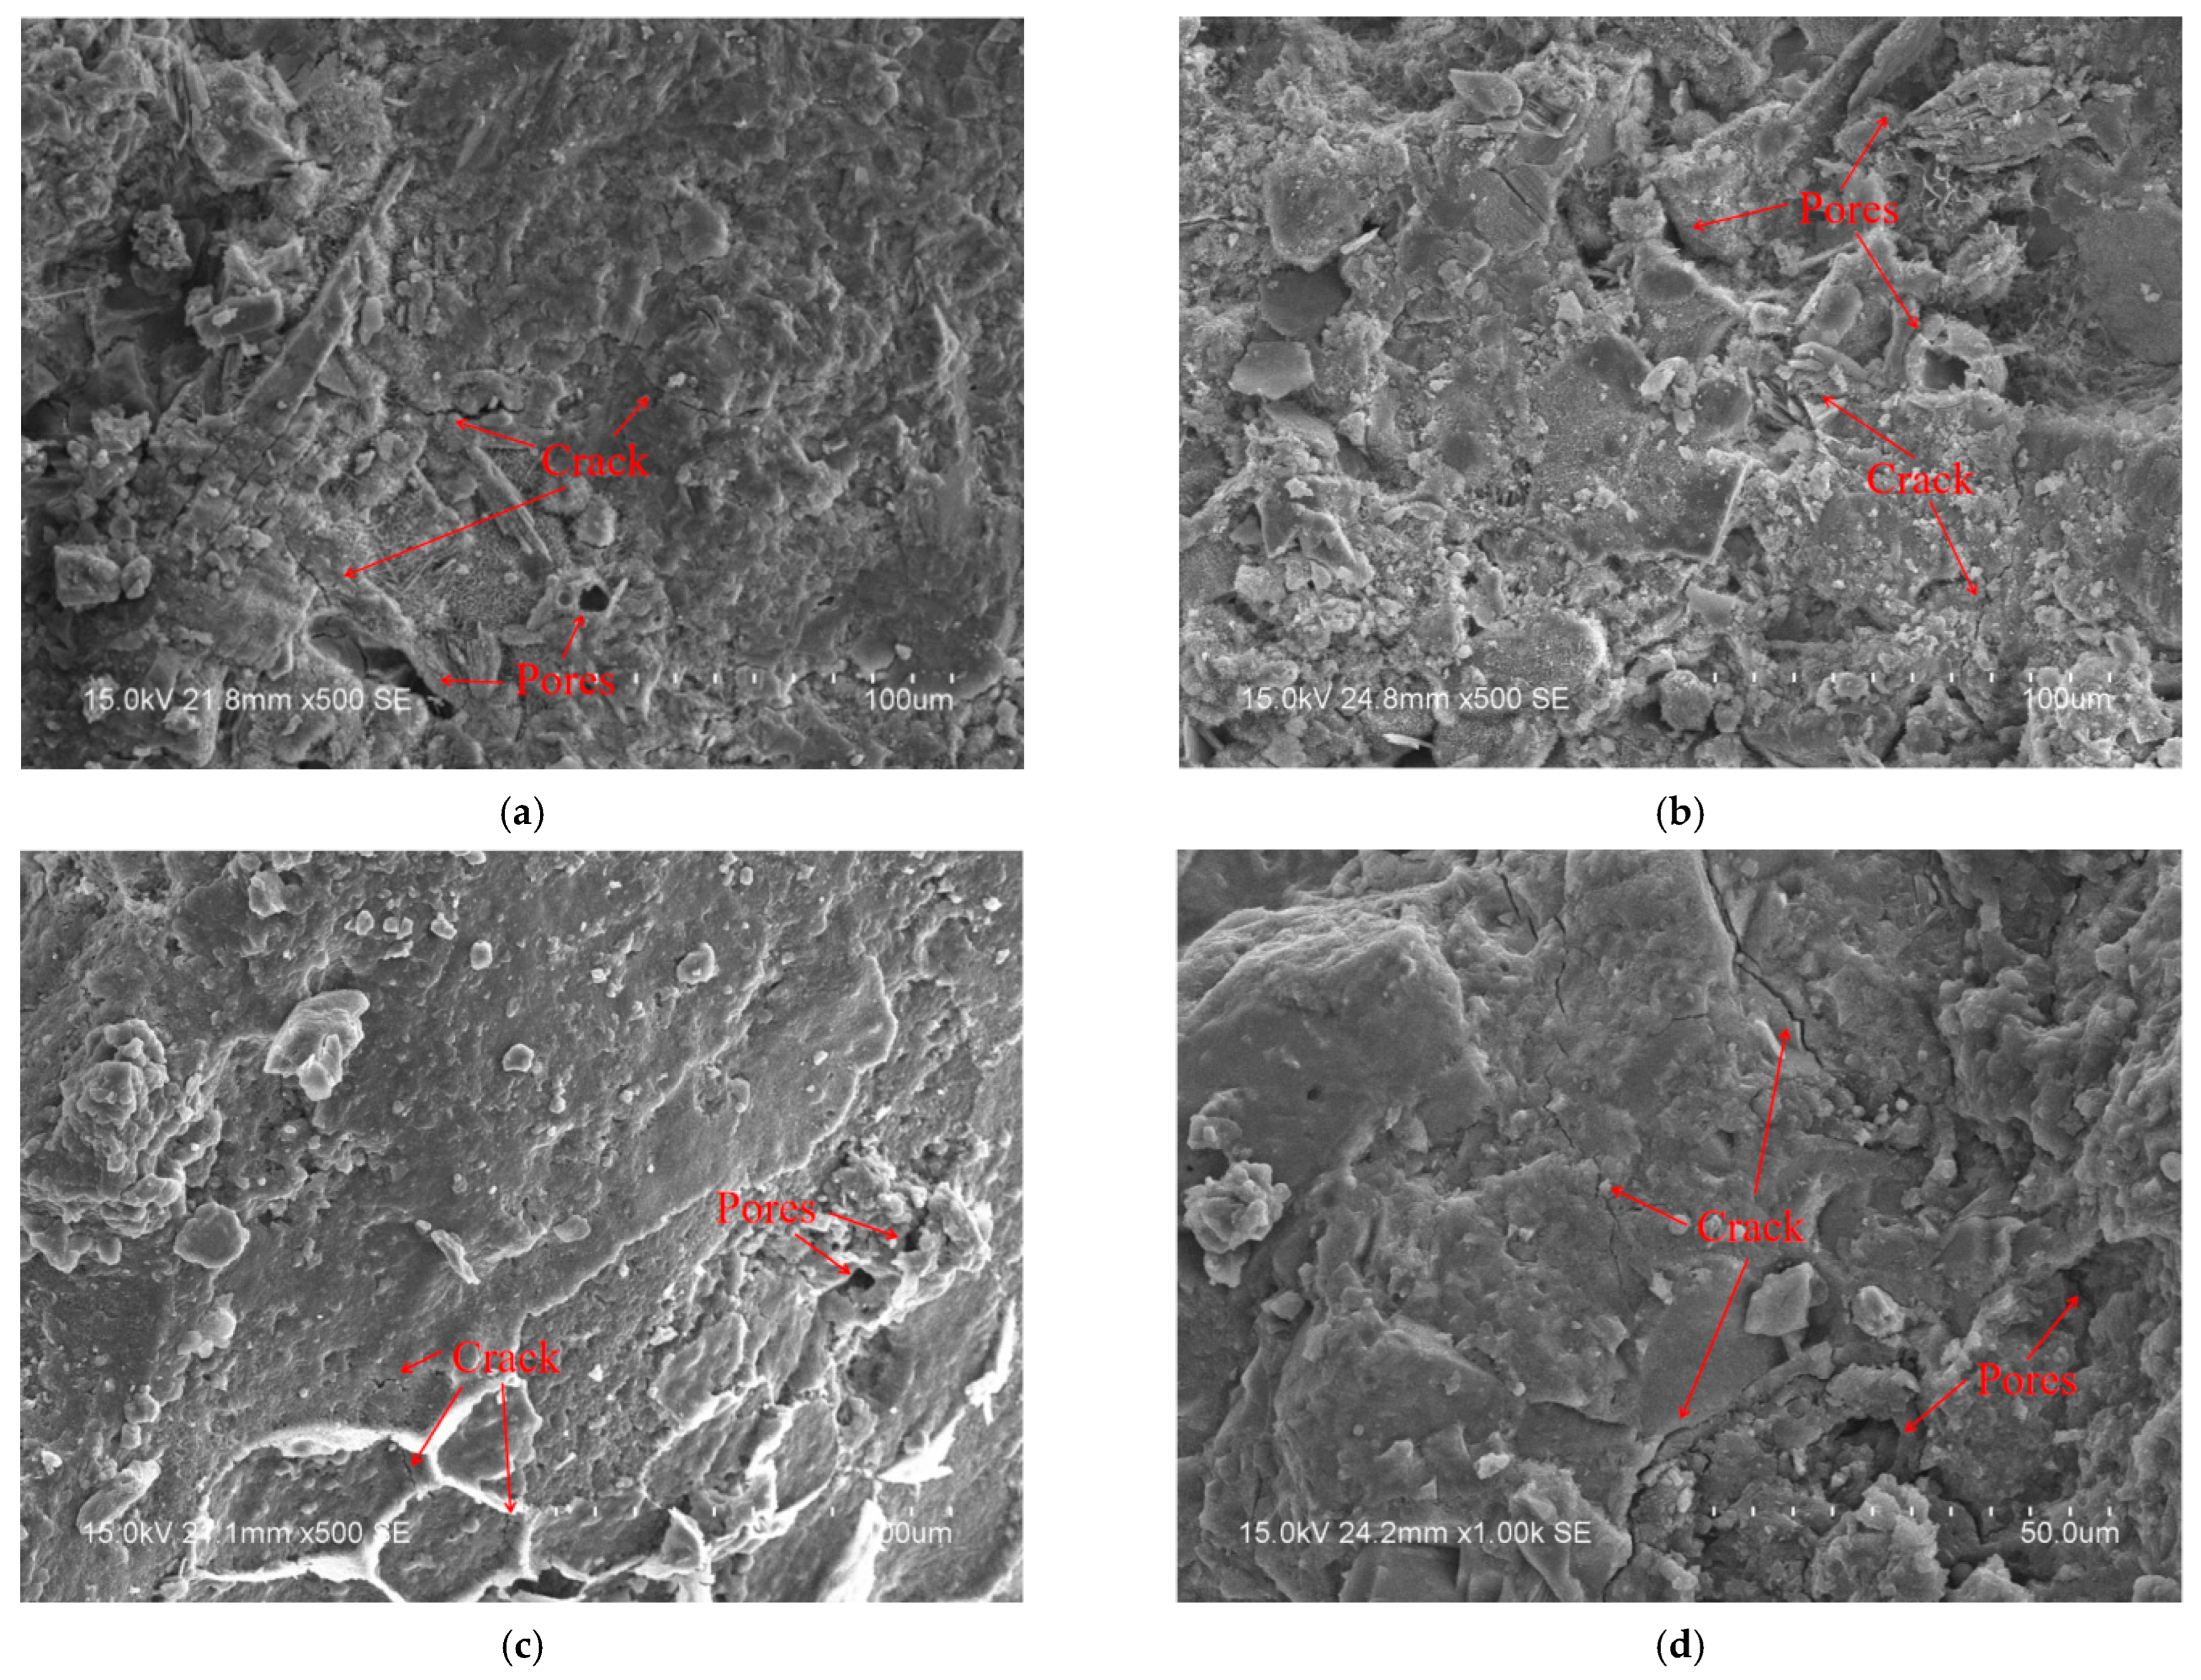
3.1. Microstructure Analysis of Freeze–Thaw Cycle
3.2. Test Failure Mode
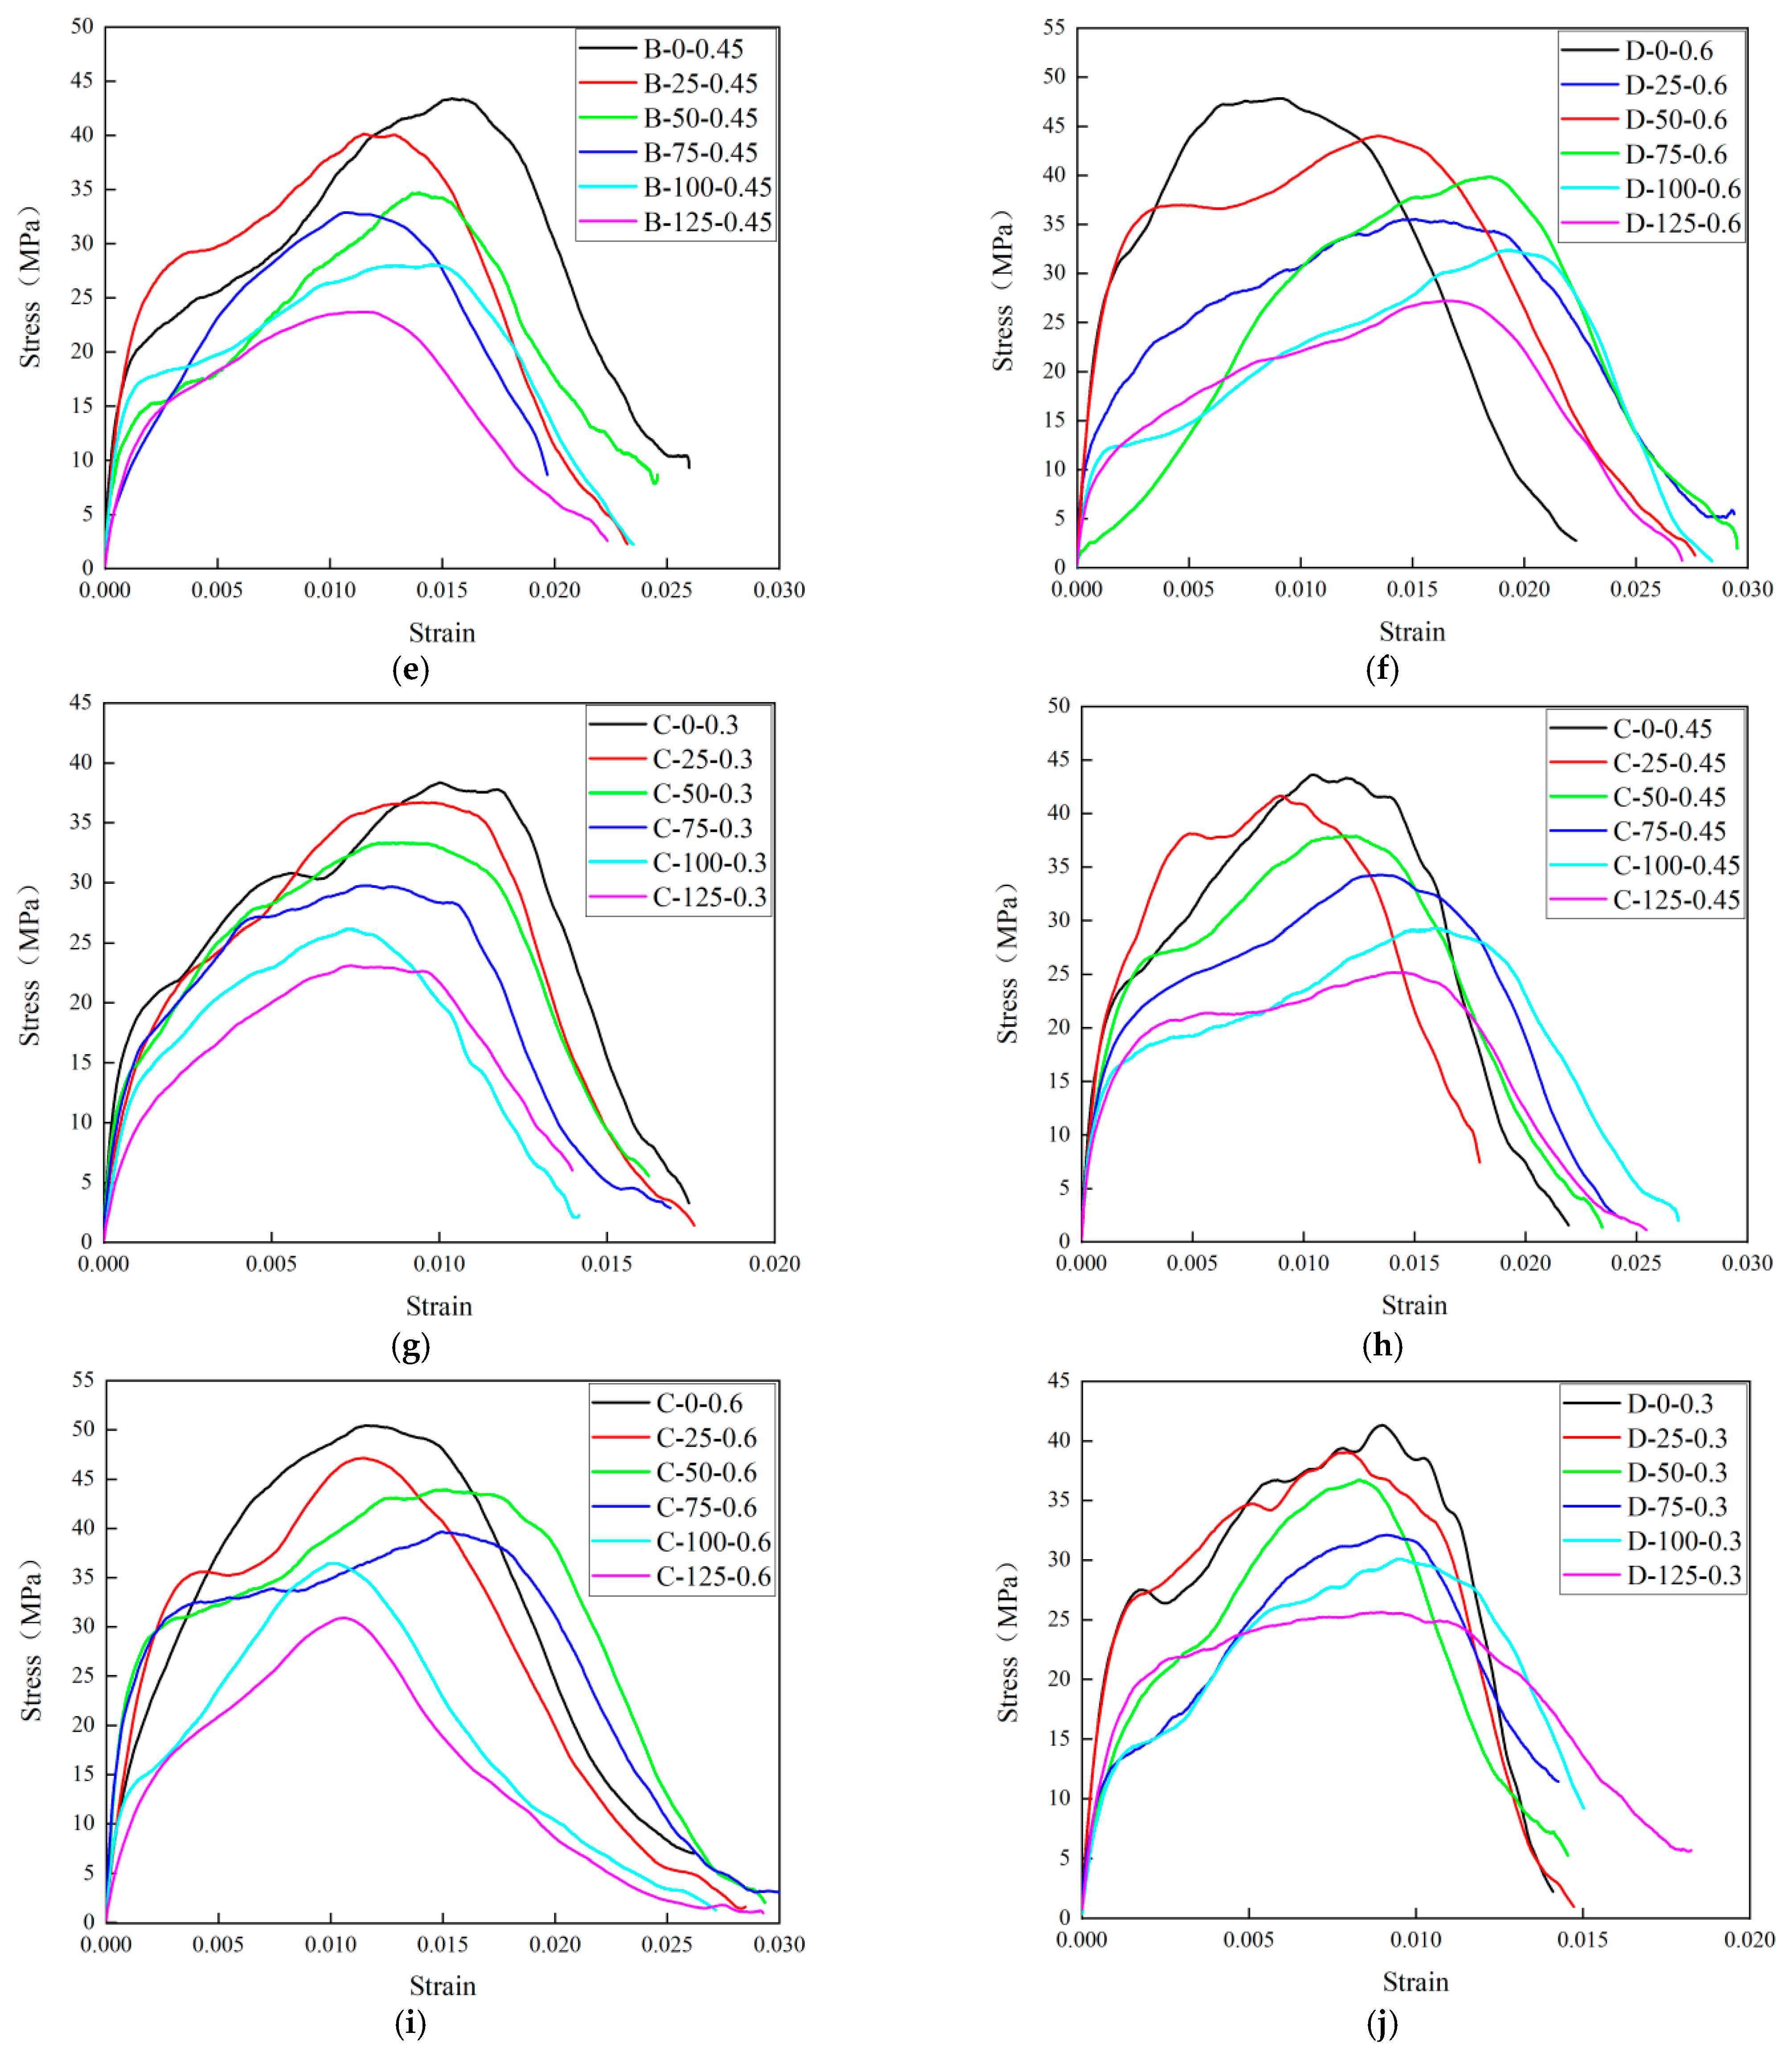
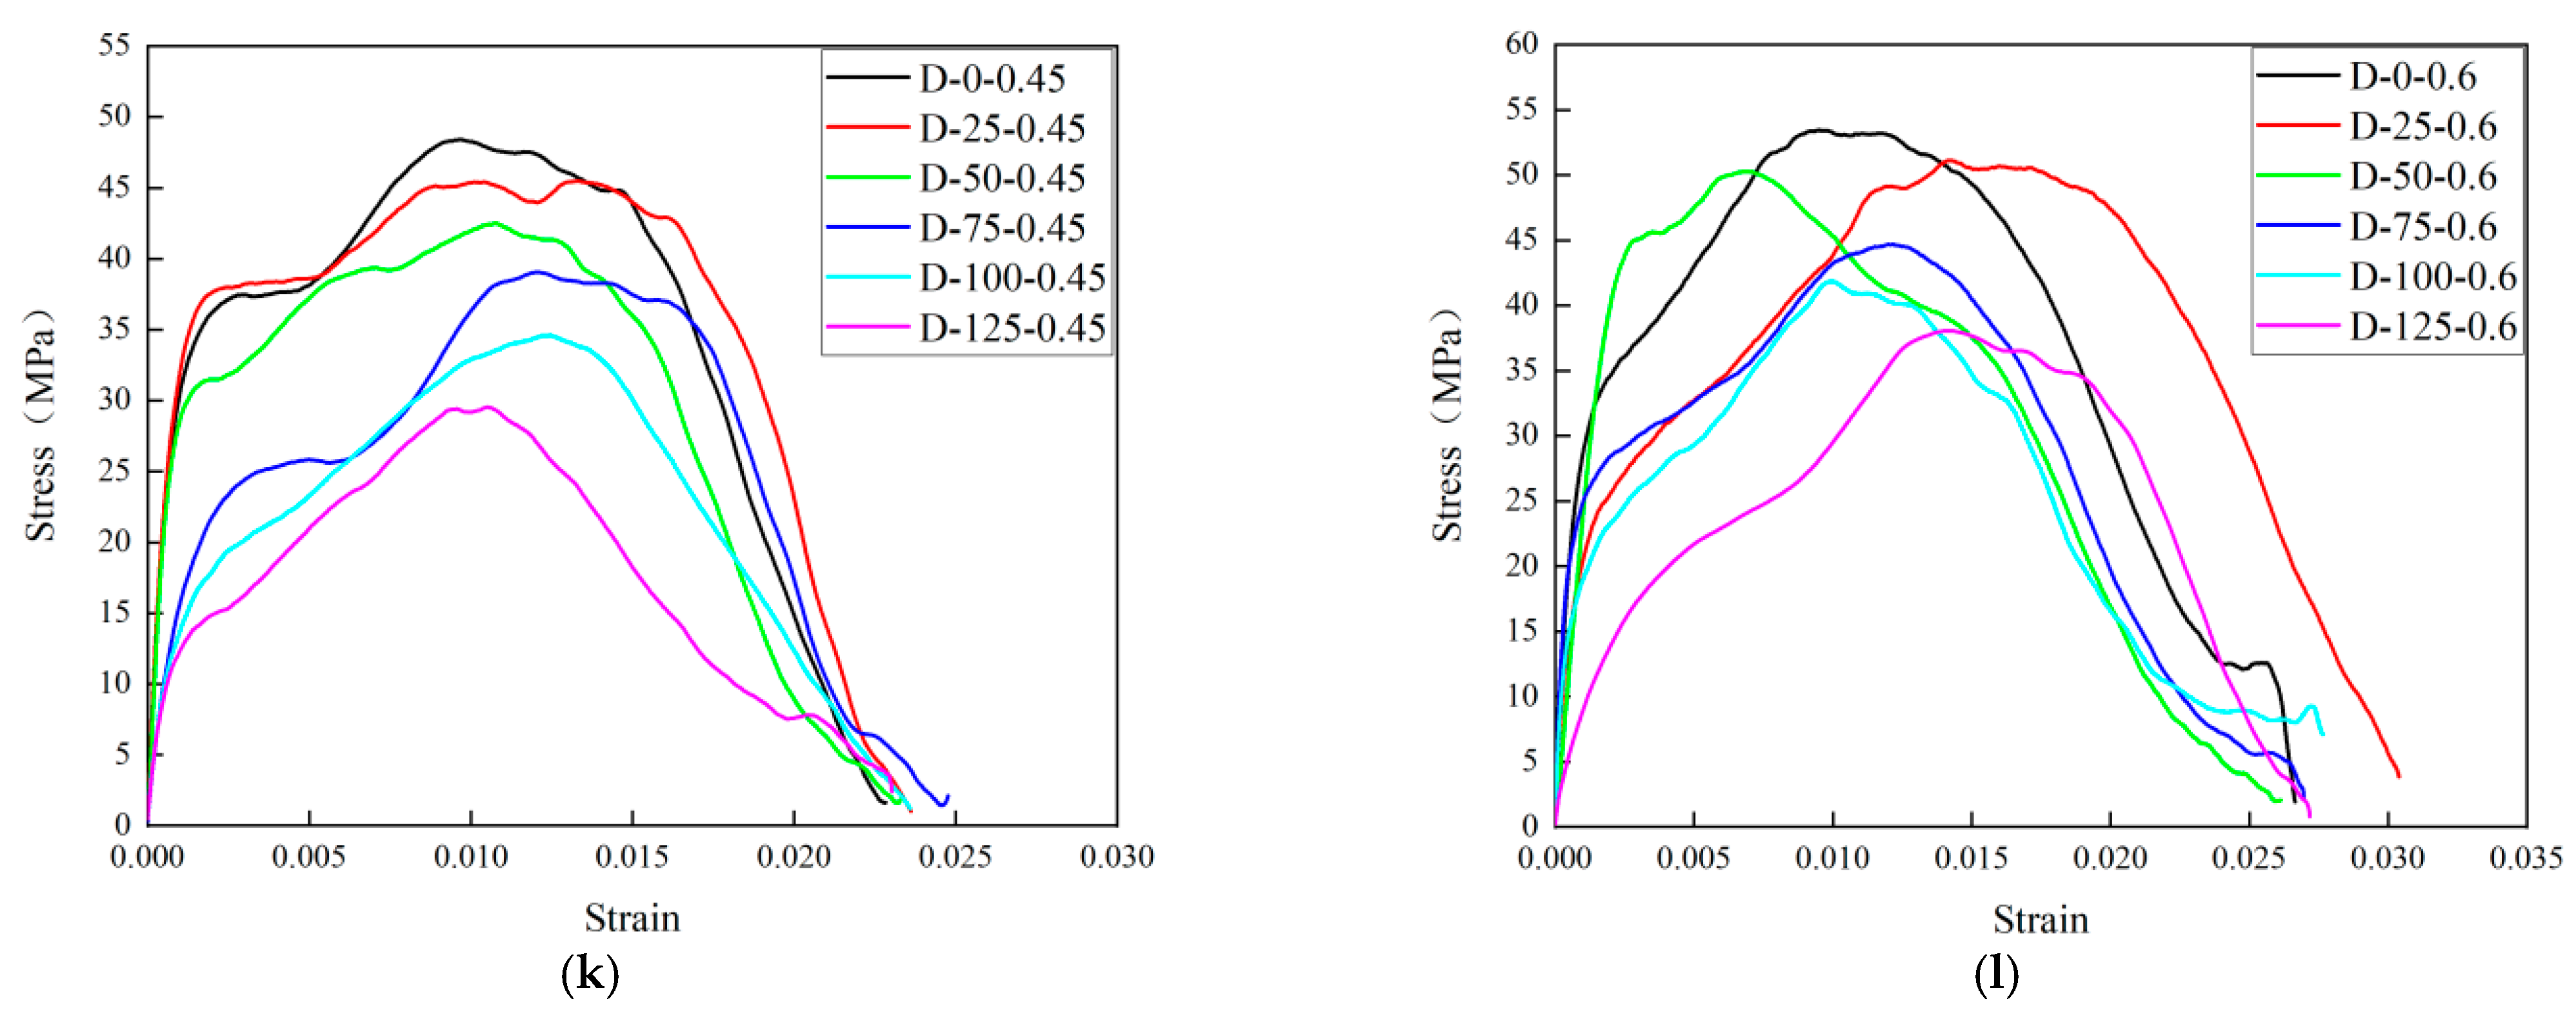
3.3. Stress–Strain Curve
3.4. Analysis of the Relationship between Dynamic Peak Stress and Strain Rate
3.5. Analysis of the Relationship between Dynamic Peak Stress and the Number of Freeze–Thaw Cycles
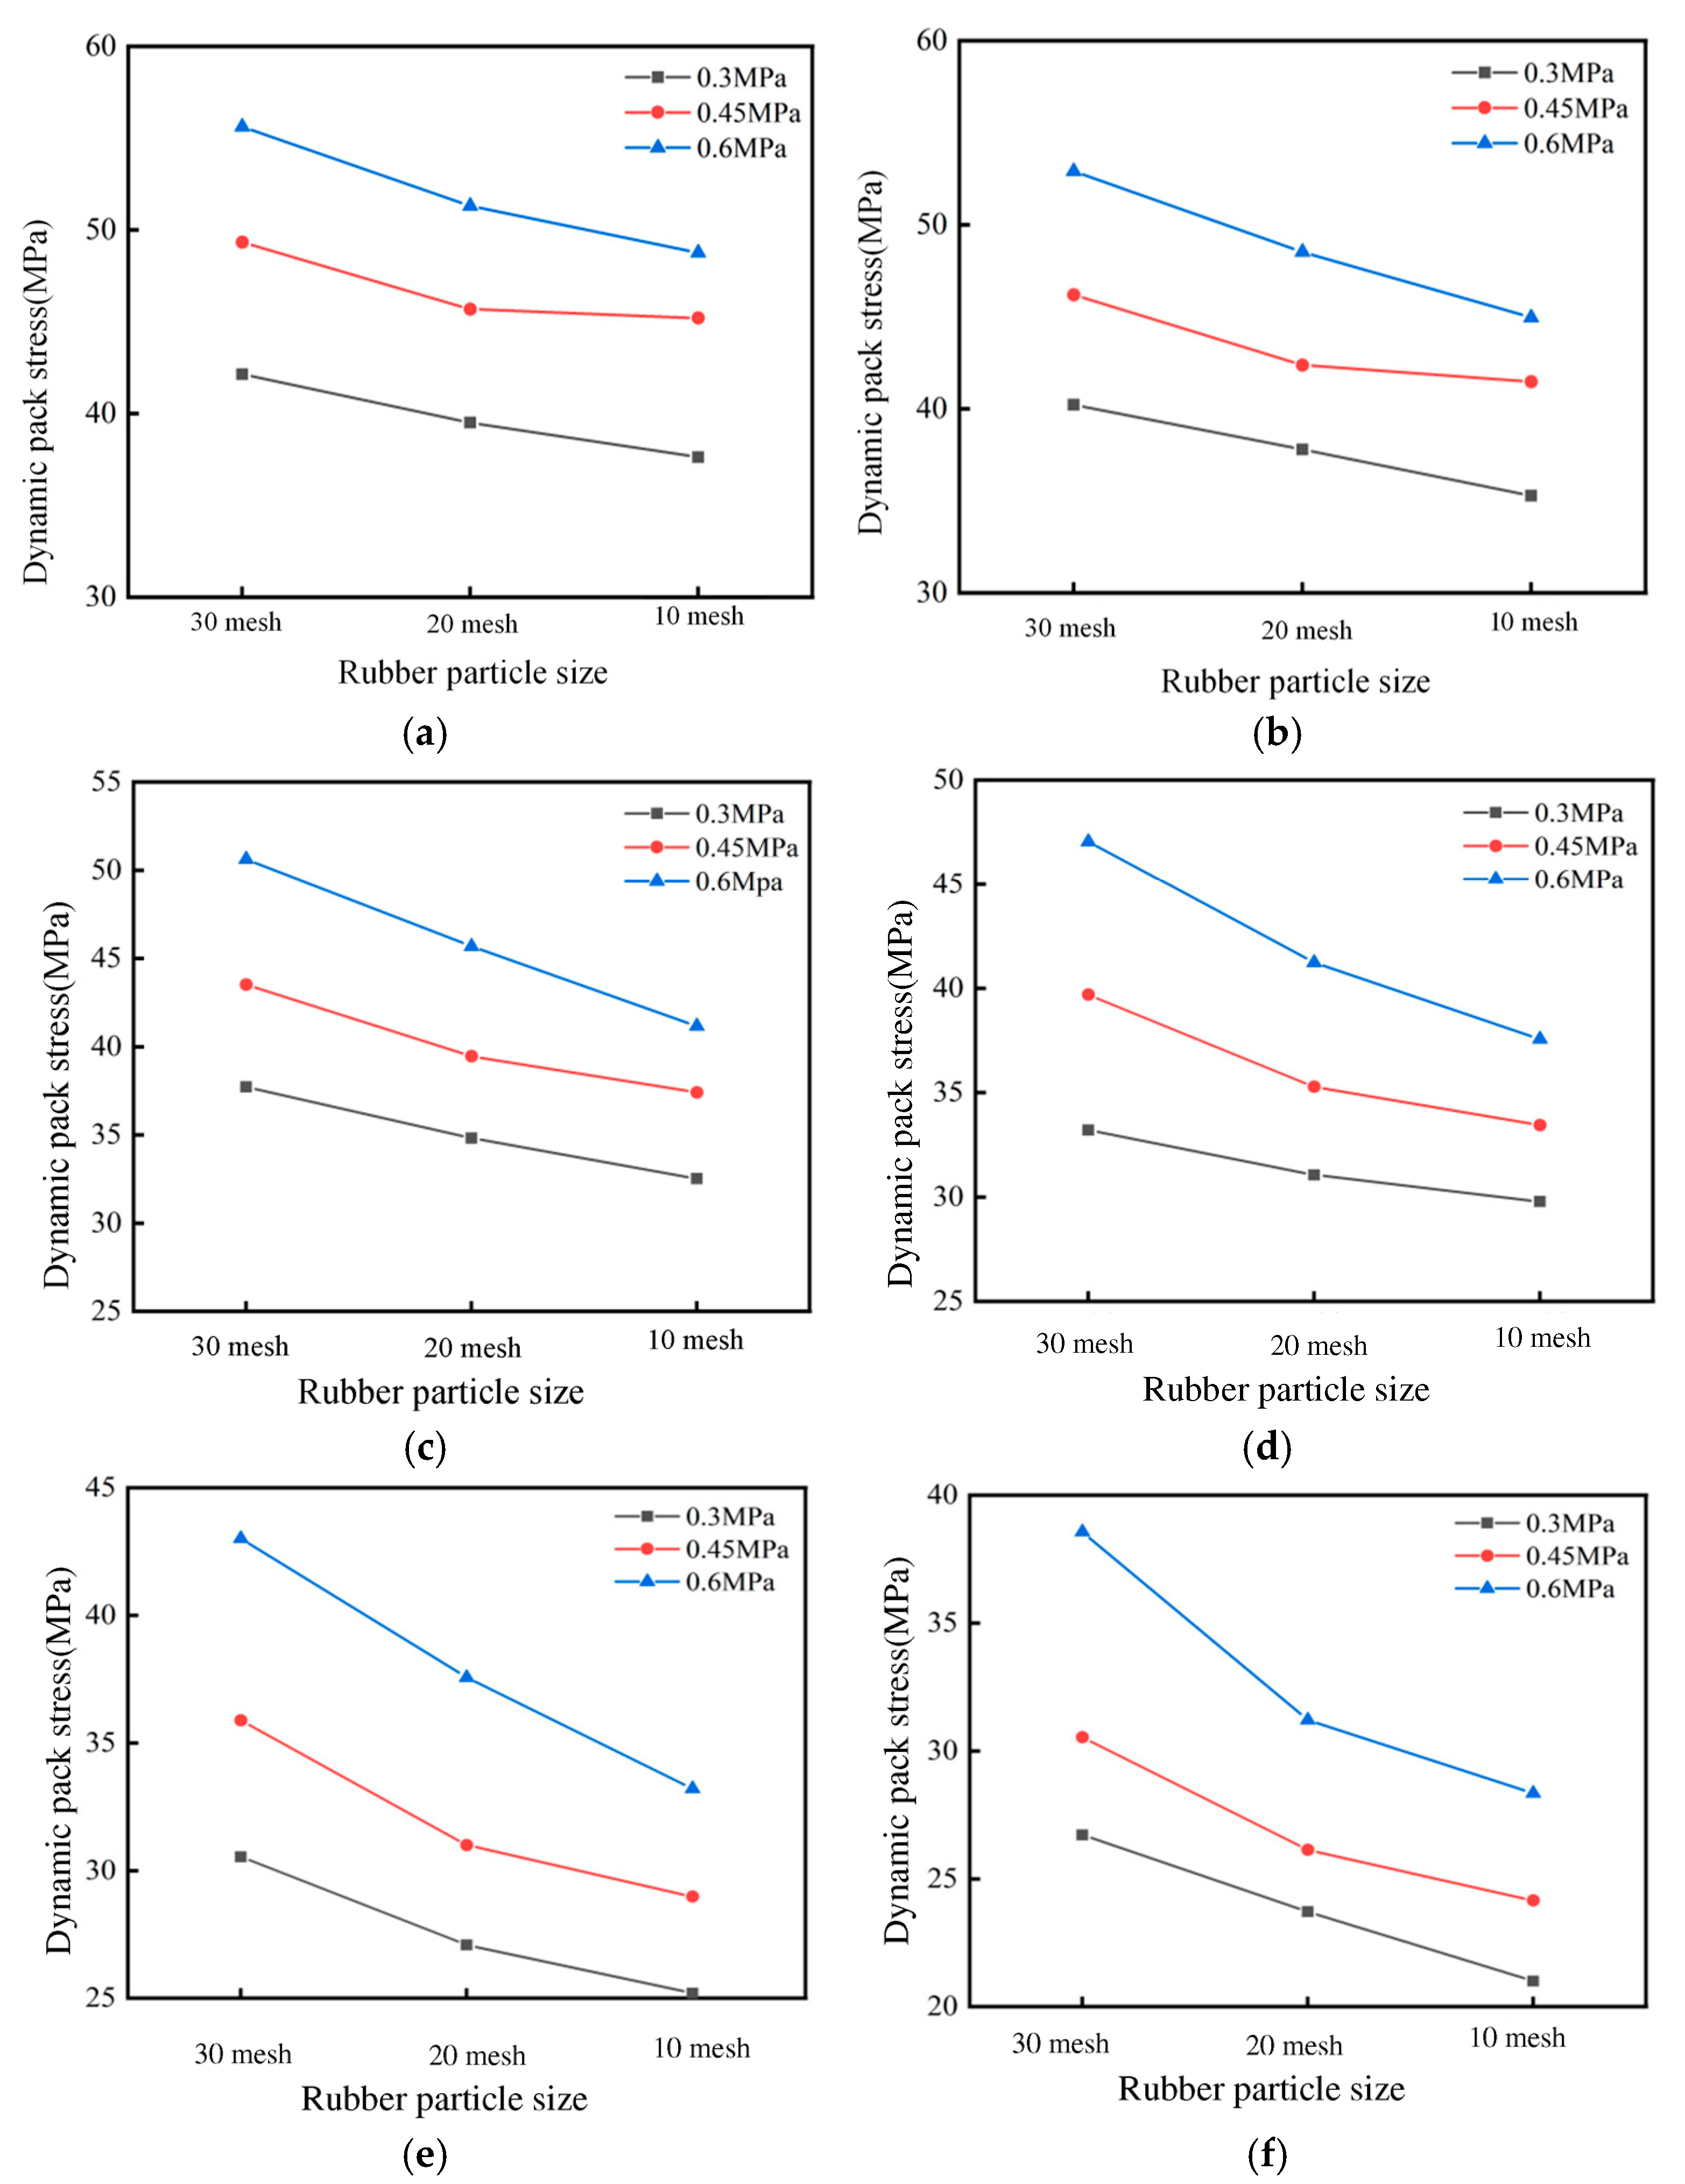
3.6. Analysis of the Relationship between Dynamic Peak Stress and Rubber Particle Size under Different Freeze–Thaw Cycles and Impact Pressure
4. Conclusions
- (1)
- Under impact load, the concrete specimens show the coexistence of tensile failure and crushing failure mode, and the increase in impact pressure makes the fracture degree of the specimens increase. Under the same impact pressure, the crushing degree of ordinary concrete specimens is higher than that of rubber concrete specimens. After freeze–thaw cycles, rubber concrete still maintains a certain degree of integrity under high-pressure impact. The small pieces of debris on the edge of the specimen are peeled off, and the overall state is loose and not scattered. The incorporation of rubber particles can effectively improve the frost resistance and impact resistance of concrete.
- (2)
- Under impact load, as the strain rate increases, the dynamic peak stress of the specimen increases. There is a positive correlation between the strain rate and the dynamic peak stress, and there is also a positive correlation between the strain rate and the impact pressure. Under impact load, the peak stress of the 30-mesh rubber concrete specimen decreased the least after freeze–thaw cycles, and the peak stress was higher than that of the 10-mesh and 20-mesh rubber concrete specimens. Therefore, the incorporation of 30-mesh rubber in this experiment had the best effect on the frost resistance and impact resistance of concrete.
- (3)
- From the SEM analysis results, it can be seen that the incorporation of rubber particles makes the concrete denser, the number of large holes decreases, and more small pores are introduced. These pores alleviate the water pressure during the freeze–thaw process of concrete and the volume increases occurring during water freezing, and the degree of internal damage after freeze–thaw is relatively small. At the same time, rubber has a certain elasticity, which can effectively improve the impact resistance and integrity of concrete.
Author Contributions
Funding
Data Availability Statement
Acknowledgments
Conflicts of Interest
References
- Karacasua, M.; Er, A.; Okur, V. Energy Efficiency of Rubberized Asphalt Concrete Under Low-temperature Conditions. Procedia—Soc. Behav. Sci. 2012, 54, 1242–1249. [Google Scholar] [CrossRef]
- Kardos, A.J.; Durham, S.A. Strength, durability, and environmental properties of concrete utilizing recycled tire particles for pavement applications. Constr. Build. Mater. 2015, 98, 832–845. [Google Scholar] [CrossRef]
- Turatsinze, A.; Measson, M.; Faure, J.-P. Rubberised concrete: From laboratory findings to field experiment validation. Int. J. Pavement Eng. 2018, 19, 883–892. [Google Scholar] [CrossRef]
- Li, W.; Huang, Z.; Wang, X.C.; Zhang, J.P. Study on the Basic Performance and Noise Characteristics of Rubber Cement Concrete of Modified Latex. Adv. Mater. Res. 2014, 953–954, 1524–1527. [Google Scholar] [CrossRef]
- Al-Tayeb, M.M.; Abu Bakar, B.; Ismail, H.; Akil, H.M. Effect of partial replacement of sand by recycled fine crumb rubber on the performance of hybrid rubberized-normal concrete under impact load: Experiment and simulation. J. Clean. Prod. 2013, 59, 284–289. [Google Scholar] [CrossRef]
- Meng, L.; Li, C. Dynamic mechanical behaviour of recycled crumb rubber concrete materials subjected to repeated impact. Mater. Res. Innov. 2015, 19 (Suppl. S8), S8-496–S8-501. [Google Scholar]
- Zhu, Q.; Dai, H.; Chen, D.; Liang, Z. Study on Influence of Waste Tire Rubber Particles on Concrete Crack Resistance at Early Age. IOP Conf. Series Earth Environ. Sci. 2019, 242, 052060. [Google Scholar] [CrossRef]
- Gholampour, A.; Ozbakkaloglu, T.; Hassanli, R. Use of Fine Rubber Particles as Fine Concrete Aggregates in Actively Confined Concrete. Key Eng. Mater. 2017, 729, 122–127. [Google Scholar] [CrossRef]
- Bensaci, H.; Menadi, B.; Kenai, S.; Yahiaoui, W. Performance of self-compacting rubberized concrete. MATEC Web Conf. 2018, 149, 01070. [Google Scholar]
- Huang, X.; Pang, J.; Liu, G.; Chen, Y. The influence of equal amplitude high stress repeated loading on the mechanical and deformation characteristics of rubber concrete. Constr. Build. Mater. 2021, 266, 121135. [Google Scholar] [CrossRef]
- Thomas, B.S.; Gupta, R.C.; Mehra, P.; Kumar, S. Performance of high strength rubberized concrete in aggressive environment. Constr. Build. Mater. 2015, 83, 320–326. [Google Scholar] [CrossRef]
- Zhu, H.; Liang, J.; Xu, J.; Bo, M.; Li, J.; Tang, B. Research on anti-chloride ion penetration property of crumb rubber concrete at different ambient temperatures. Constr. Build. Mater. 2018, 189, 42–53. [Google Scholar] [CrossRef]
- Gupta, T.; Siddique, S.; Sharma, R.K.; Chaudhary, S. Behaviour of waste rubber powder and hybrid rubber concrete in aggressive environment. Constr. Build. Mater. 2019, 217, 283–291. [Google Scholar] [CrossRef]
- Grinys, A.; Augonis, A.; Daukšys, M.; Pupeikis, D. Mechanical properties and durability of rubberized and SBR latex modified rubberized concrete. Constr. Build. Mater. 2020, 248, 118584. [Google Scholar] [CrossRef]
- Rahul, K.; Manvendra, V.; Nirendra, D.; Nitin, L. Influence of chloride and sulfate solution on the long-term durability of modified rubberized concrete. J. Appl. Polym. Sci. 2022, 139, e52880. [Google Scholar]
- Bengar, H.A.; Shahmansouri, A.A.; Sabet, N.A.Z.; Kabirifar, K.; Tam, V.W. Impact of elevated temperatures on the structural performance of recycled rubber concrete: Experimental and mathematical modeling. Constr. Build. Mater. 2020, 255, 119374. [Google Scholar] [CrossRef]
- Pham, T.M.; Renaud, N.; Pang, V.; Shi, F.; Hao, H.; Chen, W. Effect of rubber aggregate size on static and dynamic compressive properties of rubberized concrete. Struct. Concr. 2021, 23, 2510–2522. [Google Scholar] [CrossRef]
- Feng, W.; Liu, F.; Yang, F.; Jing, L.; Li, L.; Li, H.; Chen, L. Compressive behaviour and fragment size distribution model for failure mode prediction of rubber concrete under impact loads. Constr. Build. Mater. 2020, 273, 121767. [Google Scholar] [CrossRef]
- Kadhim, A.A.; Al-Mutairee, H.M.K. An Experimental Study on Behavior of Sustainable Rubberized Concrete Mixes. Civ. Eng. J. 2020, 6, 1273–1285. [Google Scholar] [CrossRef]
- Safeer, A.; Ayesha, F.; Saleem, K.S.M.; Junaid, M.M.; Shahid, A.; Ali, R.M. Effect of Particle Sizes and Dosages of Rubber Waste on the Mechanical Properties of Rubberized Concrete Composite. Appl. Sci. 2022, 12, 8460. [Google Scholar]
- Zhang, J.; Zhang, G.; Sun, X.; Pan, W.; Huang, P.; Li, Z.; Zhang, B.; Zhou, X. An Experimental Study on the Compressive Dynamic Performance of Rubber Concrete under Freeze-Thaw Cycles. Adv. Civ. Eng. 2021, 2021, 6655799. [Google Scholar] [CrossRef]
- Sukontasukkul, P. Use of crumb rubber to improve thermal and sound properties of pre-cast concrete panel. Constr. Build. Mater. 2008, 23, 1084–1092. [Google Scholar] [CrossRef]
- Zhang, B.; Poon, C.S. Sound insulation properties of rubberized lightweight aggregate concrete. J. Clean. Prod. 2018, 172, 3176–3185. [Google Scholar] [CrossRef]
- Azmi, A.A.; Abdullah, M.M.A.B.; Ghazali, C.M.R.; Sandu, A.V.; Hussin, K. A Review—Manufacturing on Rubberized Concrete Filled Recycled Tire Rubber. Key Eng. Mater. 2015, 660, 249–253. [Google Scholar] [CrossRef]
- Thomas, B.S.; Gupta, R.C. A comprehensive review on the applications of waste tire rubber in cement concrete. Renew. Sustain. Energy Rev. 2016, 54, 1323–1333. [Google Scholar] [CrossRef]
- Sulagno, B.; Aritra, M.; Jessy, R. Studies on Mechanical Properties of Tyre Rubber Concret. Int. J. Civ. Eng. 2016, 3, 18–21. [Google Scholar]
- Yang, G.; Chen, X.; Xuan, W.; Chen, Y. Dynamic compressive and splitting tensile properties of concrete containing recycled tyre rubber under high strain rates. Sadhana 2018, 43, 178. [Google Scholar] [CrossRef]
- Luo, D.; Xie, Y.; Su, X.; Wang, H.; Zhou, Y. Failure analysis of the damaged rubber concrete under the secondary load. Strength Fract. Complex. 2019, 12, 163–169. [Google Scholar] [CrossRef]
- GB/T 50081; Standard for Test Method of Mechanical Properties on Ordinary Concrete. Beijing Standards Press of China: Beijing, China, 2016.
- Li, L.; Qin, D.; Xu, Z.; Feng, Y. Study on Strengthening Mechanism of Epoxy Resin/Rubber Concrete Interface by Molecular Dynamics Simulation. Adv. Civ. Eng. 2022, 2022, 5100758. [Google Scholar] [CrossRef]
- Shan, R.; Song, Y.; Song, L.; Bai, Y. Dynamic property tests of frozen red sandstone using a split hopkinson pressure bar. Earthq. Eng. Eng. Vib. 2019, 18, 511–519. [Google Scholar]
- Gonen, T. Freezing-thawing and impact resistance of concretes containing waste crumb rubbers. Constr. Build. Mater. 2018, 177, 436–442. [Google Scholar] [CrossRef]
- Ismail, K.M.; Hassan, A.A. Abrasion and impact resistance of concrete before and after exposure to freezing and thawing cycles. Constr. Build. Mater. 2019, 215, 849–861. [Google Scholar] [CrossRef]
- Huang, C.; Chen, Y.; Wang, J.; Wang, Z.; Zhao, Q.; Zhu, L.; Wei, W.; Gao, Z. Study on dynamic compressive mechanical properties of freeze-thaw concrete. Constr. Build. Mater. 2022, 322, 126499. [Google Scholar] [CrossRef]


| Rubber Standard Mesh Number | 10 Mesh | 20 Mesh | 30 Mesh |
|---|---|---|---|
| Average particle size | 2.00 mm | 0.850 mm | 0.600 mm |
| Group Number | Fine Aggregate kg/m3 | Coarse Aggregate kg/m3 | Cement kg/m3 | Waste Tire Rubber | Water kg/m3 | Water-Reducing Admixture kg/m3 | |
|---|---|---|---|---|---|---|---|
| Mesh Number | Dosage kg/m3 | ||||||
| A | 581.43 | 1356.67 | 329.60 | 0 | 132.30 | 3.30 | |
| B | 581.43 | 1356.67 | 329.60 | 10 mesh | 58.14 | 132.30 | 3.30 |
| C | 581.43 | 1356.67 | 329.60 | 20 mesh | 58.14 | 132.30 | 3.30 |
| D | 581.43 | 1356.67 | 329.60 | 30 mesh | 58.14 | 132.30 | 3.30 |
| Group Number | 0.3 MPa | 0.45 MPa | 0.6 MPa | |
|---|---|---|---|---|
| A | 0 freeze–thaw cycles | 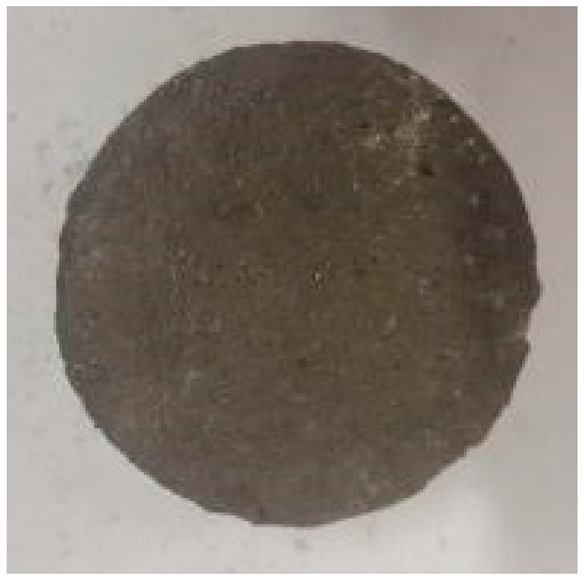 |  |  |
| 125 freeze–thaw cycles |  | 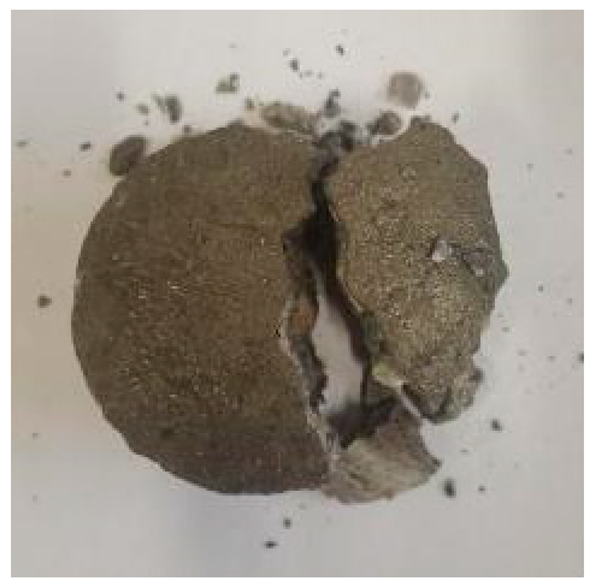 | 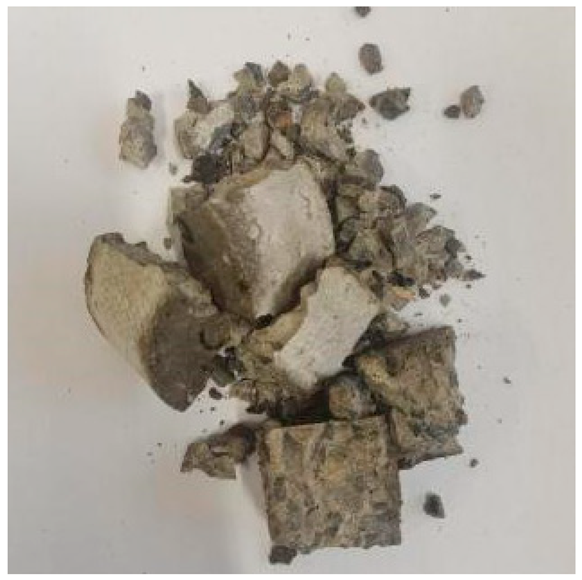 | |
| B | 0 freeze–thaw cycles | 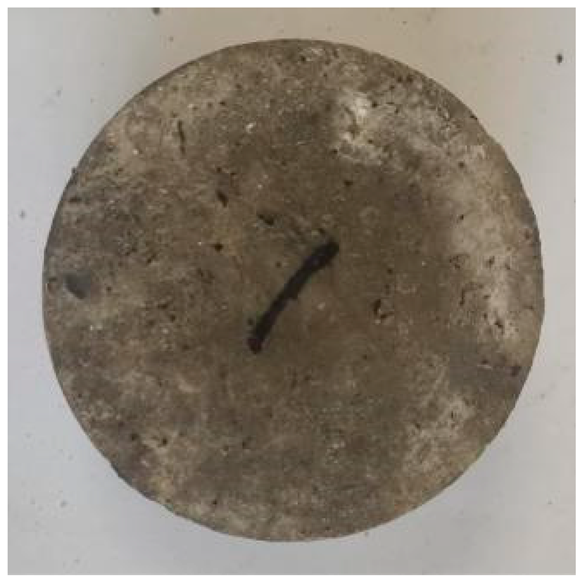 | 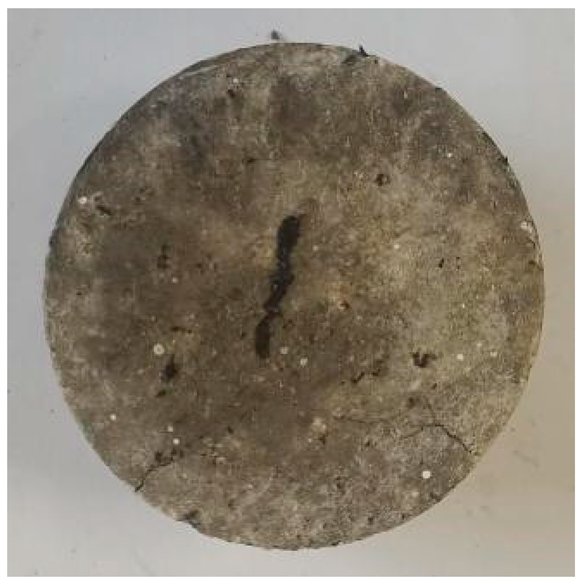 |  |
| 125 freeze–thaw cycles | 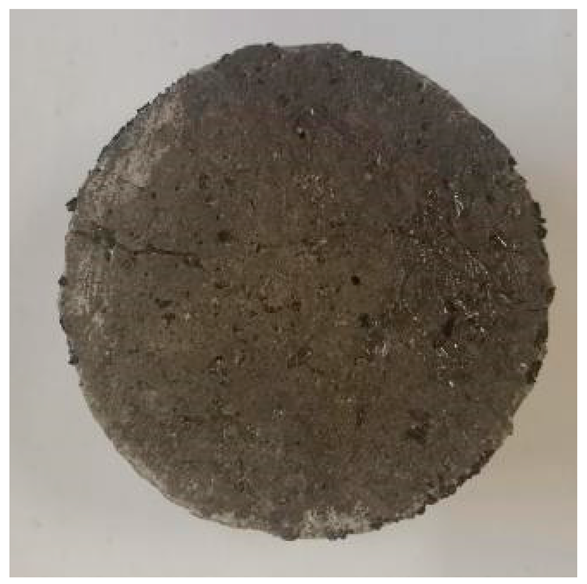 |  | 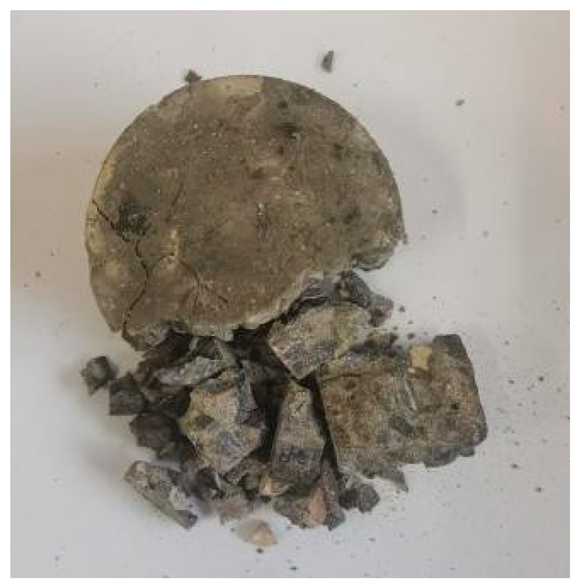 | |
| C | 0 freeze–thaw cycles |  |  | 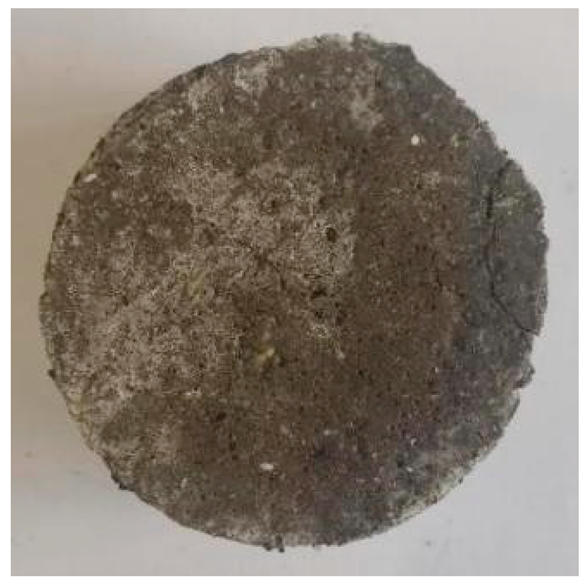 |
| 125 freeze–thaw cycles | 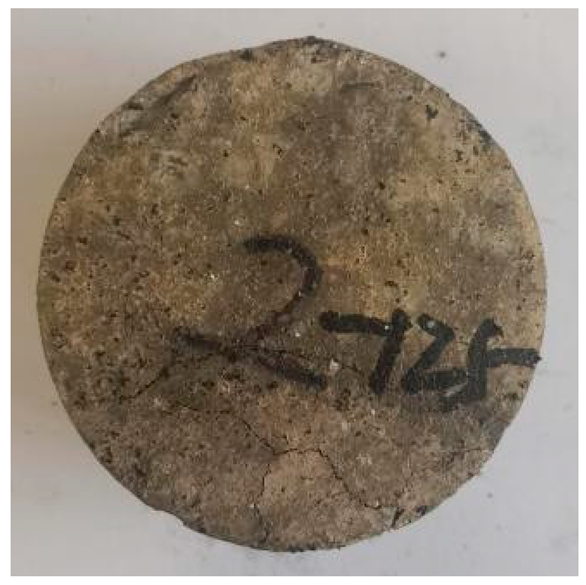 | 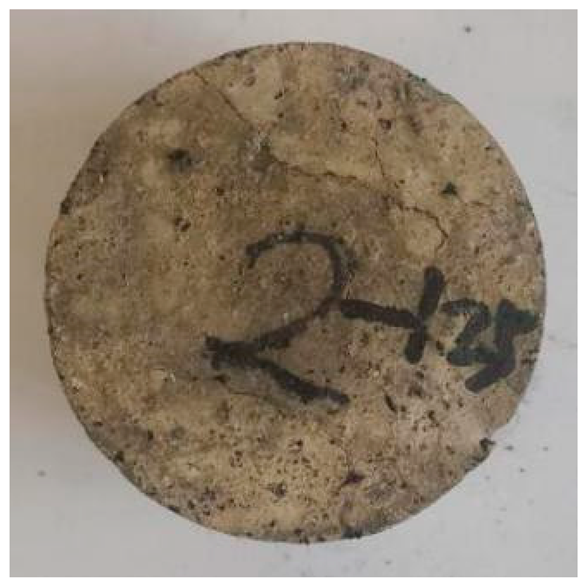 | 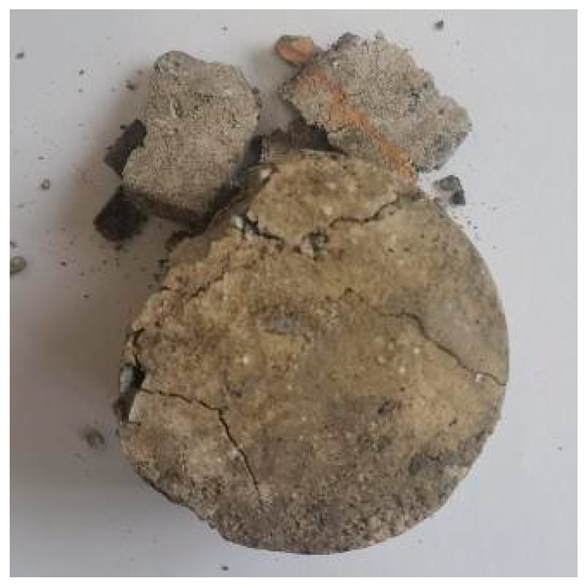 | |
| D | 0 freeze–thaw cycles |  | 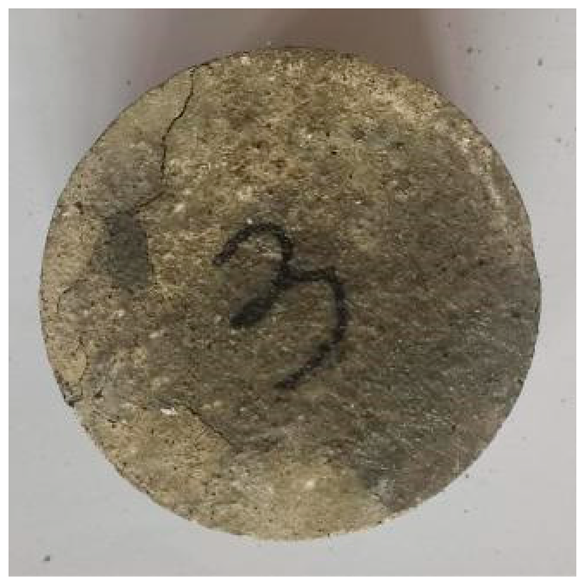 | 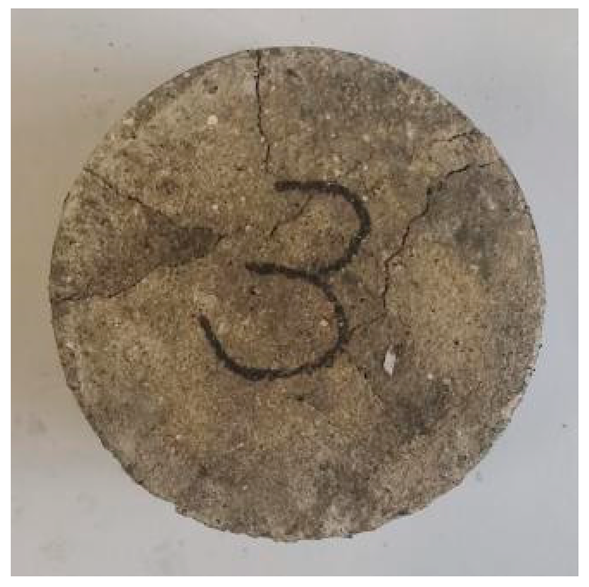 |
| 125 freeze–thaw cycles | 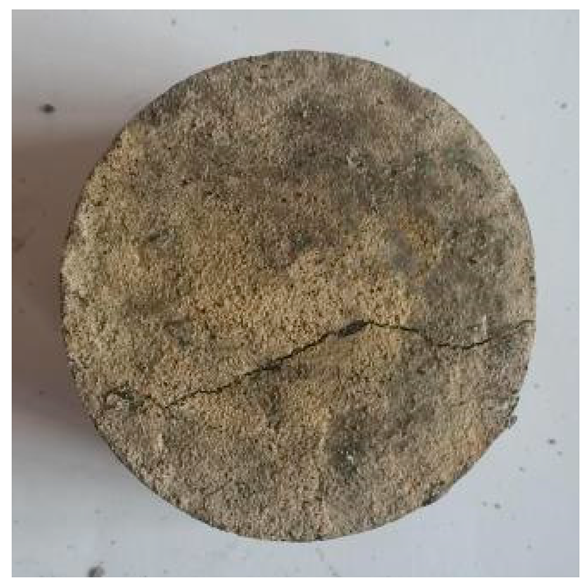 |  |  |
| Impact Pressure (MPa) | 0.3 MPa | 0.45 MPa | 0.6 MPa | ||||
|---|---|---|---|---|---|---|---|
| Number of Freeze–Thaw Cycles | Group Number | Strain Ratio (s−1) | Dynamic Peak Stress (MPa) | Strain Ratio (s−1) | Dynamic Peak Stress (MPa) | Strain Ratio (s−1) | Dynamic Peak Stress (MPa) |
| 0 | A | 79.66 | 54.59 | 97.99 | 62.80 | 135.19 | 71.39 |
| 25 | 77.51 | 51.54 | 102.18 | 58.22 | 135.29 | 67.19 | |
| 50 | 84.14 | 46.54 | 101.59 | 52.75 | 129.84 | 62.54 | |
| 75 | 87.89 | 40.09 | 109.39 | 45.15 | 128.99 | 55.66 | |
| 100 | 87.67 | 33.67 | 106.10 | 38.64 | 132.55 | 43.47 | |
| 125 | 88.88 | 25.31 | 104.41 | 29.78 | 133.65 | 34.02 | |
| 0 | B | 81.60 | 37.63 | 107.02 | 45.20 | 120.46 | 48.77 |
| 25 | 85.82 | 35.28 | 106.70 | 41.48 | 135.74 | 44.97 | |
| 50 | 86.13 | 32.52 | 104.89 | 37.41 | 133.54 | 41.16 | |
| 75 | 89.15 | 29.78 | 115.31 | 33.44 | 137.84 | 37.57 | |
| 100 | 84.72 | 25.20 | 109.93 | 28.98 | 135.96 | 33.21 | |
| 125 | 88.11 | 21.00 | 114.41 | 24.15 | 131.36 | 28.35 | |
| 0 | C | 93.60 | 39.51 | 113.76 | 45.69 | 130.23 | 51.31 |
| 25 | 90.38 | 37.79 | 108.79 | 42.38 | 126.08 | 48.52 | |
| 50 | 86.17 | 34.82 | 117.11 | 39.46 | 135.61 | 45.69 | |
| 75 | 88.65 | 31.06 | 105.45 | 35.28 | 130.38 | 41.23 | |
| 100 | 79.16 | 27.09 | 106.69 | 31.00 | 135.66 | 37.57 | |
| 125 | 82.31 | 23.71 | 107.24 | 26.13 | 130.44 | 31.21 | |
| 0 | D | 79.96 | 42.15 | 101.43 | 49.33 | 127.46 | 55.63 |
| 25 | 83.40 | 40.22 | 108.28 | 46.20 | 132.80 | 52.91 | |
| 50 | 79.11 | 37.72 | 103.10 | 43.52 | 127.85 | 50.62 | |
| 75 | 77.03 | 33.21 | 93.95 | 39.69 | 124.44 | 47.04 | |
| 100 | 82.84 | 30.54 | 101.09 | 35.89 | 127.97 | 43.01 | |
| 125 | 96.45 | 26.72 | 106.92 | 30.54 | 136.41 | 38.56 | |
Disclaimer/Publisher’s Note: The statements, opinions and data contained in all publications are solely those of the individual author(s) and contributor(s) and not of MDPI and/or the editor(s). MDPI and/or the editor(s) disclaim responsibility for any injury to people or property resulting from any ideas, methods, instructions or products referred to in the content. |
© 2024 by the authors. Licensee MDPI, Basel, Switzerland. This article is an open access article distributed under the terms and conditions of the Creative Commons Attribution (CC BY) license (https://creativecommons.org/licenses/by/4.0/).
Share and Cite
Huang, X.; Yue, T.; Zhang, J.; Zhang, J. Experimental Research on the Impact Resistance Mechanical Properties and Damage Mechanism of Rubberized Concrete under Freeze–Thaw Cycling. J. Compos. Sci. 2024, 8, 87. https://doi.org/10.3390/jcs8030087
Huang X, Yue T, Zhang J, Zhang J. Experimental Research on the Impact Resistance Mechanical Properties and Damage Mechanism of Rubberized Concrete under Freeze–Thaw Cycling. Journal of Composites Science. 2024; 8(3):87. https://doi.org/10.3390/jcs8030087
Chicago/Turabian StyleHuang, Xiaowen, Tengsheng Yue, Jun Zhang, and Jinsong Zhang. 2024. "Experimental Research on the Impact Resistance Mechanical Properties and Damage Mechanism of Rubberized Concrete under Freeze–Thaw Cycling" Journal of Composites Science 8, no. 3: 87. https://doi.org/10.3390/jcs8030087