1. Introduction
Potato (
Solanum tuberosum L.) is the most widely grown tuber crop in the world, and the fourth largest food crop in terms of fresh produce, after rice, wheat, and tomato. Potato virus Y (PVY) is a member of the Potyviridae family and, economically, it is one of the most important potato pathogens, with PVY
NTN being, worldwide, an aggressive isolate that induces severe symptoms in sensitive potato cultivars [
1,
2,
3]. The interaction between a plant and its pathogen initiates a complex signaling network, resulting in massive changes of the gene activity and extensive reprogramming of the cell metabolism [
4,
5].
Salicylic acid (SA) has shown to mediate resistance in many compatible plant-virus interactions and its deficiency leads to impairment of the defense responses and increased susceptibility to pathogen attacks [
6,
7]. Compatible interaction is a term broadly used in plant pathology that refers to the interaction between the pathogen and the plant that leads to successful infection, while incompatible interaction stands for successful plant resistance: i.e., the host’s ability to limit pathogen multiplication [
8]. Recently, we performed a time series analysis of defense responses in compatible potato-PVY
NTN interaction using the tolerant cultivar Désirée [
4]. Although the plant’s fitness was almost unaffected, the virus multiplied in the inoculated leaves from five days post inoculation (dpi) on and the spread of viral RNA to upper leaves was detected at 7 dpi [
9]. To determine the role of SA in this interaction, the NahG-Désirée transgenic line that expresses salicylate hydroxylase, which catalyzes the conversion of SA to catechol [
7,
10,
11], was also analyzed. In contrast to the non-transgenic plants of cv. Désirée, the SA-deficient transgenic NahG-Désirée showed a greater susceptibility to PVY
NTN. Symptoms in the terms of pronounced yellowing and necrotic lesions started to appear on the site of infection from 4 dpi, and became more pronounced in later days. The appearance of the symptoms in NahG-Désirée corresponded to the first detection of viral multiplication at 4 dpi [
4]. The dynamics of whole transcriptome changes of cultivar Désirée and NahG-Désirée was analysed in inoculated and systemically infected leaves following 0, 1, 3, 4, 5, and 7 dpi.
This paper proposes a methodology aimed at systematic identification of genes that have statistically significant differences of gene expression values between the PVY infected samples and the non-infected (mock) samples at various time points of the recorded time series data. The identified genes present the input for expert analysis and reasoning, aiming to uncover why different potato cultivars differ in terms of resistance to PVY, with the ultimate goal to provide novel insights into the relevant biological processes.
The difficulty of the problem is due to a small number of samples (typically only three samples per a time point per a given potato type) and more than 37,000 candidate genes that have to be tested for their significance. Therefore, we cannot use the standard statistical approaches like the Student’s
t-test or the Mann-Whitney U test for this dataset. A potentially interesting approach that has been specifically developed for gene expression data performs a differential comparison of sets of genes that are constructed based on their biological functions [
12]. A problem of this methodology for our application in the domain of potato plant time series analysis is the often missing information about functions of genes and their functional groups. Standard approaches to longitudinal gene expression analysis are based on spline-based methods for short time sequences [
13] and on the approximation of noisy time sequences with simple and smooth functions [
14]. These techniques are appropriate for discriminating among complete sequences and are less effective for detecting of differences in specific time points. Finally, techniques for analysis of longitudinal data in medical applications that use within-subject correlation to increase the power of statistical tests [
15] are not applicable because potato leaves must be removed from the plants for the analysis of the transcriptome and, therefore, our samples are from physically different leaves.
The novel approach proposed in this work is based on the randomization test concepts [
16]. The applicability and usefulness of randomization in gene expression statistical analysis has been previously demonstrated [
17,
18]. In our approach, we construct large stratified randomized gene sets on which we compute the statistical properties of genes, without taking into account the differences between the infected and non-infected plants; we then use this distribution to estimate which of the actual genes have statistically different expression values distinguishing between PVY infected and mock potato samples.
The next section presents the data and the methodology used for the identification of relevant genes from a time series of small data samples.
Section 3 presents the results that illustrate the type and quality of the outcomes of this methodology. Finally,
Section 4 provides a summary and discusses the limitations of the proposed methodology.
2. Materials and Methods
The data analysed in this paper are deposited in the NCBI Gene Expression Omnibus, and are accessible through GSE58593 [
19].
2.1. Data
Plant material has been grown and manipulated as follows [
5]. Potato (
Solanum tuberosum L.) cv. Désirée and transgenic potato plants of the same cultivar deficient in SA signaling (NahG-Désirée) were propagated in tissue culture. Two weeks after node segmentation, they were transferred to soil in a growth chamber, and kept at 21 ± 2 °C in the light and 18 ± 1 °C in the dark, at a relative humidity of 75% ± 2%, with 70–90 μmol/m
2/s
2 radiation (L36W/77 lamp, Osram, Germany) and a 16-h photoperiod. After four weeks of growth in soil, the potato plants were inoculated with PVY
NTN (isolate NIB-NTN, AJ585342) using sap prepared from homogenized leaves of tissue culture-grown infected potato plantlets of cv. Pentland squire. For the mock-inoculated plants, the same procedure was performed with sap from healthy potato plants.
On the day of inoculation, three leaves from three non-treated plants for each genotype (Désirée, NahG-Désirée) were collected, which were designated as controls, i.e., at the time point zero days post inoculation (dpi). PVYNTN-and mock-inoculated leaf samples were collected on 1, 3, 4, 5, and 7 dpi. Three plants for each treatment were used.
Total RNA from the inoculated leaves was extracted, DNase treated, purified, and quality controlled as described previously by [
5]. A one-colour based hybridization protocol was performed on the custom 60-mer oligo microarrays (4 × 44K; AMADID 015425) designed by the Potato Oligo Chip Initiative [
20]. For each sample at least 1 μg total RNA was sent for analysis at IMGM Laboratories GmbH, Planegg, Germany. The raw data were analysed in the R Project for Statistical Computing program (R Development Core Team, 2011; version 2.13.2), using the packages Agi4x44PreProcess [
21] and Limma [
22].
The microarray features were filtered according to the Agilent quality control flags: if the feature was determined to be well above background, if the noise did not exceed a threshold, and if it was not saturated (IsNOTWellAboveBG, IsSaturated, and IsFeatNonUnifOL [
20]) in at least 10% of the total microarray count, then that particular microarray feature was retained for further analysis. The raw data of the remaining 37,865 (from a total of 42,034) features was robust spline normalized (‘rsn’; see [
23]). The empirical Bayes method [
22] was used to detect differentially-expressed genes between PVY
NTN-and mock-inoculated plants at each time point and for each genotype with corrected
p ≤ 0.05 [
24]. Functional analysis of differentially-expressed genes was performed using the MapMan software tool [
25] using the ontology adapted for potato [
26].
We analysed separately the data from upper non-inoculated and bottom inoculated leaves for the Désirée potatoes, while for NahG potatoes we analysed only the bottom inoculated leaves. In the rest of the paper, Désirée upper leaves are referred to as NT upper, Désirée bottom leaves as NT bottom, while NahG-Désirée potatoes are referred to as NAHG.
Table 1 provides an illustration of normalized gene expression data for three out of 37,865 genes. The presented data are for days 1 and 3 for NT upper potato leaves. They illustrate the variability inherent to gene expression measurements.
2.2. Methodology
For domain expert analysis the most interesting are the genes that significantly change their expression value for infected plants at a specific point in time. Such genes are characterized by two properties: there is statistically significant difference between PVY values at time points X and X–1, while the values at these time points do not change in mock samples, and there is a statistically significant difference between PVY and mock values at time point X.
Figure 1 illustrates these two conditions.
This means that we have to solve two separate tasks: (1) In the first task, for each time point, we have to identify the genes whose PVY values have changed significantly from the previous time point; and (2) the second task concerns the identification of genes that at the given time points have substantially different values for the PVY and mock samples. Only the genes that satisfy both conditions are interesting for expert analysis. Systematic identification of complete lists of genes that satisfy both conditions is the aim of the proposed methodology.
While the two tasks are performed on different data, the goal of both of them is to identify sets of genes that are substantially differently expressed between the target and the control samples. In the first task the PVY samples at time point X are the target set, while the PVY samples at time point X–1 are the control set. On the other hand, in the second task, the PVY and mock samples at time point X are the target and the control set, respectively.
Our basic task is the identification of genes that have statistically significant differences in their expression between the target and the control set. When the target and the control sets are small, in our case consisting of only three samples per each set, the standard statistical tests are not applicable. An alternative approach is possible due to the fact that variance has been stabilized in preprocessing of gene expression data by a model based transformation [
23]. The approach consists of two steps: definition of an appropriate measure for computing the difference between the target set and the control set, and by the identification of reliable ranges when the actual values of this measure for some concrete gene can be accepted as statistically significantly different from the no-difference assumption.
A natural selection for the measure of difference between two sets of samples is the relative difference between the average values for samples in different sets, referred as RDA. It is defined as the difference between the average value of the target set and the average value of the control set, divided by the average value for the control set. An alternative measure is relative minimal difference (RMD). In this work we use the latter because of its property that a single measurement error, regardless how large it is, cannot substantially increase its absolute value. This property is important for preventing false positive discoveries. Additionally, for a large fraction of randomly generated data, their RMD values are either equal to zero or they have very small values. This property is, therefore, beneficial for the estimation of distributional characteristics of this measure on random data and the recognition of genes whose measured expression values are significantly different.
2.2.1. Relative Minimal Distance
Relative minimal distance (RMD) is defined as follows: its value is positive if all target samples have larger values than the control samples and its value is negative, if all target samples have lower values than the control samples. Furthermore, if there is at least one target sample larger than some control sample and at least one target sample with a value lower than some control sample, then the RMD value is, by definition equal to zero, regardless of the actual values of the samples. RMD also always has a value of zero when a pair of target and control samples has identical values. The concept is illustrated in
Figure 2.
When all input target and control gene expression values are positive (tx, cx > 0), non-zero RMD values for positive cases are defined by the relation:
while for negative cases it is:
where tmin, tmax, cmin, and cmax are the minimal and maximal values for the samples in the target and control sets, respectively.
An important property of RMD is that for random differences between the target and control sets many RMD values will be equal to zero or their value will tend to be small. For example, in the potato plant gene analysis domain with typically three samples both in the target and the control set we can expect that about 90% of genes that behave randomly will have RMD values equal to zero. In the case where there were five samples per set available for the analysis, less than 1% of RMD values for random variables will be different from zero. This property does not depend on the actual intra-set variance. A negative aspect of the RMD measure is that if the intra-set variance is high then it can happen that, even for really significantly different gene sets, the RMD value can also be equal to zero.
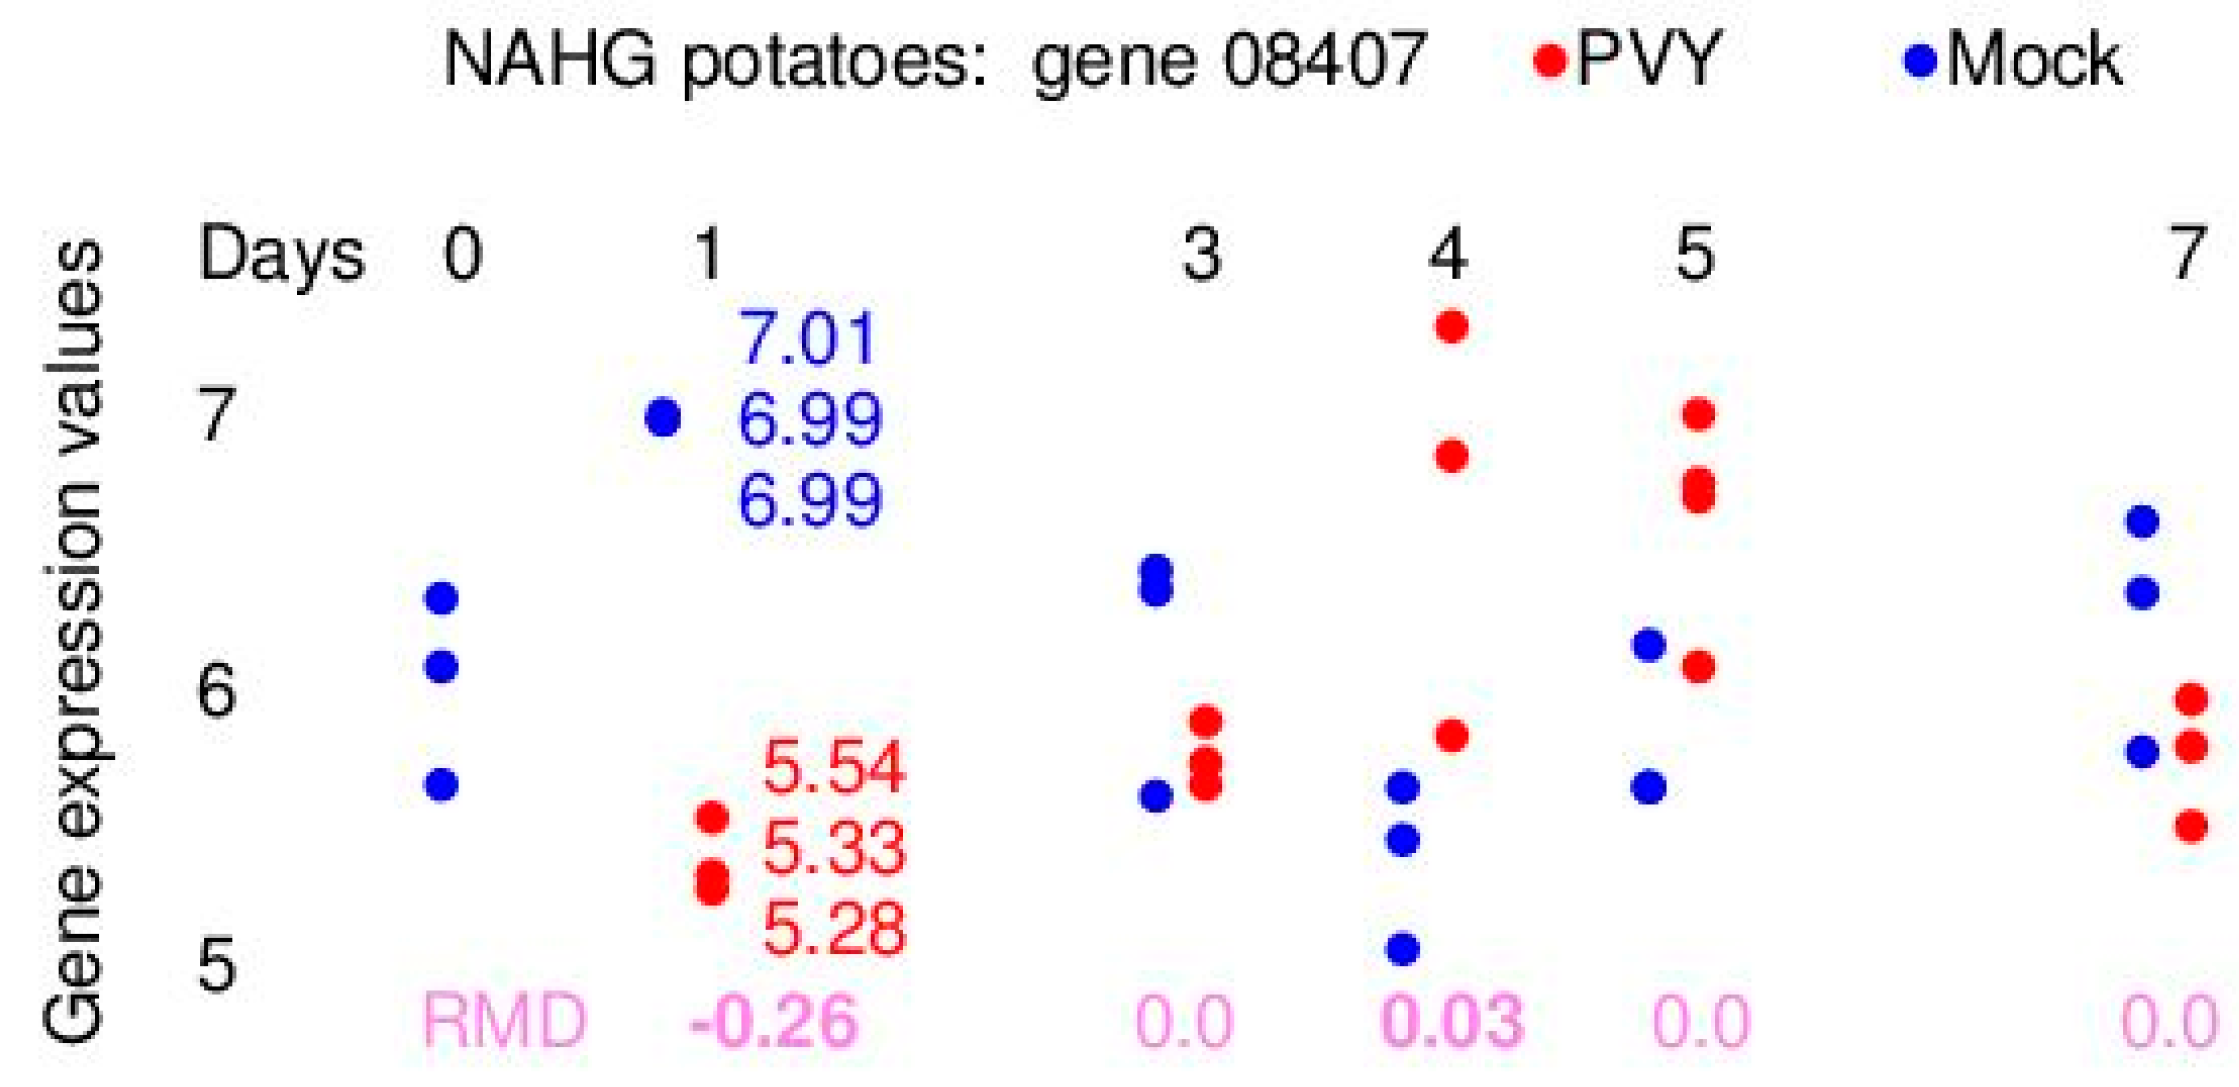
Figure 3 presents the distribution of real gene expression data and the corresponding RMD values for one out of 37,865 genes for NAHG potatoes. The RMD values are computed for the differences of gene expression values between the PVY and mock samples. Gene 08407 has a large negative RMD value for day 1 and a small positive RMD vale for day 4. The RMD value for day 1 is statistically significant (see the next section).
2.2.2. Critical Regions for Accepting RMD Values as Statistically Significant
Let us assume that we have the target and the control sets with a small number of samples and that there is a large set of genes that are candidates for being uncovered in terms of significantly different values for these two sets. Additionally, let us assume the input data have stabilized variance and there is some measure that can be used to quantify the difference in gene expression values. In the rest of the paper we use the RMD measure defined in the previous section, but note that the methodology can also be used for some other measure of the user’s choice. The goal is to identify critical regions of RMD values or, in other words, to compute how large some RMD values must be in order that we can claim that the gene has significantly different expression values for the two sets.
The underlying idea is to construct randomized sets of gene expression values and to compute statistics of RMD values on this data. These statistics will determine the critical regions for RMD values that are acceptable as statistically significantly different from the random data. Since, for randomized data, there are a large number of non-zero RMD values and the probability of positive and negative values is equal, we can conclude that non-zero RMD values computed for randomized data will be normally distributed and that their average value will be equal to zero. This fact is illustrated in
Figure 4 for NT-upper potato leaves for day 1. The figure presents distributions of RMD values for real PVY versus mock data and for the randomized data when the PVY and mock values have been shuffled.
The critical regions of real RMD values that can be accepted as statistically significant are computed from the standard deviation of the non-zero RMD values for randomized data. The Bonferroni correction has to be used because we have to test the statistical significance of a large number of genes. Theoretically this means that for the two-tailed significance level of 5% and 37,865 genes that have to be tested, some real RMD value can be accepted as statistically significant if its absolute value is at least 4.84 times greater than the standard deviation computed for non-zero RMD values for randomized data (see
Figure 4). Factor 4.84 is determined by using function pnorm from the R language, as follows:
Practically the factor can be slightly smaller because for all the genes with real RMD values equal to zero we know that they are not significant. The significance test should be done only for non-zero real RMD values and their number is known for each specific case.
Table 2 and
Table 3 present the data used for computing the critical regions for the first and the second task, respectively.
The second, third, and fourth columns of the two tables contain the values computed for randomized data sets among which the standard deviation of non-zero RMD values is the most relevant information. The following two columns contain the number of non-zero RMD values on real data and the corresponding factor for the computation of the critical region with the Bonferroni correction. The last column contains the critical values for each day and the type of potato plants. If the absolute value of RMD for some gene is greater than this value, then the gene can be accepted as having statistically significant differences between the target and the control sets.
An important practical issue is how to generate randomized gene expression data. A simple and effective method is by shuffling the real data:
The shuffling could be done on the complete gene expression data set irrespective of the meaning of the data. It this case the data are mixed irrespective of the potato types, days, and infection status. This approach can result in incorrect estimation of the standard deviations if the differences between the gene expression data for different potato types and/or PVY versus mock data are large.
Since we do not have expert knowledge on whether and/or how these differences are relevant, we implemented a better approach based on stratified data shuffling.
For the first task we shuffle only the PVY values for the same potato type within different days. In this way we randomize time related information and the standard deviation is computed from the real PVY data for the specific potato type as if there were no changes of PVY in time.
For the second task, we shuffle only PVY and mock data for the specific day and the same potato type. In this way we randomize only the differences between the infected and non-infected plants, while the potential time-related differences and the differences between the potato types remain present also in the randomized datasets.
2.2.3. Combination of the Two Tasks
The first step in the identification of significant genes is the computation of critical regions. This is performed by the approach based on the construction of randomized data sets described in the previous section. After we have computed the critical regions, the process of identification of significant genes is very simple: all genes whose absolute value of RMD is above the critical values presented in the last columns of
Table 3 and
Table 4 are accepted as statistically significant. The genes in the resulting lists are ordered according to the descending absolute RMD value.
For each time interval the process has to be repeated two times. First we construct an ordered list of genes that significantly changed their PVY values in the given time interval, followed by computing the list of genes that at the end of the time interval have significantly different values in PVY and mock samples. The final list that presents the result of this methodology consists of the genes that are present in both previous lists and their RMD values in these lists have the same sign.
The result of this process is illustrated in
Table 4. The table presents in its second column the number of genes identified as relevant by the first task, in the third column are numbers of relevant genes identified by the second task, while the last column presents the number of genes satisfying both conditions.
The main conclusion from
Table 4 is that the final solutions include much less genes than the lists generated by the first and by the second task independently. This means that it makes sense to search for the agreement of both conditions and that the genes in the final solution deserve biological evaluation by the domain expert.
The largest numbers of genes detected as relevant are for the changes in the days 0–1 interval for the NT potatoes, which are large both for the upper and the bottom leaves. The result confirms the expert’s knowledge that Désirée reaction to infection is stronger and that the reaction is the strongest immediately after PVY infection.
3. Results
The results of the application of the presented methodology are lists of relevant genes that are computed for every time interval. These lists serve as input for expert evaluation. The first step in this evaluation is the analysis of functions of relevant genes. For NT upper leaves functions of three genes whose gene expression values changed most significantly for the first day after infection are: Argnine/serine-rich splicing factor, Thioredoxin, and DNA binding protein. For these three genes their gene expression values of PVY infected samples are statistically significantly higher than the corresponding values of mock samples. For NT bottom leaves, the three genes whose expression values changed most significantly in the same time period are: Chlorophyll a-b binding protein 3C chloroplastic, cell wall protein, and YTH domain family 2. For all these three genes their expression values for PVY infected samples have also increased. In contrast, for NAHG potatoes there is only one gene (Maleylacetoacetate isomerase glutathione S-transferase) whose gene expression values have statistically significantly changed and its expression values in PVY infected samples have changed in the opposite direction.
3.1. Biological Evaluation of Selected Genes
In accordance with our previous analysis, photosynthesis-related genes (e.i. gene encoding for chlorophyll a-b binding protein) are differentially expressed in NT bottom leaves at first day post inoculation (dpi). The same day the gene encoding for YTH domain family protein, involved in calcium signalling as well as transcripts for cell wall protein are differentially expressed. SA-deficiency alters fast transcriptional response resulting in maleylacetoacetate isomerase being identified as a relevant transcript. Interestingly, the changes in gene expression in the upper leaves are detected already in the first time period, with transcripts of arginine/serine-rich splicing factor, thioredoxin, and DNA binding protein being differentially expressed, suggesting a fast systemic plant response.
The differences in gene expression of wild type potato plants in the bottom leaves are detected mostly in the last time interval; from 5–7 day transcriptional regulator (MYB transcription factor), gene involved in calcium signalling (calmodulin-like protein) and sugar metabolism (hexulose-6-phosphate isomerase) are regulated upon virus infection. In NahG genotype (NAHG), different transcripts were identified as important regulators showing the importance of SA hormone in the regulatory process. In the upper leaves, reprograming of gene expression is also noted, showing that the plant response is not limited only to the site of virus entry and identifying genes that have a role in systemic plant response (NT upper).
3.2. Visualization of RMD Values
Results visualization is beneficial for understanding of the meaning and for inspecting the relevance of the results. A standard approach is to present the average values and their changes in time. In
Figure 5 we present the data for the gene
chlorophyll a-b binding protein 3C which has been identified as the most relevant for NT bottom leaves for interval day 0–1. From the figure it can be concluded that NT upper and NT bottom have higher expression values of PVY infected samples than the values of the mock samples in the period day 1–3. The problem with
Figure 5 is that it presents six curves and it is rather difficult to capture all potentially relevant relations.
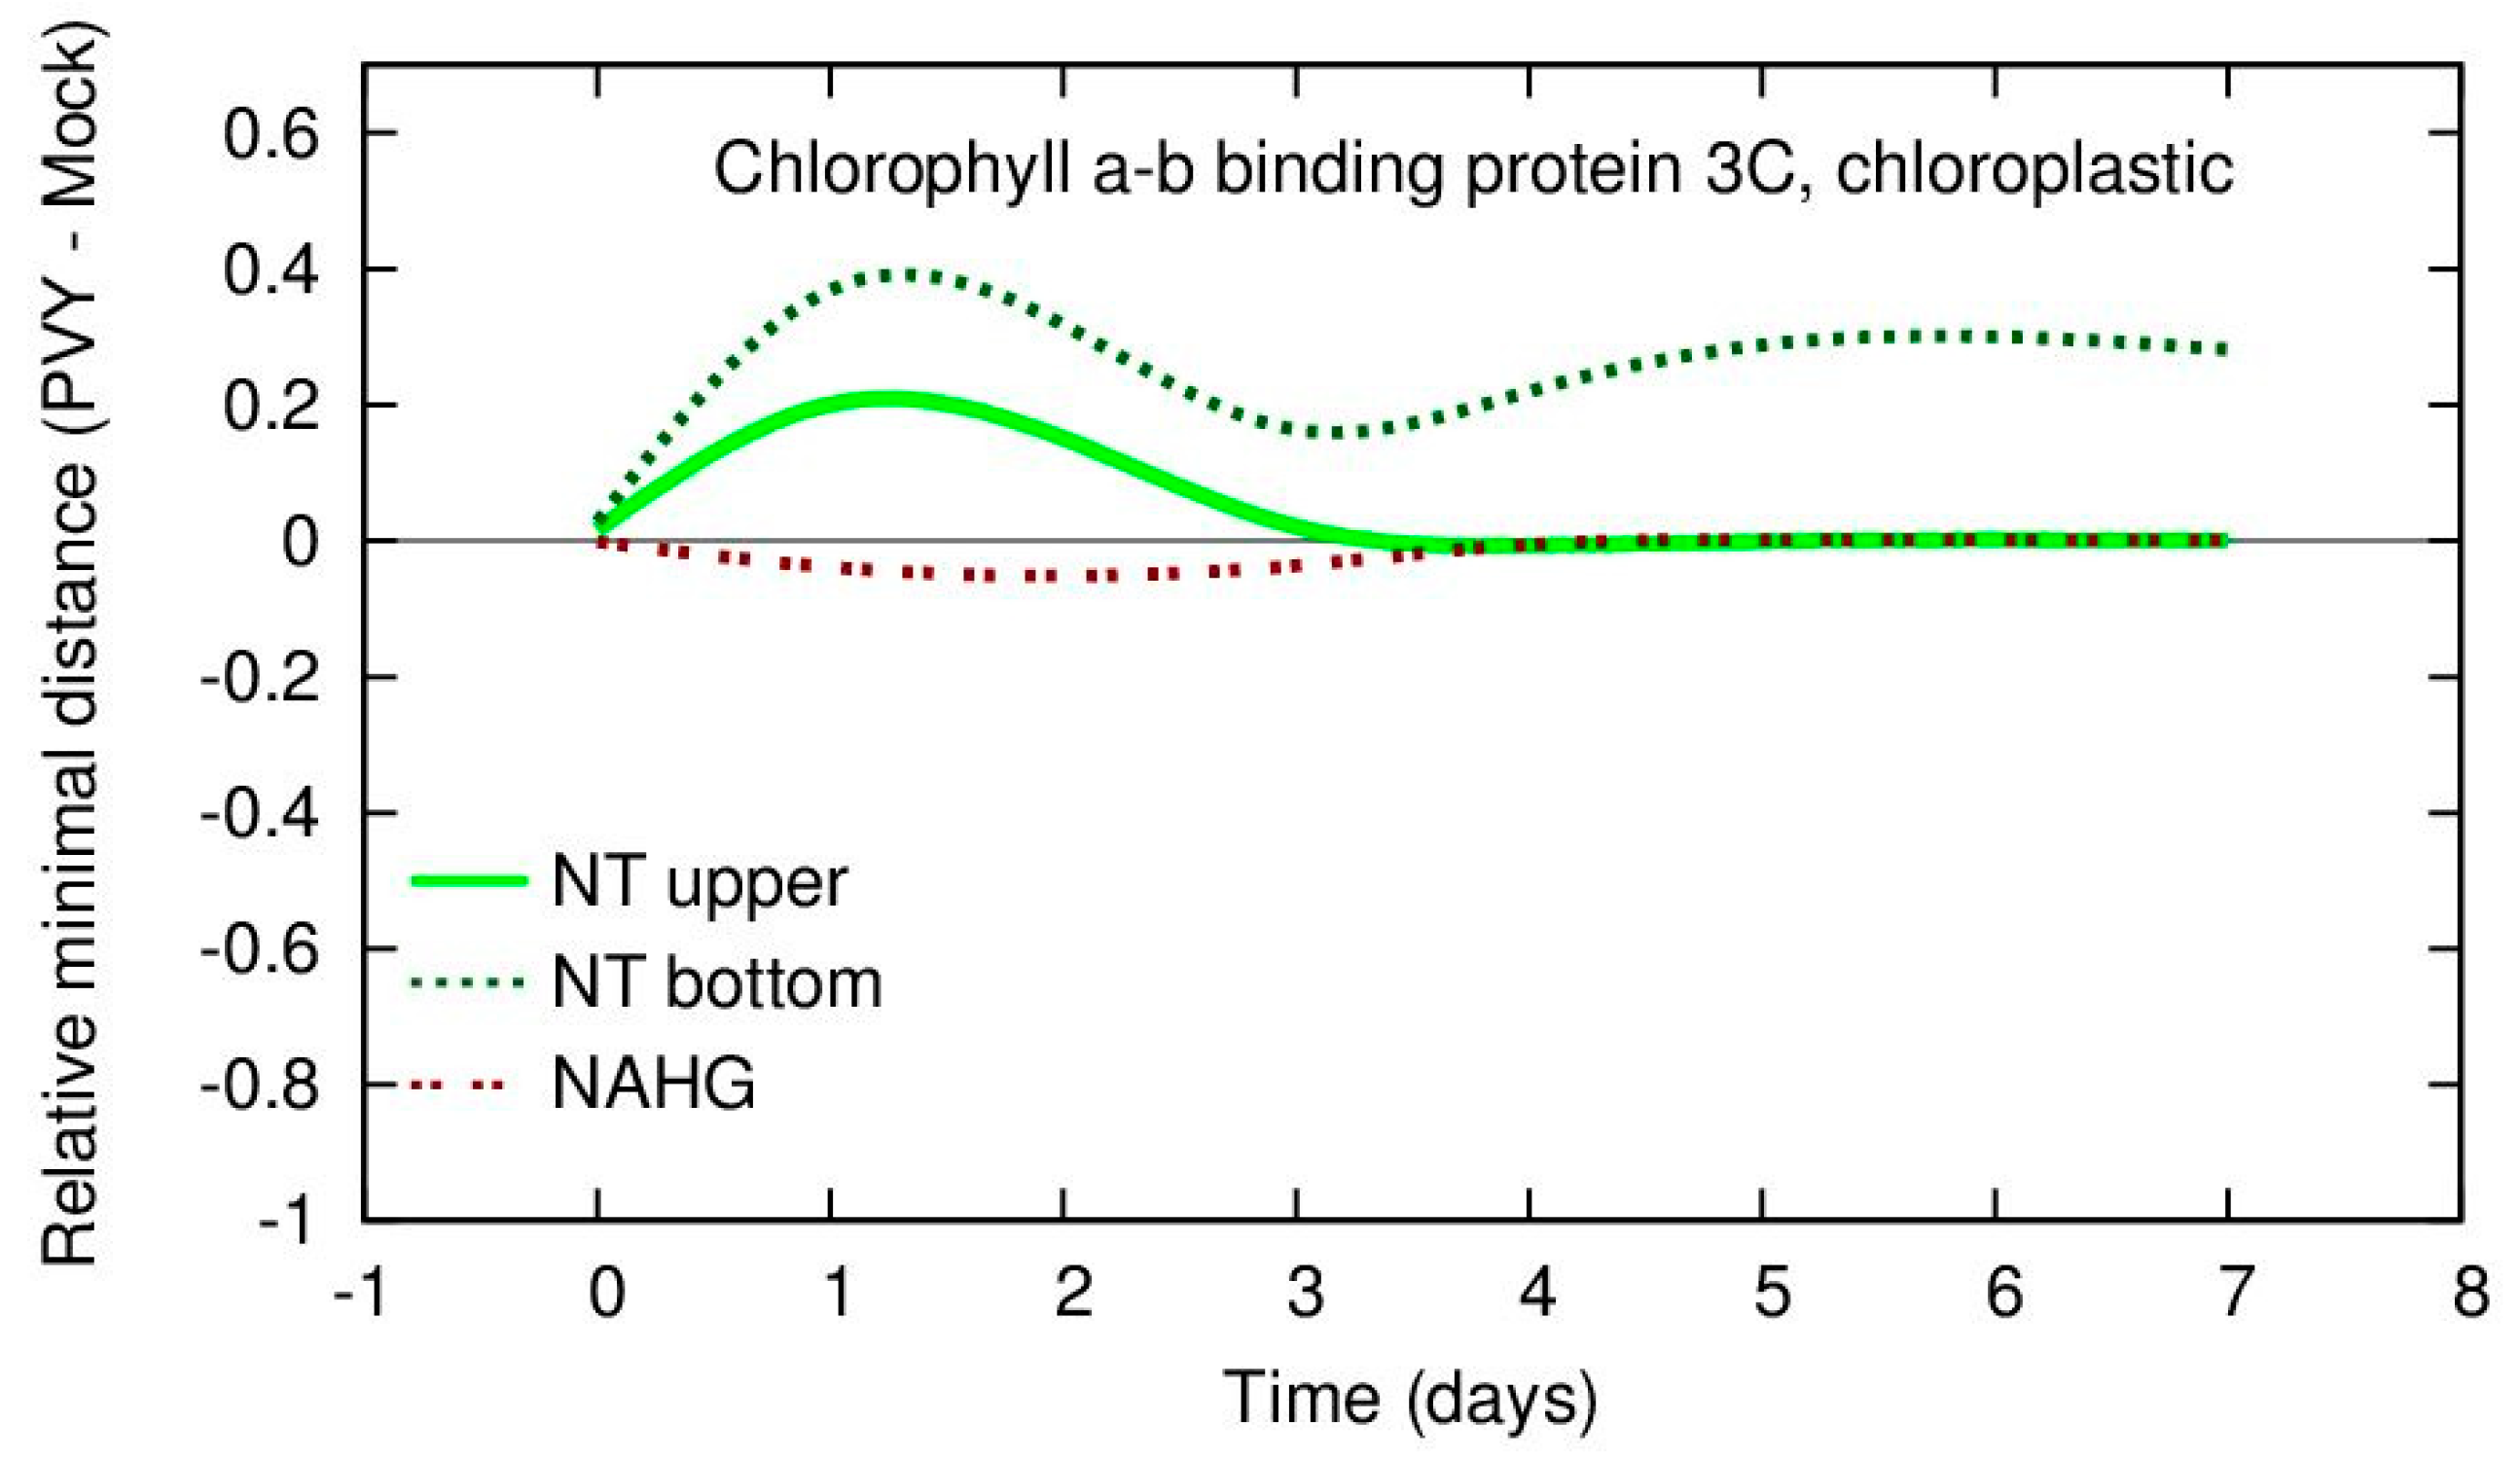
A figure that is much easier for interpretation can be obtained by the visualization of RMD values as illustrated in
Figure 6.
From
Figure 6 it is very clear that the selected gene has a very large difference between the gene expression values of the PVY and mock samples for the NT upper and NT bottom potatoes leaves for days 1–3 and that this value has strongly increased from day 0. Additionally, the figure demonstrates that in the same period NAGH potato plants have slightly decreased values for this gene. This observation may be a trigger for expert evaluation of the differences between various potato types. By evaluating both
Figure 5 and
Figure 6 at the same time it may be concluded that for PVY-infected samples, the NT upper potato leaves have increased expression values of this gene in the period day 1–3 even more than the NT bottom leaves, but that this difference is not so significant in terms of RMD values. This observation suggests that the variability for PVY and mock data for this gene for the NT upper leaves is large. The result demonstrates the usefulness of visualization of both real gene expression values and their RMD measure for small sets of samples.
4. Discussion
High throughput gene expression profiling has emerged over the last decades as one of the most important and powerful approaches in life science research. Additionally, systematic characterization of temporal changes in mRNA levels under different conditions identifies genes relevant for a specific biological response. The task of detecting genes with statistically relevant properties in the setting with a very large number of genes and a small number of samples is a common experimental setting caused by limited sample/tissue access. The contribution of the work is in the definition of a novel measure for characterization of a difference between samples in two classes. When gene expression values have stabilized variance in data preprocessing then stratified data randomization can be used to estimate the statistical properties of this measure for genes that do not differ between target and control samples. Genes whose expression values are statistically significantly differently expressed when compared with control samples and that in some time point have statistically significantly changed expression values in the biological response sequence when compared with the previous time point are selected as specific for this biological response. The approach based on relative minimal distance is very simple and efficient in detecting significant genes with strong stringency. It can be applied to any number of target and control samples, but its application is particularly justified when the number of samples is very small.
The main drawback is that the proposed methodology can result in a very high false negative rate (type II error, a large number of genes that are not detected as significant but that are actually differentially expressed). Namely, a single measurement error may have a consequence that a highly significant gene has a very low minimal distance which can be even equal to zero. This means that the relevance of the uncovered genes in terms of their differential expression is statistically justified, but that we cannot be sure that the resulting set of relevant genes is complete. This fact must be taken into account when analysing the sets of genes detected as relevant.
The methodology enables that the false positive rate (type I error when a gene is detected as significant although it is not significant) can be easily controlled by changing the number of standard deviations in the non-critical region. For example, for the case with the Bonferroni correction for 37,865 genes it is enough to increase the non-critical region from 4.84 to 5.57 standard deviations in order to obtain a probability
p < 0.001 instead of
p < 0.05 that is used in
Table 2 and
Table 3. Some of RMD values in the potato domain are more than ten standard deviations far from the mean values meaning that they are very statistically significant. Six out of seven genes whose functions are presented in
Section 3 are statistically significant with
p < 0.001.


