Encrypted DNP3 Traffic Classification Using Supervised Machine Learning Algorithms


Center of Mathematics, Computing and Cognition, Federal University of ABC, Campus São Bernardo do Campo, São Paulo 09606-070, Brazil
*
Author to whom correspondence should be addressed.
Mach. Learn. Knowl. Extr. 2019, 1(1), 384-399; https://doi.org/10.3390/make1010022
Submission received: 24 November 2018
/
Revised: 18 December 2018
/
Accepted: 11 January 2019
/
Published: 15 January 2019
Abstract
:The Distributed Network Protocol (DNP3) is predominately used by the electric utility industry and, consequently, in smart grids. The Peekaboo attack was created to compromise DNP3 traffic, in which a man-in-the-middle on a communication link can capture and drop selected encrypted DNP3 messages by using support vector machine learning algorithms. The communication networks of smart grids are a important part of their infrastructure, so it is of critical importance to keep this communication secure and reliable. The main contribution of this paper is to compare the use of machine learning techniques to classify messages of the same protocol exchanged in encrypted tunnels. The study considers four simulated cases of encrypted DNP3 traffic scenarios and four different supervised machine learning algorithms: Decision tree, nearest-neighbor, support vector machine, and naive Bayes. The results obtained show that it is possible to extend a Peekaboo attack over multiple substations, using a decision tree learning algorithm, and to gather significant information from a system that communicates using encrypted DNP3 traffic.
1. Introduction
Smart grids are the modernization of electric power distribution grids, by adding the latest technologies from the information and communication technology area, power electronics, automation, and control systems, among others, in order to be more efficient. Smart grid projects aim to fully integrate high speed two-way communication technology into power equipment, to establish a dynamic and iterative infrastructure, with new management capabilities [1].
With a heavy dependence on information technology, the smart grid is exposed to several cyber-security vulnerabilities, and this might compromise the reliability of the operation of the power system. Research of cyber-security issues in smart grids is of critical importance, and one of the priorities in a smart grid design [1].
The Distributed Network Protocol (DNP3) is predominately used by the electric utility industry. It was first developed to be used in Supervisory Control and Data Acquisition (SCADA) systems, which are currently being integrated in smart grid systems. SCADA systems were developed to manage and monitor the behavior of large-scale distributed systems, mostly in critical infrastructure sectors. Due to the criticality of those systems, they must operate continuously, with little to no downtime or delay in the transmission of the control signals, and monitor data [1,2,3,4].
The DNP3 protocol messages transmitted among SCADA stations usually carry commands and control data. It was initially designed based on SCADA system communication, but it has been ported over to the TCP/IP stack to support, end-to-end, modern communication technologies [1,3,5].
A vulnerability of the DNP3 protocol was proposed in [6], the Peekaboo attack, in which a man-in-the-middle on a link could capture and drop selected encrypted DNP3 messages, by using supervised machine learning algorithms. Since the communication network in a smart grid is an important part in the infrastructure, it is of critical importance to keep this communication secure and reliable.
To keep communication in smart grid systems secure and reliable, the information must be available when it is requested; confidential, being only available to authorized people; and, also, its integrity must be kept, ensuring that the information will not be modified or destroyed through the communication system [1].
Motivated by the importance of the DNP3 protocol in the electric utility industry and the criticality of smart grid systems, this work aims to study vulnerabilities of the DNP3 protocol and how to mitigate them.
The first objective in this work is to study if it is possible to gather information about the SCADA system by intercepting and classifying each packet in the encrypted DNP3 communication traffic individually. Also, by classifying the traffic, this work aims to study if it is possible to perform a Peekaboo attack in encrypted DNP3 traffic, by dropping some selected packets in the communication link using supervised machine learning models.
To achieve the objectives, first, two Internet Protocol Security (IPSEC) tunnels with Encapsulating Security Payload (ESP), encrypted DNP3 traffic scenarios were simulated, based on three measurement datasets, collected at a medium voltage substation of a power distribution system operator. The simulated traffic in the first scenario is normal, in which no DNP3 packets are dropped by an attack, and, in the second scenario, some DNP3 packets are being dropped, based on a Peekaboo attack, as proposed in [6]. The development of the DNP3 traffic scenarios is described in Section 4.
The outputs of the simulated scenarios were Attribute-Relation File Format (ARFF) datasets, to be used as training and test sets to four different machine learning techniques, in order to create different classification models and evaluate how these could identify individual packets in the DNP3 encrypted traffic. The classification of individual packets is to be used to gather significant information about the SCADA system and, also, to perform a Peekaboo attack by dropping selected packets. Furthermore, the models generated are compared, to evaluate which are more suited to reproduce an Peekaboo attack. The development of the models is described in Section 4.
2. Application Concepts
Smart Grids, SCADA, and the DNP3 Protocol
Supervisory Control and Data Acquisition (SCADA) systems control and monitor critical infrastructure assets, such as electric power grids, water treatment facilities, oil and gas pipelines, and railways. SCADA systems consist of one or more remote terminal units (RTU) and/or programmable logic controllers (PLC) connected to actuators and sensors, which communicate with a master data collective device [2,7].
The smart grid is about real-time data and active grid management via digital communication, through the use of technological solutions to the electricity delivery infrastructure. It is the integration of the electric transmission and distribution network with the information and communication environment. The SCADA integration into smart grids connects both electrical and data networks, allowing central and distributed aggregation of information and control over the utility electrical device network. Due to the evolution of smart grids, some cyber-security challenges have emerged [7].
To keep smart grid information secure, the Confidentiality, Integrity, and Availability of the information systems must be ensured. The confidentiality in smart grid systems is to make sure that all access to information is restricted to authorized people only. In smart grid systems, personal home appliances are connected to power grids for real time bi-directional data communication, and the privacy of this information must be kept.
Integrity is to maintain and assure the accuracy of the information. Therefore, the information should not be modified in an unauthorized or undetected way. This feature provides the smart grid with robust real-time monitoring systems. Availability in a smart grid system implies that access to information must be available to authorized parties when it is needed, and since power systems must be available all the time; availability should also prevent attacks that may cause blackouts, such as a denial-of-service attack [8].
The DNP3 (Distributed Network Protocol) protocol is one of the widely used network protocols in smart grid communication networks. Its present version is based on the TCP/IP model, and supports current communication technologies. Due to its importance in smart grids, the security of this protocol must be guaranteed [8].
The DNP3 protocol works on top of the transport layer protocols—TCP or UDP. TCP provides more reliability, since it is a connection-oriented protocol. UDP can be used in a highly reliable network, because it is designed to be connectionless, and can also be used to decrease data usage in the links [3].
At the application level of the DNP3 protocol, there are only two basic messages types: Requests and responses. Requests can only be sent by a master station and the responses can only be sent by an outstation. There is a special class of response, an Unsolicited Response, that allows the outstation to send information to a master station or to a peer. The confirmation of the messages are not required, and are only sent if requested by the station that sent the message [3,4].
An unsolicited response is sent when an event that needs to be reported to the master, or to another outstation, occurs. An event occurs when something of significance happens; for example, when values exceed a threshold. The events that must be reported through unsolicited responses are defined by the system designer.
There are rules when using unsolicited responses [3]:
- Unsolicited responses must fit in only one fragment. If it is not possible to fit all the data in just one fragment, the outstation will wait for the confirmation and then send another unsolicited response message with the remaining data.
- A master shall return the confirmation immediately upon receipt.
- An outstation must clear the event data of its buffer upon the receipt of an confirmation, during the confirmation timeout period.
- If the confirmation of an unsolicited response is not received before the confirmation timer times out, and the configured number of unsolicited response retries have not been sent, the outstation may send an identical retry or a re-generated retry. An identical retry has the same sequence number of the unsolicited response not confirmed, and the fragment also matches the previous message. In the re-generated retry, the sequence number is incremented, and new data might be added.
- If the configured number of unsolicited response retries have already been sent, and confirmation is not received by the end of the transmission confirmation timeout period, the outstation terminates the current unsolicited response series and makes the events available to be reported in a subsequent solicited response or a new unsolicited response.
- Implementers may choose the trigger to initiate a new unsolicited report series if confirmation is not received.
- The sequence numbers of the unsolicited responses are independent of the sequence numbers used in the solicited responses.
There are also the Poll Request Messages, which are schedule requests from the master to the outstations that return the requested data in a solicited response message [3].
The most commonly mode of data acquisition of the DNP3 protocol is the Unsolicited Report By Exception operation mode, when the master sends poll requests periodically, with a large interval between the messages, which are replied to by the outstations with solicited responses, and the outstation sends unsolicited responses whenever an event occurs, which are replied to with unsolicited response replies. It reduces the data usage, since updates are only sent when necessary [3,6].
When using DNP3, it is also recommended to use secure Internet protocols, such as IPsec, to provide site-to-site security [3].
The IPsec protocol can be deployed in two modes of operation: Tunnel and transport. In transport mode, the original header of the packet is kept, and some security fields are added. The payload and some fields from the header are then encrypted. This mode is used when end-to-end security services are needed, and provides protection for the packet payload [9].
There are two main modes to specify the actual cryptography used in IPSEC: The Authentication Header (AH) and the Encapsulating Security Payload (ESP). Both can be used in transport and tunnel protocols [10].
The transport mode ESP is used to encrypt and, optionally, authenticate the data carried by IP, in a UDP segment, for example. In IPv4, the ESP header is inserted into the IP packet immediately prior to the transport layer header, and the ESP trailer is placed after the IP packet. If authentication is enabled, the authentication data field is added after the ESP trailer. The entire transport level segment plus the ESP trailer are then encrypted [10].
Also, to provide traffic flow confidentiality, ESP has two mechanisms to provide spurious traffic to frustrate the attacker’s attempt to gather information from the protected traffic, or to gather traffic statistics. The mechanisms are variable length padding and dummy packets. In general, an intruder should not be able to know what ESP is carrying, but the packet classification results made by the Peekaboo attack can drive and confirm the encrypted mode.
3. Related Work
The research of related works consisted of papers in which machine learning techniques are used to classify encrypted network traffic, to learn the attributes they used as parameters to classify the traffic.
In [11], the authors proposed the use of a Maximum Likelihood Classifier; that is, a statistical pattern recognition algorithm to classify SSH-tunneled traffic, in order to determine which protocols are traveling in the encrypted tunnel. This paper is based on the premise that, after the creation of the SSH tunnel between the client and the server, the client sends an application message to start the connection with the server, which is then acknowledged by the master, and finally the client will start the application connection tunnel. Those three messages between server and master are considered the boundary, and they are used, combined with the maximum likelihood classifier algorithm, to classify which protocol is encrypted in the SSH tunnel. They use the direction and the size of the packet as features to train the machine learning model. The protocols targeted to be identified were HTTP, POP3, FTP, and SMTP, and the results have shown that the Maximum Likelihood classifier performs well identifying the SSH tunneled traffic.
In [12], the authors developed a real-time traffic classification method, based on cluster analysis, to identify SSH flows from the statistical behavior of IP traffic parameters, such as length, arrival times, and the direction of the packets. The goal was to recognize SSH flow out of other applications, such as HTTP or FTP, and then identify which service was actually carried within the encrypted SSH tunnel. The approach for the classification system was based on the k-means algorithm. The researchers were able to identify SSH flows, out of other plain TCP based applications, up to 99.2%. Other protocols have been correctly classified, with accuracy up to 94.53%. Once SSH flows have been detected, they were able to classify the nature of each SSH tunnel by continuing to gather session packets after the detection, with an accuracy of up to 99.88% in classifying HTTP over SSH, by just analyzing the third and fourth packet after the end of the SSH negotiation phase. The authors also got good results by classifying SCP and SFTP protocols.
In [13], an extensive classification performance is discussed for Transport Layer Security (TLS) encrypted traffic.
In [5], a technique was proposed to classify UDP traffic. The authors divided the UDP traffic into five categories, and classified them using four machine learning techniques: Naive Bayes, Support Vector Machine (SVM), C4.5, and K-means. The analysis showed that supervised techniques can achieve a higher accuracy than unsupervised clustering techniques.
In [5], the characteristics of UDP flows were used as parameters for the classification. The flow features used were the flow duration, the flow volume in bytes, the flow volume in packets, the packet length, and the inter-arrival time. Flow was defined as a series of packets that are consistent with a specific flow specification and timeout constraint. The flow specification used was the five-tuple specification: Source address, destination address, source port, destination port, and transport layer protocol. The timeout constraint defines a flow which became inactive, beyond a specific timeout as a end flow.
The Peekaboo attack [6] used a SVM implementation, a machine learning algorithm, to create the model. Based on that, a similar implementation of SVM, the Sequential Minimal Optimization (SMO), is used, and alongside it, three other different machine learning techniques. The attributes that were used were the time between the packets and direction; however, the authors classified the sequences of three consecutive DNP3 messages, and each packet is classified individually, using the same attributes.
3.1. The Peekaboo Attack
The Peekaboo attack, proposed in [6], takes into consideration the re-transmission strategy of the unsolicited response messages of the DNP3 protocol. The sequence numbers of the unsolicited responses, and its re-transmission messages, are independent of the sequence number used in the solicited responses generated by poll request packets from the master. An attack is possible in this scenario because, as long as the poll response packets are delivered and replied, the master station can not tell if an attacker dropped the unsolicited responses packets and its re-transmissions, which contain important data from the outstations.
The scenario of the attack proposed in [6] considers a master and an outstation communicating through a wide area network, using DNP3 over a UDP-encrypted IPsec tunnel using ESP. The outstation reports measurement data, such as power flow and voltage, using the unsolicited report-by-exception mode, where the outstations report the measurement data, by replying to poll request messages sent by the master or by sending unsolicited responses when a relative change of a measured value exceeds a threshold. The master is configured to send a confirmation upon the receipt of an unsolicited response. If the outstation does not receive a confirmation for an unsolicited response, it retries sending until the confirmation is received or until the number of retries exceeds a threshold. This scenario also considers that there is only one IPsec tunnel per DNP3 connection.
The attacker, in order to perform an attack on the data reported to the outstation to the master, while undetected, has access to a component of the communication network, as a switch, a router, or a communication link. The attacker can observe the IPsec tunnels traversing the network, identify the IPsec tunnel that carries DNP3 traffic, and observe the encapsulated DNP3 messages sequences and drop individual messages.
The data used to create and evaluate the machine learning model was based on three measurement datasets, collected at a medium-voltage substation power distribution system operator. The measurements were taken for 7 consecutive days, and include the voltage and electric power of the phases of a three-phase electric power system. The unsolicited responses were generated by the outstation, based on the measurements of the datasets in response to voltage magnitude, and active and reactive power flow changes with a threshold of 1%. The master is configured to send poll requests every 500, 1000, 1500, 2000, 2500, 3000, or 3500 s, and the outstation sends a solicited report after the receipt of the poll requests, considering a round trip time (RTT) exponentially distributed with an average of 1 s.
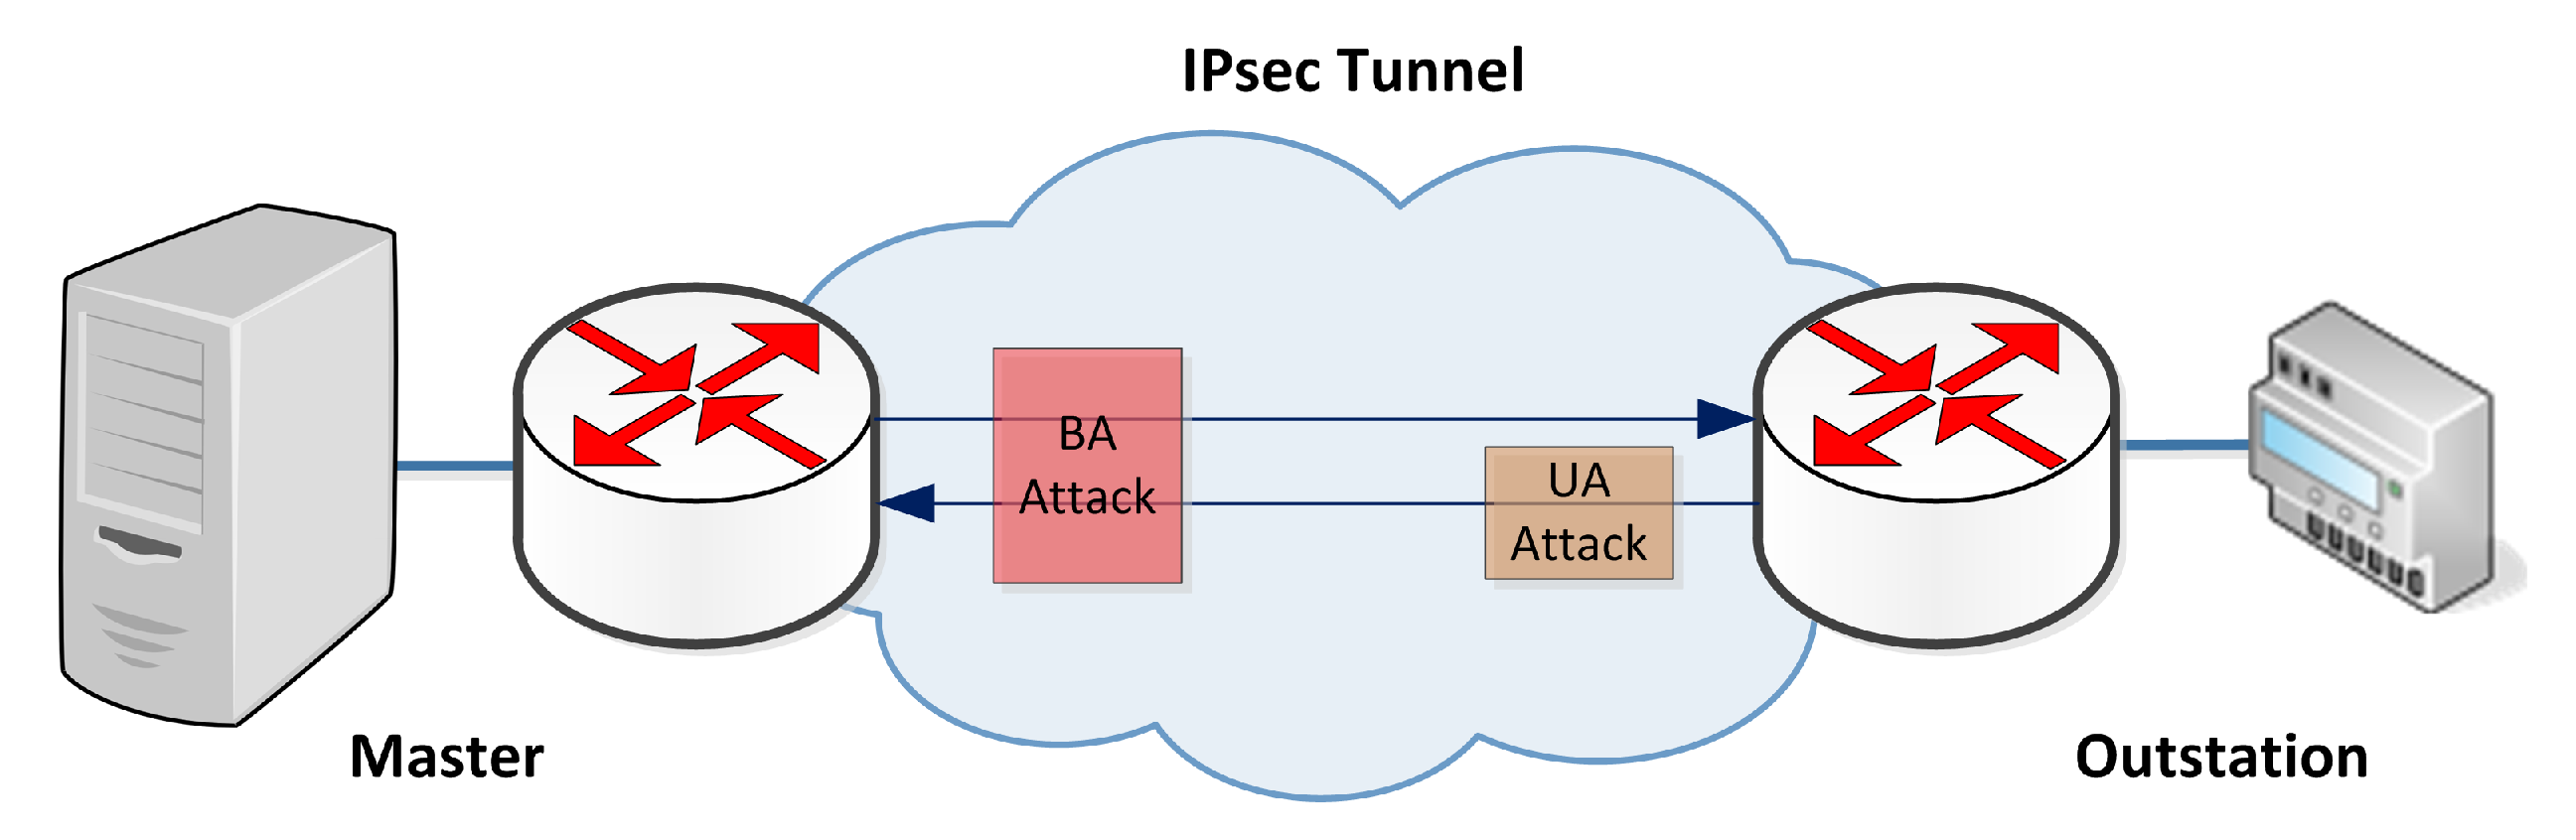
Two models of the attack were proposed: Unidirectional access (UA), in which the attacker can only observe the messages sent from the outstation to the master, and Bidirectional access (BA), in which the attacker can observe the messages sent in both directions. An illustration of the UA and BA models of attack is in Figure 1.
In order to perform a Peekaboo attack, as proposed in [6], the attacker should discard the unsolicited response packets and, as long those packets are not delivered, the master cannot notice the missing sequence numbers. The poll request and the solicited response packets should not be discarded, in order for the attacker to remain undetected. To perform the attack, the attacker must then identify the intercepted message. The goal of the attacker is to maximize the probability of correctly classifying unsolicited responses and its re-transmissions, while minimizing the probability of incorrectly classifying a poll request or a solicited response.
The attacker used to identify the messages in the tunnel is a Support Vector Machine (SVM).
4. Methodology and Simulation Architecture
The simulated DNP3 traffic is based on the measures obtained from three measurement datasets—A, F, and J—collected at three medium voltage substations of an interface of a power distribution system operator. Each dataset measurement entry has the date and time the measure was taken, and the voltage and power of each of phase of a three-phase electric power system.
The DNP3 traffic simulated is bidirectional and based on the DNP3 report by exception operation mode over UDP, encrypted using IPsec/ESP on transport mode, with each message being sent individually. This operation mode is widely adopted, to limit bandwidth in private IP cost per byte networks [3].
The simulation uses the direction as an attribute in the classification. However, the length of the packet is not considered since IPsec is used in the simulation, and this protocol can add a random padding to the packets to conceal the real size of it.
The simulation is divided into two scenarios: In the first scenario, the DNP3 traffic is normal among the master and the outstations; therefore, no packets are dropped at the communication link by a Peekaboo attack. In the second scenario, selected packets of the DNP3 traffic are dropped at the link by a man-in-the-middle attacker, which can identify the DNP3 packets using machine learning algorithms. Figure 2 outlines the three outstations related to the datasets A, F, and J, performing the DNP3 protocol over the same communication link.
The traffic was simulated using Java programming. Based on the measurements of the datasets A, F, and J, a simulated Unsolicited Response () packet is sent on the link, by a simulated outstation’s router, when an event occurs. The trigger, or event, to initiate a new unsolicited report series is the variation of the total power of the three-phase electric power system greater than a variation between two consecutive measures, based on the datasets.
Each scenario was divided in two parts: In the first part of each scenario, the trigger is equal to 1%; that is, when the total power between two consecutive measures in greater than 1%, an packet is sent. In the second part, is equal to 10%.
In the first scenario, the simulated router on the master side replies immediately (when it receives an unsolicited response packet) with a Unsolicited Response Reply (). This scenario is attack-free.
In the second scenario, all the packets are dropped by the Man-in-the-Middle (MITM) attacker in the link (see Figure 2), who is performing a Peekaboo attack. As the outstation does not receive the before the confirmation timer times out, it sends a identical retry Unsolicited Response Retransmission () message, re-transmitting the same content of the packet that was dropped by the attacker, with the same DNP3 sequence number of the packet dropped. The confirmation timer is set to one second. The identical retry message is sent after a random time, to avoid collision. The outstation tries to re-transmit the message up to three times. If the reply is not received, the data is added in the next packet, or in the next Solicited Response (); that is, if an trigger-event happens or a Poll Requests () message is received, the outstation terminates the current unsolicited response series and the data is sent in a new or packet.
The simulated master’s router sends Poll Requests () periodically, which are replied with a Solicited Response () with the report of the most recently measured values by the outstations. Five poll request intervals t were simulated in both scenarios: Five, ten, fifteen, twenty, and twenty-five minutes.
The simulation creates traffic, which is observed by a man-in-the-middle (MITM) sniffer at the communication link, based on the communication among the routers of the outstations and the master. It can capture and observe sequences of consecutive IPSec/ESP packets and classify each packet individually. Each simulation generates a new dataset with multiple entries, in which each contains the time between the message and the previous message, the time between the message and the next message, the direction of the message, and the message type—if it is a , - or (in the attack situation) -, or packet. Figure 3 shows the attributes which are simulated and can be observed by the MITM sniffer.
In the simulations, an exponentially distributed random Round-trip delay time (RTT), distributed with an average of 200 ms, is considered. Additionally, the packets sent by each router also consider an exponentially distributed delay.
An illustration of the detail of type of message simulated in both scenarios, with and without Peekaboo attack, is outlined in Figure 4.
A summary of the simulation of both parts of both scenarios is shown in Table 1. In the table, also, is the packet type which is simulated in each scenario.
The twenty generated datasets, ten in each scenario, are used as entries to train machine learning models in Weka [14], a software that implements a collection of machine learning algorithms for data mining tasks. In the first scenario, the goal is to evaluate if it is possible to gather significant information about the SCADA system by intercepting and classifying the encrypted DNP3 traffic. In the second scenario, the goal is to evaluate if it is possible to perform a Peekaboo attack by dropping selected pre-classified encrypted DNP3 traffic packets. The dataset files generated by the simulations, together with machine learning algorithms, are used to create machine learning models to classify individual DNP3 encrypted packets in the link, by the MITM attacker.
The first packet of every simulation is discarded, as the time between it and the previous packet does not exist. Each dataset contains a list of the simulated packets, one per line. The information that each simulated packet contains is its direction, the time between it and the previous packet, the time between it and the next packet, and the type of the packet—, - or -, and . The information that represents each packet are used as attributes in the relation—columns in the data—and the packets type are the classes in the classification process. The attributes used in an ARFF (Attribute-Relation File Format) file (that is, an ASCII text file describing a list of instances sharing a set of attributes) are listed in Table 2 [15].
The classes are the DNP3 packet types: , - or (in an attack scenario simulation) -, and .
Four different classification techniques are used, together with the datasets, to compare the results and to indicate the most suitable classifier model that can be used to gather information about the traffic and the most suitable classifier model to perform a Peekaboo attack.
The Peekaboo attack (Section 3.1) drops all of the packets and its re-transmissions () minimizing the possibility of dropping packets and its replies (), in order to not be noticed by an operator.
The four different classification techniques that are used in Weka were [15]:
- Nearest-Neighbor Classifier: Weka’s IBk (http://weka.sourceforge.net/doc.dev/weka/classifiers/lazy/IBk.html), with number of nearest neighbors equal to five and KDTree as the search algorithm;
- Bayesian Classifier: Weka’s naive Bayes (http://weka.sourceforge.net/doc.dev/weka/classifiers/bayes/NaiveBayes.html);
- Decision Tree: Weka’s J48 (http://weka.sourceforge.net/doc.dev/weka/classifiers/trees/J48.html), whcih is an implementation of the C4.5 algorithm; and
- Support Vector Machine: Weka’s SMO (http://weka.sourceforge.net/doc.dev/weka/classifiers/functions/SMO.html) classifier, which implements John Platt’s sequential minimal optimization algorithm for training a support vector classifier.
The methodology chosen to validate the model was 10-fold cross-validation, and the results reported were calculated based on this.
5. Results and Discussion
The traffic originated in the first scenario is normal; that is, in which no packet is being dropped at the link. The scenario is implemented to be used with machine learning algorithms to create classification models that are used to evaluate if it is possible to get information about the SCADA system by its encrypted traffic, and by knowledge of how the DNP3 protocol works.
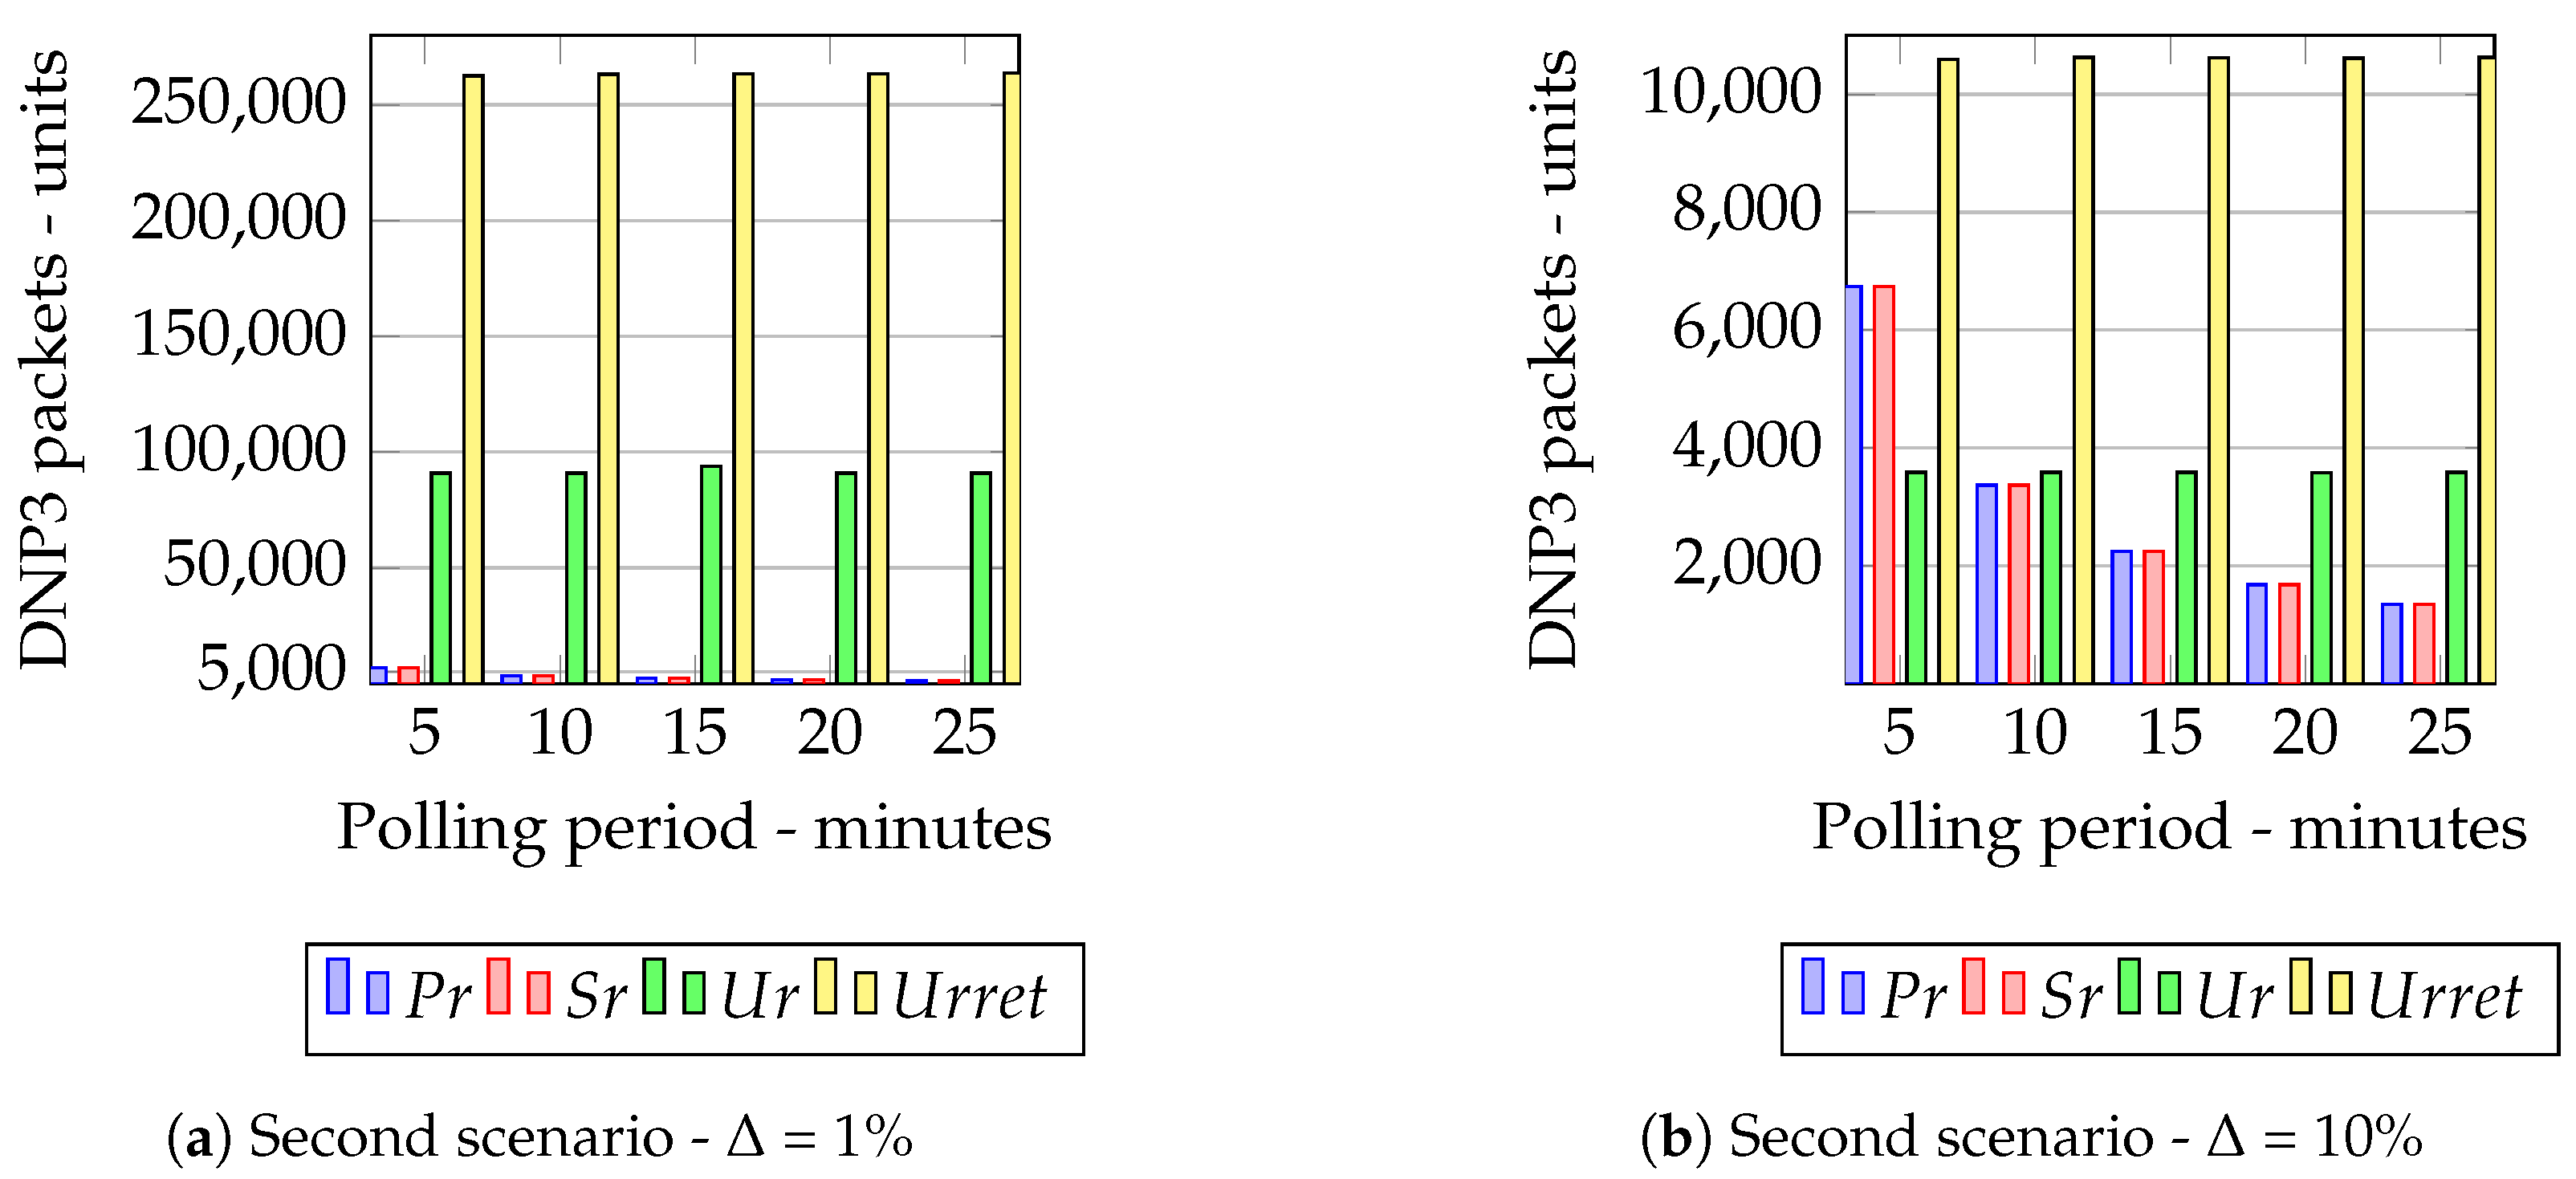
Ten different ARFF files resulted from the first simulation scenario. The first part of the simulation resulted in five different ARFF files, in which the = 1%, and the second part resulted in five more ARFF files with = 10%. Each packet, or instance, is a line in an ARFF file, which contains the direction of the packet and the time between the packets as attributes to be used in the classification process, and this ARFF file is used in Weka to create machine learning models, alongside machine learning algorithms. The message distribution from the first part is shown in Figure 5a, and from the second part in Figure 5b.
The traffic originated in the first part of the first scenario is very heterogeneous, where the majority of the messages are Unsolicited Responses () and Unsolicited Responses Replies (), and the minority are Poll Requests () or Solicited Responses () packets. The traffic originated in the second part is more homogeneous, in which the amount of and packets is close to the amount of and packets.
The traffic originated in the second simulation scenario is based on a Peekaboo attack, where all of the and packets are being dropped at the communication link by the MITM sniffer. This scenario is implemented to be used with the machine learning algorithms to create a classification models, which will be used to evaluate if it is possible to perform a Peekaboo attack in a SCADA system.
Ten different ARFF files resulted from the second simulation scenario. The first part of the simulation resulted in five different ARFF files, in which the = 1%, and the second part resulted in five more ARFF files with = 10%. The message distribution from the first part is shown in Figure 6a, and from the second part in Figure 6b.
The traffic originated in the first part of the first scenario is very heterogeneous, where the majority of the messages are , followed by , and the minority are or packets. The traffic originated in the second part is more homogeneous, in which the amount of the packets is not so disparate.
Both scenarios implemented are to be used with machine learning algorithms, to create classification models. The traffic files originated in the first scenario are to be used with different machine learning techniques to evaluate if it is possible to gather information about the SCADA system by its encrypted traffic and knowledge of how the DNP3 protocol works. The traffic files originated in the second scenario are to be used with different machine learning techniques to evaluate if it is possible to perform a Peekaboo attack.
The values of were chosen to illustrate two different DNP3 traffic scenarios, in which the proportion among the and messages vary.
In the report by exception operation mode of the DNP3 protocol, an outstation reports all significant events by sending packets, so it is possible to the attacker to gather information about the behavior of the system by classifying correctly all the packets in the communication.
The four different classification algorithms used were chosen to represent four different classification methodologies: Decision trees, a probabilistic model, support vector machines, and instance-based classifiers.
5.1. First Scenario Classification Results
The goal in this scenario is to evaluate if it is possible to get information about the SCADA system by its encrypted traffic, and by knowledge of how the DNP3 protocol works. In the report by exception operation mode of the DNP3 protocol, the outstation reports all important events with Ur packets, and so it is possible for the attacker to gather information about the behavior of the system by classifying correctly all the packets in the communication.
Since the datasets are not homogeneous, to evaluate the classification results it is necessary to observe the accuracy by class—observing each instance individually. The F-measure was used to compare the results, among the four classification techniques that were used. The F-Measure is the harmonic mean of precision (retrieved instances that are relevant) and the recall (relevant instances that are retrieved) [15]. The F-measure is a value between zero and one and, to correctly classify most of the instances in its correct class, the value must be close to one.
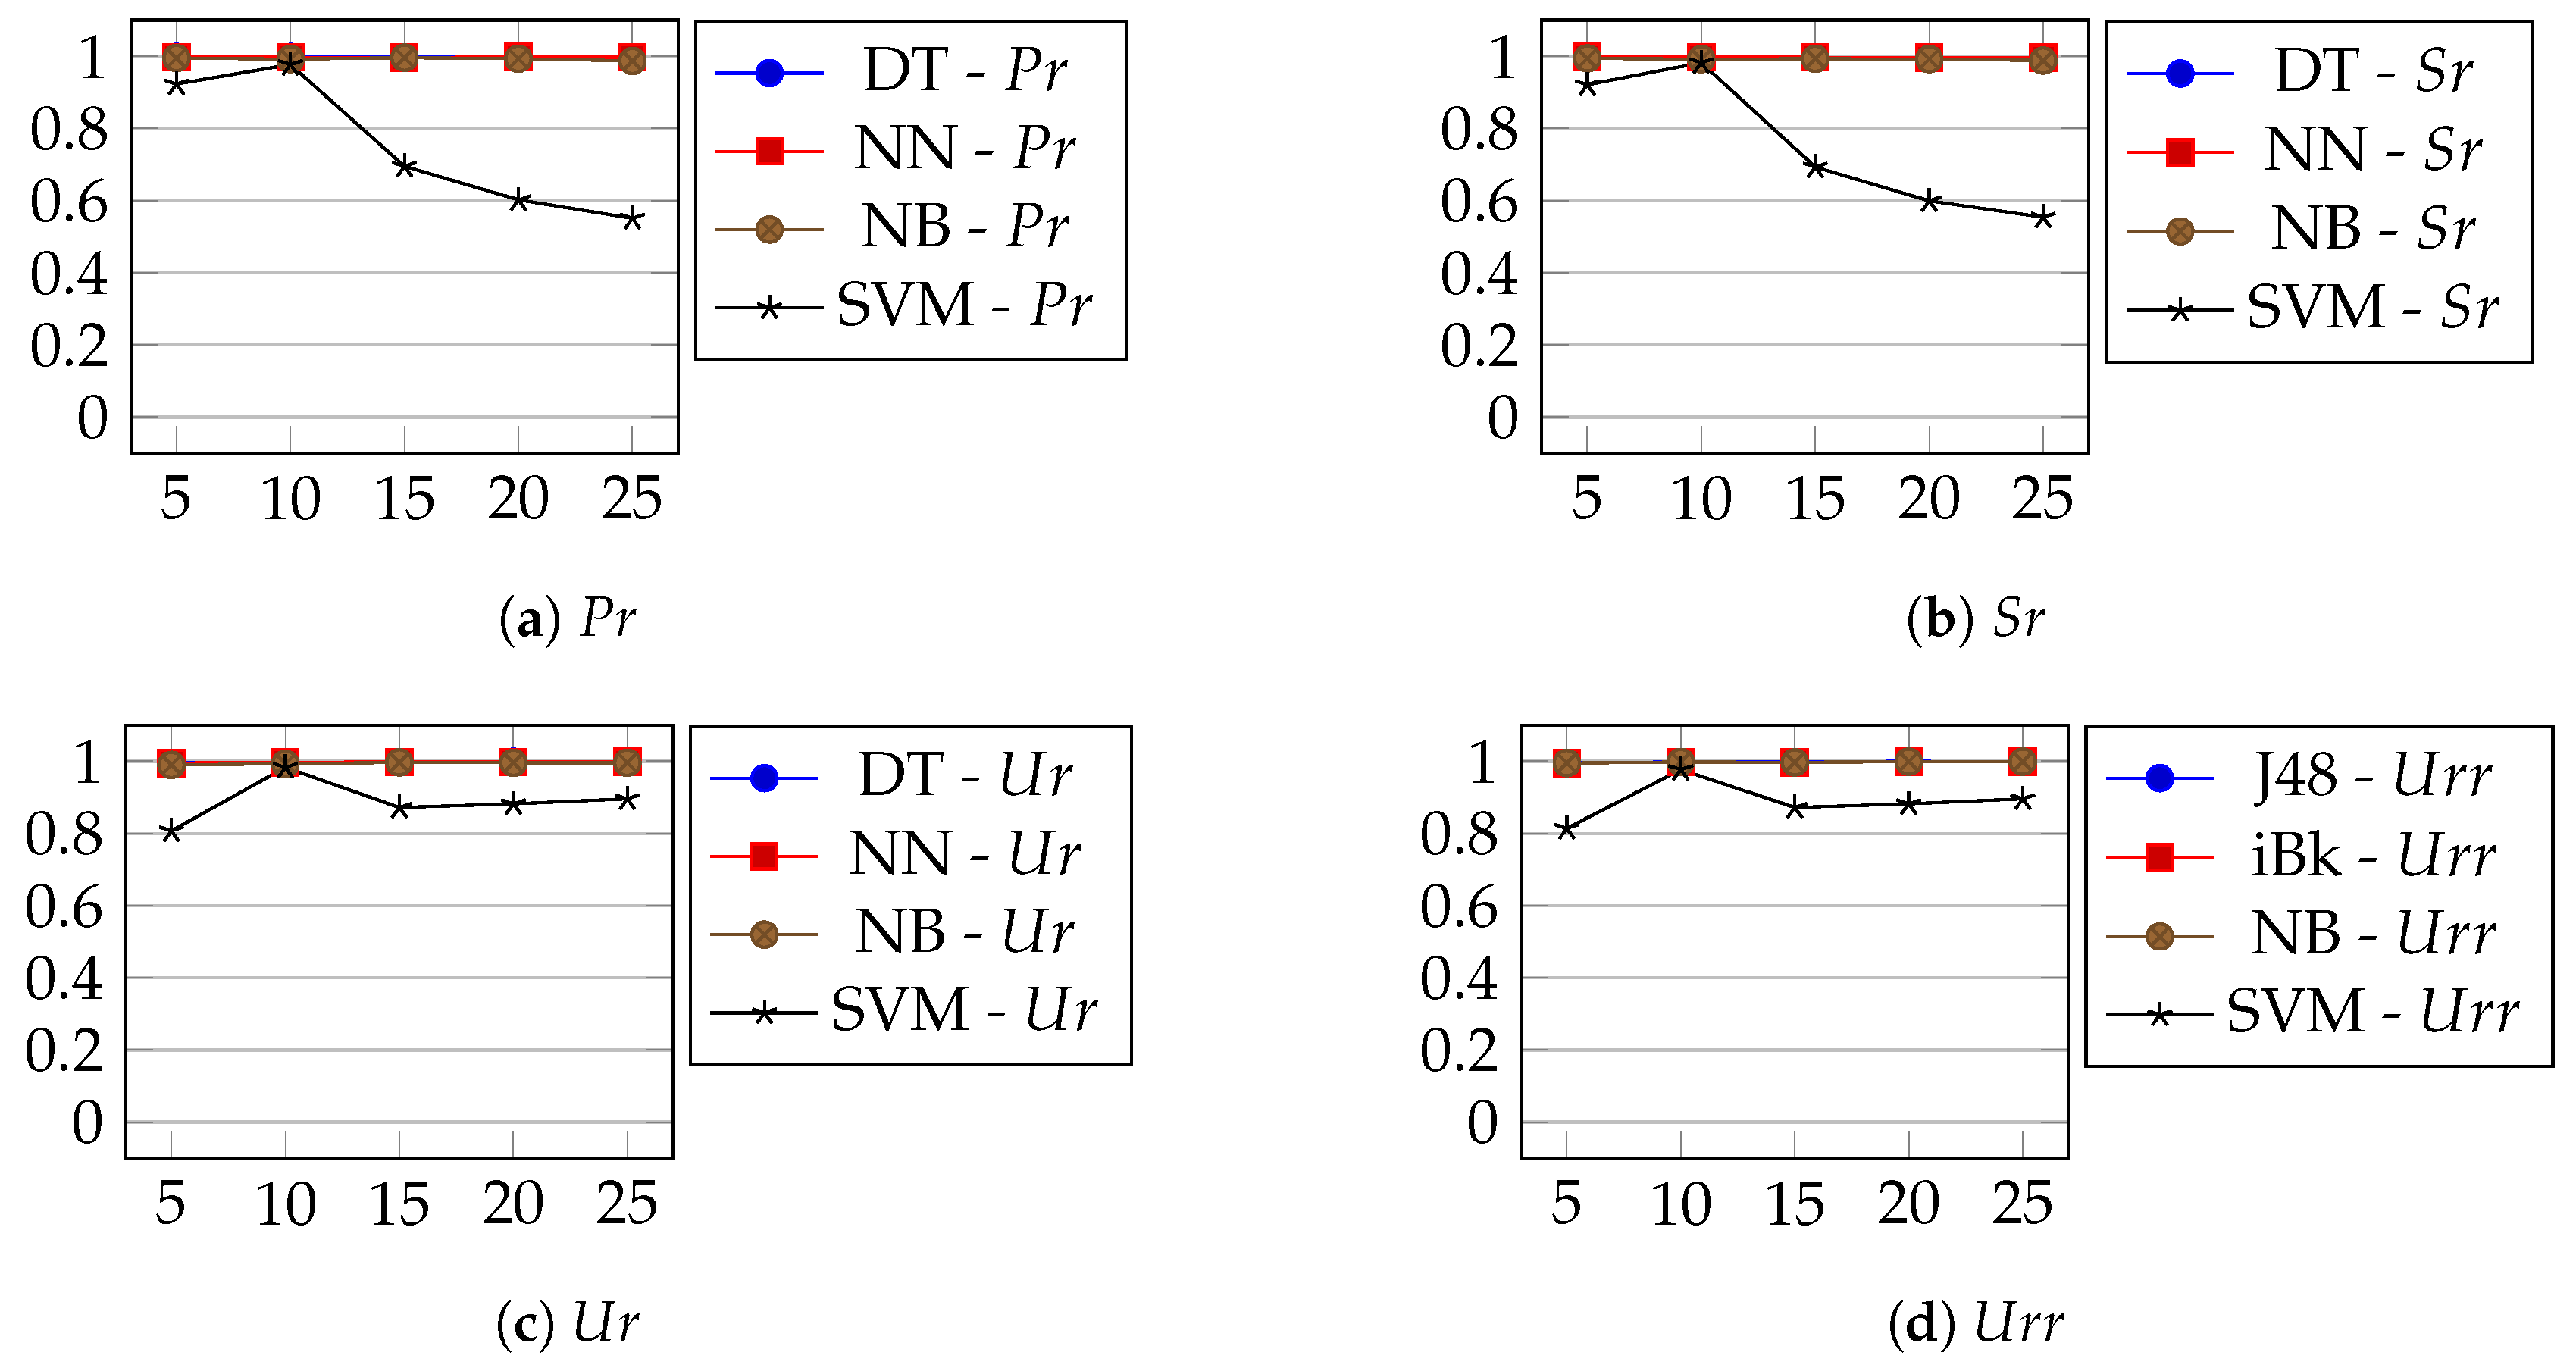
The results are presented in Figure 7, in which the graphs represent the F-measure vs. the polling period interval of the datasets simulated. In Figure 7a,b, the results are presented for the and packets. Both decision tree (DT) and nearest-neighbor (NN) algorithms classified the packets better, according to the F-measure values obtained. In Figure 7c,d, the results are presented for the and packets. All four techniques classified the packets equally, presenting a good result: Decision Tree (DT), Nearest-Neighbor (NN), Naive Bayes (NB), and Support Vector Machine (SVM).
According to the results, the decision tree (DT) and nearest-neighbor (NN) techniques are more suited to achieve the objective proposed: To gather information on the SCADA system, by correctly classifying each encrypted DNP3 traffic packet. Since the F-measure values of these techniques are high (more than 0.95 for all of the classes), the packets of encrypted DNP3 traffic are mostly correctly classified, and it is possible to gather information about the system.
The results of the second part of the first simulation scenario are presented in Figure 8, in which the graphs represent the F-measure vs. the polling period interval of the datasets simulated. In Figure 8a,b, the results are presented for the and packets. Decision tree (J48), nearest-neighbor (ibK), and naive Bayes algorithms classified the packets better, according to the F-measure values obtained. In Figure 8c,d, the results are presented for the Ur and packets, showing that the same algorithms presented the best results.
According to the results, the decision tree, nearest-neighbor and Naive Bayes techniques are more suited to achieve the objective proposed. Since the F-measure values by these techniques are high (more than 0.95 for all the classes), the packets of encrypted DNP3 traffic are mostly correctly classified and it is possible to gather information about the SCADA system in the second part of the first scenario as well.
By analyzing the results obtained in both parts, it is possible to get information about the SCADA system by its encrypted traffic and by knowledge of how the DNP3 protocol works.
5.2. Second Scenario Classification Results
The goals in this scenario are, mainly, to evaluate if it is possible to perform a Peekaboo attack, and to evaluate if it is possible to get information about the system by its encrypted traffic in a environment where the traffic is more heterogeneous, if compared to the traffic generated in first scenario.
To perform a Peekaboo attack, an attacker must drop all the Unsolicited Response () and Unsolicited Response Retransmission (); however, in order for the attack to remain unnoticed, all the Poll Request () and Solicited Response () packets must not be dropped. So, in a Peekaboo attack, the MITM attacker wants to maximize the drop of the and packets, while minimizing the drop of the and packets.
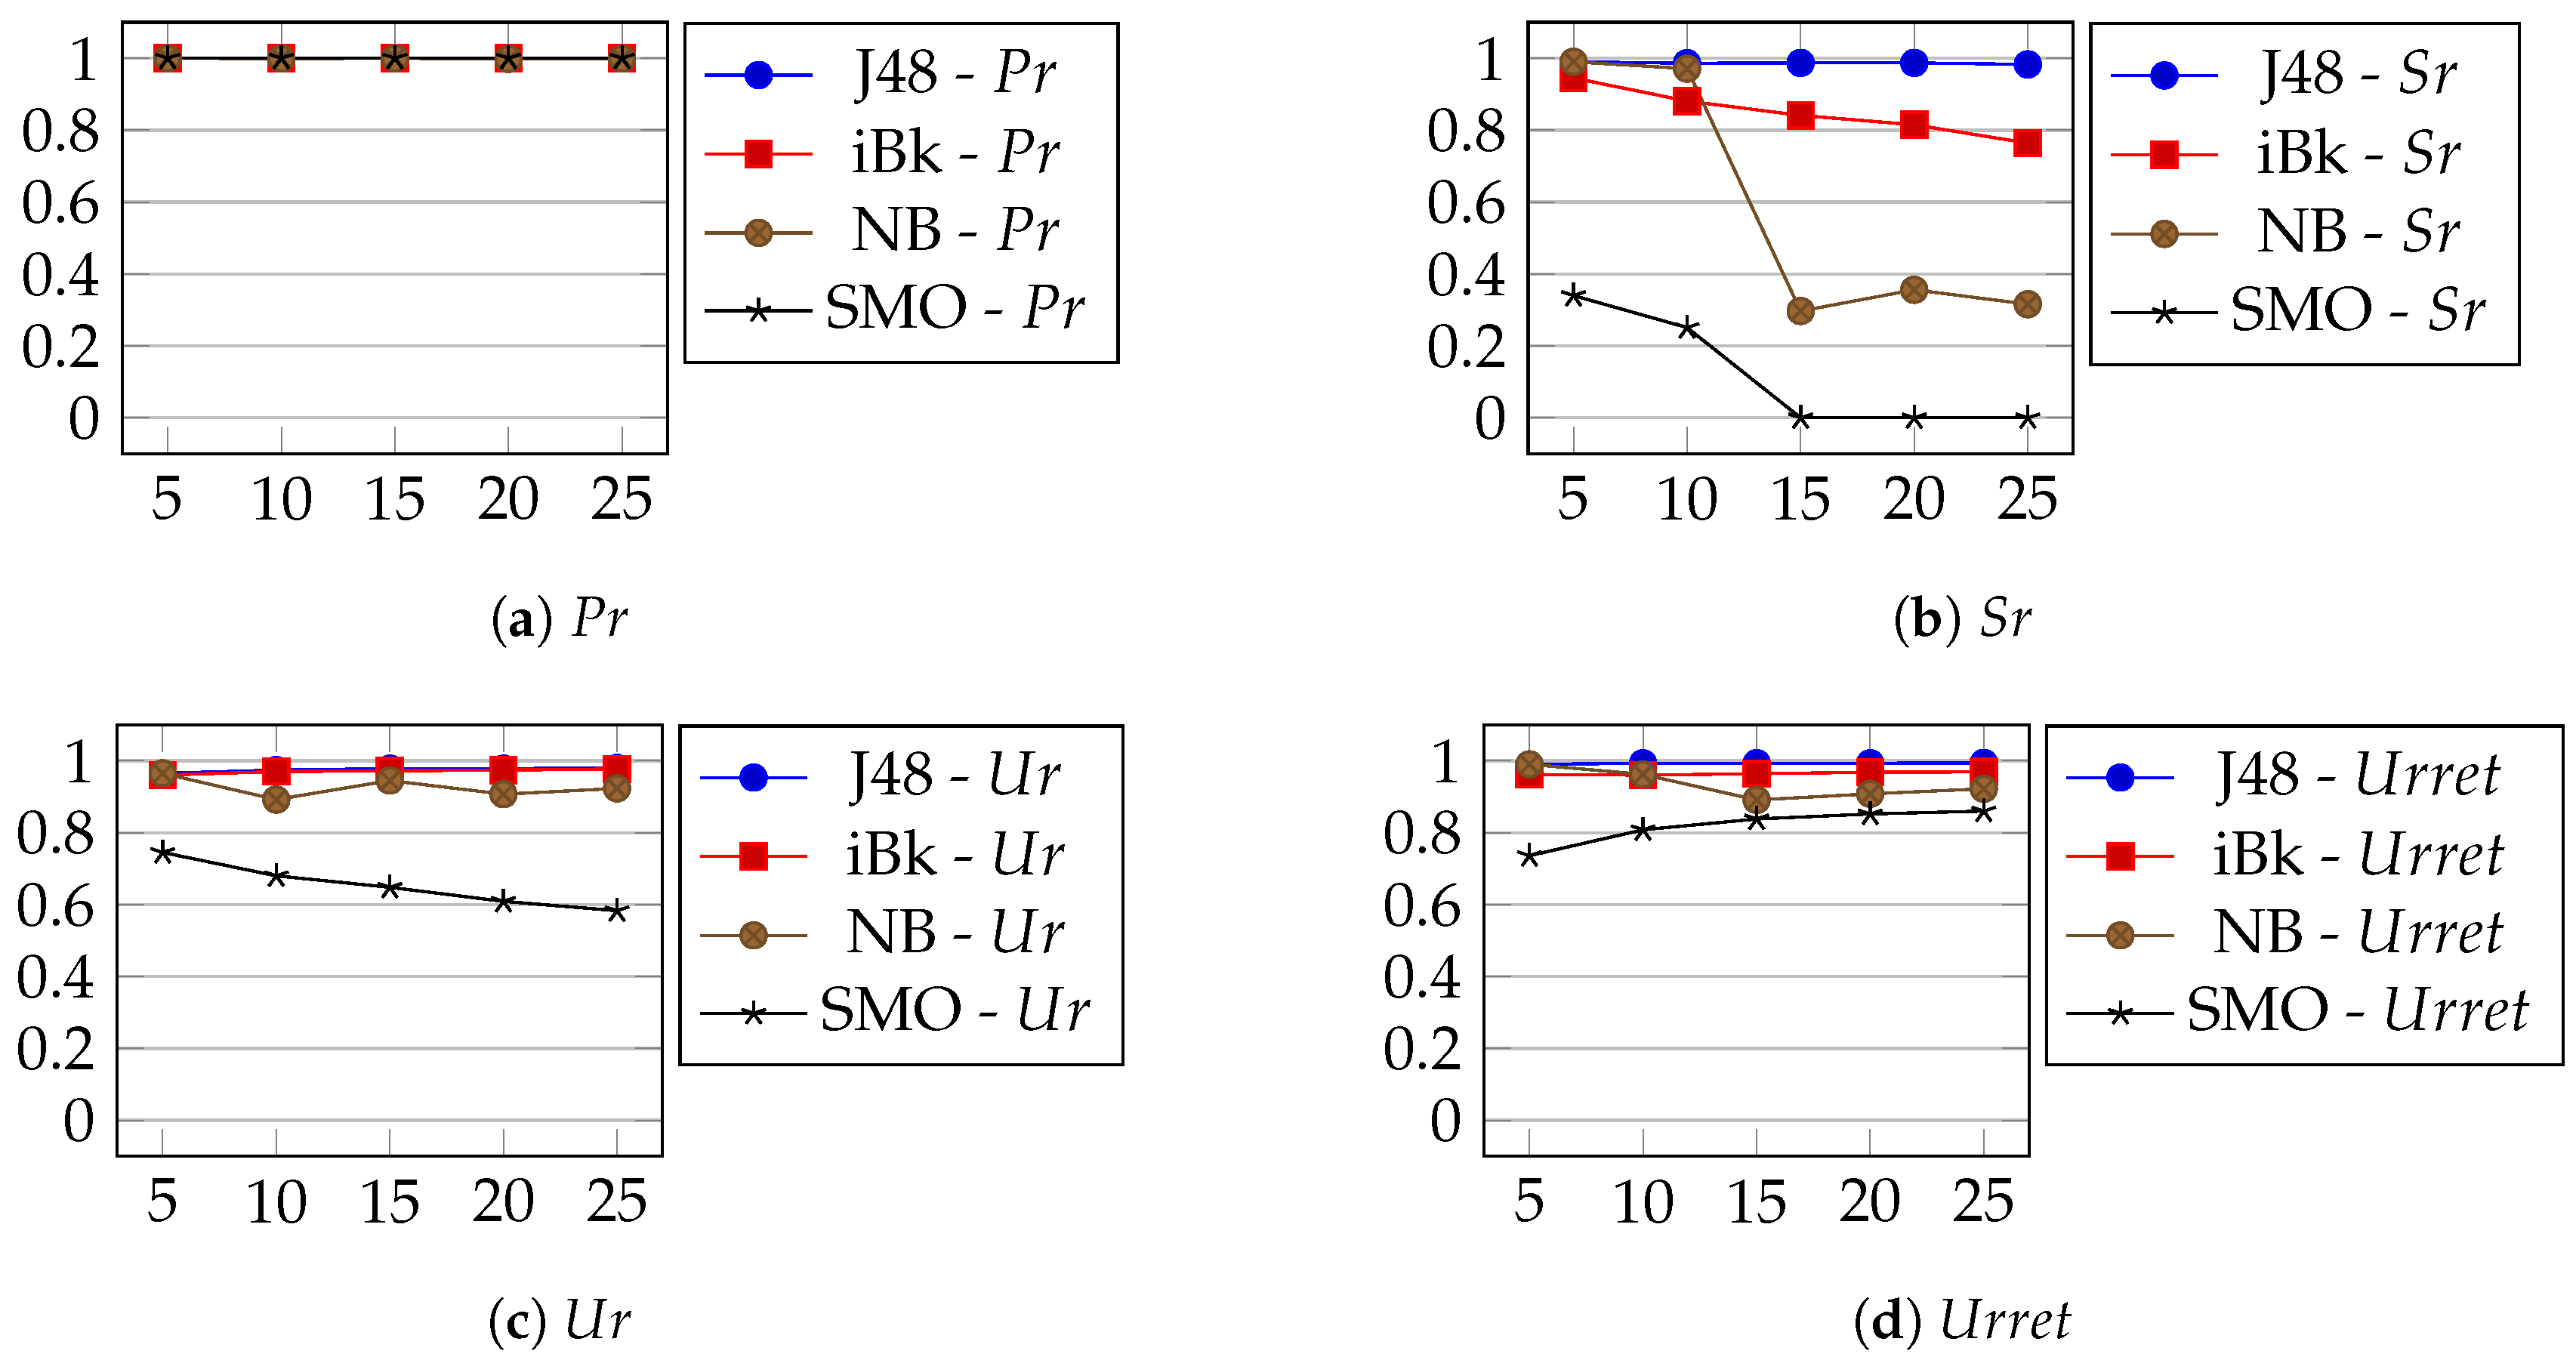
The results of the first part of the second simulation scenario are presented in Figure 9, in which the graphs represent the F-measure vs. the polling period interval of the datasets simulated. In Figure 9a, the result is presented for the packet , showing that the four techniques performed well to classify this message. However, Figure 9b shows that the results obtained for the packet classification are not as good as the , and some packets would be dropped in a Peekaboo attack. The algorithm that presented a better result in classifying the packet is J48, having F-measure higher than 0.6 in all poll periods simulated. For the packet classification, presented in Figure 9c, the algorithms that performed best are J48 and ibK, having F-measure higher than 0.8 in all poll periods simulated. In Figure 9d, the result is presented for the packet , showing that all four techniques performed well to classify this message.
According to the results, the decision tree technique is more suited to perform a Peekaboo attack, and to get information about the encrypted traffic in a more heterogeneous scenario.
The results of the second part of the second simulation scenario are presented in Figure 10, in which the graphs represent the F-measure vs. the polling period interval of the datasets simulated. In Figure 10a, the result is presented for the packet , showing that all four techniques performed well to classify this message. Figure 10b shows that the algorithm that presented a better result to classify the packet is J48, having F-measure close to 1 in all poll periods simulated. In Figure 10c,d, the classification results for the and Urret messages are shown, and the algorithms that performed better are J48 and ibK, having F-measure higher than 0.9 in all poll periods simulated.
According to the results, the nearest-neighbor and decision tree techniques are more suited to perform a Peekaboo attack in the second part of the second scenarios, and to get information about the encrypted traffic in a more heterogeneous scenario.
The results show that it is possible to perform a Peekaboo attack in both parts of the second scenario, maximizing the dropping of and packets while minimizing the dropping of and packets. However, in the decision tree model, fewer packets would be dropped (compared to the nearest-neighbor model), and it would be more suitable, in order to have the attack remain unnoticed by the operator. To gather information about the traffic in the link, both models would have similar results; however, since the decision tree generates a tree that can be used to better understand the model, it would also be a better model (compared to nearest-neighbor) to observe and acquire information about the network traffic.
6. Conclusions
The objective was to study if it was possible to gather information about the SCADA system by intercepting and classifying each packet of the encrypted DNP3 traffic communication individually and also, by classifying individual packets, this work aimed to study if it was possible to perform a Peekaboo attack on encrypted IPSEC ESP DNP3 traffic, by dropping selected packets in the communication link using supervised machine learning models.
To achieve the goal, two scenarios of encrypted DNP3 traffic were simulated. In the first scenario, the traffic simulated was normal: No packet was being dropped by an attacker. In the second scenario, the traffic was simulated based on what is expected in a Peekaboo attack scenario, where all of the packets are dropped and retransmitted with messages, which are also dropped. Each scenario was divided into two parts, in which the trigger to initiate a message series was = 1% or = 10%.
The datasets generated were used as training sets for four different supervised machine learning techniques. To evaluate the accuracy, the F-measure was used as a parameter.
The results showed that it is possible to gather knowledge about the system through its communication, by using supervised learning techniques to classify each individual packet, in two distinct traffic scenarios. The results extended the study of the original Peekaboo attack [6] from one substation to multiple substations by using a selection of machine learning algorithms. The decision-tree learning algorithm has shown more effectiveness than the SVM algorithm, in recognition of encrypted UDP communication flows over multiple substations.
It follows that it is possible to perform a Peekaboo attack with multiple substations, by dropping selected packets using machine learning models. The Peekaboo attack can blind, for some minutes, a SCADA operator, and can even cause a disruption in the system, since the DNP3 protocol working in the report by exception operation mode transmits significant data, and this data is not being delivered as expected.
Author Contributions
The authors contributed equally to this work.
Funding
This research received no external funding.
Conflicts of Interest
The authors declare no conflict of interest.
References
- Wang, W.; Lu, Z. Survey Cyber Security in the Smart Grid: Survey and Challenges. Comput. Netw. 2013, 57, 1344–1371. [Google Scholar] [CrossRef]
- Larkin, R.D.; Lopez, J., Jr.; Butts, J.W.; Grimaila, M.R. Evaluation of Security Solutions in the SCADA Environment. SIGMIS Database 2014, 45, 38–53. [Google Scholar] [CrossRef]
- Institute of Electrical and Electronics Engineers. IEEE Standard for Electric Power Systems Communications 1815–2012; Institute of Electrical and Electronics Engineers: Rio de Janeiro, Brazil, 2012. [Google Scholar]
- Clarke, G.; Reynders, D.; Wright, E. Practical Modern SCADA Protocols, 1st ed.; Newnes: Oxford, UK, 2004; p. 537. [Google Scholar]
- Cai, J.; Zhang, Z.; Song, X. An analysis of UDP traffic classification. In Proceedings of the 2010 12th IEEE International Conference on Communication Technology, Nanjing, China, 11–14 November 2010; pp. 116–119. [Google Scholar] [CrossRef]
- Torrisi, N.; Vukovic, O.; Dan, G.; Hagdahl, S. Peekaboo: A gray hole attack on encrypted SCADA communication using traffic analysis. In Proceedings of the 2014 IEEE International Conference on Smart Grid Communications (SmartGridComm), Venice, Italy, 3–6 November 2014; pp. 902–907. [Google Scholar]
- Cardwell, L.; Shebanow, A. The Efficacy and Challenges of SCADA and Smart Grid Integration. J. Cyber Secur. Inf. Syst. 2013, 1, 2–213. [Google Scholar]
- Collier, S. Ten Steps to a Smarter Grid. IEEE Ind. Appl. Mag. 2010, 16, 62–68. [Google Scholar] [CrossRef] [Green Version]
- Paterson, K.G. A Cryptographic Tour of the IPsec Standards. Inf. Secur. Tech. Rep. 2006, 11, 72–81. [Google Scholar] [CrossRef]
- Stallings, W. Cryptography and Network Security: Principles and Practice, 6th ed.; Prentice Hall Press: Upper Saddle River, NJ, USA, 2013. [Google Scholar]
- Tan, X.; Su, X.; Qian, Q. The classification of SSH tunneled traffic using maximum likelihood classifier. In Proceedings of the 2011 International Conference on Electronics, Communications and Control (ICECC), Ningbo, China, 9–11 November 2011; pp. 2347–2350. [Google Scholar] [CrossRef]
- Maiolini, G.; Baiocchi, A.; Iacovazzi, A.; Rizzi, A. Real Time Identification of SSH Encrypted Application Flows by Using Cluster Analysis Techniques. In NETWORKING 2009: 8th International IFIP-TC 6 Networking Conference; Fratta, L., Schulzrinne, H., Takahashi, Y., Spaniol, O., Eds.; Springer: Berlin/Heidelberg, Germany, 2009; pp. 182–194. [Google Scholar]
- Rezaei, S.; Liu, X. Deep Learning for Encrypted Traffic Classification: An Overview. arXiv, 2018; arXiv:1810.07906. [Google Scholar]
- Hall, M.; Frank, E.; Holmes, G.; Pfahringer, B.; Reutemann, P.; Witten, I.H. The WEKA Data Mining Software: An Update. SIGKDD Explor. 2009, 11, 10–18. [Google Scholar] [CrossRef]
- Witten, I.H.; Frank, E. Data Mining, 2nd ed.; Elsevier: San Francisco, CA, USA, 2005. [Google Scholar]
Figure 1.
Unidirectional access (UA) and bidirectional access (BA) models of attack.

Figure 2.
Environment simulated, where outstations A, F, and J share the same communication link.

Figure 3.
Attributes used in the machine learning models.

Figure 4.
Detail of the DNP3 messages exchanged between a master and an outstation.

Figure 5.
The first simulation scenario’s message distribution.

Figure 6.
The second simulation scenario’s message distribution.

Figure 7.
Packet classification rates: F-Measure vs. Polling interval.

Figure 8.
Packet classification rates: F-Measure vs. Polling interval.

Figure 9.
Packet classification rates: F-Measure vs. Polling interval.

Figure 10.
Packet classification rates: F-Measure vs. Polling interval.


Table 1.
Summary of both parts of both scenarios.
| First Scenario | Second Scenario | |||
|---|---|---|---|---|
| First Part | 1% | 1% | ||
| Poll Request Interval | 5, 10, 15, 20 or 25 min | Poll Request Interval | 5, 10, 15, 20 or 25 min | |
| Second Part | 10% | 10% | ||
| Poll Request Interval | 5, 10, 15, 20 or 25 min | Poll Request Interval | 5, 10, 15, 20 or 25 min | |
| Packet Type | Label | Message Type | Label | Message Type |
| Unsolicited Response | Unsolicited Response | |||
| Unsolicited Response Reply | Unsolicited Response Retransmission | |||
| Poll Request | Poll Request | |||
| Solicited Response | Solicited Response | |||
Table 2.
Attributes in the ARFF file.
| Attribute Name | Type | Description |
|---|---|---|
| direction | numeric | Direction of the packet—0, from the master to the outstation and 1 from the outstation to the master. |
| timeprev | numeric | The time between the packet and the previous packet before, it in milliseconds. |
| timeaft | numeric | The time between the packet and the next packet after it, in milliseconds. |
© 2019 by the authors. Licensee MDPI, Basel, Switzerland. This article is an open access article distributed under the terms and conditions of the Creative Commons Attribution (CC BY) license (http://creativecommons.org/licenses/by/4.0/).
Share and Cite
MDPI and ACS Style
de Toledo, T.R.; Torrisi, N.M. Encrypted DNP3 Traffic Classification Using Supervised Machine Learning Algorithms. Mach. Learn. Knowl. Extr. 2019, 1, 384-399. https://doi.org/10.3390/make1010022
AMA Style
de Toledo TR, Torrisi NM. Encrypted DNP3 Traffic Classification Using Supervised Machine Learning Algorithms. Machine Learning and Knowledge Extraction. 2019; 1(1):384-399. https://doi.org/10.3390/make1010022
Chicago/Turabian Stylede Toledo, Thais Rodriguez, and Nunzio Marco Torrisi. 2019. "Encrypted DNP3 Traffic Classification Using Supervised Machine Learning Algorithms" Machine Learning and Knowledge Extraction 1, no. 1: 384-399. https://doi.org/10.3390/make1010022