Speleothem Paleoclimatology for the Caribbean, Central America, and North America

 , , and
Abstract
1. Introduction
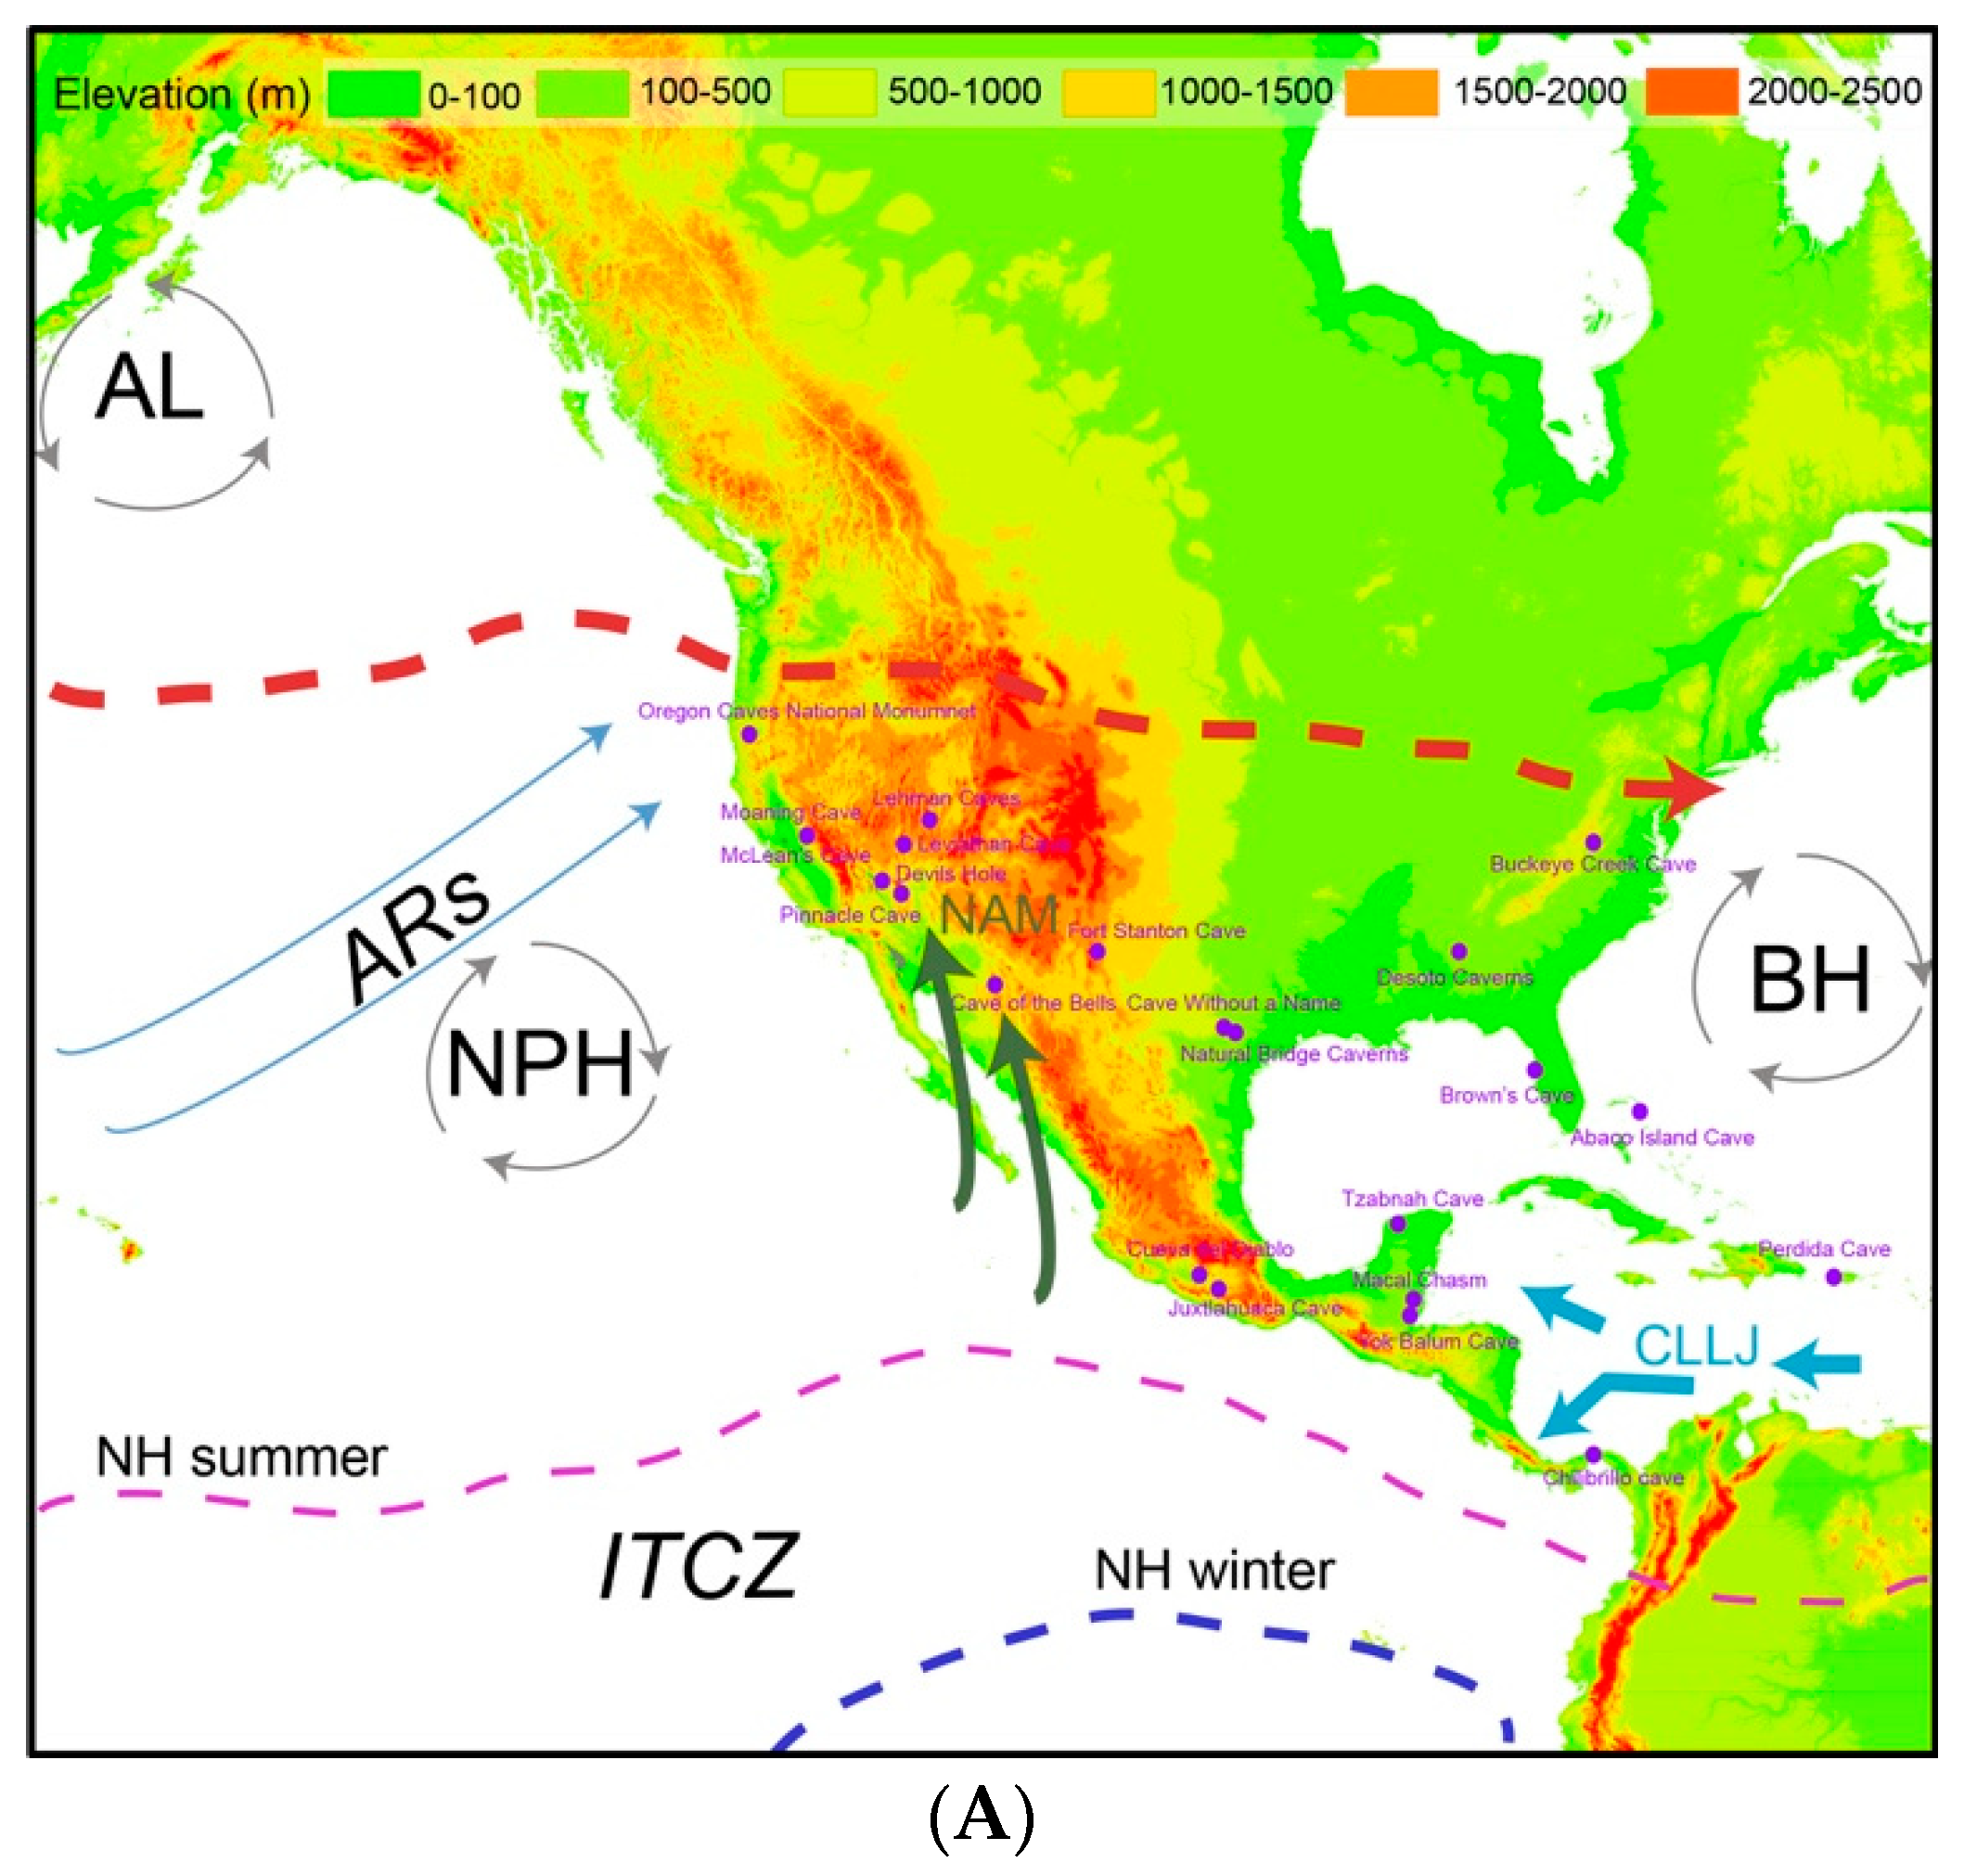
2. Study Region and Climate
2.1. Climate and Controls on δ18Op in Western North America
2.1.1. Climate of Western North America
2.1.2. Controls on δ18Op and δ18Ospel
2.2. Climate and Controls on δ18Op in Eastern North America
2.2.1. Climate of Eastern North America
2.2.2. Controls on δ18Op and δ18Ospel
2.3. Climate and Controls on δ18Op in Central America and the Caribbean
2.3.1. Climate of Central America and the Caribbean
2.3.2. Controls on δ18Op and δ18Ospel
3. North and Central American Speleothem Records in SISAL_v1
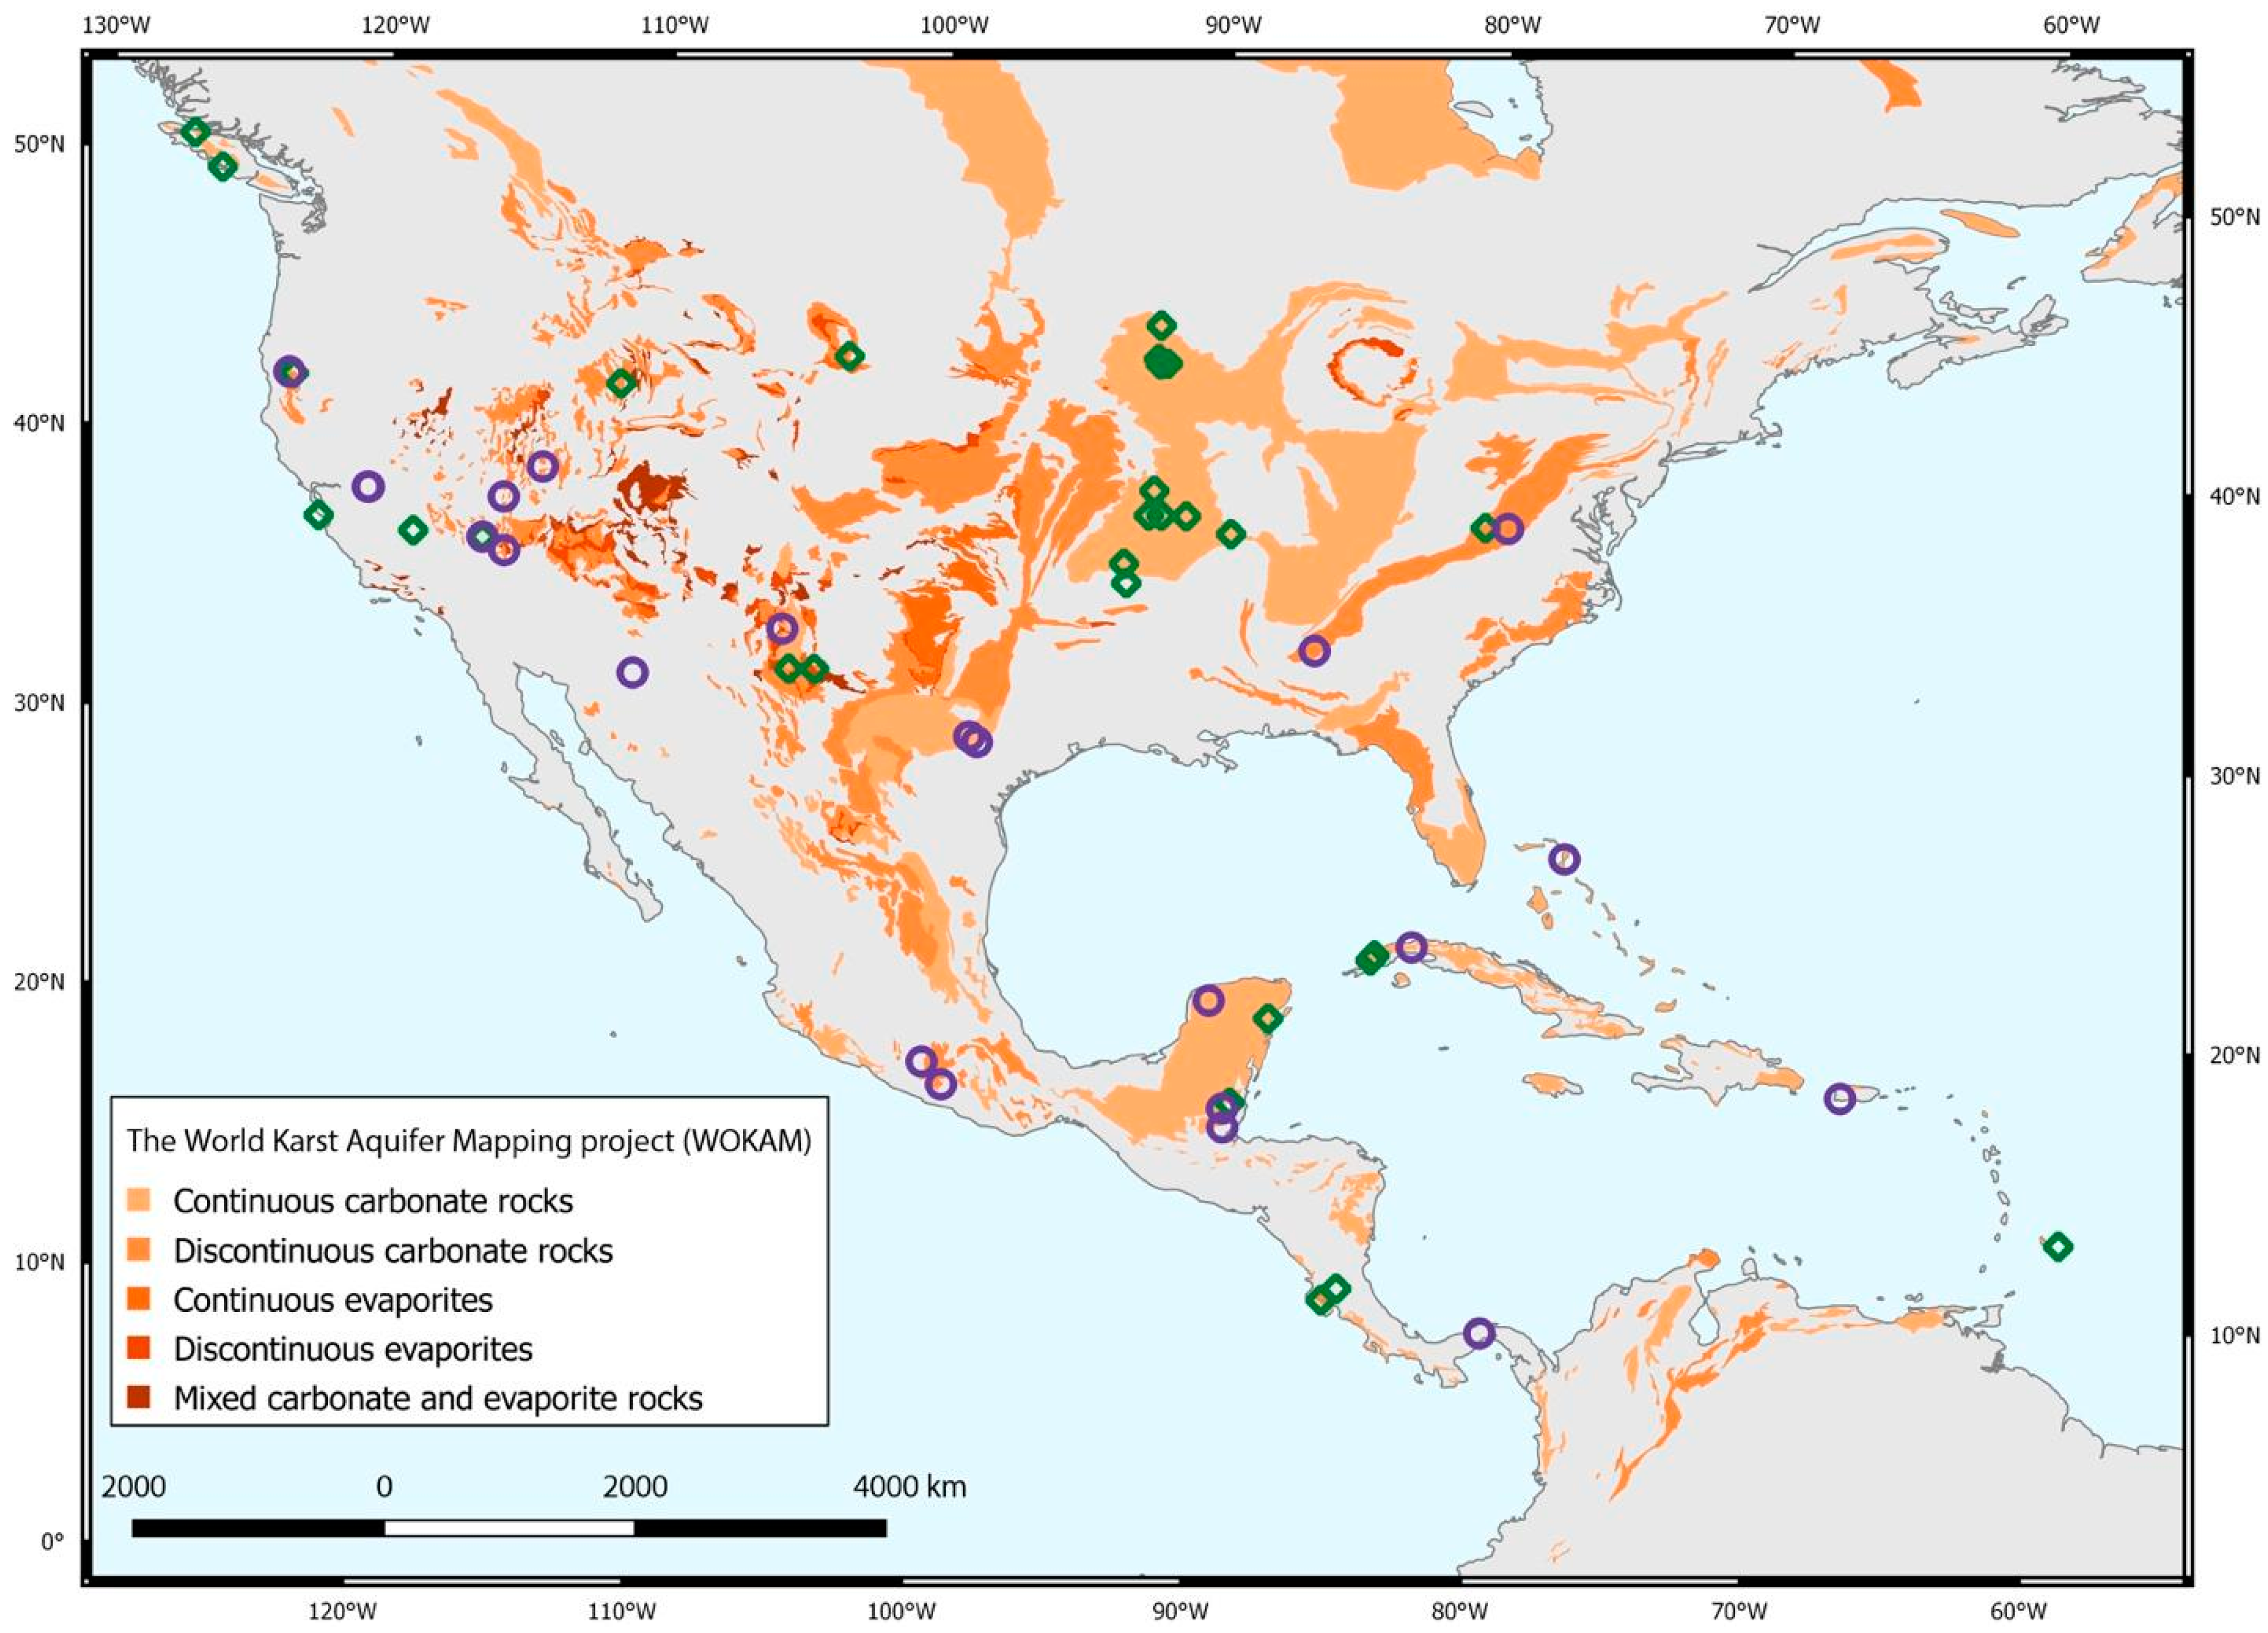
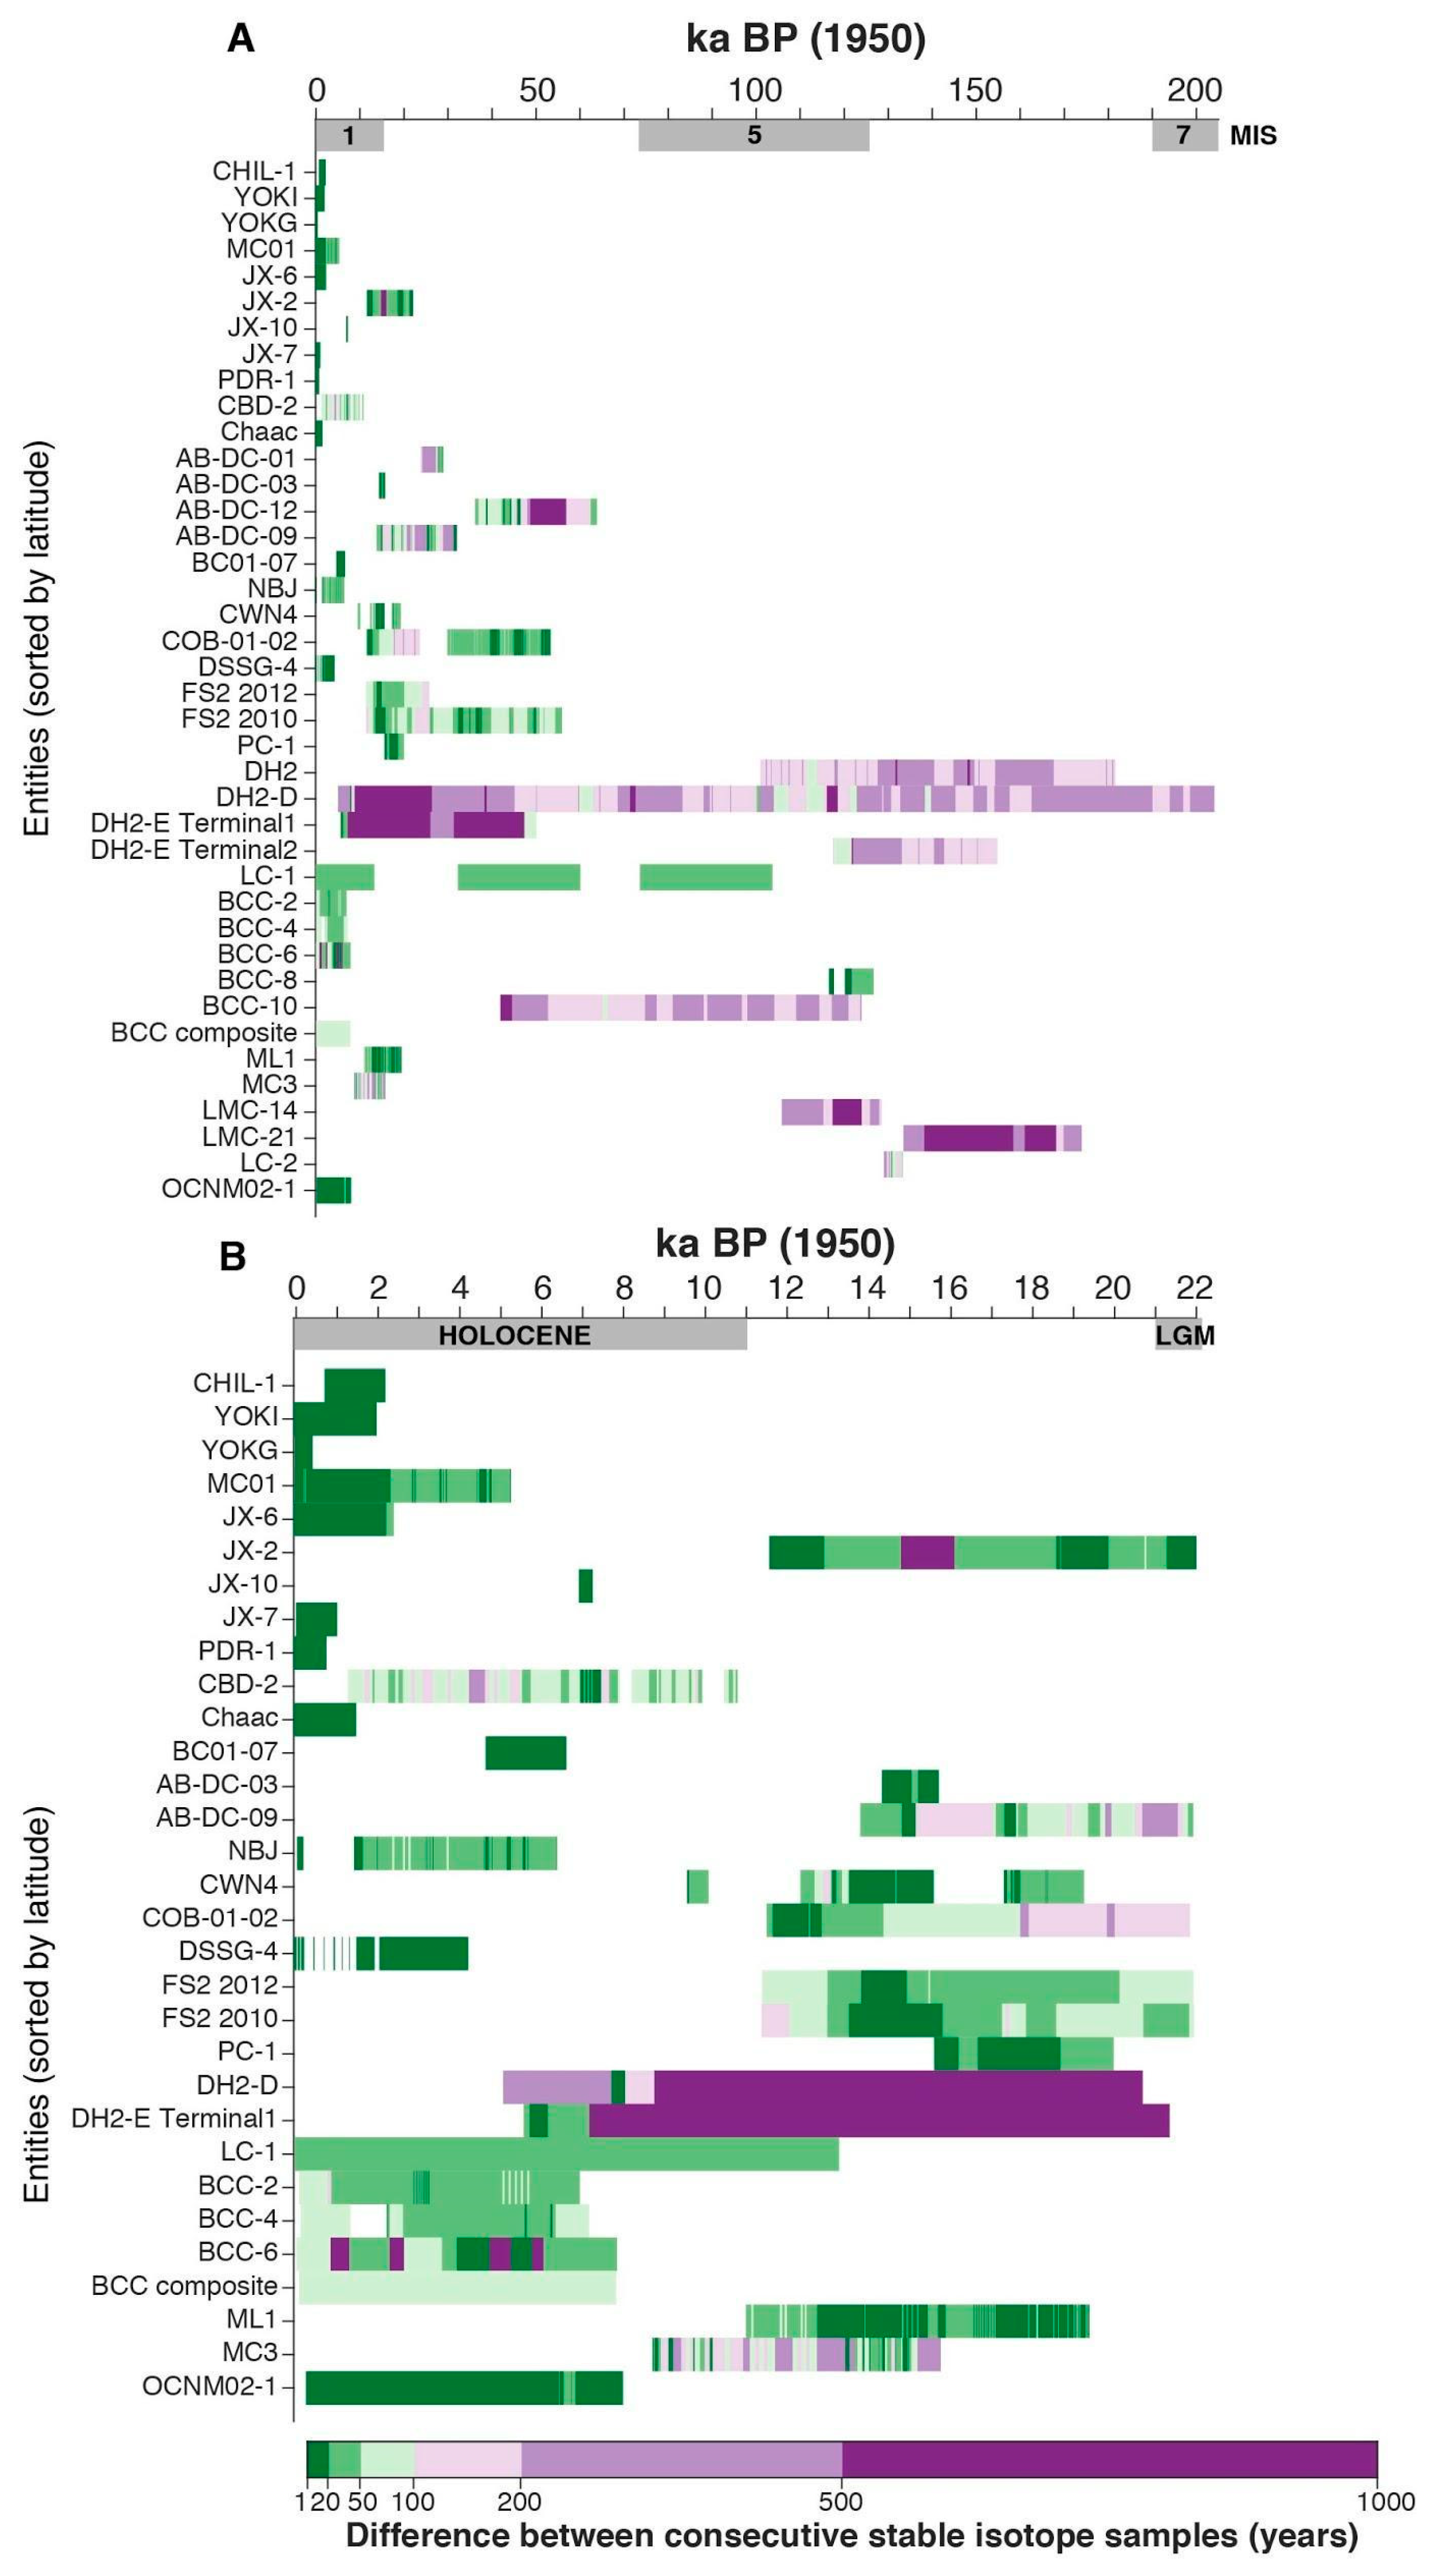
3.1. Spatial and Temporal Coverage and Regional Potential
3.2. Monitoring and Instrumental Data Availability
4. Patterns in δ18Ospel in North and Central America through Time
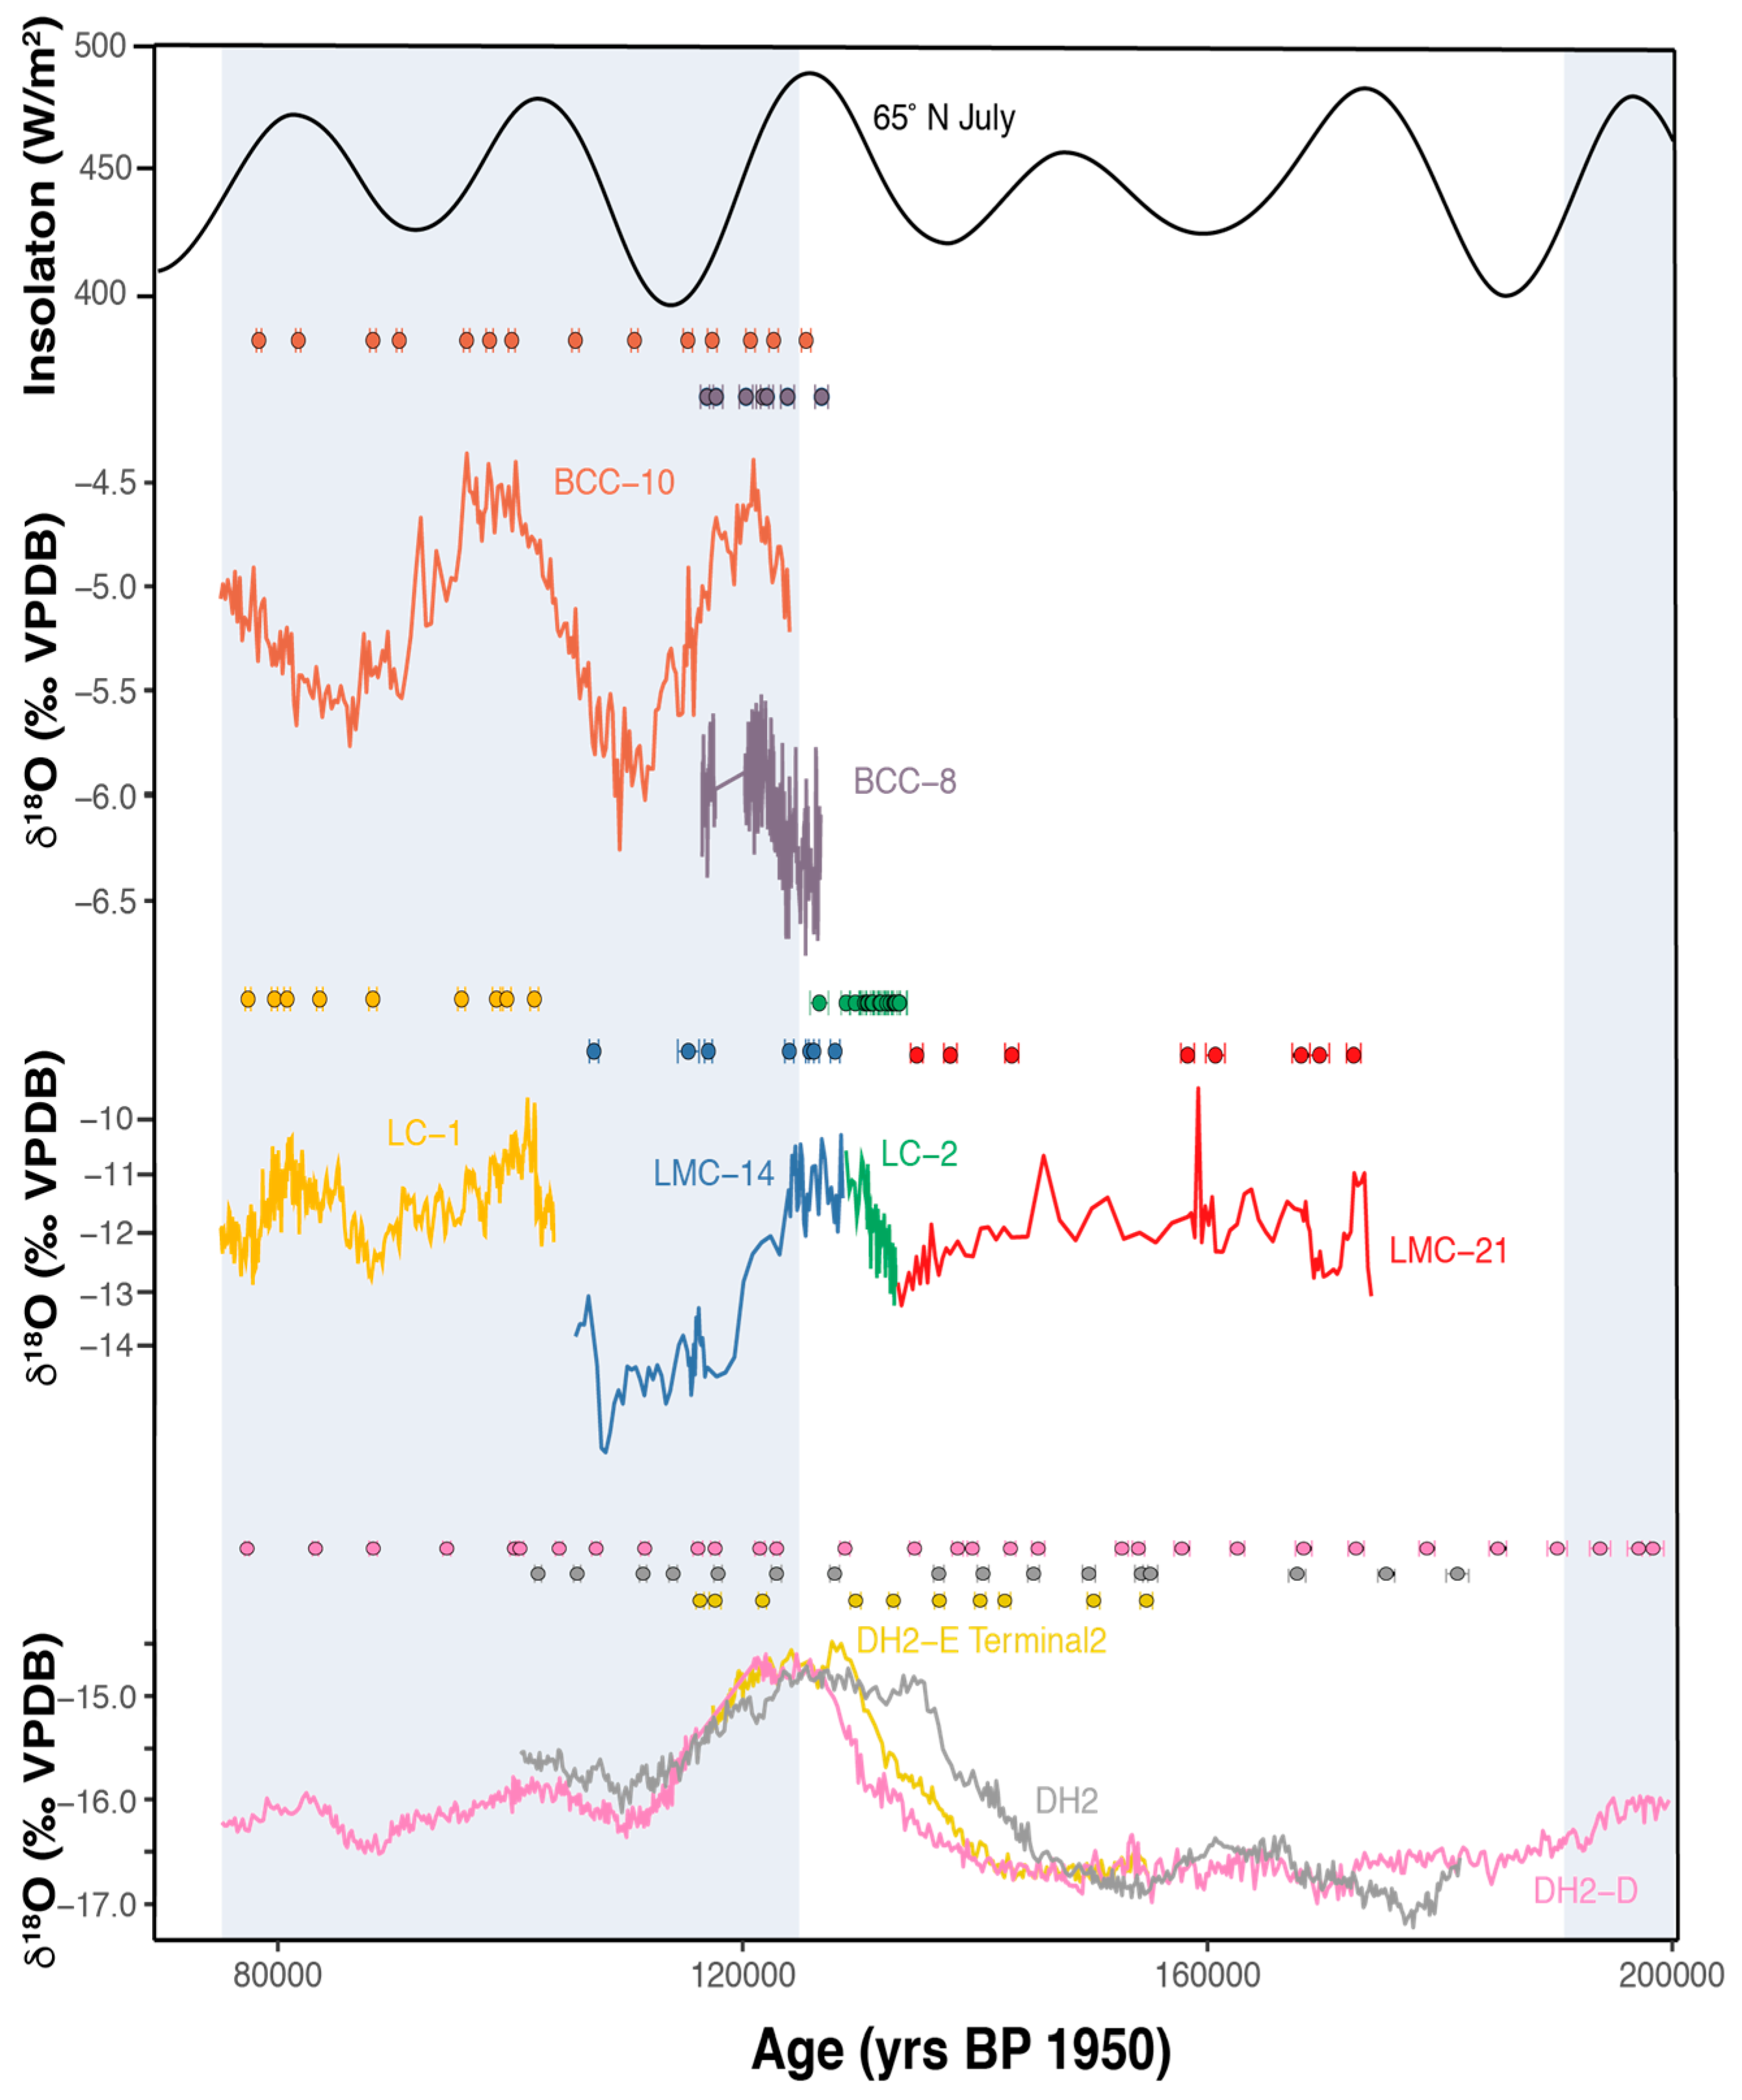
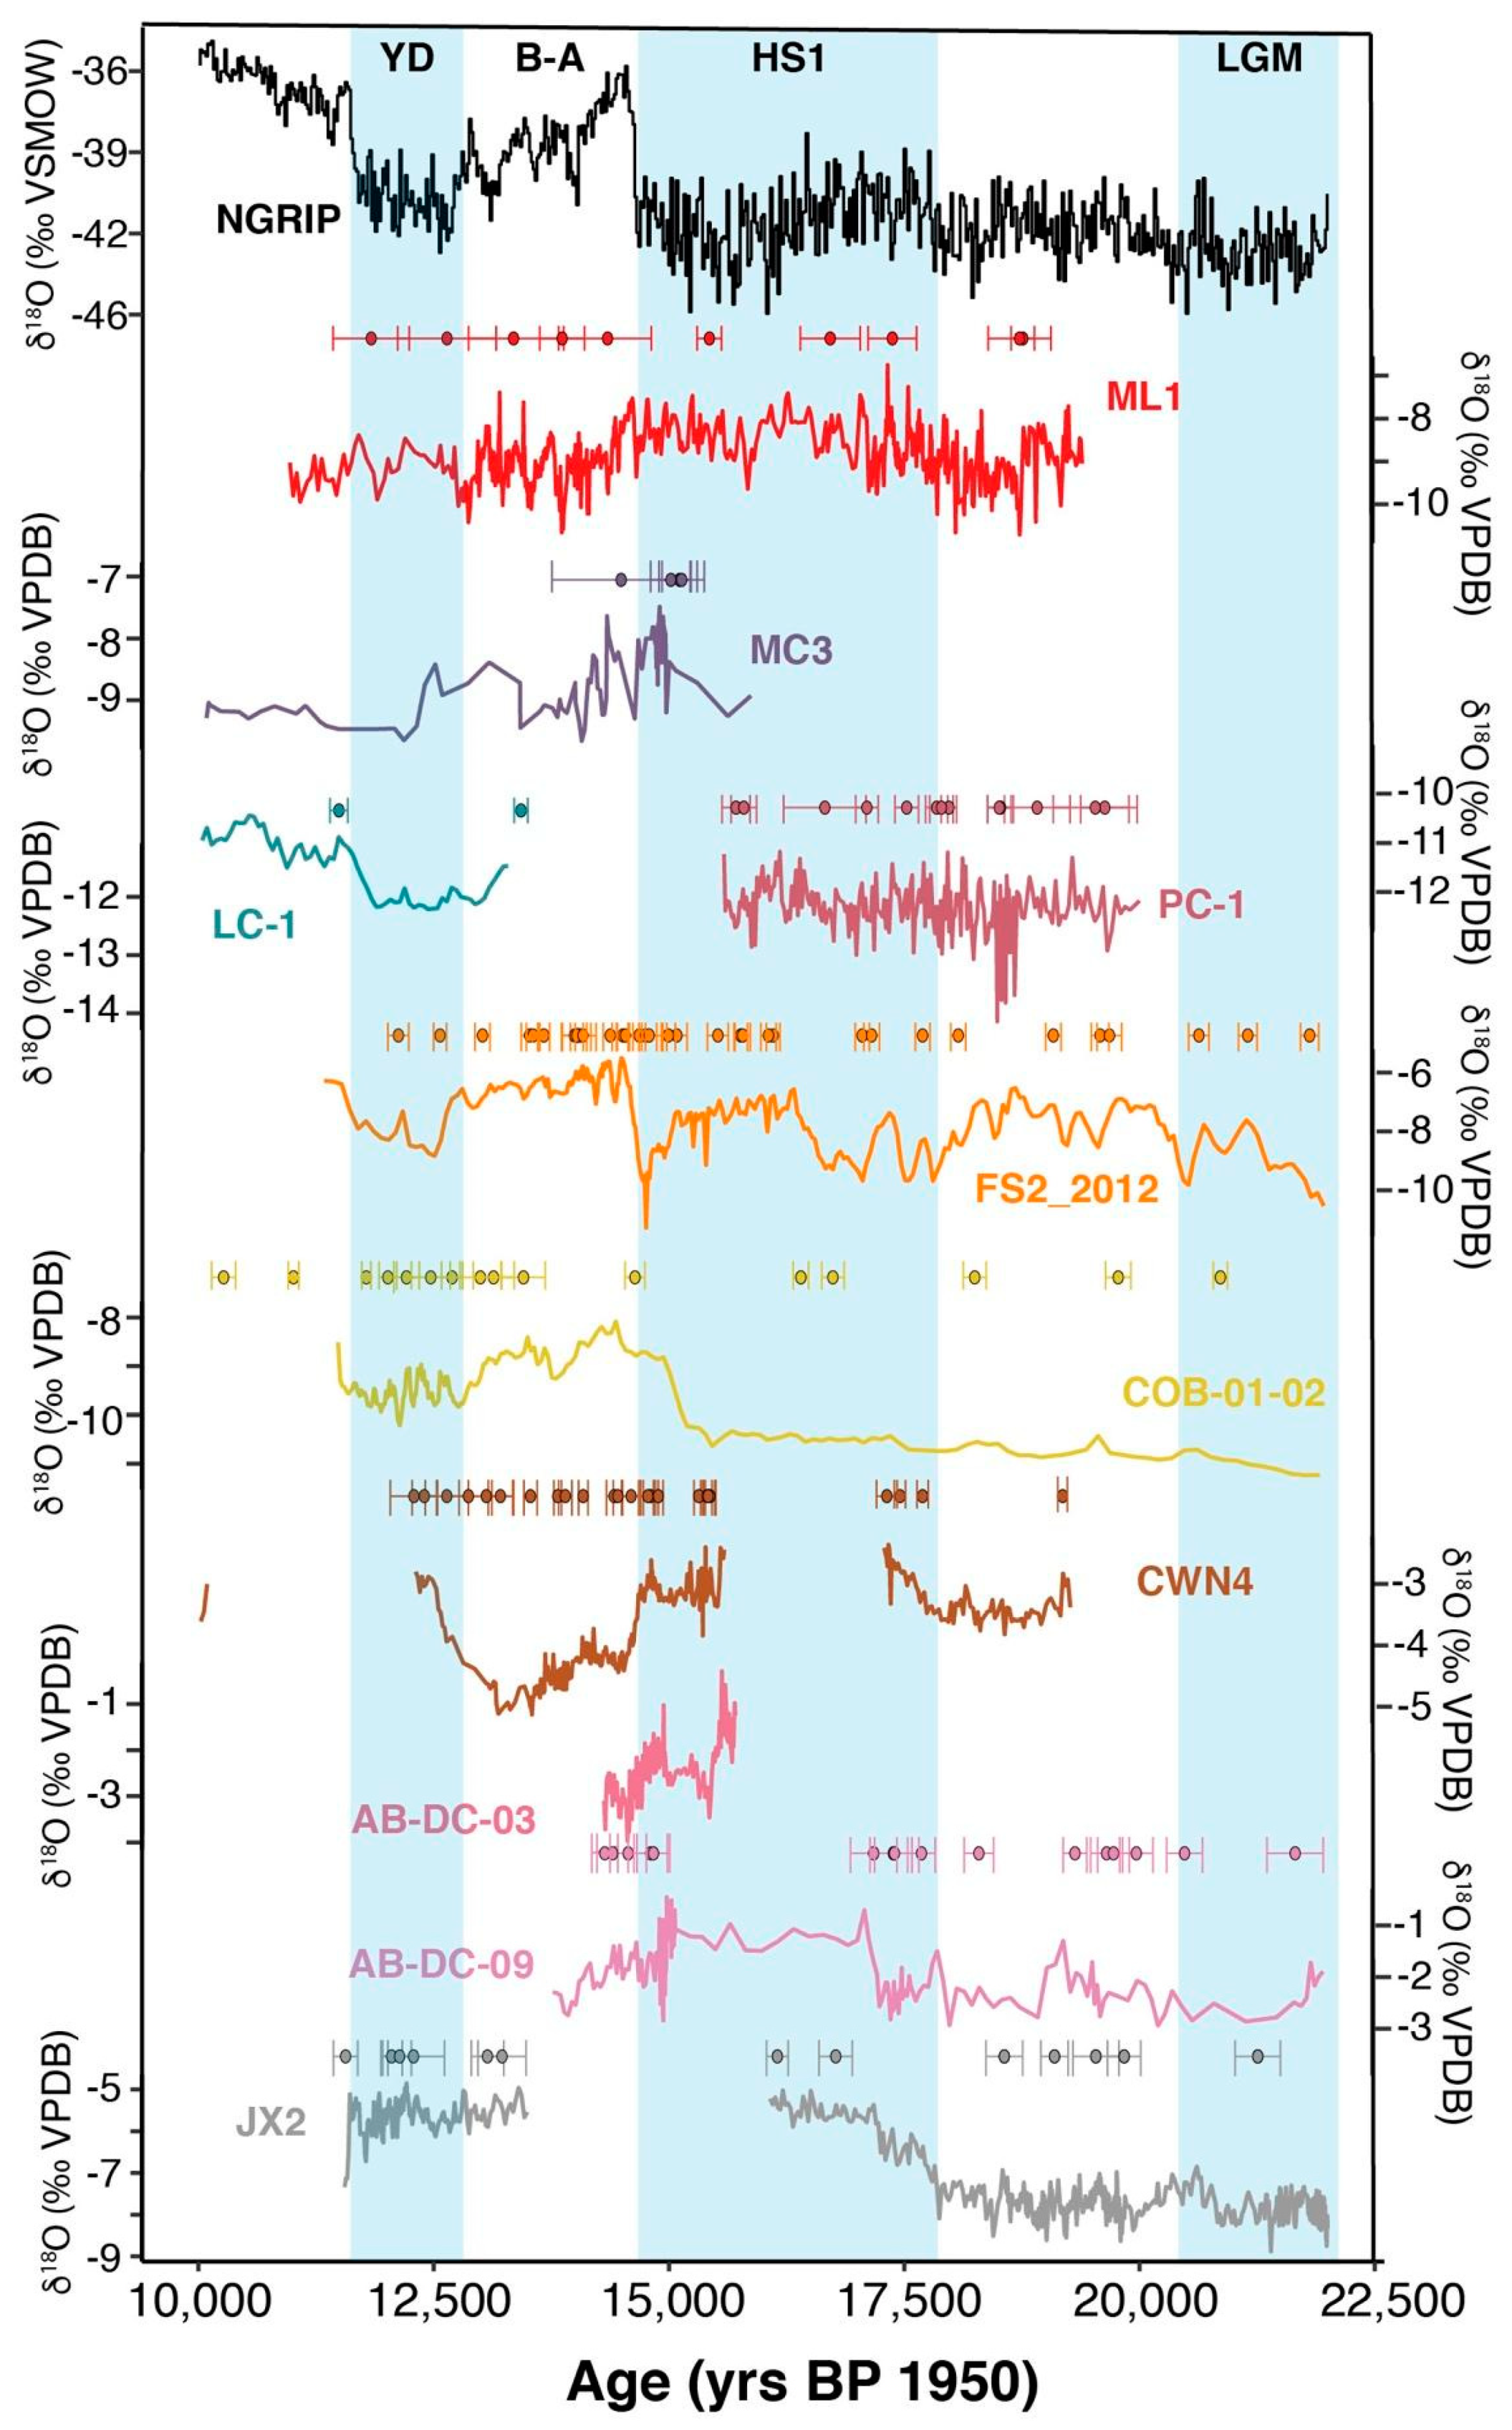
4.1. Late Pleistocene
4.1.1. Pre-LGM
4.1.2. Last Glacial Maximum and Deglaciation
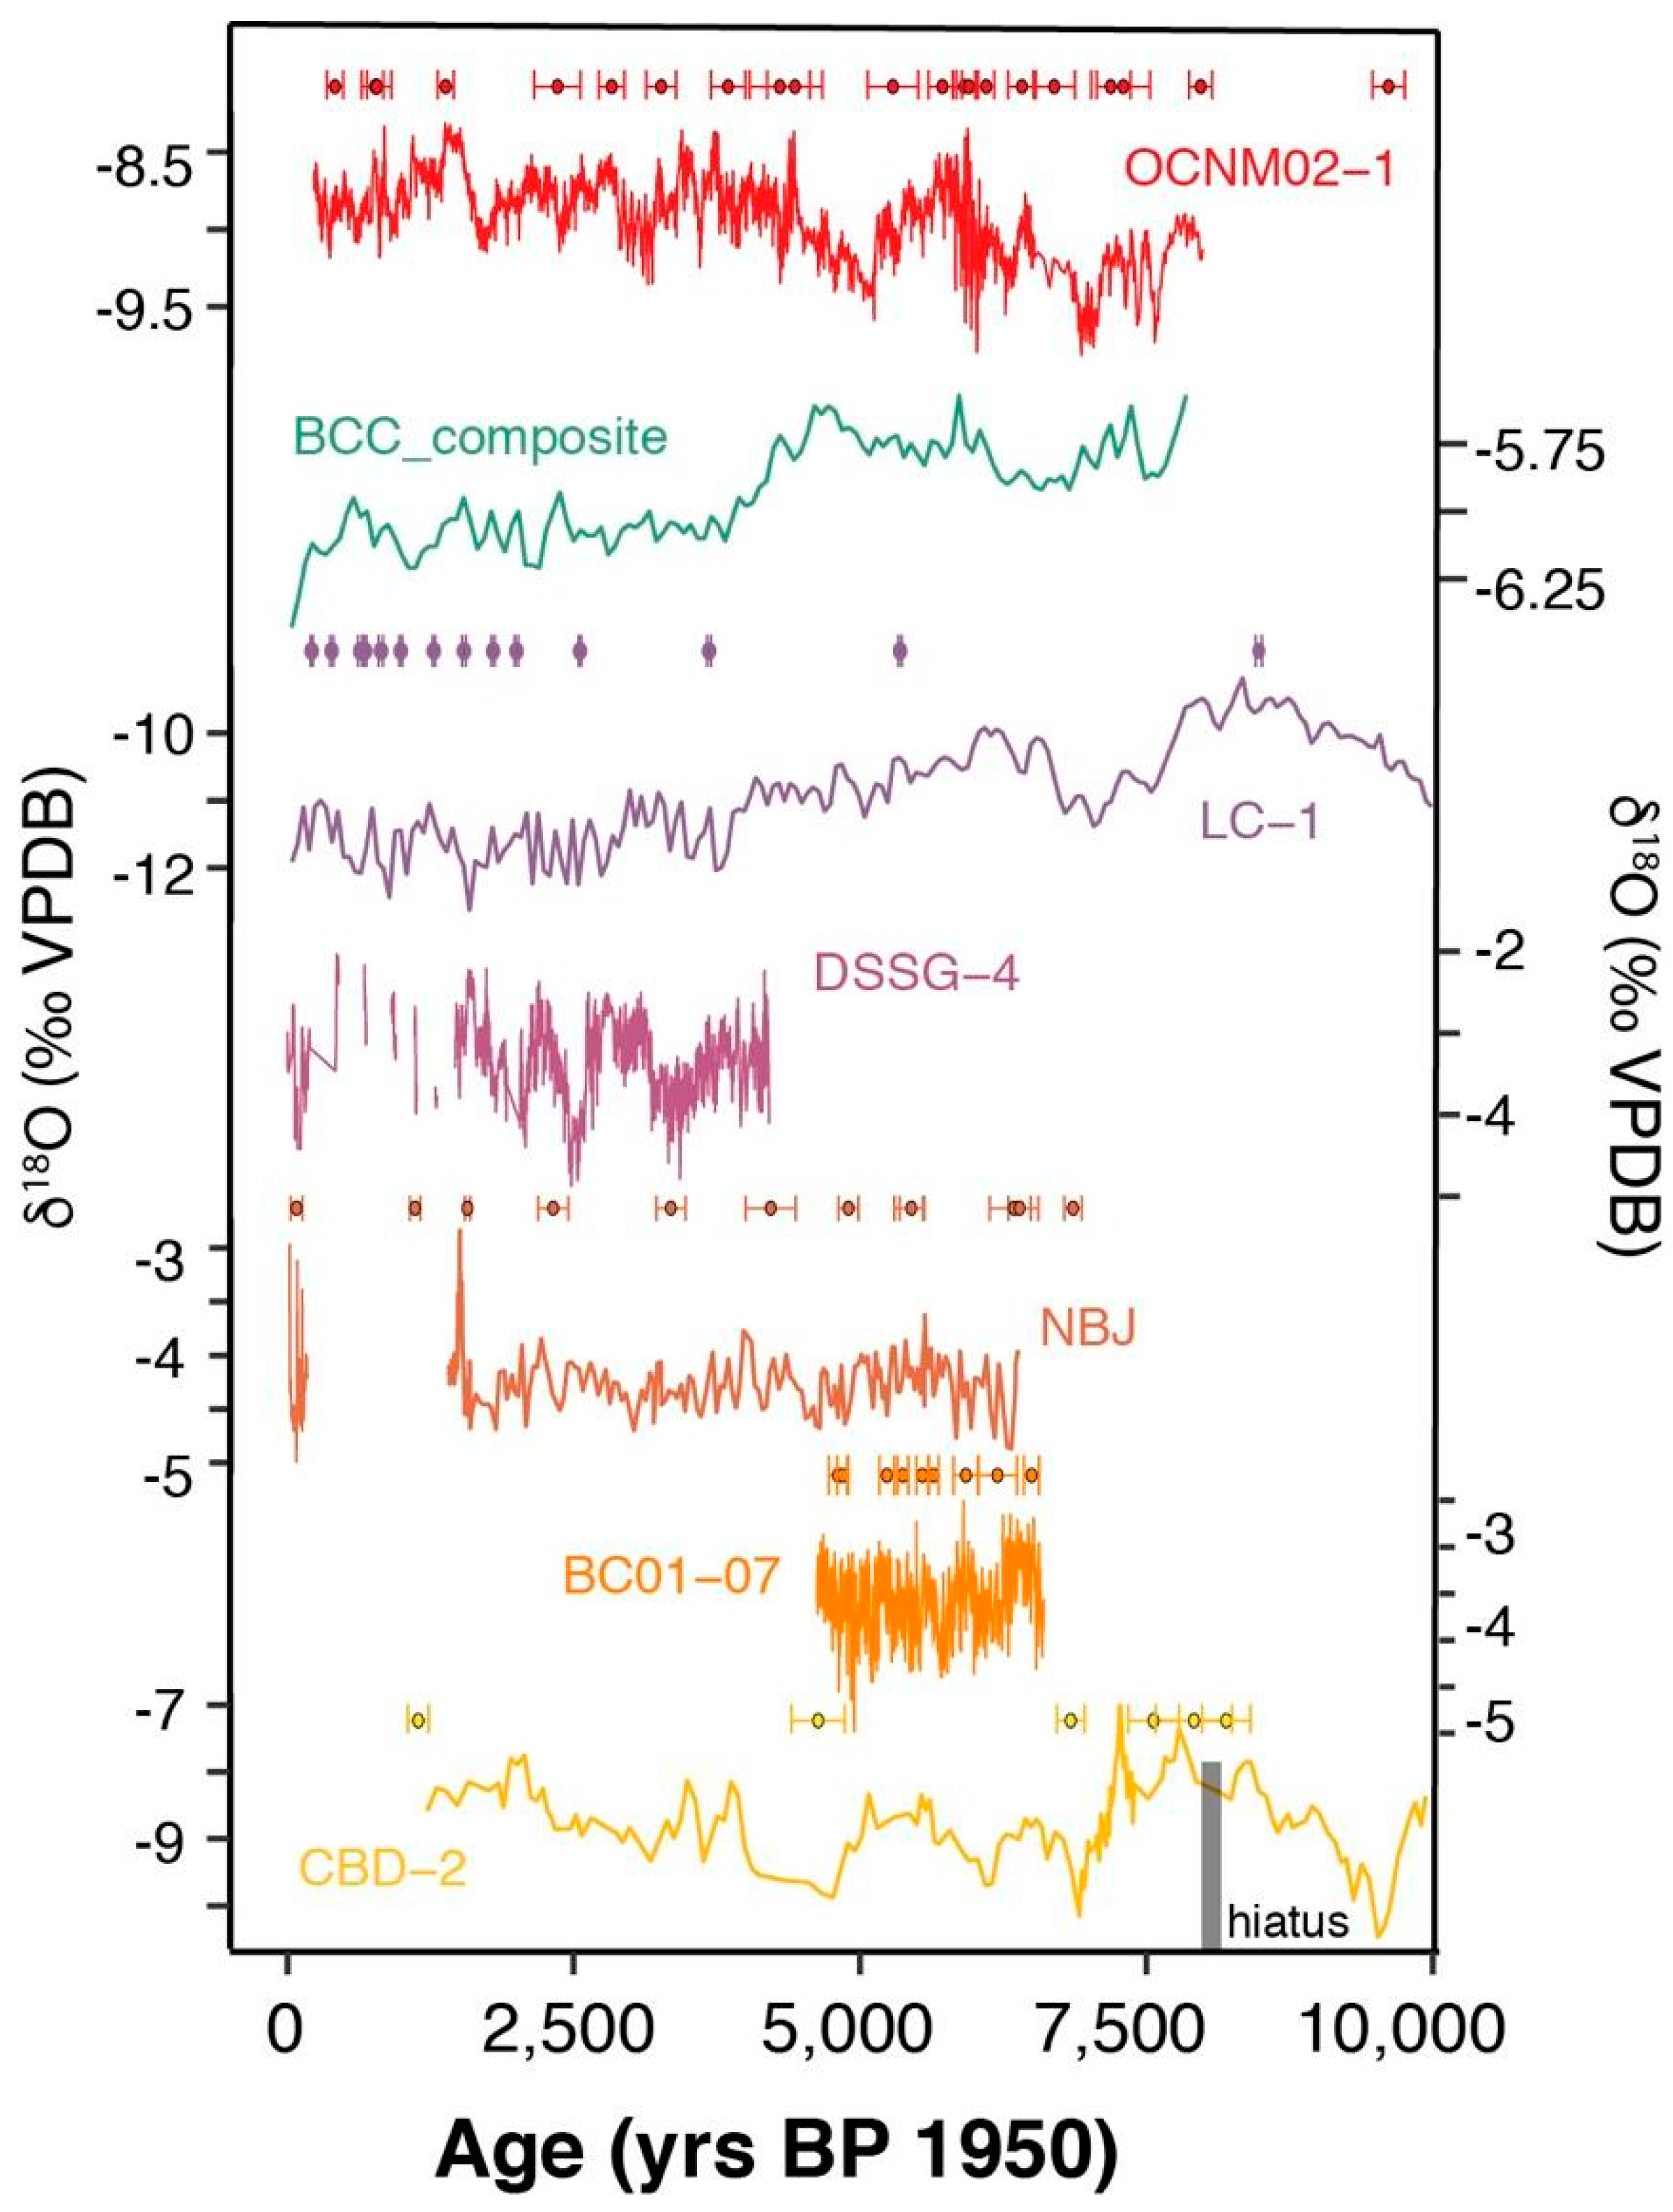
4.2. Holocene
4.2.1. Early and Middle Holocene
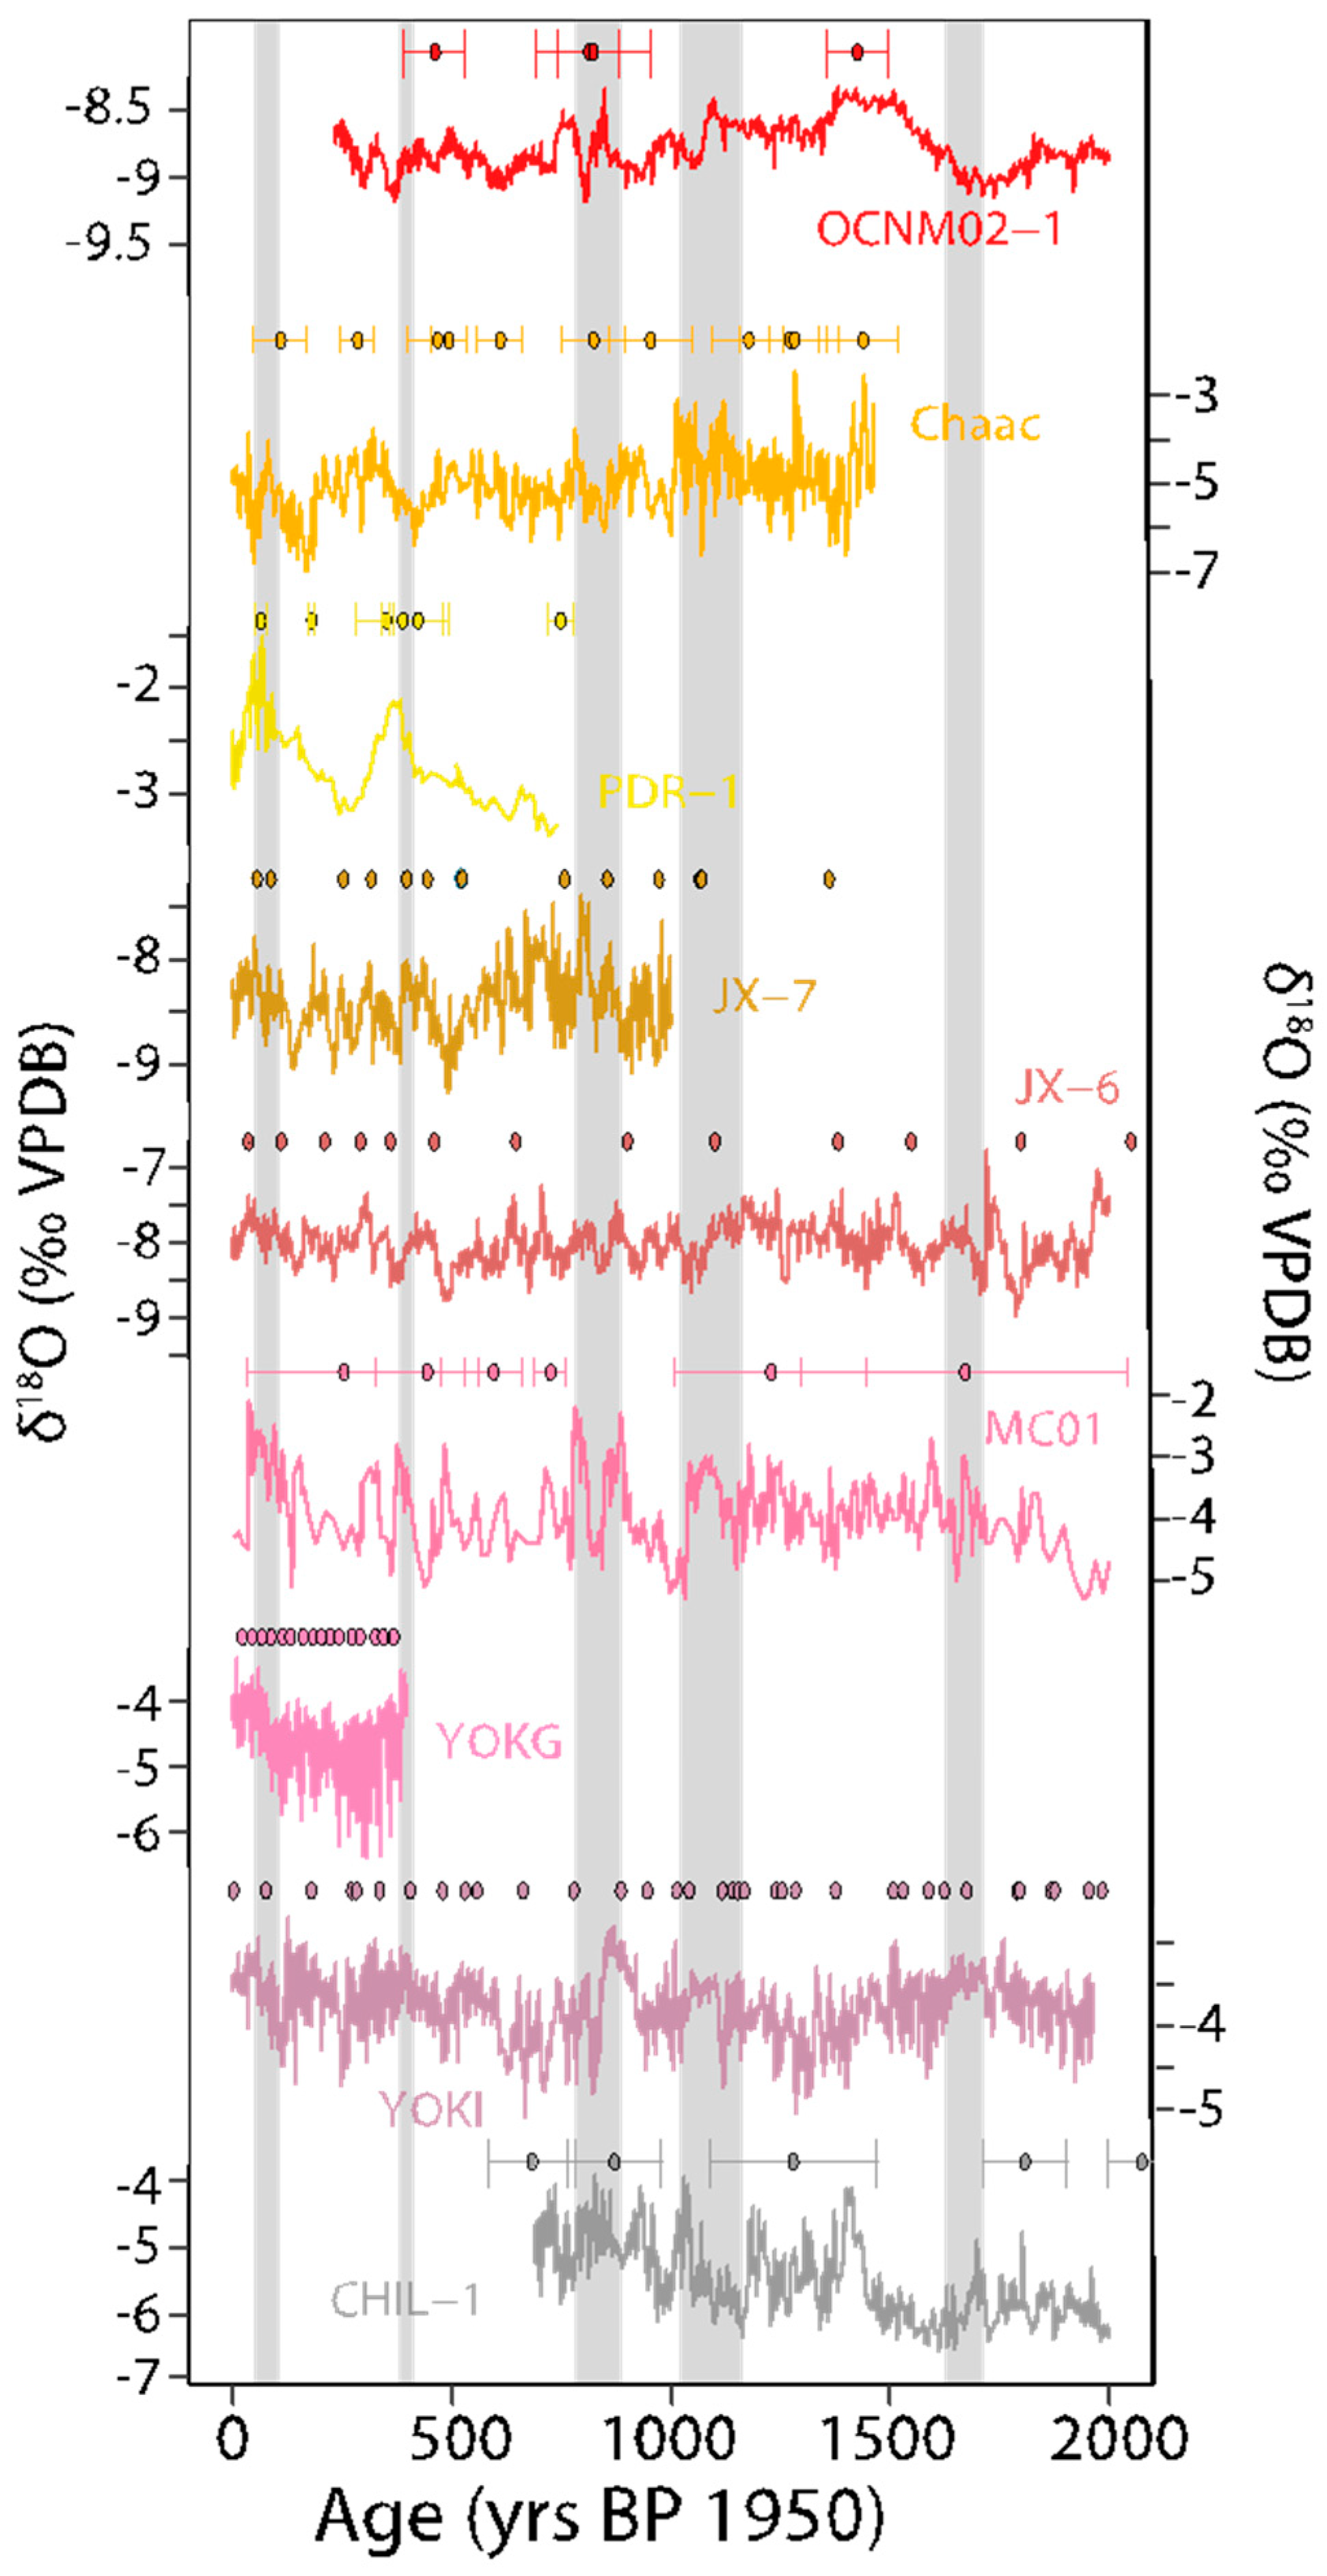
4.2.2. Last 2000 Years
5. Improvements to SISAL for North and Central America

| Site Name | Site ID | Country | Entity Name | Entity ID | Lat (ºN) | Long (ºE) | Elev. (m asl) | Min Year BP | Max Year BP | SISAL_v1 | Ref. |
|---|---|---|---|---|---|---|---|---|---|---|---|
| Lehman Caves | 14 | United States | LMC-14 | 67 | 39.01 | −114.2 | 2080 | 105,617 | 128,604 | y | [47] |
| Lehman Caves | 14 | United States | LMC-21 | 68 | 39.01 | −114.2 | 2080 | 133,340 | 174,096 | y | [47] |
| Lehman Caves | 14 | United States | LC-2 | 69 | 39.01 | −114.2 | 2080 | 128,888 | 133,168 | y | [111] |
| Cueva del Diablo | 34 | Mexico | CBD-2 | 109 | 18.19 | −99.9 | 1030 | 1220 | 10,812 | y | [128] |
| DeSoto Caverns | 37 | United States | DSSG-4 | 112 | 33.37 | −86.4 | 150 | −58 | 4204 | y | [145] |
| Leviathan Cave | 48 | United States | LC-1 | 124 | 37.89 | −115.6 | 2400 | −60 | 103,740 | y | [47] |
| McLean’s Cave | 49 | United States | ML1 | 125 | 38.07 | −120.4 | 300 | 10,971 | 19,391 | y | [45] |
| Moaning Cave | 50 | United States | MC3 | 126 | 38.07 | −120.5 | 520 | 8702 | 15,870 | y | [45] |
| Moaning Cave | 50 | United States | MC3 | 126 | 38.07 | −120.5 | 520 | 8702 | 15,870 | y | [43] |
| Natural Bridge Caverns | 51 | United States | NBJ | 127 | 29.69 | −98.3 | 306 | 18 | 6381 | y | [26] |
| Tzabnah Cave | 63 | Mexico | Chaac | 147 | 20.73 | −89.7 | 20 | −54 | 1463 | y | [93] |
| Abaco Island Cave | 70 | Bahamas | AB-DC-01 | 155 | 26.23 | −77.2 | −45 | 23,699 | 28,895 | y | [92] |
| Abaco Island Cave | 70 | Bahamas | AB-DC-03 | 156 | 26.23 | −77.2 | −45 | 14,308 | 15,704 | y | [92] |
| Abaco Island Cave | 70 | Bahamas | AB-DC-12 | 157 | 26.23 | −77.2 | −45 | 36,122 | 63,848 | y | [92] |
| Abaco Island Cave | 70 | Bahamas | AB-DC-09 | 158 | 26.23 | −77.2 | −45 | 13,766 | 32,076 | y | [91] |
| Abaco Island Cave | 70 | Bahamas | AB-DC-09 | 158 | 26.23 | −77.2 | −45 | 13,766 | 32,076 | y | [92] |
| Cave Without a Name | 75 | United States | CWN4 | 164 | 29.89 | −98.6 | 377 | 9546 | 28,490 | y | [18] |
| Chilibrillo Cave | 78 | Panama | CHIL-1 | 167 | 9.17 | −79.6 | −79.6164 | 690 | 2180 | y | [6] |
| Macal Chasm | 85 | Belize | MC01 | 178 | 16.88 | −89.1 | 530 | −43 | 5245 | y | [8] |
| Macal Chasm | 85 | Belize | MC01 | 178 | 16.88 | −89.1 | 530 | −43 | 5245 | y | [131] |
| Brown’s Cave | 95 | United States | BC01-07 | 191 | 27.89 | −82.5 | 25 | 4627 | 6604 | y | [146] |
| Yok Balum Cave | 107 | Belize | YOKI | 209 | 16.21 | −89.1 | 336 | −56 | 1965 | y | [7] |
| Yok Balum Cave | 107 | Belize | YOKG | 210 | 16.21 | −89.1 | 336 | −34 | 399 | y | [140] |
| Pinnacle Cave | 124 | United States | PC-1 | 259 | 35.97 | −115.5 | 1792 | 15,585 | 20,000 | y | [124] |
| Buckeye Creek | 128 | United States | BCC-2 | 271 | 37.98 | −79.6 | 600 | 37 | 6945 | y | [67] |
| Buckeye Creek | 128 | United States | BCC-4 | 272 | 37.98 | −79.6 | 600 | 78 | 7184 | y | [67] |
| Buckeye Creek | 128 | United States | BCC-6 | 273 | 37.98 | −79.6 | 600 | −24 | 7848 | y | [67] |
| Buckeye Creek | 128 | United States | BCC-8 | 274 | 37.98 | −79.6 | 600 | 116,501 | 126,712 | y | [112] |
| Buckeye Creek | 128 | United States | BCC-10 | 275 | 37.98 | −79.6 | 600 | 41,604 | 124,036 | y | [112] |
| Buckeye Creek | 128 | United States | BCC_composite | 276 | 37.98 | −79.6 | 600 | 37 | 7847 | y | [67] |
| Cave of the Bells | 134 | United States | COB-01-02 | 284 | 31.75 | −110.8 | 11,484 | 53,335 | y | [40] | |
| Juxtlahuaca Cave | 136 | Mexico | JX-6 | 286 | 17.4 | −99.2 | 934 | −60 | 2397 | y | [9] |
| Juxtlahuaca Cave | 136 | Mexico | JX-2 | 287 | 17.4 | −99.2 | 934 | 11,553 | 22,061 | y | [116] |
| Juxtlahuaca Cave | 136 | Mexico | JX-10 | 288 | 17.4 | −99.2 | 934 | 6908 | 7244 | y | [116] |
| Juxtlahuaca Cave | 136 | Mexico | JX-7 | 289 | 17.4 | −99.2 | 934 | −7 | 1000 | y | [130] |
| Oregon caves national monument | 139 | United States | OCNM02-1 | 294 | 42.1 | −123.4 | 1300 | 234 | 7992 | y | [42] |
| Fort Stanton Cave | 147 | United States | FS2_2012 | 321 | 33.51 | −105.4 | 1864 | 11,336 | 25,840 | y | [147] |
| Fort Stanton Cave | 147 | United States | FS2_2010 | 322 | 33.51 | −105.4 | 1864 | 11,310 | 55,846 | y | [5] |
| Devils Hole | 171 | United States | DH2 | 373 | 36.43 | −116.3 | 719 | 100,902 | 181,716 | y | [96] |
| Devils Hole | 171 | United States | DH2-D | 374 | 36.43 | −116.3 | 719 | 4896 | 204,226 | y | [96] |
| Devils Hole | 171 | United States | DH2-E Terminal1 | 375 | 36.43 | −116.3 | 719 | 5534 | 50,131 | y | [96] |
| Devils Hole | 171 | United States | DH2-E Terminal2 | 376 | 36.43 | −116.3 | 719 | 117,435 | 154,922 | y | [96] |
| Perdida Cave | 173 | Puerto Rico | PDR-1 | 378 | 18 | −67.0 | 1450 | −54 | 742 | y | [129] |
| Cold water Cave | United States | CWC-1s | 43.47 | −92.0 | 356 | 1147 | 7774 | n | [148] | ||
| Cold water Cave | United States | CWC-2ss | 43.47 | −92.0 | 356 | 1740 | 7270 | n | [148] | ||
| Cold water Cave | United States | CWC-3L | 43.47 | −92.0 | 356 | 2080 | 9040 | n | [148] | ||
| Devils Icebox Cave | United States | DIB-1 | 38.9 | −92.3 | 250 | 610 | 3500 | n | [149] | ||
| Devils Icebox Cave | United States | DIB-2 | 38.9 | −92.3 | 250 | 2010 | 3610 | n | [149] | ||
| Minnetonka Cave | United States | MC08-1 | 42.0875 | −111.5 | 2347 | n | [150] | ||||
| Chen Ha Cave | Belize | CH04-02 | 17 | −89.0 | 550 | 4631 | 7159 | n | [151] | ||
| Goshute Cave | United States | GC_2 | 40.03 | −114.8 | 2000 | 90,169 | 101,899 | n | [152] | ||
| Goshute Cave | United States | GC_3 | 40.03 | −114.8 | 2000 | 83,704 | 86,223 | n | [152] | ||
| White Moon Cave | United States | WMC1 | 37 | −122.2 | 170 | 6937 | 8604 | n | [44] | ||
| Arch Cave | Canada | DM05-01 | 50.55 | −127.1 | 660 | 9 | 12,092 | n | [153] | ||
| Harrisons Cave | Barbados | HC-1 | 13 | −59.0 | 300 | n | [154] | ||||
| Xibalba Cave | Belize | GU-Xi-1 | 16.5 | −89.0 | 350 | −57 | 251 | n | [141] | ||
| Dos Anas Cave | Cuba | CG | 22.38 | −84.0 | 120 | −50 | 1203 | n | [155] | ||
| Dos Anas Cave | Cuba | CP | 22.38 | −84.0 | 120 | 61 | 12,333 | n | [156] | ||
| Santo Tomas Cave | Cuba | CM | 22.55 | −83.8 | 170 | 6850 | 9914 | n | [156] | ||
| Chan Hol Cave | Mexico | Ch-7 | 20.16 | −87.6 | −8.5 | n | [157] | ||||
| McLean’s Cave | United States | ML2 | 38.07 | −120.4 | 300 | 55,158 | 66,902 | n | [110] | ||
| Bat Cave | United States | BC-11 | 32.1 | −104.3 | n | [158] | |||||
| Crystal Cave | United States | CRC-3 | 36.57 | −118.8 | n | [159] | |||||
| Ozark Caverns | United States | OC-2 | 38.02 | −92.0 | n | [160] | |||||
| Bridal Cave | United States | BC-3 | 38.01 | −92.5 | n | [160] | |||||
| Bridal Cave | United States | BC-2 (2) | 38.01 | −92.5 | n | [160] | |||||
| Cosmic Caverns | United States | CS-2A | 36.26 | −93.3 | n | [160] | |||||
| Beckham Creek Cave | United States | BCC-10 | 35.57 | −93.2 | n | [160] | |||||
| Mystery Cave | United States | MC-28 | 43.62 | −92.3 | n | [161] | |||||
| Onondaga Caverns | United States | ON-3 | 38.03 | −91.1 | n | [160] | |||||
| Onondaga Caverns | United States | ON-3-B | 38.03 | −91.1 | n | [162] | |||||
| Actun Tunichil Muknal Cave | Belize | ATM-7 | 17.1 | −88.9 | n | [94] | |||||
| Crevice Cave | United States | CCC-2 | 37.45 | −89.5 | n | [61] | |||||
| Crevice Cave | United States | CCDBL-L | 37.45 | −89.5 | n | [61] | |||||
| Crevice Cave | United States | CCDBL-S | 37.45 | −89.5 | n | [61] | |||||
| Crevice Cave | United States | CCE-1 | 37.45 | −89.5 | n | [61] | |||||
| Terciopelo Cave | Costa Rica | CT-6 | 10.1667 | −85.3 | n | [95] | |||||
| Terciopelo Cave | Costa Rica | CT-7 | 10.1667 | −85.3 | n | [95] | |||||
| Venado Cave | Costa Rica | V1 | 10.1667 | −85.3 | n | [163] | |||||
| Palco Cave | Puerto Rico | PR-PA-1b | 18.35 | −66.5 | n | [164] | |||||
| Pink Panther Cave | United States | PP-1 | 32.08 | −105.2 | n | [165] |
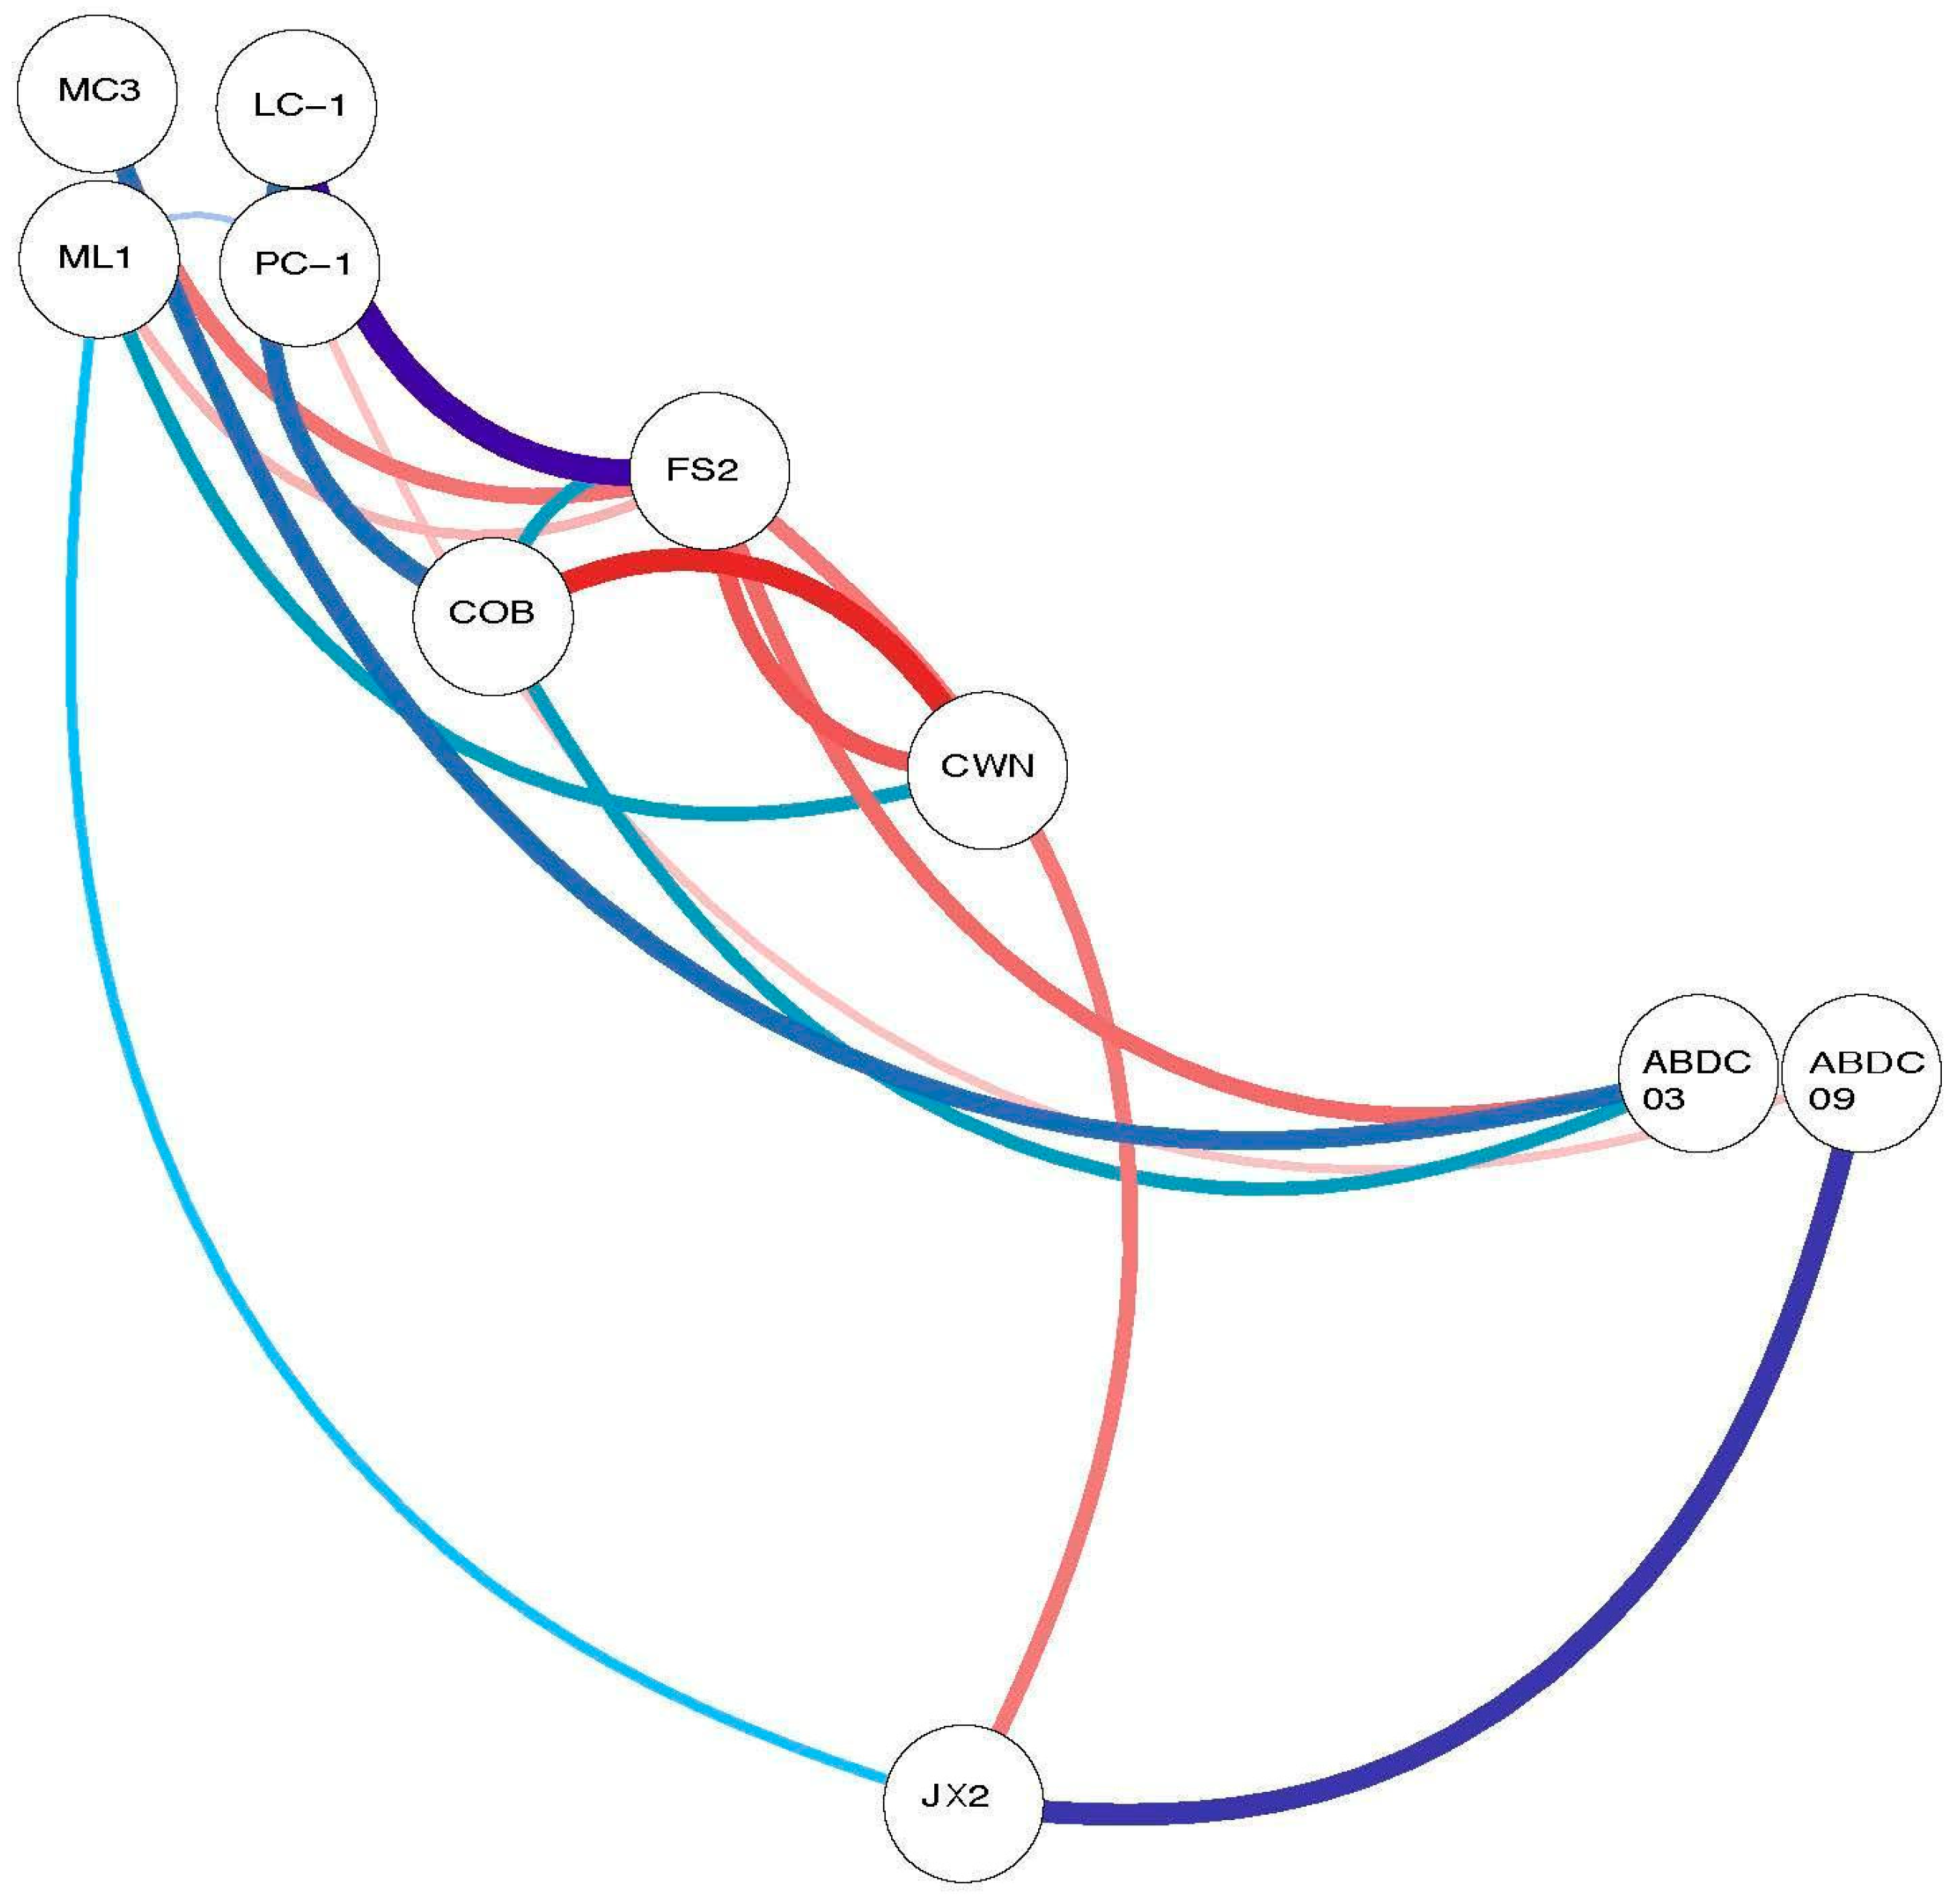
| Rec1 | Rec2 | Test_Start (yr BP) | Test_End (yr_BP) | gXCF |
|---|---|---|---|---|
| AB-DC-09 | JX2 | 13,766 | 22,061 | 0.78 |
| COB-01-02 | FS2_2012 | 11,400 | 23,696 | 0.58 |
| JX2 | FS2_2012 | 11,552 | 22,000 | −0.52 |
| AB-DC-09 | PC-1 | 16,000 | 20,000 | −0.24 |
| FS2_2012 | MC3 | 12,000 | 16,000 | −0.54 |
| ABDC03 | MC3 | 14,300 | 15,700 | 0.66 |
| ABDC03 | COB-01-02 | 14,300 | 15,700 | 0.45 |
| ABDC03 | FS2_2012 | 14,300 | 15,700 | −0.57 |
| FS2_2012 | ML1 | 12,000 | 19,000 | −0.30 |
| PC-1 | ML1 | 16,000 | 20,000 | 0.13 |
| ML1 | JX2 | 12,000 | 19,000 | 0.32 |
| CWN4 | COB-01-02 | 11,484 | 19,264 | −0.81 |
| CWN4 | FS2_2012 | 11,336 | 19,264 | −0.64 |
| CWN4 | ML1 | 12,000 | 19,000 | 0.46 |
| LC-1 | COB-01-02 | 11,484 | 13,290 | 0.70 |
| LC-1 | FS2_2012 | 11,336 | 13,290 | 0.78 |
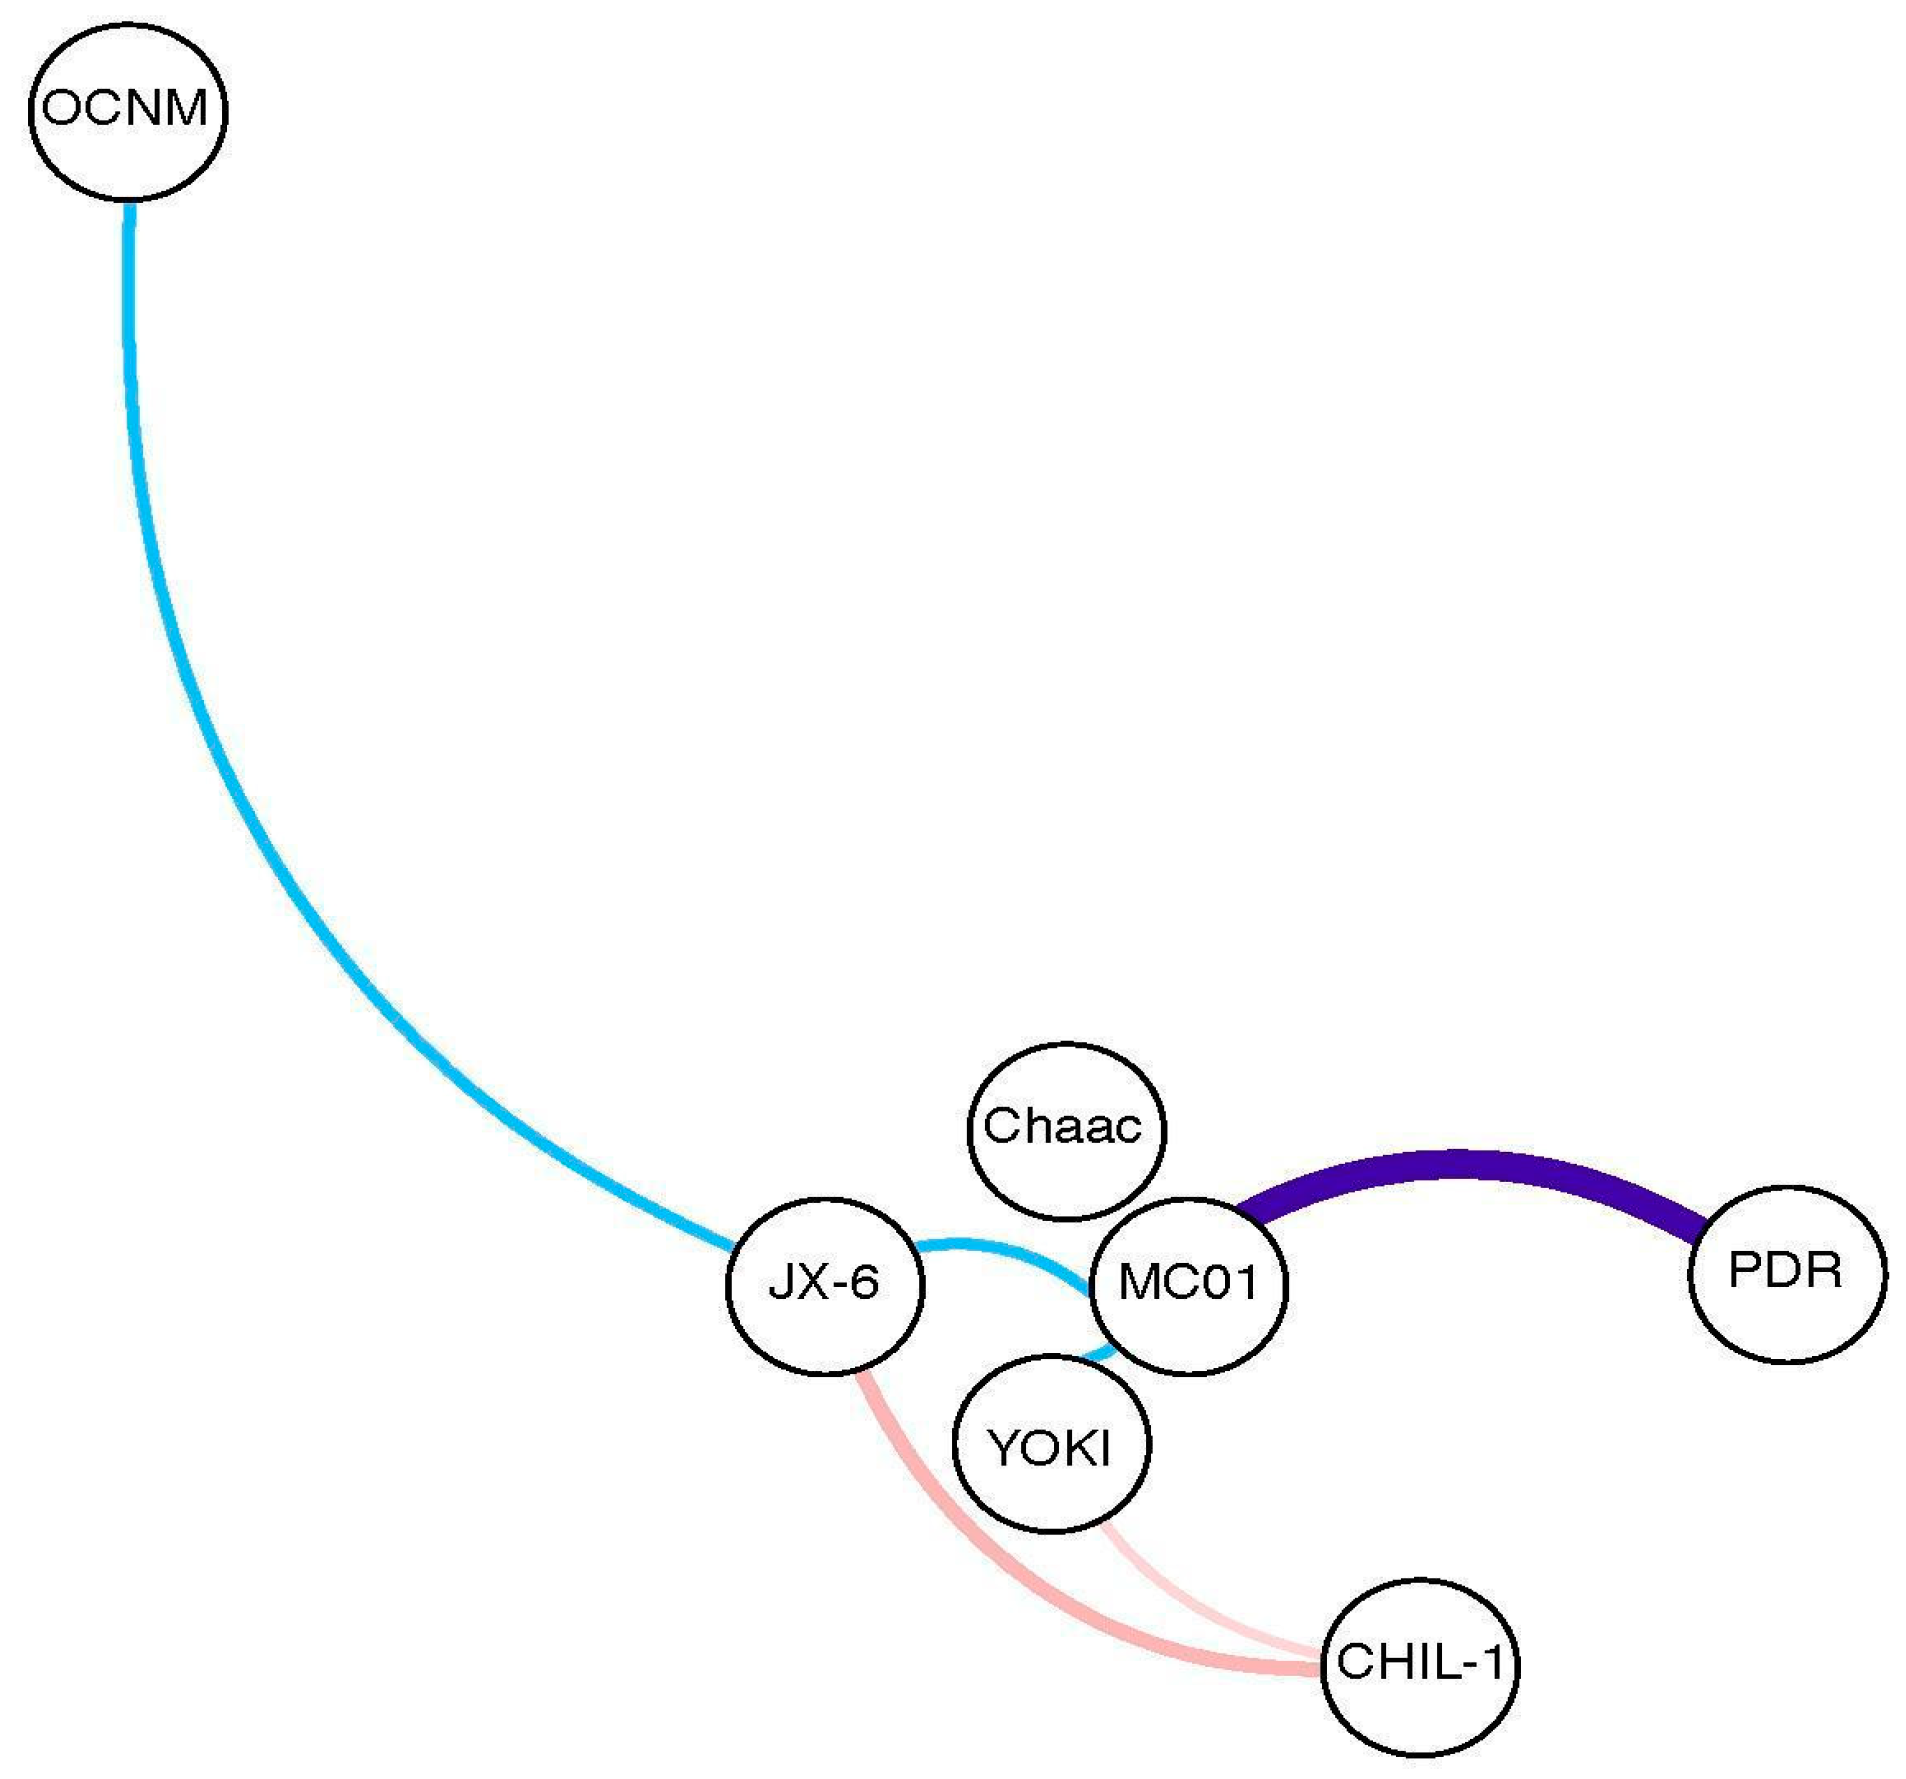
| MC01 | YOKI | 600 | 2000 | 0.18 |
| CHIL-1 | YOKI | 600 | 2000 | −0.10 |
| PDR-1 | MC01 | 0 | 1400 | 0.59 |
| MC01 | JX-6 | 0 | 2000 | 0.15 |
| CHIL-1 | JX-6 | 600 | 2000 | −0.17 |
| JX-6 | OCNM02-1 | 0 | 2000 | 0.14 |
Author Contributions
Funding
Acknowledgments
Conflicts of Interest
References
- Comas-Bru, L.; Harrison, S. SISAL: Bringing added value to speleothem research. Quaternary 2019, in press. [Google Scholar]
- Atsawawaranunt, K.; Comas-Bru, L. The SISAL database: A global resource to document oxygen and carbon isotope records from speleothems. Earth Syst. Sci. 2018, 10, 1687–1713. [Google Scholar] [CrossRef]
- Lachniet, M.; Asmerom, Y.; Polyak, V.; Denniston, R. Arctic cryosphere and Milankovitch forcing of Great Basin paleoclimate. Sci. Rep. 2017, 7, 12955. [Google Scholar] [CrossRef] [PubMed]
- Oster, J.L.; Ibarra, D.E.; Winnick, M.J.; Maher, K. Steering of westerly storms over western North America at the Last Glacial Maximum. Nat. Geosci. 2015, 8, 201–205. [Google Scholar] [CrossRef]
- Asmerom, Y.; Polyak, V.J.; Burns, S.J. Variable winter moisture in the southwestern United States linked to rapid glacial climate shifts. Nat. Geosci. 2010, 3, 114–117. [Google Scholar] [CrossRef]
- Lachniet, M.S.; Burns, S.J.; Piperno, D.R. A 1500-year El Niño/Southern Oscillation and rainfall history for the Isthmus of Panama from speleothem calcite. JGR Atmos. 2004, 109, D20117. [Google Scholar] [CrossRef]
- Kennett, D.J.; Breitenbach, S.F.M.; Aquino, V.V.; Asmerom, Y.; Awe, J.; Baldini, J.U.L.; Bartlein, P.; Culleton, B.J.; Ebert, C.; Jazwa, C.; et al. Development and disintegration of Maya political systems in response to climate change. Science 2012, 338, 788–791. [Google Scholar] [CrossRef]
- Akers, P.D.; Brook, G.A.; Railsback, L.B.; Liang, F.; Iannone, G.; Webster, J.W.; Reeder, P.P.; Cheng, H.; Edwards, R.L. An extended and higher-resolution record of climate and land use from stalagmite MC01 from Macal Chasm, Belize, revealing connections between major dry events, overall climate variability, and Maya sociopolitical changes. Palaeogeogr. Palaeoclimatol. Palaeoecol. 2016, 459, 268–288. [Google Scholar] [CrossRef]
- Lachniet, M.S.; Bernal, J.P.; Asmerom, Y.; Polyak, V.; Piperno, D. A 2400 yr Mesoamerican rainfall reconstruction links climate and cultural change. Geology 2012, 40, 259–262. [Google Scholar] [CrossRef]
- Lechleitner, F.A.; Breitenbach, S.F.M.; Rehfeld, K.; Ridley, H.E.; Asmerom, Y.; Prufer, K.M.; Marwan, N.; Goswami, B.; Kennett, D.J.; Aquino, V.V.; et al. Tropical rainfall over the last two millennia: Evidence for a low-latitude hydrologic seesaw. Sci. Rep. 2017, 7, 45809. [Google Scholar] [CrossRef]
- Chen, Z.; Auler, A.S.; Bakalowicz, M.; Drew, D.; Griger, F.; Hartmann, J.; Jiang, G.; Moosdorf, N.; Richts, A.; Stevanovic, Z.; et al. The World Karst Aquifer Mapping project: Concept, mapping procedure and map of Europe. Hydrogeol. J. 2017, 25, 771–785. [Google Scholar] [CrossRef]
- Palecki, M.A.; Angel, J.R.; Hollinger, S.E. Storm Precipitation in the United States. Part I: Meteorological Characteristics. J. Appl. Meteorol. 2005, 44, 933–946. [Google Scholar] [CrossRef]
- Redmond, K.T.; Koch, R.W. Surface climate and streamflow variability in the western United States and their relationship to large-scale circulation indices. Water Resour. Res. 1991, 27, 2381–2399. [Google Scholar] [CrossRef]
- Seager, R.; Hoerling, M. Atmosphere and Ocean Origins of North American Droughts. J. Clim. 2014, 27, 4581–4606. [Google Scholar] [CrossRef]
- Cook, E.R.; Seager, R.; Cane, M.A.; Stahle, D.W. North American drought: Reconstructions, causes, and consequences. Earth-Sci. Rev. 2007, 81, 93–134. [Google Scholar] [CrossRef]
- Cayan, D.R.; Redmond, K.T.; Riddle, L.G. ENSO and Hydrologic Extremes in the Western United States*. J. Clim. 1999, 12, 2881–2893. [Google Scholar] [CrossRef]
- Friedman, I. Stable isotope composition of waters in the Great Basin, United States 1. Air-mass trajectories. J. Geophys. Res. 2002, 107. [Google Scholar] [CrossRef]
- Feng, W.; Casteel, R.C.; Banner, J.L.; Heinze-Fry, A. Oxygen isotope variations in rainfall, drip-water and speleothem calcite from a well-ventilated cave in Texas, USA: Assessing a new speleothem temperature proxy. Geochim. Cosmochim. Acta 2014, 127, 233–250. [Google Scholar] [CrossRef]
- Ralph, F.M.; Dettinger, M.D. Storms, floods, and the science of atmospheric rivers. EOS Trans. Am. Geophys. Union 2011, 92, 265–266. [Google Scholar] [CrossRef]
- Dettinger, M. Climate Change, Atmospheric Rivers, and Floods in California—A Multimodel Analysis of Storm Frequency and Magnitude Changes1. JAWRA J. Am. Water Resour. Assoc. 2011, 47, 514–523. [Google Scholar] [CrossRef]
- Zhu, Y.; Newell, R.E. A Proposed Algorithm for Moisture Fluxes from Atmospheric Rivers. Mon. Weather Rev. 1998, 126, 725–735. [Google Scholar] [CrossRef]
- McCabe-Glynn, S.; Johnson, K.R.; Strong, C.; Zou, Y.; Yu, J.-Y.; Sellars, S.; Welker, J.M. Isotopic signature of extreme precipitation events in the western U.S. and associated phases of Arctic and tropical climate modes. J. Geophys. Res. D Atmos. 2016, 121, 8913–8924. [Google Scholar] [CrossRef]
- Kim, J.-S.; Kug, J.-S.; Jeong, S.-J. Intensification of terrestrial carbon cycle related to El Niño-Southern Oscillation under greenhouse warming. Nat. Commun. 2017, 8, 1674. [Google Scholar] [CrossRef] [PubMed]
- Adams, D.K.; Comrie, A.C. The North American Monsoon. Bull. Am. Meteorol. Soc. 1997, 78, 2197–2213. [Google Scholar] [CrossRef]
- Metcalfe, S.E.; Barron, J.A.; Davies, S.J. The Holocene history of the North American Monsoon: “Known knowns” and “known unknowns” in understanding its spatial and temporal complexity. Quat. Sci. Rev. 2015, 120, 1–27. [Google Scholar] [CrossRef]
- Wong, C.I.; Banner, J.L.; Musgrove, M. Holocene climate variability in Texas, USA: An integration of existing paleoclimate data and modeling with a new, high-resolution speleothem record. Quat. Sci. Rev. 2015, 127, 155–173. [Google Scholar] [CrossRef]
- Wise, E.K. Spatiotemporal variability of the precipitation dipole transition zone in the western United States. Geophys. Res. Lett. 2010, 37. [Google Scholar] [CrossRef]
- Hu, Q.; Feng, S.; Oglesby, R.J. Variations in North American Summer Precipitation Driven by the Atlantic Multidecadal Oscillation. J. Clim. 2011, 24, 5555–5570. [Google Scholar] [CrossRef]
- Oster, J.L.; Kelley, N.P. Tracking regional and global teleconnections recorded by western North American speleothem records. Quat. Sci. Rev. 2016, 149, 18–33. [Google Scholar] [CrossRef]
- Vachon, R.W.; Welker, J.M.; White, J.W.C.; Vaughn, B.H. Monthly precipitation isoscapes (δ18O) of the United States: Connections with surface temperatures, moisture source conditions, and air mass trajectories. J. Geophys. Res. 2010, 115. [Google Scholar] [CrossRef]
- Ersek, V.; Mix, A.C.; Clark, P.U. Variations of δ18O in rainwater from southwestern Oregon. J. Geophys. Res. 2010, 115, D09109. [Google Scholar] [CrossRef]
- Oster, J.L.; Montañez, I.P.; Kelley, N.P. Response of a modern cave system to large seasonal precipitation variability. Geochim. Cosmochim. Acta 2012, 91, 92–108. [Google Scholar] [CrossRef]
- Berkelhammer, M.; Stott, L.; Yoshimura, K.; Johnson, K.; Sinha, A. Synoptic and mesoscale controls on the isotopic composition of precipitation in the western United States. Clim. Dyn. 2011, 38, 433–454. [Google Scholar] [CrossRef]
- Buenning, N.H.; Stott, L.; Yoshimura, K.; Berkelhammer, M. The cause of the seasonal variation in the oxygen isotopic composition of precipitation along the western U.S. coast. J. Geophys. Res. D Atmos. 2012, 117. [Google Scholar] [CrossRef]
- Buenning, N.; Stott, L.; Kanner, L.; Yoshimura, K. Diagnosing Atmospheric Influences on the Interannual 18O/16O Variations in Western U.S. Precipitation. Water 2013, 5, 1116–1140. [Google Scholar] [CrossRef]
- Sharp, Z. Principles of Stable Isotope Geochemistry; Pearson Prentice Hall: Upper Saddle River, NJ, USA, 2007; 344p. [Google Scholar]
- Wright, W.E.; Long, A.; Comrie, A.C.; Leavitt, S.W.; Cavazos, T.; Eastoe, C. Monsoonal moisture sources revealed using temperature, precipitation, and precipitation stable isotope timeseries. Geophys. Res. Lett. 2001, 28, 787–790. [Google Scholar] [CrossRef]
- Palmer, M.V.; Palmer, A.N. Petrographic and isotopic evidence for late-stage processes in sulfuric acid caves of the Guadalupe Mountains, New Mexico, USA. Int. J. Speleol. 2012, 41, 10. [Google Scholar] [CrossRef]
- Winograd, I.J.; Riggs, A.C.; Coplen, T.B. The relative contributions of summer and cool-season precipitation to groundwater recharge, Spring Mountains, Nevada, USA. Hydrogeol. J. 1998, 6, 77–93. [Google Scholar] [CrossRef]
- Wagner, J.D.M.; Cole, J.E.; Beck, J.W.; Patchett, P.J.; Henderson, G.M.; Barnett, H.R. Moisture variability in the southwestern United States linked to abrupt glacial climate change. Nat. Geosci. 2010, 3, 110–113. [Google Scholar] [CrossRef]
- Pape, J.R.; Banner, J.L.; Mack, L.E.; Musgrove, M.; Guilfoyle, A. Controls on oxygen isotope variability in precipitation and cave drip waters, central Texas, USA. J. Hydrol. 2010, 385, 203–215. [Google Scholar] [CrossRef]
- Ersek, V.; Clark, P.U.; Mix, A.C.; Cheng, H.; Edwards, R.L. Holocene winter climate variability in mid-latitude western North America. Nat. Commun. 2012, 3, 1219. [Google Scholar] [CrossRef] [PubMed]
- Oster, J.L.; Montañez, I.P.; Sharp, W.D.; Cooper, K.M. Late Pleistocene California droughts during deglaciation and Arctic warming. Earth Planet. Sci. Lett. 2009, 288, 434–443. [Google Scholar] [CrossRef]
- Oster, J.L.; Sharp, W.D.; Covey, A.K.; Gibson, J.; Rogers, B.; Mix, H. Climate response to the 8.2 ka event in coastal California. Sci. Rep. 2017, 7, 3886. [Google Scholar] [CrossRef] [PubMed]
- Oster, J.L.; Montañez, I.P.; Santare, L.R.; Sharp, W.D.; Wong, C.; Cooper, K.M. Stalagmite records of hydroclimate in central California during termination 1. Quat. Sci. Rev. 2015, 127, 199–214. [Google Scholar] [CrossRef]
- Mccabe-Glynn, S.E.; Johnson, K.R.; Berkelhammer, M.B.; Sinha, A.; Cheng, H.; Edwards, L. Pacific ocean sea surface temperature influence on southwestern United States climate during the past millennium: New evidence from a well-calibrated, high-resolution stalagmite δ18O record from the Sierra Nevada, California. Quat. Int. 2013, 310, 236–237. [Google Scholar] [CrossRef]
- Lachniet, M.S.; Denniston, R.F.; Asmerom, Y.; Polyak, V.J. Orbital control of western North America atmospheric circulation and climate over two glacial cycles. Nat. Commun. 2014, 5, 3805. [Google Scholar] [CrossRef] [PubMed]
- Lachniet, M.S. Chapter 20—A Speleothem Record of Great Basin Paleoclimate: The Leviathan Chronology, Nevada. In Developments in Earth Surface Processes; Oviatt, C.G., Shroder, J.F., Eds.; Elsevier: Amsterdam, The Netherlands, 2016; Volume 20, pp. 551–569. [Google Scholar]
- Lora, J.M.; Mitchell, J.L.; Risi, C.; Tripati, A.E. North Pacific atmospheric rivers and their influence on western North America at the Last Glacial Maximum. Geophys. Res. Lett. 2017, 44, 1051–1059. [Google Scholar] [CrossRef]
- Bhattacharya, T.; Tierney, J.E.; Addison, J.A.; Murray, J.W. Ice-sheet modulation of deglacial North American monsoon intensification. Nat. Geosci. 2018, 11, 848–852. [Google Scholar] [CrossRef]
- Bartlein, P.J.; Anderson, K.H.; Anderson, P.M.; Edwards, M.E.; Mock, C.J.; Thompson, R.S.; Webb, R.S.; Webb, T., III; Whitlock, C. Paleoclimate simulations for North America over the past 21,000 years: Features of the simulated climate and comparisons with paleoenvironmental data. Quat. Sci. Rev. 1998, 17, 549–585. [Google Scholar] [CrossRef]
- Roy, P.D.; Rivero-Navarrete, A.; Sánchez-Zavala, J.L. Atlantic Ocean modulated hydroclimate of the subtropical northeastern Mexico since the last glacial maximum and comparison with the southern US. Earth Planet. Sci. Lett. 2016, 434, 141–150. [Google Scholar] [CrossRef]
- McGee, D.; Donohoe, A.; Marshall, J.; Ferreira, D. Changes in ITCZ location and cross-equatorial heat transport at the Last Glacial Maximum, Heinrich Stadial 1, and the mid-Holocene. Earth Planet. Sci. Lett. 2014, 390, 69–79. [Google Scholar] [CrossRef]
- Harvey, F.E.; Welker, J.M. Stable isotopic composition of precipitation in the semi-arid north-central portion of the US Great Plains. J. Hydrol. 2000, 238, 90–109. [Google Scholar] [CrossRef]
- Aharon, P.; Dhungana, R. Ocean-atmosphere interactions as drivers of mid-to-late Holocene rapid climate changes: Evidence from high-resolution stalagmite records at DeSoto Caverns, Southeast USA. Quat. Sci. Rev. 2017, 170, 69–81. [Google Scholar] [CrossRef]
- Liu, Z.; Bowen, G.J.; Welker, J.M. Atmospheric circulation is reflected in precipitation isotope gradients over the conterminous United States. J. Geophys. Res. 2010, 115. [Google Scholar] [CrossRef]
- Gat, J.R.; Bowser, C.J.; Kendall, C. The contribution of evaporation from the Great Lakes to the continental atmosphere: Estimate based on stable isotope data. Geophys. Res. Lett. 1994, 21, 557–560. [Google Scholar] [CrossRef]
- Burnett, A.W.; Kirby, M.E.; Mullins, H.T.; Patterson, W.P. Increasing Great Lake–Effect Snowfall during the Twentieth Century: A Regional Response to Global Warming? J. Clim. 2003, 16, 3535–3542. [Google Scholar] [CrossRef]
- Machavaram, M.V.; Krishnamurthy, R.V. Earth surface evaporative process: A case study from the Great Lakes region of the United States based on deuterium excess in precipitation. Geochim. Cosmochim. Acta 1995, 59, 4279–4283. [Google Scholar] [CrossRef]
- Dorale, J.A.; González, L.A.; Reagan, M.K.; Pickett, D.A.; Murrell, M.T.; Baker, R.G. A high-resolution record of Holocene climate change in speleothem calcite from cold water cave, Northeast Iowa. Science 1992, 258, 1626–1630. [Google Scholar] [CrossRef]
- Dorale, J.A.; Edwards, R.L.; Ito, E.; Gonzalez, L.A. Climate and vegetation history of the midcontinent from 75 to 25 ka: A speleothem record from crevice cave, Missouri, USA. Science 1998, 282, 1871–1874. [Google Scholar] [CrossRef]
- Sjostrom, D.J.; Welker, J.M. The influence of air mass source on the seasonal isotopic composition of precipitation, eastern USA. J. Geochem. Explor. 2009, 102, 103–112. [Google Scholar] [CrossRef]
- Tian, C.; Wang, L.; Kaseke, K.F.; Bird, B.W. Stable isotope compositions (δ2H, δ18O and δ17O) of rainfall and snowfall in the central United States. Sci. Rep. 2018, 8, 6712. [Google Scholar] [CrossRef] [PubMed]
- Good, S.P.; Mallia, D.V.; Lin, J.C.; Bowen, G.J. Stable isotope analysis of precipitation samples obtained via crowdsourcing reveals the spatiotemporal evolution of Superstorm Sandy. PLoS ONE 2014, 9, e91117. [Google Scholar] [CrossRef] [PubMed]
- Lawrence, R.J.; Gedzelman, D.S. Low stable isotope ratios of tropical cyclone rains. Geophys. Res. Lett. 1996, 23, 527–530. [Google Scholar] [CrossRef]
- Price, R.M.; Swart, P.K.; Willoughby, H.E. Seasonal and spatial variation in the stable isotopic composition (δ18O and δD) of precipitation in south Florida. J. Hydrol. 2008, 358, 193–205. [Google Scholar] [CrossRef]
- Hardt, B.; Rowe, H.D.; Springer, G.S.; Cheng, H.; Edwards, R.L. The seasonality of east central North American precipitation based on three coeval Holocene speleothems from southern West Virginia. Earth Planet. Sci. Lett. 2010, 295, 342–348. [Google Scholar] [CrossRef]
- Springer, G.S.; Poston, H.A.; Hardt, B. Groundwater lowering and stream incision rates in the Central Appalachian Mountains of West Virginia, USA. J. Speleol. 2014, 44, 99–105. [Google Scholar] [CrossRef]
- Giannini, A.; Kushnir, Y.; Cane, M.A. Interannual Variability of Caribbean Rainfall, ENSO, and the Atlantic Ocean*. J. Clim. 2000, 13, 297–311. [Google Scholar] [CrossRef]
- Taylor, M.A.; Alfaro, E.J. Central America and the Caribbean, Climate of. In Encyclopedia of World Climatology; Encyclopedia of Earth Sciences Series; Springer: Dordrecht, The Netherlands, 2005; pp. 183–189. [Google Scholar]
- Schneider, T.; Bischoff, T.; Haug, G.H. Migrations and dynamics of the intertropical convergence zone. Nature 2014, 513, 45–53. [Google Scholar] [CrossRef] [PubMed]
- Waliser, D.E.; Gautier, C. A Satellite-derived Climatology of the ITCZ. J. Clim. 1993, 6, 2162–2174. [Google Scholar] [CrossRef]
- Poveda, G.; Waylen, P.R.; Pulwarty, R.S. Annual and inter-annual variability of the present climate in northern South America and southern Mesoamerica. Palaeogeogr. Palaeoclimatol. Palaeoecol. 2006, 234, 3–27. [Google Scholar] [CrossRef]
- Philander, S.G.H.; Gu, D.; Lambert, G.; Li, T.; Halpern, D.; Lau, N.-C.; Pacanowski, R.C. Why the ITCZ Is Mostly North of the Equator. J. Clim. 1996, 9, 2958–2972. [Google Scholar] [CrossRef]
- Amador, J.A. The Intra-Americas Sea Low-level Jet. Ann. N. Y. Acad. Sci. 2008, 1146, 153–188. [Google Scholar] [CrossRef] [PubMed]
- Mestas-Nuñez, A.M.; Enfield, D.B.; Zhang, C. Water Vapor Fluxes over the Intra-Americas Sea: Seasonal and Interannual Variability and Associations with Rainfall. J. Clim. 2007, 20, 1910–1922. [Google Scholar] [CrossRef]
- Hodell, D.A.; Anselmetti, F.S.; Ariztegui, D.; Brenner, M.; Curtis, J.H.; Gilli, A.; Grzesik, D.A.; Guilderson, T.J.; Müller, A.D.; Bush, M.B. An 85-ka record of climate change in lowland Central America. Quat. Sci. Rev. 2008, 27, 1152–1165. [Google Scholar] [CrossRef]
- George, R.K.; Waylen, P.; Laporte, S. Interannual variability of annual streamflow and the Southern Oscillation in Costa Rica. Hydrol. Sci. J. 1998, 43, 409–424. [Google Scholar] [CrossRef]
- Magaña, V.O.; Vázquez, J.L.; Pérez, J.L.; Pérez, J.B. Impact of El Niño on precipitation in Mexico. Geofís. Int. 2003, 42, 313–330. [Google Scholar]
- Lachniet, M.S.; Patterson, W.P. Oxygen isotope values of precipitation and surface waters in northern Central America (Belize and Guatemala) are dominated by temperature and amount effects. Earth Planet. Sci. Lett. 2009, 284, 435–446. [Google Scholar] [CrossRef]
- Lachniet, M.S.; Patterson, W.P. Use of correlation and stepwise regression to evaluate physical controls on the stable isotope values of Panamanian rain and surface waters. J. Hydrol. 2006, 324, 115–140. [Google Scholar] [CrossRef]
- Lachniet, M.S.; Patterson, W.P.; Burns, S.; Asmerom, Y.; Polyak, V. Caribbean and Pacific moisture sources on the Isthmus of Panama revealed from stalagmite and surface water δ18O gradients. Geophys. Res. Lett. 2007, 34, 149. [Google Scholar] [CrossRef]
- Lachniet, M.S. Sea surface temperature control on the stable isotopic composition of rainfall in Panama. Geophys. Res. Lett. 2009, 36. [Google Scholar] [CrossRef]
- Jones, I.C.; Banner, J.L.; Humphrey, J.D. Estimating recharge in a tropical Karst Aquifer. Water Resour. Res. 2000, 36, 1289–1299. [Google Scholar] [CrossRef]
- Vieten, R.; Warken, S.; Winter, A.; Scholz, D.; Miller, T.; Spötl, C.; Schröder-Ritzrau, A. Monitoring of Cueva Larga, Puerto Rico—A First Step to Decode Speleothem Climate Records. In Karst Groundwater Contamination and Public Health; Advances in Karst Science; Springer: Cham, Switzerland, 2017; pp. 319–331. [Google Scholar]
- Vieten, R.; Warken, S.; Winter, A.; Schröder-Ritzrau, A.; Scholz, D.; Spötl, C. Hurricane Impact on Seepage Water in Larga Cave, Puerto Rico. J. Geophys. Res. Biogeosci. 2018, 123, 879–888. [Google Scholar] [CrossRef]
- Medina-Elizalde, M.; Burns, S.J.; Polanco-Martínez, J.M.; Beach, T.; Lases-Hernández, F.; Shen, C.-C.; Wang, H.-C. High-resolution speleothem record of precipitation from the Yucatan Peninsula spanning the Maya Preclassic Period. Glob. Planet. Chang. 2016, 138, 93–102. [Google Scholar] [CrossRef]
- Lases-Hernandez, F.; Medina-Elizalde, M.; Burns, S.; DeCesare, M. Long-term monitoring of drip water and groundwater stable isotopic variability in the Yucatán Peninsula: Implications for recharge and speleothem rainfall reconstruction. Geochim. Cosmochim. Acta 2019, 246, 41–59. [Google Scholar] [CrossRef]
- Sánchez-Murillo, R.; Durán-Quesada, A.M.; Birkel, C.; Esquivel-Hernández, G.; Boll, J. Tropical precipitation anomalies and d-excess evolution during El Niño 2014-16. Hydrol. Process. 2017, 31, 956–967. [Google Scholar] [CrossRef]
- Vuille, M. Modeling δ18O in precipitation over the tropical Americas: 1. Interannual variability and climatic controls. J. Geophys. Res. 2003, 108. [Google Scholar] [CrossRef]
- Arienzo, M.M.; Swart, P.K.; Pourmand, A.; Broad, K.; Clement, A.C.; Murphy, L.N.; Vonhof, H.B.; Kakuk, B. Bahamian speleothem reveals temperature decrease associated with Heinrich stadials. Earth Planet. Sci. Lett. 2015, 430, 377–386. [Google Scholar] [CrossRef]
- Arienzo, M.M.; Swart, P.K.; Broad, K.; Clement, A.C.; Pourmand, A.; Kakuk, B. Multi-proxy evidence of millennial climate variability from multiple Bahamian speleothems. Quat. Sci. Rev. 2017, 161, 18–29. [Google Scholar] [CrossRef]
- Medina-Elizalde, M.; Burns, S.J.; Lea, D.W.; Asmerom, Y.; von Gunten, L.; Polyak, V.; Vuille, M.; Karmalkar, A. High resolution stalagmite climate record from the Yucatán Peninsula spanning the Maya terminal classic period. Earth Planet. Sci. Lett. 2010, 298, 255–262. [Google Scholar] [CrossRef]
- Frappier, A.B.; Sahagian, D.; Carpenter, S.J.; González, L.A.; Frappier, B.R. Stalagmite stable isotope record of recent tropical cyclone events. Geology 2007, 35, 111–114. [Google Scholar] [CrossRef]
- Lachniet, M.S.; Johnson, L.; Asmerom, Y.; Burns, S.J.; Polyak, V.; Patterson, W.P.; Burt, L.; Azouz, A. Late Quaternary moisture export across Central America and to Greenland: Evidence for tropical rainfall variability from Costa Rican stalagmites. Quat. Sci. Rev. 2009, 28, 3348–3360. [Google Scholar] [CrossRef]
- Moseley, G.E.; Edwards, R.L.; Wendt, K.A.; Cheng, H.; Dublyansky, Y.; Lu, Y.; Boch, R.; Spötl, C. Reconciliation of the Devils Hole climate record with orbital forcing. Science 2016, 351, 165–168. [Google Scholar] [CrossRef] [PubMed]
- Rehfeld, K.; Münch, T.; Ho, S.L.; Laepple, T. Global patterns of declining temperature variability from the Last Glacial Maximum to the Holocene. Nature 2018, 554, 356–359. [Google Scholar] [CrossRef]
- Wong, C.I.; Breecker, D.O. Advancements in the use of speleothems as climate archives. Quat. Sci. Rev. 2015, 127, 1–18. [Google Scholar] [CrossRef]
- Lambert, W.J.; Aharon, P. Controls on dissolved inorganic carbon and δ13C in cave waters from DeSoto Caverns: Implications for speleothem δ13C assessments. Geochim. Cosmochim. Acta 2011, 75, 753–768. [Google Scholar] [CrossRef]
- Mickler, P.J.; Banner, J.L.; Stern, L.; Asmerom, Y.; Edwards, R.L.; Ito, E. Stable isotope variations in modern tropical speleothems: Evaluating equilibrium vs. kinetic isotope effects 1. Geochim. Cosmochim. Acta 2004, 68, 4381–4393. [Google Scholar] [CrossRef]
- Tremaine, D.M.; Froelich, P.N.; Wang, Y. Speleothem calcite farmed in situ: Modern calibration of δ18O and δ13C paleoclimate proxies in a continuously-monitored natural cave system. Geochim. Cosmochim. Acta 2011, 75, 4929–4950. [Google Scholar] [CrossRef]
- Banner, J.L.; Guilfoyle, A.; James, E.W.; Stern, L.A.; Musgrove, M. Seasonal Variations in Modern Speleothem Calcite Growth in Central Texas, U.S.A. J. Sediment. Res. 2007, 77, 615–622. [Google Scholar] [CrossRef]
- Wong, C.I.; Banner, J.L.; Musgrove, M. Seasonal dripwater Mg/Ca and Sr/Ca variations driven by cave ventilation: Implications for and modeling of speleothem paleoclimate records. Geochim. Cosmochim. Acta 2011, 75, 3514–3529. [Google Scholar] [CrossRef]
- Meyer, K.W.; Feng, W.; Breecker, D.O.; Banner, J.L.; Guilfoyle, A. Interpretation of speleothem calcite δ13C variations: Evidence from monitoring soil CO2, drip water, and modern speleothem calcite in central Texas. Geochim. Cosmochim. Acta 2014, 142, 281–298. [Google Scholar] [CrossRef]
- Daëron, M.; Guo, W.; Eiler, J.; Genty, D.; Blamart, D.; Boch, R.; Drysdale, R.; Maire, R.; Wainer, K.; Zanchetta, G. 13C18O clumping in speleothems: Observations from natural caves and precipitation experiments. Geochim. Cosmochim. Acta 2011, 75, 3303–3317. [Google Scholar] [CrossRef]
- Feng, W.; Banner, J.L.; Guilfoyle, A.L.; Musgrove, M.; James, E.W. Oxygen isotopic fractionation between drip water and speleothem calcite: A 10-year monitoring study, central Texas, USA. Chem. Geol. 2012, 304–305, 53–67. [Google Scholar] [CrossRef]
- Rehfeld, K.; Kurths, J. Similarity estimators for irregular and age-uncertain time series. Clim. Past 2014, 10, 107–122. [Google Scholar] [CrossRef]
- Epskamp, S.; Cramer, A.; Waldorp, L.; Schmittmann, V.; Borsboom, D. qgraph: Network Visualizations of Relationships in Psychometric Data. J. Stat. Softw. 2012, 48, 1–18. [Google Scholar] [CrossRef]
- Dansgaard, W.; Johnsen, S.J.; Clausen, H.B.; Dahl-Jensen, D.; Gundestrup, N.; Hammer, C.U.; Oeschger, H. North Atlantic climatic oscillations revealed by deep Greenland ice cores. In Climate Processes and Climate Sensitivity; Hansen, J.E., Takahashi, T., Eds.; Geophysical Monograph Series; American Geophysical Union: Washington, DC, USA, 1984; Volume 29, pp. 288–298. ISBN 9780875904047. [Google Scholar]
- Oster, J.L.; Montañez, I.P.; Mertz-Kraus, R.; Sharp, W.D.; Stock, G.M.; Spero, H.J.; Tinsley, J.; Zachos, J.C. Millennial-scale variations in western Sierra Nevada precipitation during the last glacial cycle MIS 4/3 transition. Quat. Res. 2014, 82, 236–248. [Google Scholar] [CrossRef]
- Shakun, J.D.; Burns, S.J.; Clark, P.U.; Cheng, H.; Edwards, R.L. Milankovitch-paced Termination II in a Nevada speleothem? Geophys. Res. Lett. 2011, 38, L18701. [Google Scholar] [CrossRef]
- Springer, G.S.; Rowe, H.D.; Hardt, B.; Cheng, H.; Edwards, R.L. East central North America climates during marine isotope stages 3–5. Geophys. Res. Lett. 2014, 41, 3233–3237. [Google Scholar] [CrossRef]
- Berger, A. Long-Term Variations of Daily Insolation and Quaternary Climatic Changes. J. Atmos. Sci. 1978, 35, 2362–2367. [Google Scholar] [CrossRef]
- Winograd, I.J.; Coplen, T.B.; Landwehr, J.M.; Riggs, A.C.; Ludwig, K.R.; Szabo, B.J.; Kolesar, P.T.; Revesz, K.M. Continuous 500,000-year climate record from vein calcite in Devils hole, Nevada. Science 1992, 258, 255–260. [Google Scholar] [CrossRef] [PubMed]
- Seierstad, I.K.; Abbott, P.M.; Bigler, M.; Blunier, T.; Bourne, A.J.; Brook, E.; Buchardt, S.L.; Buizert, C.; Clausen, H.B.; Cook, E.; et al. Consistently dated records from the Greenland GRIP, GISP2 and NGRIP ice cores for the past 104 ka reveal regional millennial-scale δ18O gradients with possible Heinrich event imprint. Quat. Sci. Rev. 2014, 106, 29–46. [Google Scholar] [CrossRef]
- Lachniet, M.S.; Asmerom, Y.; Bernal, J.P.; Polyak, V.J.; Vazquez-Selem, L. Orbital pacing and ocean circulation-induced collapses of the Mesoamerican monsoon over the past 22,000 y. Proc. Natl. Acad. Sci. USA 2013, 110, 9255–9260. [Google Scholar] [CrossRef] [PubMed]
- Broccoli, A.J.; Dahl, K.A.; Stouffer, R.J. Response of the ITCZ to Northern Hemisphere cooling. Geophys. Res. Lett. 2006, 33. [Google Scholar] [CrossRef]
- Schmidt, M.W.; Spero, H.J. Meridional shifts in the marine ITCZ and the tropical hydrologic cycle over the last three glacial cycles. Paleoceanogr. Paleoclimatol. 2011, 26. [Google Scholar] [CrossRef]
- Wang, X.; Auler, A.S.; Edwards, R.L.; Cheng, H.; Ito, E.; Wang, Y.; Kong, X.; Solheid, M. Millennial-scale precipitation changes in southern Brazil over the past 90,000 years. Geophys. Res. Lett. 2007, 34. [Google Scholar] [CrossRef]
- Singarayer, J.S.; Valdes, P.J.; Roberts, W.H.G. Ocean dominated expansion and contraction of the late Quaternary tropical rainbelt. Sci. Rep. 2017, 7, 9382. [Google Scholar] [CrossRef] [PubMed]
- Munroe, J.S.; Laabs, B.J.C. Temporal correspondence between pluvial lake highstands in the southwestern US and Heinrich Event 1. J. Quat. Sci. 2013, 28, 49–58. [Google Scholar] [CrossRef]
- Ibarra, D.E.; Egger, A.E.; Weaver, K.L.; Harris, C.R.; Maher, K. Rise and fall of late Pleistocene pluvial lakes in response to reduced evaporation and precipitation: Evidence from Lake Surprise, California. GSA Bull. 2014, 126, 1387–1415. [Google Scholar] [CrossRef]
- McGee, D.; Moreno-Chamarro, E.; Green, B.; Marshall, J.; Galbraith, E.; Bradtmiller, L. Hemispherically asymmetric trade wind changes as signatures of past ITCZ shifts. Quat. Sci. Rev. 2018, 180, 214–228. [Google Scholar] [CrossRef]
- Lachniet, M.S.; Asmerom, Y.; Polyak, V. Deglacial paleoclimate in the southwestern United States: An abrupt 18.6 ka cold event and evidence for a North Atlantic forcing of Termination I. Quat. Sci. Rev. 2011, 30, 3803–3811. [Google Scholar] [CrossRef]
- Broecker, W.; Putnam, A.E. How did the hydrologic cycle respond to the two-phase mystery interval? Quat. Sci. Rev. 2012, 57, 17–25. [Google Scholar] [CrossRef]
- Wong, C.I.; Potter, G.L.; Montañez, I.P.; Otto-Bliesner, B.L.; Behling, P.; Oster, J.L. Evolution of moisture transport to the western US during the last deglaciation. Geophys. Res. Lett. 2016, 43, 3468–3477. [Google Scholar] [CrossRef]
- Hermann, N.W.; Oster, J.L.; Ibarra, D.E. Spatial patterns and driving mechanisms of mid-Holocene hydroclimate in western North America. J. Quat. Sci. 2018, 33, 421–434. [Google Scholar] [CrossRef]
- Bernal, J.P.; Lachniet, M.; McCulloch, M.; Mortimer, G.; Morales, P.; Cienfuegos, E. A speleothem record of Holocene climate variability from southwestern Mexico. Quat. Res. 2011, 75, 104–113. [Google Scholar] [CrossRef]
- Winter, A.; Miller, T.; Kushnir, Y.; Sinha, A.; Timmermann, A.; Jury, M.R.; Gallup, C.; Cheng, H.; Edwards, R.L. Evidence for 800 years of North Atlantic multi-decadal variability from a Puerto Rican speleothem. Earth Planet. Sci. Lett. 2011, 308, 23–28. [Google Scholar] [CrossRef]
- Lachniet, M.S.; Asmerom, Y.; Polyak, V.; Bernal, J.P. Two millennia of Mesoamerican monsoon variability driven by Pacific and Atlantic synergistic forcing. Quat. Sci. Rev. 2017, 155, 100–113. [Google Scholar] [CrossRef]
- Webster, J.W.; Brook, G.A.; Railsback, L.B.; Cheng, H.; Edwards, R.L.; Alexander, C.; Reeder, P.P. Stalagmite evidence from Belize indicating significant droughts at the time of Preclassic Abandonment, the Maya Hiatus, and the Classic Maya collapse. Palaeogeogr. Palaeoclimatol. Palaeoecol. 2007, 250, 1–17. [Google Scholar] [CrossRef]
- Wang, X.; Auler, A.S.; Edwards, R.L.; Cheng, H.; Ito, E.; Solheid, M. Interhemispheric anti-phasing of rainfall during the last glacial period. Quat. Sci. Rev. 2006, 25, 3391–3403. [Google Scholar] [CrossRef]
- Arbuszewski, J.A.; deMenocal, P.B.; Cléroux, C.; Bradtmiller, L.; Mix, A. Meridional shifts of the Atlantic intertropical convergence zone since the Last Glacial Maximum. Nat. Geosci. 2013, 6, 959–962. [Google Scholar] [CrossRef]
- Wang, P.X.; Wang, B.; Cheng, H.; Fasullo, J.; Guo, Z.T.; Kiefer, T.; Liu, Z.Y. The global monsoon across timescales: Coherent variability of regional monsoons. Clim. Past 2014, 10, 2007–2052. [Google Scholar] [CrossRef]
- Cruz, F.W., Jr.; Burns, S.J.; Karmann, I.; Sharp, W.D.; Vuille, M.; Cardoso, A.O.; Ferrari, J.A.; Dias, P.L.S.; Viana, O. Insolation-driven changes in atmospheric circulation over the past 116,000 years in subtropical Brazil. Nature 2005, 434, 63–66. [Google Scholar] [CrossRef]
- Sachs, J.P.; Sachse, D.; Smittenberg, R.H.; Zhang, Z.; Battisti, D.S.; Golubic, S. Southward movement of the Pacific intertropical convergence zone AD 1400–1850. Nat. Geosci. 2009, 2, 519–525. [Google Scholar] [CrossRef]
- Collins, J.A.; Schefuß, E.; Heslop, D.; Mulitza, S.; Prange, M.; Zabel, M.; Tjallingii, R.; Dokken, T.M.; Huang, E.; Mackensen, A.; et al. Interhemispheric symmetry of the tropical African rainbelt over the past 23,000 years. Nat. Geosci. 2010, 4, 42–45. [Google Scholar] [CrossRef]
- Denniston, R.F.; Ummenhofer, C.C.; Wanamaker, A.D.; Lachniet, M.S.; Villarini, G.; Asmerom, Y.; Polyak, V.J.; Passaro, K.J.; Cugley, J.; Woods, D.; et al. Expansion and Contraction of the Indo-Pacific Tropical Rain Belt over the Last Three Millennia. Sci. Rep. 2016, 6, 34485. [Google Scholar] [CrossRef] [PubMed]
- Yan, H.; Wei, W.; Soon, W.; An, Z.; Zhou, W.; Liu, Z.; Wang, Y.; Carter, R.M. Dynamics of the intertropical convergence zone over the western Pacific during the Little Ice Age. Nat. Geosci. 2015, 8, 315–320. [Google Scholar] [CrossRef]
- Ridley, H.E.; Asmerom, Y.; Baldini, J.U.L.; Breitenbach, S.F.M.; Aquino, V.V.; Prufer, K.M.; Culleton, B.J.; Polyak, V.; Lechleitner, F.A.; Kennett, D.J.; et al. Aerosol forcing of the position of the intertropical convergence zone since ad 1550. Nat. Geosci. 2015, 8, 195–200. [Google Scholar] [CrossRef]
- Winter, A.; Zanchettin, D.; Miller, T.; Kushnir, Y.; Black, D.; Lohmann, G.; Burnett, A.; Haug, G.H.; Estrella-Martínez, J.; Breitenbach, S.F.M.; et al. Persistent drying in the tropics linked to natural forcing. Nat. Commun. 2015, 6, 7627. [Google Scholar] [CrossRef] [PubMed]
- Zanchettin, D.; Timmreck, C.; Graf, H.-F.; Rubino, A.; Lorenz, S.; Lohmann, K.; Krüger, K.; Jungclaus, J.H. Bi-decadal variability excited in the coupled ocean–atmosphere system by strong tropical volcanic eruptions. Clim. Dyn. 2012, 39, 419–444. [Google Scholar] [CrossRef]
- Lachniet, M.S. Are aragonite stalagmites reliable paleoclimate proxies? Tests for oxygen isotope time-series replication and equilibrium. GSA Bull. 2015, 127, 1521–1533. [Google Scholar] [CrossRef]
- Dorale, J.A.; Liu, Z. Limitations of Hendy test criteria in judging the paleoclimatic suitability of speleothems and the need for replication. J. Cave Karst Stud. 2009, 71, 73–80. [Google Scholar]
- Aharon, P.; Aldridge, D.; Hellstrom, J. Rainfall Variability and the Rise and Collapse of the Mississippian Chiefdoms: Evidence from a Desoto Caverns Stalagmite: Giosan/Climates, Landscapes, and Civilizations. In Climates, Landscapes, and Civilizations; Giosan, L., Fuller, D.Q., Nicoll, K., Flad, R.K., Clift, P.D., Eds.; Geophysical Monograph Series; American Geophysical Union: Washington, DC, USA, 2012; pp. 35–42. ISBN 9781118704325. [Google Scholar]
- Pollock, A.L.; van Beynen, P.E.; DeLong, K.L.; Polyak, V.; Asmerom, Y. A speleothem-based mid-Holocene precipitation reconstruction for West-Central Florida. Holocene 2017, 27, 987–996. [Google Scholar] [CrossRef]
- Polyak, V.J.; Asmerom, Y.; Burns, S.J.; Lachniet, M.S. Climatic backdrop to the terminal Pleistocene extinction of North American mammals. Geology 2012, 40, 1023–1026. [Google Scholar] [CrossRef]
- Denniston, R.F.; González, L.A.; Asmerom, Y.; Baker, R.G.; Reagan, M.K.; Arthur Bettis, E. Evidence for increased cool season moisture during the middle Holocene. Geology 1999, 27, 815–818. [Google Scholar] [CrossRef]
- Denniston, R.F.; DuPree, M.; Dorale, J.A.; Asmerom, Y.; Polyak, V.J.; Carpenter, S.J. Episodes of late Holocene aridity recorded by stalagmites from Devil’s icebox Cave, Central Missouri, USA. Quat. Res. 2007, 68, 45–52. [Google Scholar] [CrossRef]
- Lundeen, Z.; Brunelle, A.; Burns, S.J.; Polyak, V.; Asmerom, Y. A speleothem record of Holocene paleoclimate from the northern Wasatch Mountains, southeast Idaho, USA. Quat. Int. 2013, 310, 83–95. [Google Scholar] [CrossRef]
- Pollock, A.L.; van Beynen, P.E.; DeLong, K.L.; Polyak, V.; Asmerom, Y.; Reeder, P.P. A mid-Holocene paleoprecipitation record from Belize. Palaeogeogr. Palaeoclimatol. Palaeoecol. 2016, 463, 103–111. [Google Scholar] [CrossRef]
- Denniston, R.F.; Asmerom, Y.; Polyak, V.; Dorale, J.A.; Carpenter, S.J.; Trodick, C.; Hoye, B.; González, L.A. Synchronous millennial-scale climatic changes in the Great Basin and the North Atlantic during the last interglacial. Geology 2007, 35, 619–622. [Google Scholar] [CrossRef]
- Marshall, D.; Ghaleb, B.; Countess, R.; Gabities, J. Preliminary paleoclimate reconstruction based on a 12,500 year old speleothem from Vancouver Island, Canada: Stable isotopes and U-Th disequilibrium dating. Quat. Sci. Rev. 2009, 28, 2507–2513. [Google Scholar] [CrossRef]
- Mangini, A.; Blumbach, P.; Verdes, P.; Spötl, C.; Scholz, D.; Machel, H.; Mahon, S. Combined records from a stalagmite from Barbados and from lake sediments in Haiti reveal variable seasonality in the Caribbean between 6.7 and 3 ka BP. Quat. Sci. Rev. 2007, 26, 1332–1343. [Google Scholar] [CrossRef]
- Fensterer, C.; Scholz, D.; Hoffmann, D.; Spötl, C.; Pajón, J.M.; Mangini, A. Cuban stalagmite suggests relationship between Caribbean precipitation and the Atlantic Multidecadal Oscillation during the past 1.3 ka. Holocene 2012, 22, 1405–1412. [Google Scholar] [CrossRef]
- Fensterer, C.; Scholz, D.; Hoffmann, D.L.; Spötl, C.; Schröder-Ritzrau, A.; Horn, C.; Pajón, J.M.; Mangini, A. Millennial-scale climate variability during the last 12.5ka recorded in a Caribbean speleothem. Earth Planet. Sci. Lett. 2013, 361, 143–151. [Google Scholar] [CrossRef]
- Stinnesbeck, W.; Becker, J.; Hering, F.; Frey, E.; González, A.G.; Fohlmeister, J.; Stinnesbeck, S.; Frank, N.; Terrazas Mata, A.; Benavente, M.E.; et al. The earliest settlers of Mesoamerica date back to the late Pleistocene. PLoS ONE 2017, 12, e0183345. [Google Scholar] [CrossRef] [PubMed]
- Asmerom, Y.; Polyak, V.J.; Rasmussen, J.B.T.; Burns, S.J.; Lachniet, M. Multidecadal to multicentury scale collapses of Northern Hemisphere monsoons over the past millennium. Proc. Natl. Acad. Sci. USA 2013, 110, 9651–9656. [Google Scholar] [CrossRef] [PubMed]
- McCabe-Glynn, S.; Johnson, K.R.; Strong, C.; Berkelhammer, M.; Sinha, A.; Cheng, H.; Edwards, R.L. Variable North Pacific influence on drought in southwestern North America since AD 854. Nat. Geosci. 2013, 6, 617–621. [Google Scholar] [CrossRef]
- Denniston, R.F.; González, L.A.; Asmerom, Y.; Reagan, M.K.; Recelli-Snyder, H. Speleothem carbon isotopic records of Holocene environments in the Ozark Highlands, USA. Quat. Int. 2000, 67, 21–27. [Google Scholar] [CrossRef]
- Denniston, R.F.; González, L.A.; Baker, R.G.; Asmerom, Y.; Reagan, M.K.; Edwards, R.L.; Alexander, E.C. Speleothem evidence for Holocene fluctuations of the prairie-forest ecotone, north-central USA. Holocene 1999, 9, 671–676. [Google Scholar] [CrossRef]
- Denniston, R.F.; Gonzalez, L.A.; Asmerom, Y.; Polyak, V.; Reagan, M.K.; Saltzman, M.R. A high-resolution speleothem record of climatic variability at the Allerød–Younger Dryas transition in Missouri, central United States. Palaeogeogr. Palaeoclimatol. Palaeoecol. 2001, 176, 147–155. [Google Scholar] [CrossRef]
- Lachniet, M.S.; Asmerom, Y.; Burns, S.J.; Patterson, W.P.; Polyak, V.J.; Seltzer, G.O. Tropical response to the 8200 yr B.P. cold event? Speleothem isotopes indicate a weakened early Holocene monsoon in Costa Rica. Geology 2004, 32, 957–960. [Google Scholar] [CrossRef]
- Rivera-Collazo, I.; Winter, A.; Scholz, D.; Mangini, A.; Miller, T.; Kushnir, Y.; Black, D. Human adaptation strategies to abrupt climate change in Puerto Rico ca. 3.5 ka. Holocene 2015, 25, 627–640. [Google Scholar] [CrossRef]
- Asmerom, Y.; Polyak, V.; Burns, S.; Rassmussen, J. Solar forcing of Holocene climate: New insights from a speleothem record, southwestern United States. Geology 2007, 35, 1–4. [Google Scholar] [CrossRef]


© 2019 by the authors. Licensee MDPI, Basel, Switzerland. This article is an open access article distributed under the terms and conditions of the Creative Commons Attribution (CC BY) license (http://creativecommons.org/licenses/by/4.0/).
Share and Cite
Oster, J.L.; Warken, S.F.; Sekhon, N.; Arienzo, M.M.; Lachniet, M. Speleothem Paleoclimatology for the Caribbean, Central America, and North America. Quaternary 2019, 2, 5. https://doi.org/10.3390/quat2010005
Oster JL, Warken SF, Sekhon N, Arienzo MM, Lachniet M. Speleothem Paleoclimatology for the Caribbean, Central America, and North America. Quaternary. 2019; 2(1):5. https://doi.org/10.3390/quat2010005
Chicago/Turabian StyleOster, Jessica L., Sophie F. Warken, Natasha Sekhon, Monica M. Arienzo, and Matthew Lachniet. 2019. "Speleothem Paleoclimatology for the Caribbean, Central America, and North America" Quaternary 2, no. 1: 5. https://doi.org/10.3390/quat2010005
APA StyleOster, J. L., Warken, S. F., Sekhon, N., Arienzo, M. M., & Lachniet, M. (2019). Speleothem Paleoclimatology for the Caribbean, Central America, and North America. Quaternary, 2(1), 5. https://doi.org/10.3390/quat2010005