Review

Late Quaternary Variations in the South American Monsoon System as Inferred by Speleothems—New Perspectives Using the SISAL Database

by
Michael Deininger
1,*,
Brittany Marie Ward
2,
Valdir F. Novello
3 and
Francisco W. Cruz
3
1
Institute of Geosciences, Johannes Gutenberg University Mainz, J.-J.-Becher-Weg 21, 55128 Mainz, Germany
2
Faculty of Science and Engineering, The University of Waikato, Private Bag 3105, Hamilton 3240, New Zealand
3
Institute of Geosciences, University of São Paulo, Rua do Lago 562, São Paulo 05508-080, Brazil
*
Author to whom correspondence should be addressed.
Quaternary 2019, 2(1), 6; https://doi.org/10.3390/quat2010006
Submission received: 4 October 2018 / Revised: 16 January 2019 / Accepted: 18 January 2019 / Published: 28 January 2019
(This article belongs to the Special Issue Speleothem Records and Climate)

Abstract

:
Here we present an overview of speleothem δ18O records from South America, most of which are available in the Speleothem Isotopes Synthesis and Analysis (SISAL_v1) database. South American tropical and subtropical speleothem δ18O time series are primarily interpreted to reflect changes in precipitation amount, the amount effect, and consequently history of convection intensity variability of convergence zones such as the Intertropical Convergence Zone (ITCZ) and the South America Monsoon System (SAMS). We investigate past hydroclimate scenarios in South America related to the South American Monsoon System in three different time periods: Late Pleistocene, Holocene, and the last two millennia. Precession driven summertime insolation is the main driver of convective variability over the continent during the last 120 kyrs (from present day to 120 kyrs BP), including the Holocene. However, there is a dipole between speleothem δ18O records from western and eastern South America. Records located in the central region of Brazil are weakly affected by insolation-driven variability, and instead are more susceptible to the variability associated with the South Atlantic Convergence Zone (SACZ). Cold episodic events in the Northern Hemisphere, such as Heinrich and Bond Events, and the Little Ice Age, increase the convective activity of the SAMS, resulting in increased precipitation amount in South America.

1. Introduction

Rainfall variability in South America is primarily driven by the Intertropical Convergence Zone (ITCZ) [1], the South American Monsoon System (SAMS) [2], and to a lesser extent, other forcings such as South Atlantic cyclones (SACs), the Southern Hemisphere westerly winds (SHWW), and past Atlantic and Pacific Ocean sea surface temperatures. To gain a deeper understanding of past variations of South American climate, it is essential to reconstruct past changes of South American hydroclimate in space and time, inter regional and continental teleconnections from these reconstructions, and identify the underlying mechanisms driving climatic variability. Understanding past climate variability in South America is pertinent to forecasting future hydroclimate variability in response to global climate change. Further, climate reconstructions are essential in understanding ecological and biogeographical responses to past hydrologic change in regions such as the Amazon rainforest, Pantanal, caatinga (Brazilian savannah), Cerrado, and Atlantic forests, which are among the regions with the richest biodiversity on Earth.
Speleothems are one of the most powerful terrestrial archives of past hydroclimate globally. The Speleothem Isotopes Synthesis and Analysis (SISAL) database [3,4] (for details see [5]) is a major contribution to the scientific community in its effort to explore these scientific questions. The SISAL aims to collect all available speleothem data into a single database, allowing for spatio-temporal analyses of time periods, to compare on the one hand new reconstructions with existing speleothem records and on the other hand to test new concepts. Here, we explore the available South American records in the current SISAL database (SISAL_v1) [3] and incorporate some other speleothem records that have not been included in SISAL_v1 yet (Table 1, Figure 1).
Speleothem-based records from South America are distributed over the entire continent, ranging from the tropical climate of Venezuela in northern South America to the colder climate of Patagonia at the southern tip of South America, as well, from the wet and cold climates of the Andes in western South America, the tropical climate in the Amazonas, and the dry climate of Nordeste in northeastern Brazil (Figure 1). Despite this continental coverage, almost all records included in SISAL_v1 are located in the tropical and sub-tropical climate zones of central and southeastern Brazil (between 0° and 30° S), which are influenced mainly by the SAMS. Thus, this review is focused mainly on past variations of the SAMS and associated precipitation changes that are revealed by speleothem δ18O time series, following the relationship for δ18O: δ18O = (18Rspeleothem/18RVPDB-1), wherein 18Rx is the isotope ratio between 18O and 16O in the speleothem or of the VPDB (Vienna Pee Dee Belemnite) standard. Decreasing speleothem δ18O values are primarily interpreted as a strengthening of upstream convection in the core monsoon region and increased precipitation amount (known as the amount effect) from strengthening of SAMS activity [7].
The onset of the monsoon season in tropical and subtropical South America begins in the austral spring (September to November, SON) when easterly trade winds are associated with the southward shift of the ITCZ, following maximum sea-surface temperatures (SSTs) and enhanced moisture transport from the tropical Atlantic over the continent. Southward migration of the insolation maximum drives an enhanced land-sea thermal gradient, leading to low-level convergence over the continent, in turn increasing precipitation and establishing a zone of deep convection from 10° S to 15° S over the southern Amazon Basin. This intense convection during the onset of the SAMS contributes to the formation of an upper-level atmospheric high over Bolivia (Bolivian High; 15° S, 65° W) and a low-level atmospheric low over the Chaco region (Chaco low; ~25° S). This dynamic draws humid air from the core monsoon region, which is then transported south to La Plata Basin region by the South American Low-Level Jet (Figure 2), as the easterlies at the core monsoon region are blocked and redirected by the Andes [2,33]. The monsoon reaches its mature phase in the austral summer (December to February, DJF), when the Bolivian High as well as the South Atlantic Convection Zone (SACZ) are well established. The SACZ, a dominant feature of the mature SAMS, is a NW–SE trending band of convection that extends from the core monsoon region to the western South Atlantic, (Figure 2). Upper-level convergence conditions develop over northeastern Brazil (the Nordeste Low) as a consequence of the establishment of the Bolivian High (Figure 2), leading to subsidence of air and a parallel decrease in summer precipitation over Nordeste, a well-noted antiphase relationship between precipitation in the western and eastern South America [33].
In the following section, we discuss the speleothem records available in SISAL_v1 along with speleothem records identified in the literature but not yet in SISAL_v1 (Section 2). In Section 3, we discuss past variations in the SAMS during the Late Pleistocene, the Holocene, and the last 2 kyrs, utilizing primarily speleothem δ18O time series that are in SISAL_v1. However, we also discuss critical speleothem δ18O time series that are not yet available in SISAL_v1. The Pleistocene Section 3.1 focuses on SAMS variations associated with changes in insolation due to variations in Earth’s orbit and millennial scale variations. The Holocene Section 3.2 details discrepancies and similarities between speleothem δ18O time series and potential drivers of these variations. The last Section 3.3 focuses on hydroclimate scenarios of the last two millennia, such as the Little Ice Age (LIA), the Medieval Climate Anomaly (MCA), and the Current Warm Period (CWP), and identifies the possible climate drivers of the SAMS and ITCZ during this period.

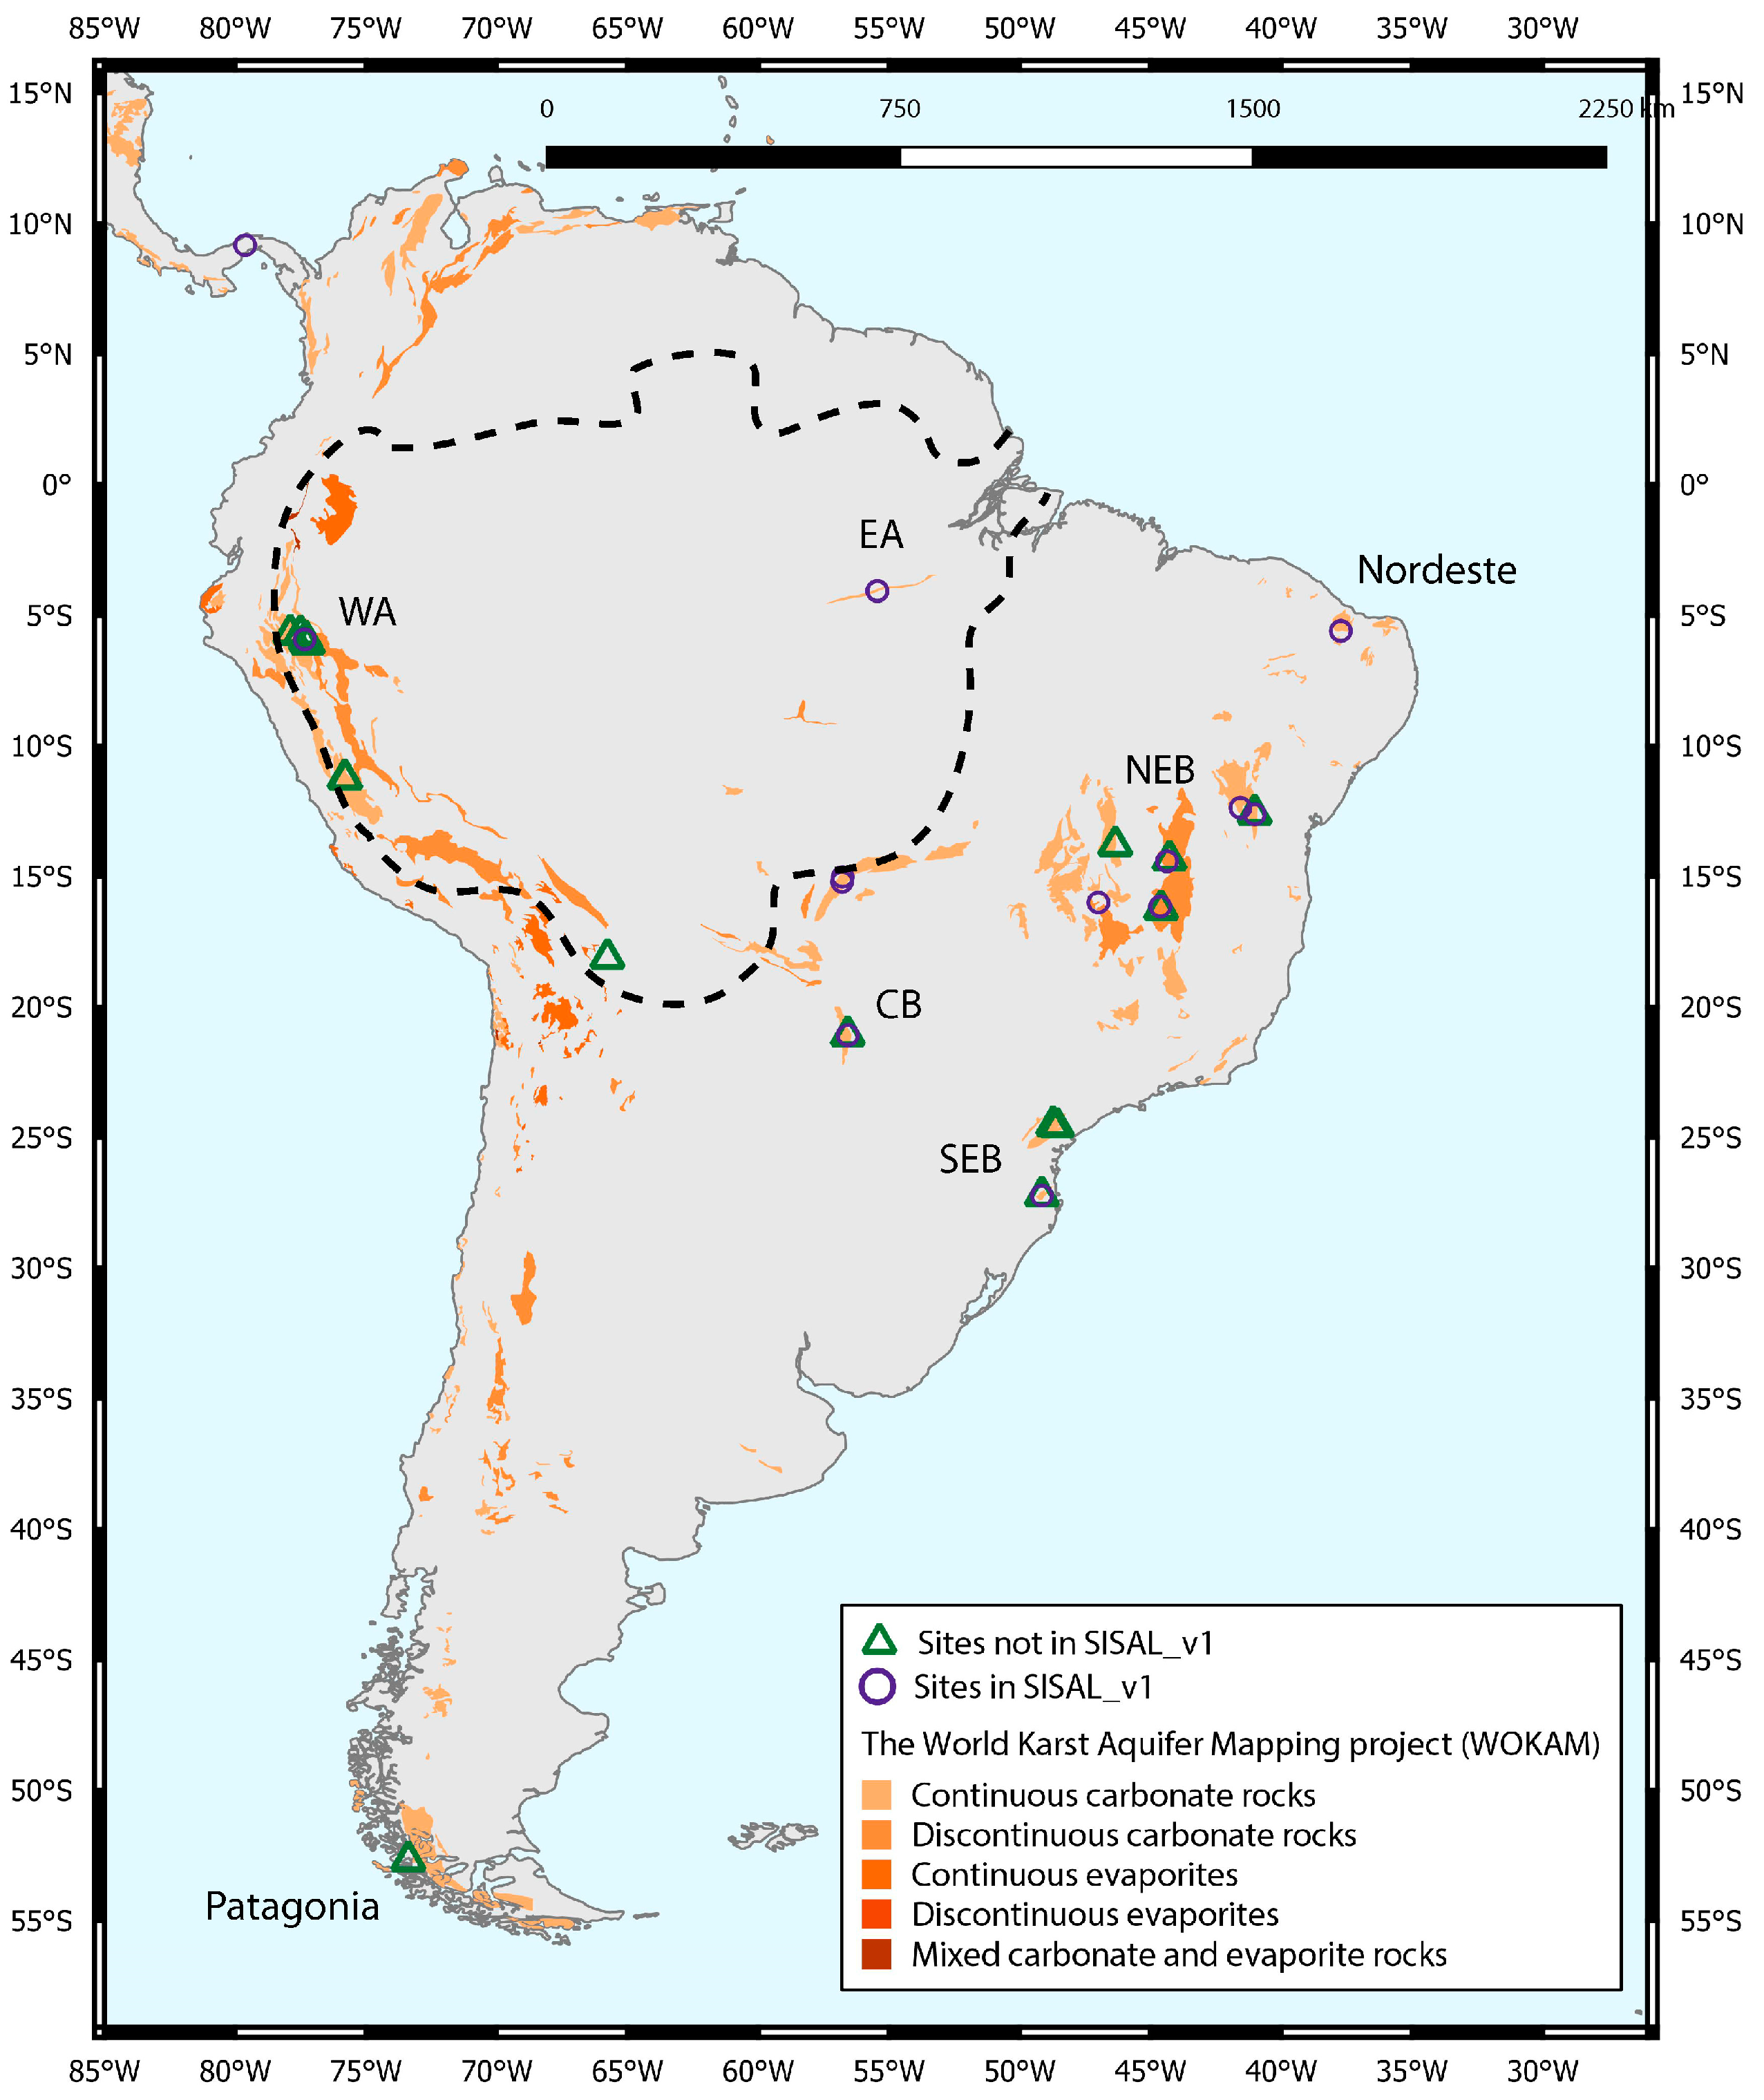
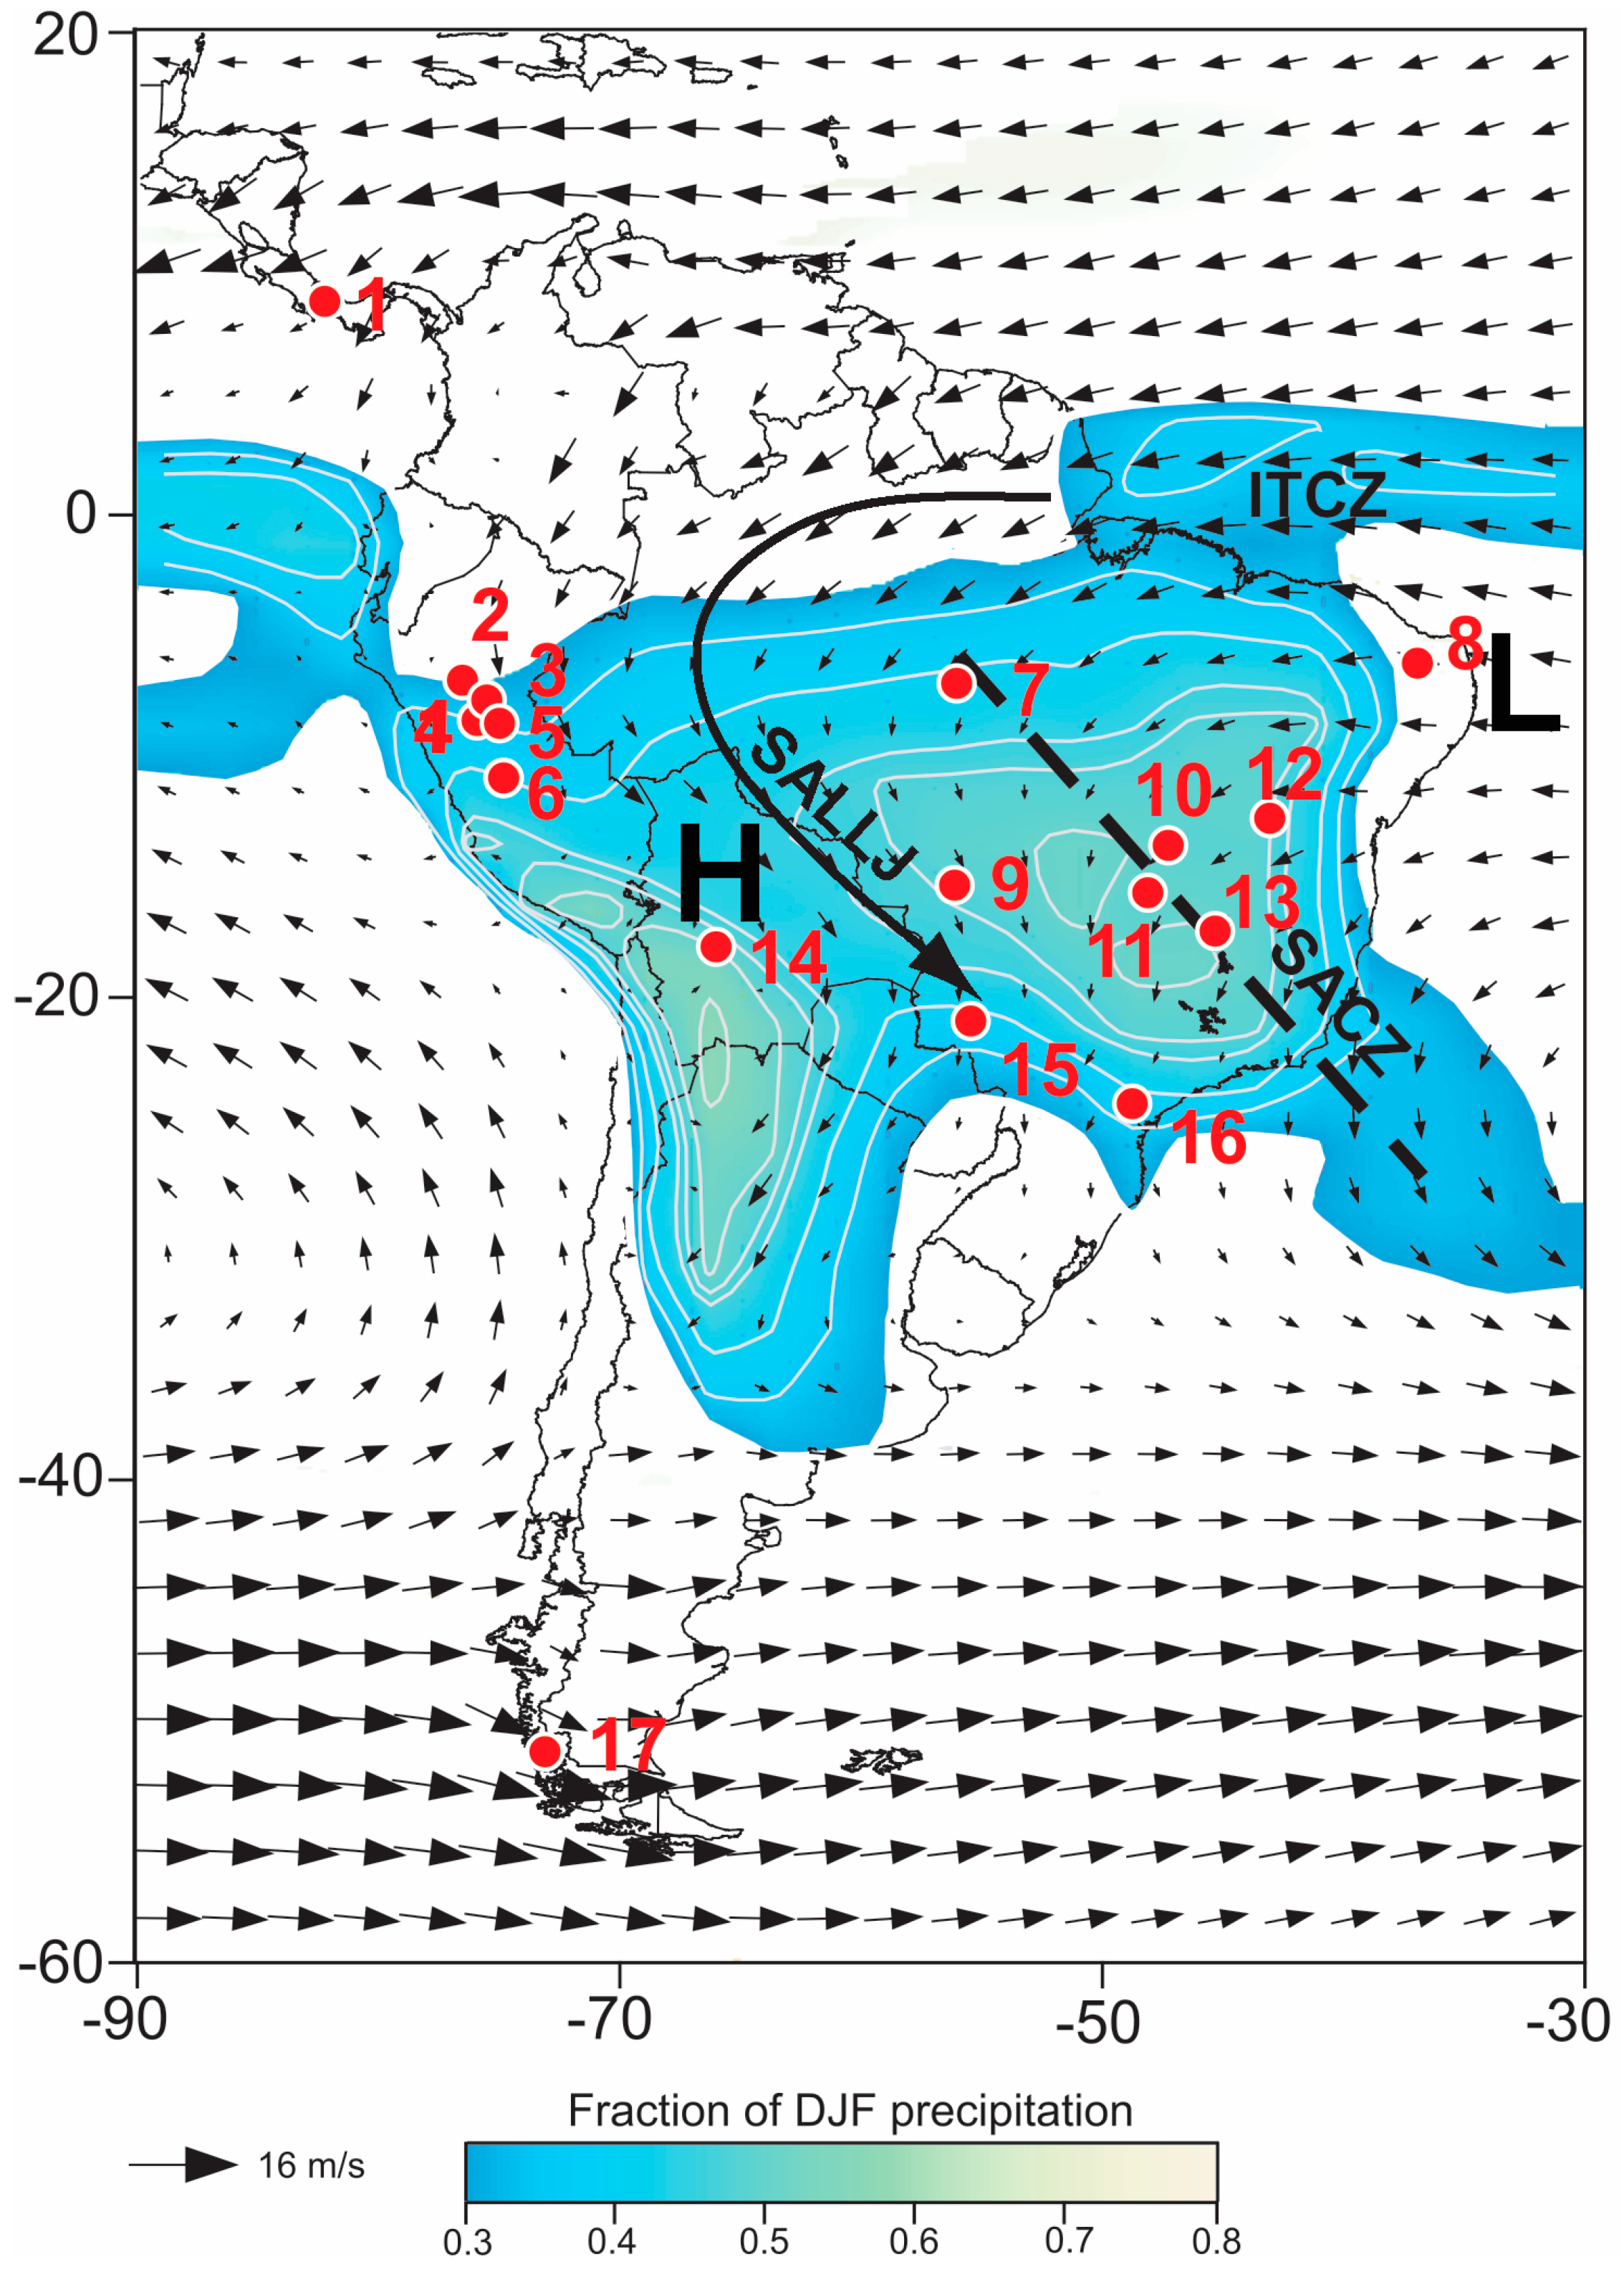
2. Assessing SISAL_v1 for South America

We have identified 75 individual speleothem isotope records from South America from the literature (Table 1). Of these, 31 are available in SISAL_v1, while the remaining 44 will be added to the SISAL database in the near future. Almost all isotope records in SISAL_v1, as well as many of the other speleothem records, are in the SAMS domain (Figure 1 and Figure 2). Records from Patagonia, Marcelo Arévalo Cave (MA Cave), and Panama (Chilibrillo Cave) are the only records available in the literature that are outside the SAMS region. SISAL_v1 is useful to investigate spatio-temporal variations of the SAMS, but highlights the need to increase coverage of speleothem records across the entirety of the continent.
SISAL_v1 δ18O records cover the last 120 kyrs, however, the distribution of speleothems δ18O records is clearly biased towards the last 30 kyrs (Figure 3). Only one δ18O record spans the entirety of the last 120 kyrs, BT2 from Botuverá Cave. For the last 30 kyrs, there are peaks in coverage for the last 2 kyrs, the early Holocene (10 to 8 kyrs BP), and the period from 20 to 15 kyrs BP. This non-uniform temporal distribution of δ18O records largely reflects the focus of the research utilizing speleothem δ18O records in South America. The temporal distribution of speleothem δ18O time series coverage (Figure 3), combined with the spatial coverage over the SAMS region (Figure 2), makes the SISAL_v1 database suitable for characterization of SAMS variability over the past 30 kyrs, but again, highlights the need to increase spatio-temporal coverage of speleothem records.

3. Results and Discussion

3.1. Pleistocene South American Monsoon System Variability as Recorded by Speleothem δ18O Time Series

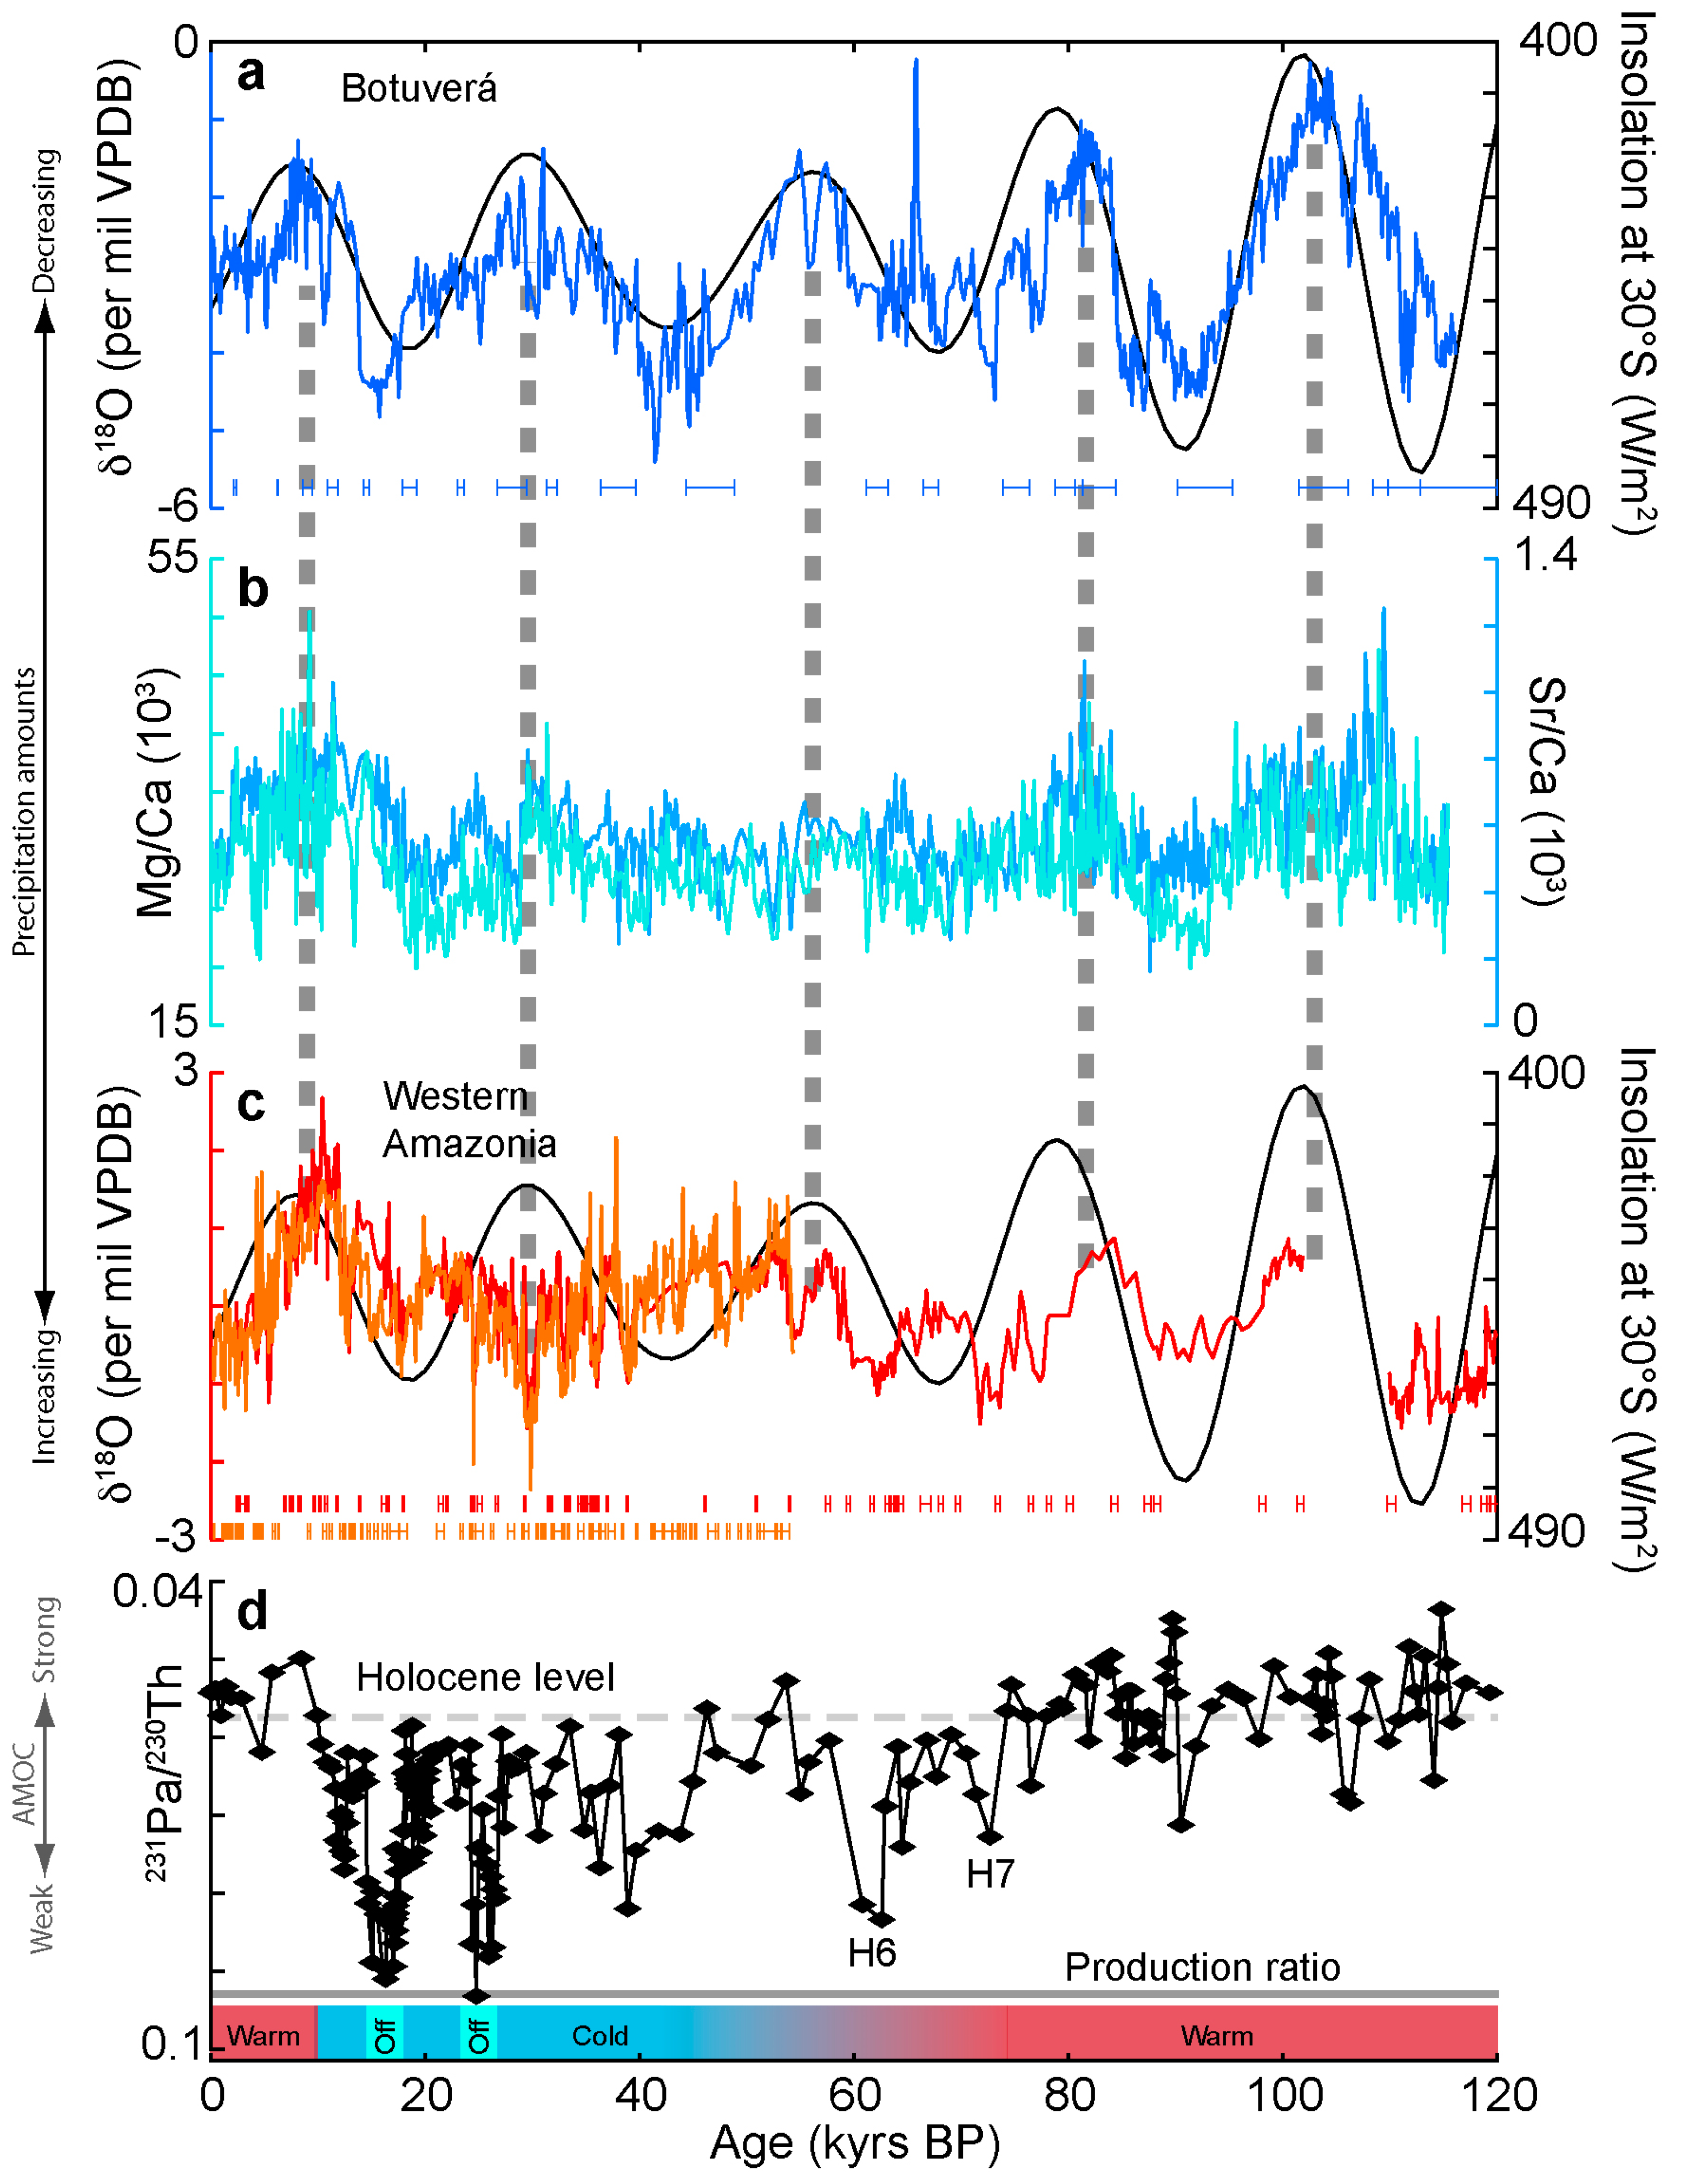
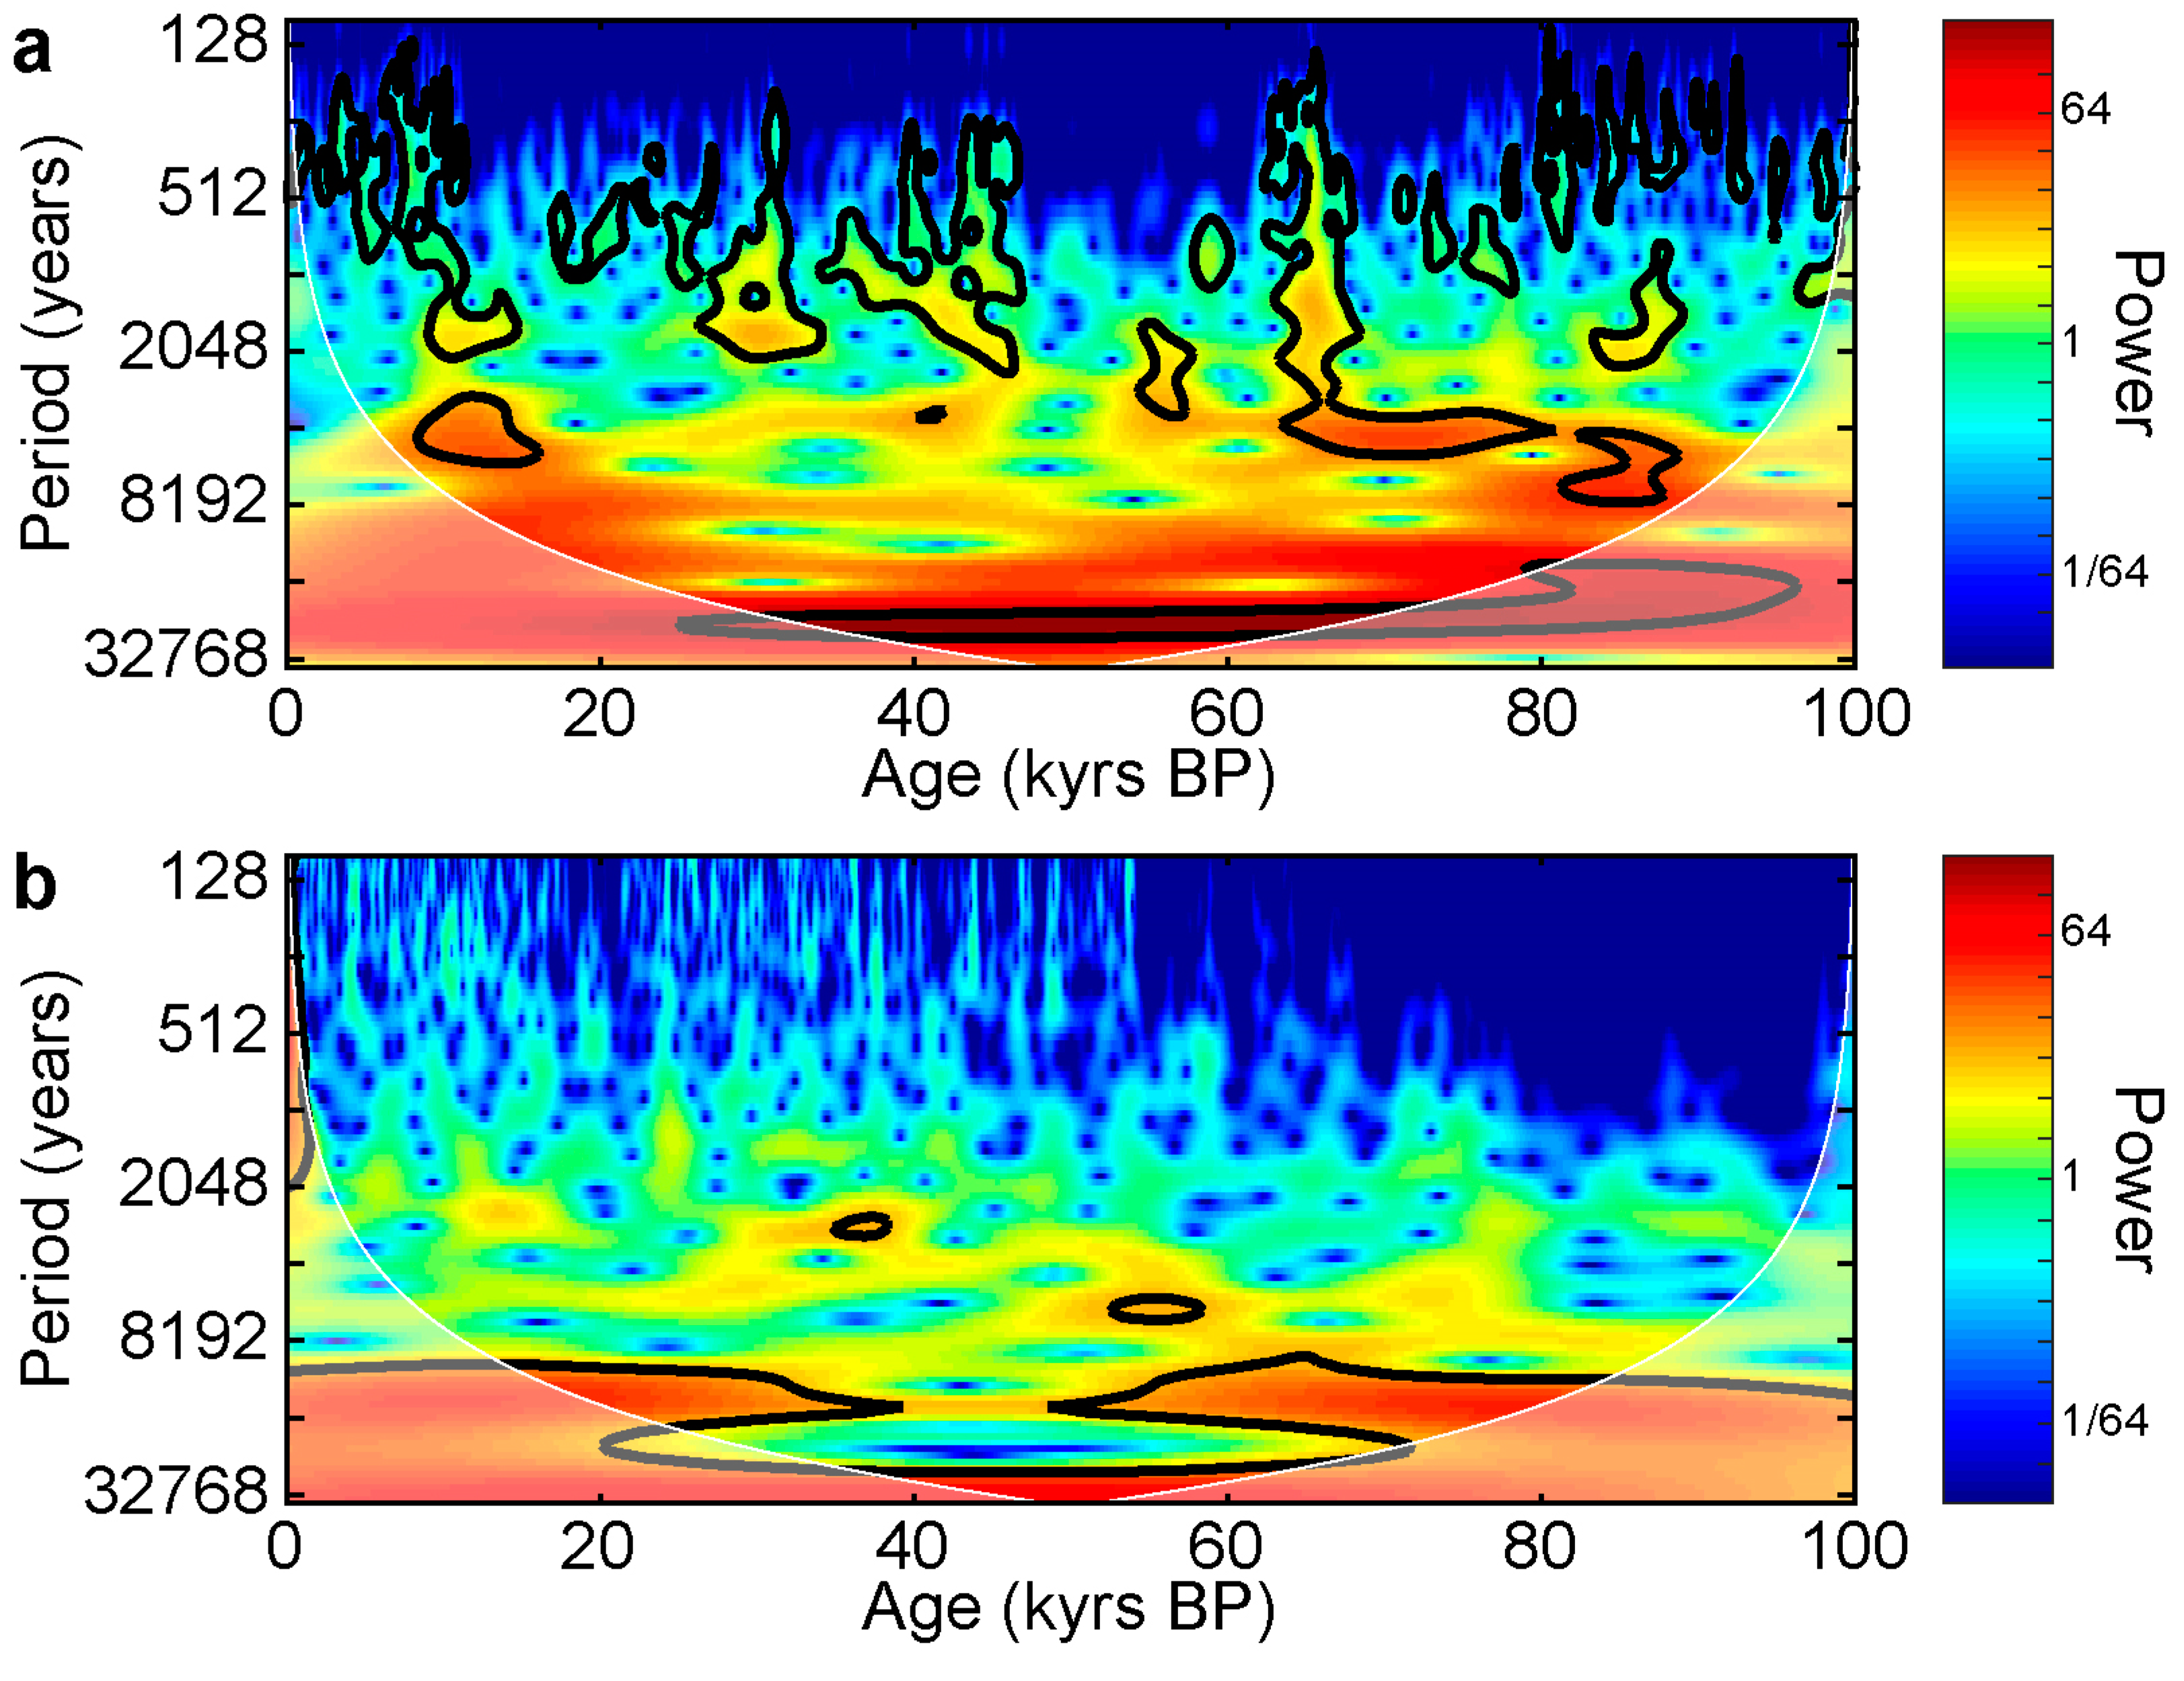
3.1.1. Insolation Forced Changes of the SAMS

Thus far, only a few studies report speleothem δ18O time series on orbital time-scales in regions where the precipitation pattern is dominantly influenced by SAMS variability. These include stalagmites from southeastern Brazil, namely BT2 [10], BTV4A*, BTV4C* [12] and BTV3A* [12] from Botuverá Cave, and St8* [30] from Santana Cave. An asterisk indicates entities that are not included in SISAL_v1. Speleothem δ18O time series from El Condor (ELC*) and Cueva del Diamante (NAR*) [16] on the eastern slope of the Andes(northern Peru) in western Amazonia (WA) (Figure 2) also show pronounced orbital scale changes. Both regions are currently located at the termini of the cone of influence of the SAMS (Figure 2).
BT2 grew continuously during the last ~112 kyrs and the δ18O time series exhibits pronounced orbital scale changes that closely follow austral summer insolation (Figure 4a) [10], which is also evident in wavelet analyses (Figure 5a). The wavelet analysis reveals a strong precession signal (20 kyrs period) of the BT2 δ18O time series. However, this precession periodicity is statistically only significant from 60 to 40 kyrs BP. This is related on the one hand to the length of the time series, which prohibit assessing the significance of the precession periodicity (it is outside the cone of influence) and on the other hand because during the last 20 kyrs millennial scale climate variability (Heinrich stadial 1) and the Pleistocene-Holocene transition (termination 1), possibly diminished the insolation forced variability in the BT2 δ18O time series. Changes in BT2 δ18O values are driven by varying contribution of moisture that originates from the Amazon Basin and is associated with monsoonal rainfall (low δ18O) during summer, and the adjacent South Atlantic ocean (high δ18O) during winter [10,36]. Therefore, changes in BT2 δ18O reflect mainly the varying contribution of monsoonal rainfall to the annual rainfall in southeastern Brazil, caused by shifts of the SACZ [8]. These shifts are possibly caused by latitudinal shifts of the termini of the Hadley Cell (i.e., the width) or by the rainfall history of the moisture that is transported from the Amazon Basin towards southeastern Brazil by the South America Low-Level Jet (SALLJ) [10]. Comparison of the BT2 δ18O time series with Mg/Ca and Sr/Ca ratios in BT2, which are indicators of the recharge of water at Botuverá [37,38], show that decreasing δ18O values co-occur with decreasing Mg/Ca and Sr/Ca ratios and vice versa (Figure 4a,b). This indicates that when the influence of monsoonal precipitation at Botuverá increased, precipitation amounts increased as well.
Because of their strong covariance and proximal location, the δ18O records from El Condor (ELC-A*, ELC-B*) and Cueva del Diamante (NAR-C*, NAR-D*, NAR-F*) are referred to as the WA δ18O time series in the following. Although the WA δ18O time series covers the last 250 kyrs [16], here we compare its last 112 kyrs with the BT2 δ18O time series.
The WA δ18O time series follows, with exception of the period from 70 kyrs BP to 20 kyrs BP, austral summer insolation, and is thereby also broadly in-phase with the BT2 δ18O time series (Figure 4a,b). This is also evident by the wavelet analysis of the WA δ18O time series (Figure 5b). Marked differences between the δ18O time series from southeast Brazil and western Amazonia occur from 70 kyrs BP to 20 kyrs BP when the two time series appear to be anti-correlated and when the precession signal is absent in the WA δ18O time series (Figure 5b). That is, when the BT2 δ18O time series decreases, indicating wetter conditions in southeast Brazil, the WA speleothem δ18O values increase, inferring drier conditions in western Amazonia. This change in the phase-relationship between BT2 and the WA speleothems is also observed between the WA δ18O time series and the austral summer insolation (Figure 4b and Figure 5b). The coherence of orbital-scale changes between southeast Brazil and western Amazonia speleothem δ18O time series from ~120 kyrs BP to 60 kyrs BP and from ~20 kyrs BP to the present indicates that SAMS rainfall variability broadly co-varies between these spatially distant regions and appears to be mainly controlled by changes in austral summertime insolation, where increasing austral insolation provokes an intensification of the SAMS [10,16]. It is proposed that increasing insolation leads to a stronger continental heating, and thereby a greater land-sea heat gradient, which in turn provokes stronger convective activity over the continent. This increased convection leads to increased convective heating and vertical updraft in the core monsoon region. This mechanism also leads to an intensification of the Nordeste Low and increased subsidence in northeast Brazil, resulting in generally arid conditions in this region (higher δ18O values) [8,16].
The period when the WA δ18O time series is out-of-phase with the austral summer insolation in the period from ~70 kyrs BP to 20 kyrs BP coincides with generally wetter conditions at Botuverá (Figure 4b) and with a weakening of the Atlantic Meridional Overturning Circulation (AMOC) (Figure 4c), when it switches to its glacial (cold) mode [40]. This implies that the oceanic meridional heat transport is reduced in this period, which should, according to energetic constraints, force a southward migration of the ITCZ [43,44]. This alters rainfall pattern associated with the SAMS, particularly in the northern portion of the core monsoon region containing the Amazon Basin and western Amazonia. Rainfall in western Amazonia, then, is primarily driven by the competition between insolation and AMOC forcing, while the Botuverá δ18O record is mainly driven by insolation. This dynamic could also affect the SALLJ which brings moisture from the Amazon Basin to southeast Brazil, and this may contribute to the generally wetter climate at Botuverá in this period.

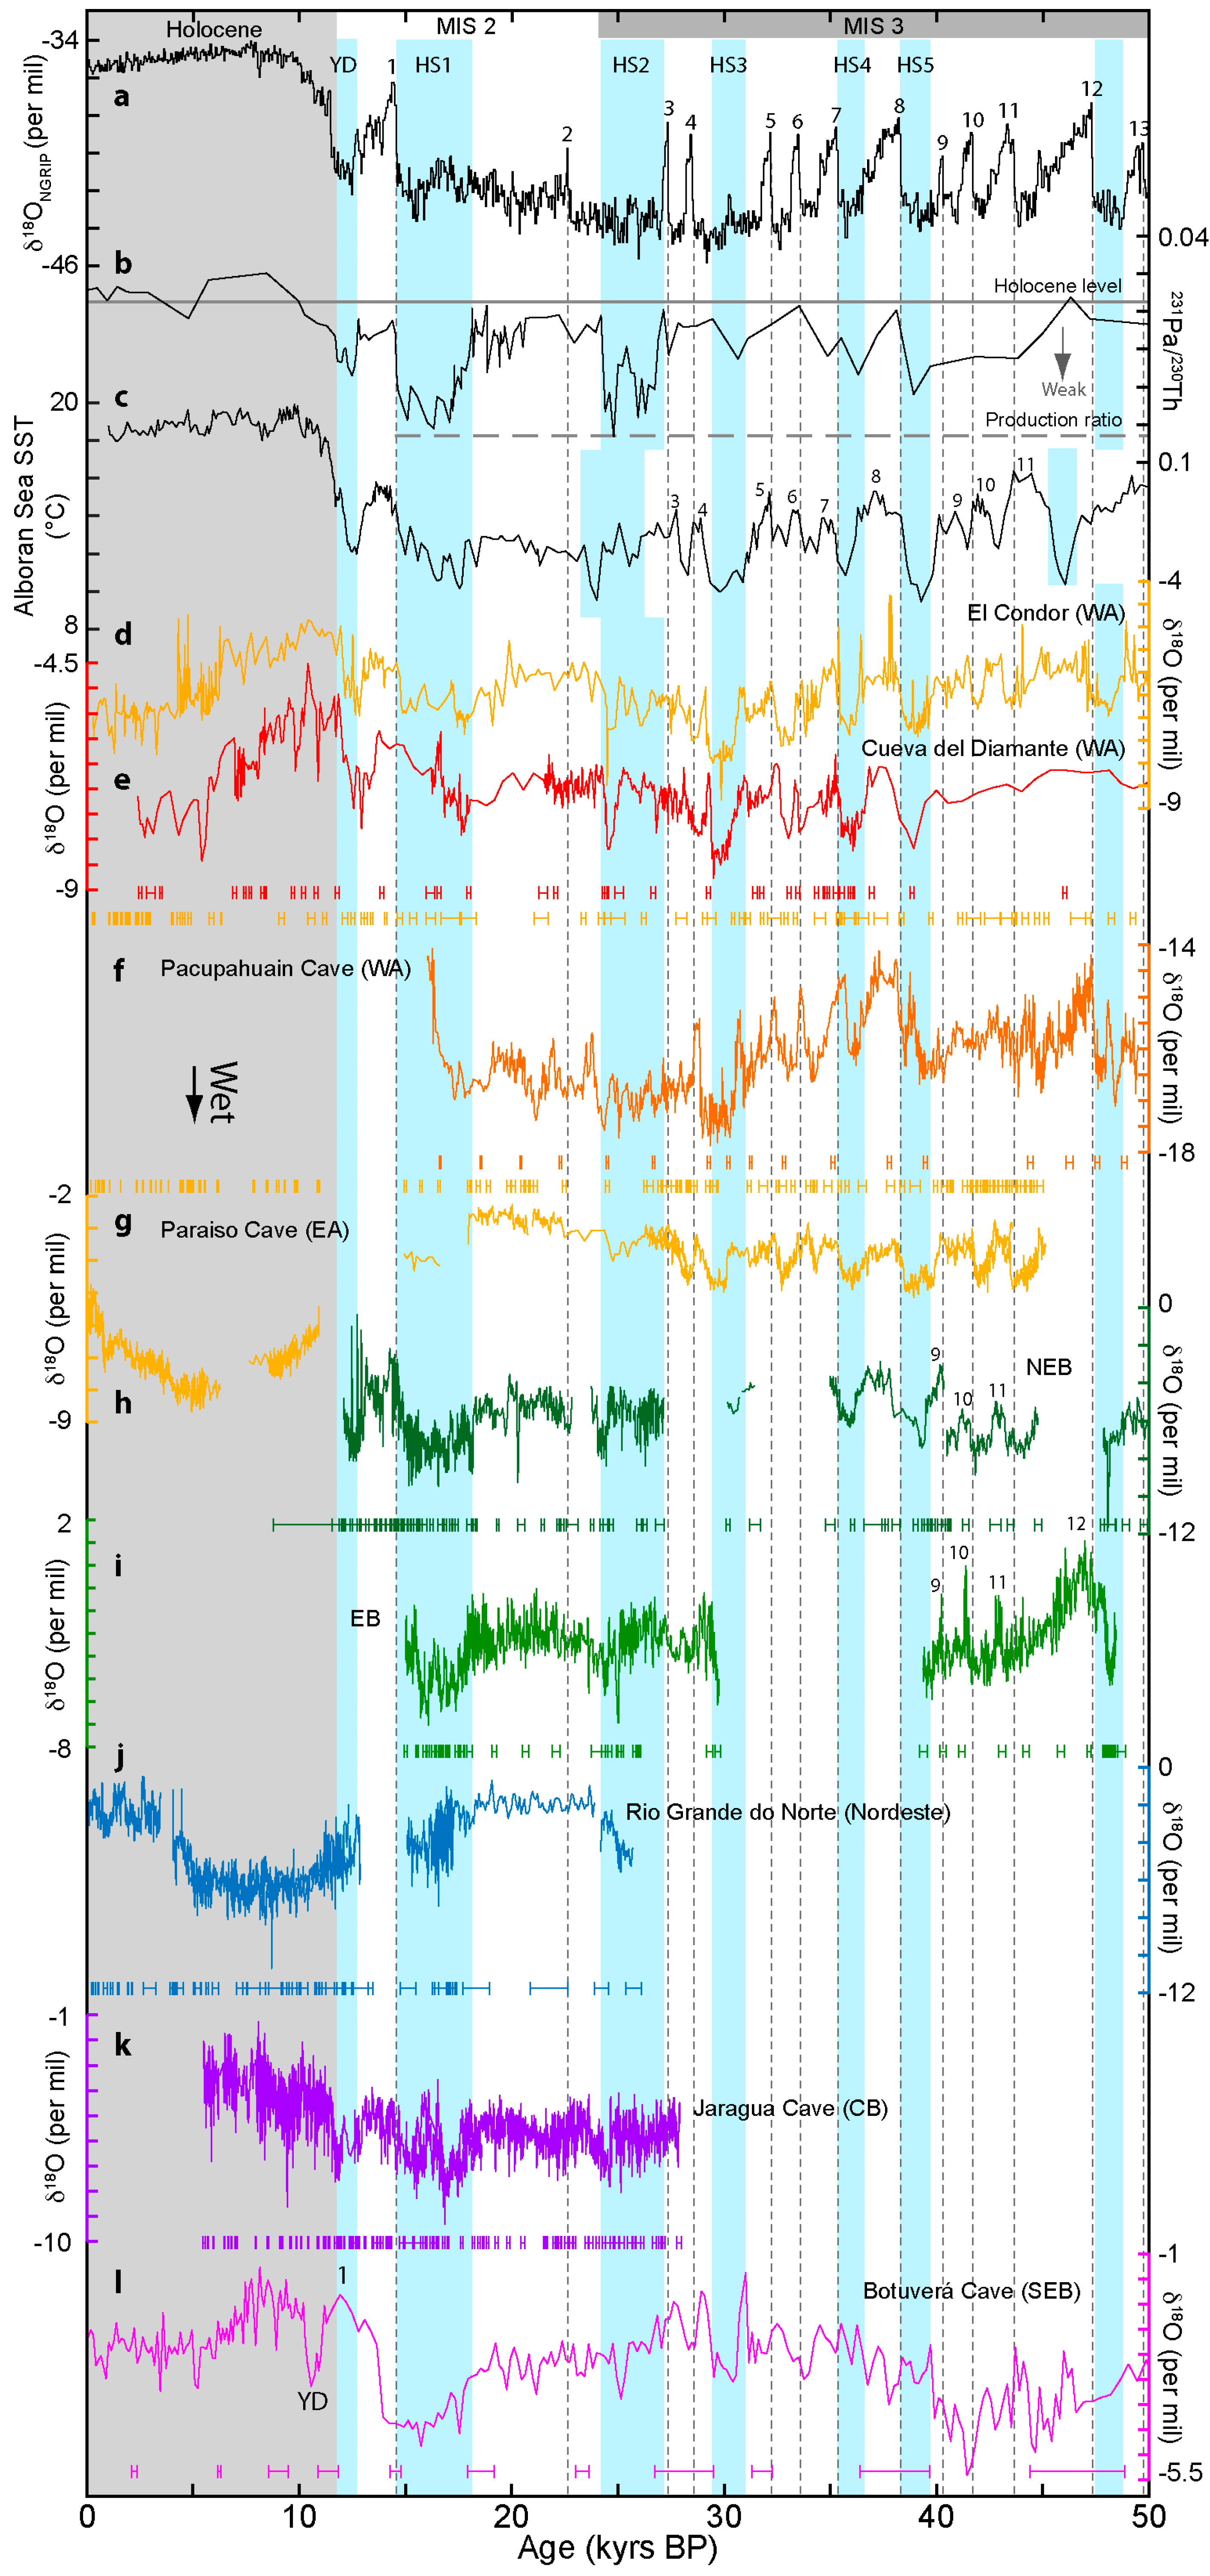
3.1.2. Millennial-Scale Climate Events

Millennial scale climate variability associated with Dansgaard-Oeschger (DO) and Heinrich stadials in the Northern Hemisphere are observed across the SAMS domain. These events in the SAMS domain are anti-correlated to precipitation variations associated with the Asian Monsoon [11]. Precipitation amounts drastically increase in Nordeste (Figure 6j) during cold events (Heinrich stadials) in the Northern Hemisphere. Semi-arid conditions prevail today in the Nordeste, preventing modern growth of speleothems in this region. However, speleothem and travertine growth periods occurred during Heinrich stadials over the last 220 kyrs due to increased rainfall amounts in this region [45]. This is further supported by changes in speleothem δ18O values across the SAMS region (Figure 6). This includes northeast Brazil (Paixão Cave, PX5*, PX7; Marota: MAG*) [24,25], eastern Brazil (Lapa Sem Fim Cave: LSF3, LSF9*, LSF11*, LSF13*, LSF15*, LSF16; Lapa Grande: LG3, LG10*, LG11, LG12B*, LG25*), and central Brazil (Jaraguá Cave: JAR7, JAR14, JAR13) [21]. Precipitation increases are also observed for eastern (Paraíso Cave: PAR01, PAR03, PAR06, PAR07, PAR08, PAR16, PAR24) [29] and western Amazonia (El Condor: ELC-A*, ELC-B*; Cueva del Diamante: NAR-C*, NAR-D*, NAR-F*, Pacupahuain Cave) [16,27] as well as southeastern Brazil (Botuverá Cave: BT2, BTV3A*, BTV4A*, BTV4C*) [10,11,12] (Figure 6). However, the Botuverá Cave δ18O record shows a much stronger orbital-scale changes than the other speleothem δ18O records from the SAMS region (Figure 6), which leads to a reduction in the amplitude of the millennial scale events there.
Comparison of the western Amazonia δ18O time series during MIS 3 (Figure 6d–f) indicates that precipitation amounts in WA were higher during Northern Hemisphere (NH) cold events compared to the following DOs. An exception from this is the precipitation response to HS2. HS2 is almost as pronounced as HS1 in the 231Pa/230Th record (Figure 6b) and should have caused a distinct precipitation response in WA. However, precipitation changes are modest at the beginning of HS2 and peak at its termination, shortly before the AMOC returns from its off-mode into its cold-mode (Figure 6d–f). What is also evident in the δ18O time series from Pacupahuain Cave is the increasing precipitation associated with the evolution of DO12. This pattern is less clearly pronounced in the two δ18O time series from El Condor Cave (Figure 6d) and absent in the record from Cueva del Diamate (Figure 6e). The latter is likely caused by the low temporal resolution of this record at the time of DO12 (Figure 6e). During MIS 3 similar responses as for the WA δ18O time series are observed for eastern Amazonia (Figure 6g), eastern Brazil (Figure 6h), and northeastern Brazil (Figure 6i). The speleothem δ18O time series from Rio Grande do Norte (Figure 6j) covers only the end of HS2 in MIS 3 but is consistent with the other stalagmite δ18O time series, indicating a trend from wetter to dryer conditions. In central Brazil precipitation changes during HS2 are coherent with the other regions influenced by the SAMS, indicating that distinct precipitation changes occurred only during the end of HS2. The speleothem δ18O time series from Botuverá Cave has a very low temporal resolution and large age uncertainties during MIS 3 (Figure 6l), which makes it difficult to identify HS and DOs in this record. However, some of Heinrich and DO stadials match quite well with this record and when considering the findings from other speleothems from this cave [11,12], inferring precipitation increases during HS, the emerging figure is that precipitation amounts at Botuverá Cave increased during HS and decreased during DOs.
In MIS 2, until the development of HS1 at about 18 kyrs BP, all speleothem δ18O time series indicate that average precipitation amounts were constant (Figure 6d–l). In this period only the δ18O time series from Pacupahuain Cave shows millennial scale events (Figure 6f). It is not possible to link these events to variations of the SAMS, because no other δ18O record from the SAMS region indicates such pronounced precipitation changes during this period, possibly because the temporal resolution of the other records is too low (Figure 6d,e). Precipitation changes during HS1 in the SAMS area are different between regions (Figure 6d–l). In western Amazonia the δ18O time series from Cueva del Diamante and Pacupahuain Cave indicate decreasing precipitation amounts (Figure 6e,f) whereas the δ18O time series from El Condor shows no precipitation changes on average (Figure 6d). The precipitation decrease at Cueva del Diamante is possibly faster than shown in Figure 6d, because there are only a few U-Th ages measured during this time. In central, eastern and northeastern Brazil (Figure 6h,i,k) precipitation amounts increased at the beginning of H1. Precipitation amounts decreased again at about 16 kyrs BP; this precipitation decrease is especially pronounced in central Brazil, whereas precipitation changes were modest in eastern and northeastern Brazil. Precipitation amounts increased in Rio Grande do Norte as well as in southeastern Brazil during HS1 (Figure 6j,l), but do not indicate similar precipitation variability as observed for central, eastern and northeastern Brazil. During the Bølling-Allerød (BA) (DO1) and the Younger Dryas (YD) (Figure 6a) precipitation changes are similar again in the different regions of the SAMS. All speleothem δ18O time series indicate that precipitation amounts were reduced during the BA and higher during the YD (Figure 6).
The coherent response in central, eastern and northeastern Brazil during HS1 is termed the Mega-SACZ [25]. The response in rainfall amount during MIS 3 across the SAMS domain suggests that the development of a Mega-SACZ is not only restricted to HS1 but is present and even more pronounced during all Heinrich stadials in MIS 3. Moreover, the speleothem and travertine growth periods from northeastern Brazil, dating back 220 kyrs, suggest the development of the Mega-SACZ before the Eemian (MIS 5e, c. 130 kyrs BP to 115 kyrs BP) [45]. Testing this hypothesis requires the generation of new high-resolution (<30 years) speleothem δ18O time series covering the last 120 kyrs from the region. Strengthening of the cross-equatorial heat transport, related to changes in sea surface temperatures (SSTs) in the tropical Atlantic, are thought to drive the development of the Mega-SACZ [25]. This is consistent with modelling experiments investigating the effect of a mid-latitude Northern Hemisphere cooling through an AMOC shutdown, which would drive changes in SSTs in the tropical Atlantic [47]. Chiang and others (2012) [47] suggest dry conditions should prevail in northeast Brazil during an AMOC shutdown, however, this is not consistent with the speleothem-based rainfall reconstructions presented discussed here (Figure 6j). It is not clear why modelling and the palaeoclimate reconstructions exhibit opposite precipitation trends in response to Heinrich stadials (NH cooling); further work is necessary to resolve this apparent discrepancy between models and observations, and highlights Nordeste as a key region for data-model comparisons. Compared to the precipitation response during Heinrich and DO stadials in MIS 3, the precipitation variability during HS1 is different in the domain of the SAMS (Figure 6). This is particulary the case in western Amazonia where precipitation amounts progressively decrease (Figure 6e,f) while precipitation amounts in the other regions increase; except eastern Amazonia, where no speleothem δ18O time series is available. Kanner et al. (2012) [27] noted an influnce of Southern Hemisphere (SH) high latitude climate variability on precipitation changes at Pacupahuain Cave during the Antarctic Isotope Maxima 8 (40 to 37 kyrs BP) and 12 (48.5 to 46 kyrs BP). A similar high-latitude influence on precipitation amounts in the northern realm of the SAMS domain could also explain the apparent differences between the WA speleothem δ18O time series and the other Brazilian δ18O time series. With the beginning of HS1 in the NH, reconstructed Antarctic temperaures increase until about 14 kyrs BP [48]. Therefore, the opposite hemispheric temperature trends, a cooling NH associated with HS1 and a warming SH, strengthened the inter-hemispheric temperature contrast, which, based on energetic constrains [1,44,47], provokes a southward shift of the ITCZ (similar to the arguments in Section 3.1.1), in turn, shifting and/or tilting SAMS precipitation pattern. This would causes a precipitation decrease in western Amazonia. In summary, the precipitation variability of the SAMS from 50 kyrs BP until the end of the YD is heavily dependent on the high-latitude NH climate variablity associated with NH cold events (Heinrich stadials) and DOs, respectively. The emerging pattern during MIS 3 is that precipitation amounts were higher during NH cold events compared to DOs. Modest precipitation changes are observed during HS2 and this is unexpected when considering the observed precipitation increase to HS in MIS 3. However, one explaination for this can be, that HS2 is not followed by a DO, while all other NH cold events in MIS 3 are followed by a DO (Figure 6a–c). This may have weakened the response of the SAMS and precipitation changes to HS.

3.2. Holocene Variations of the South American Monsoon System as Recorded by Speleothem δ18O Time Series

Many published records from the SAMS region span part of the Holocene (Table 1). However, very few of these records are currently included in the SISAL_v1 database, and even fewer of these records cover the entire extent of the Holocene. Continuous records of the entire Holocene are necessary to document climate dynamics related to the Holocene climate variability of the SAMS (Figure 7). Records included in SISAL_v1 are PAR01, PAR03, and PAR16 [29] from Paraíso Cave in eastern Amazonia, RN1 and RN4 from Rainha Cave in northeast Brazil [8], and BTV21a* [9] from Botuverá Cave in southeast Brazil. Records not yet included in SISAL_v1, include speleothem δ18O time series from western Amazonia (Sha-3* and Sha-4* from Shatuca Cave [31]; ELC-A* and ELC-B* from El Condor; NAR-C*, NAR-D*, NAR-F* from Cueva del Diamante; P00-H1* and P09-H2* from Huagapo Cave) which are similar to the Holocene Botuverá record from southeast Brazil and records from central Brazil (LG3* and LG11* from Lapa Grande Cave).
Greenland and Antarctic ice core records [49,50] suggest that the Holocene is climatically more stable than previous intervals. However, there are abrupt climate changes in the Holocene, such as the 8.2 kyr event, Bond events [51], and the 4.2 kyr event [52,53]. How these events are manifested in tropical and subtropical South America remains uncertain. Austral summertime insolation increased throughout the entire Holocene period (Figure 7) and corresponds with decreasing speleothem δ18O records from southeast Brazil and western Amazonia. However, no such correspondence is present between austral summertime insolation and both eastern Amazonia and central Brazil speleothem δ18O records. The Paraíso (eastern Amazonia) δ18O record is coupled with insolation from the early- to mid-Holocene but diverges from ~8 kyr BP to the present. The mean δ18O value of the Lapa Grande (central Brazil) record remains relatively unchanged and exhibits no trend(s) through the Holocene.

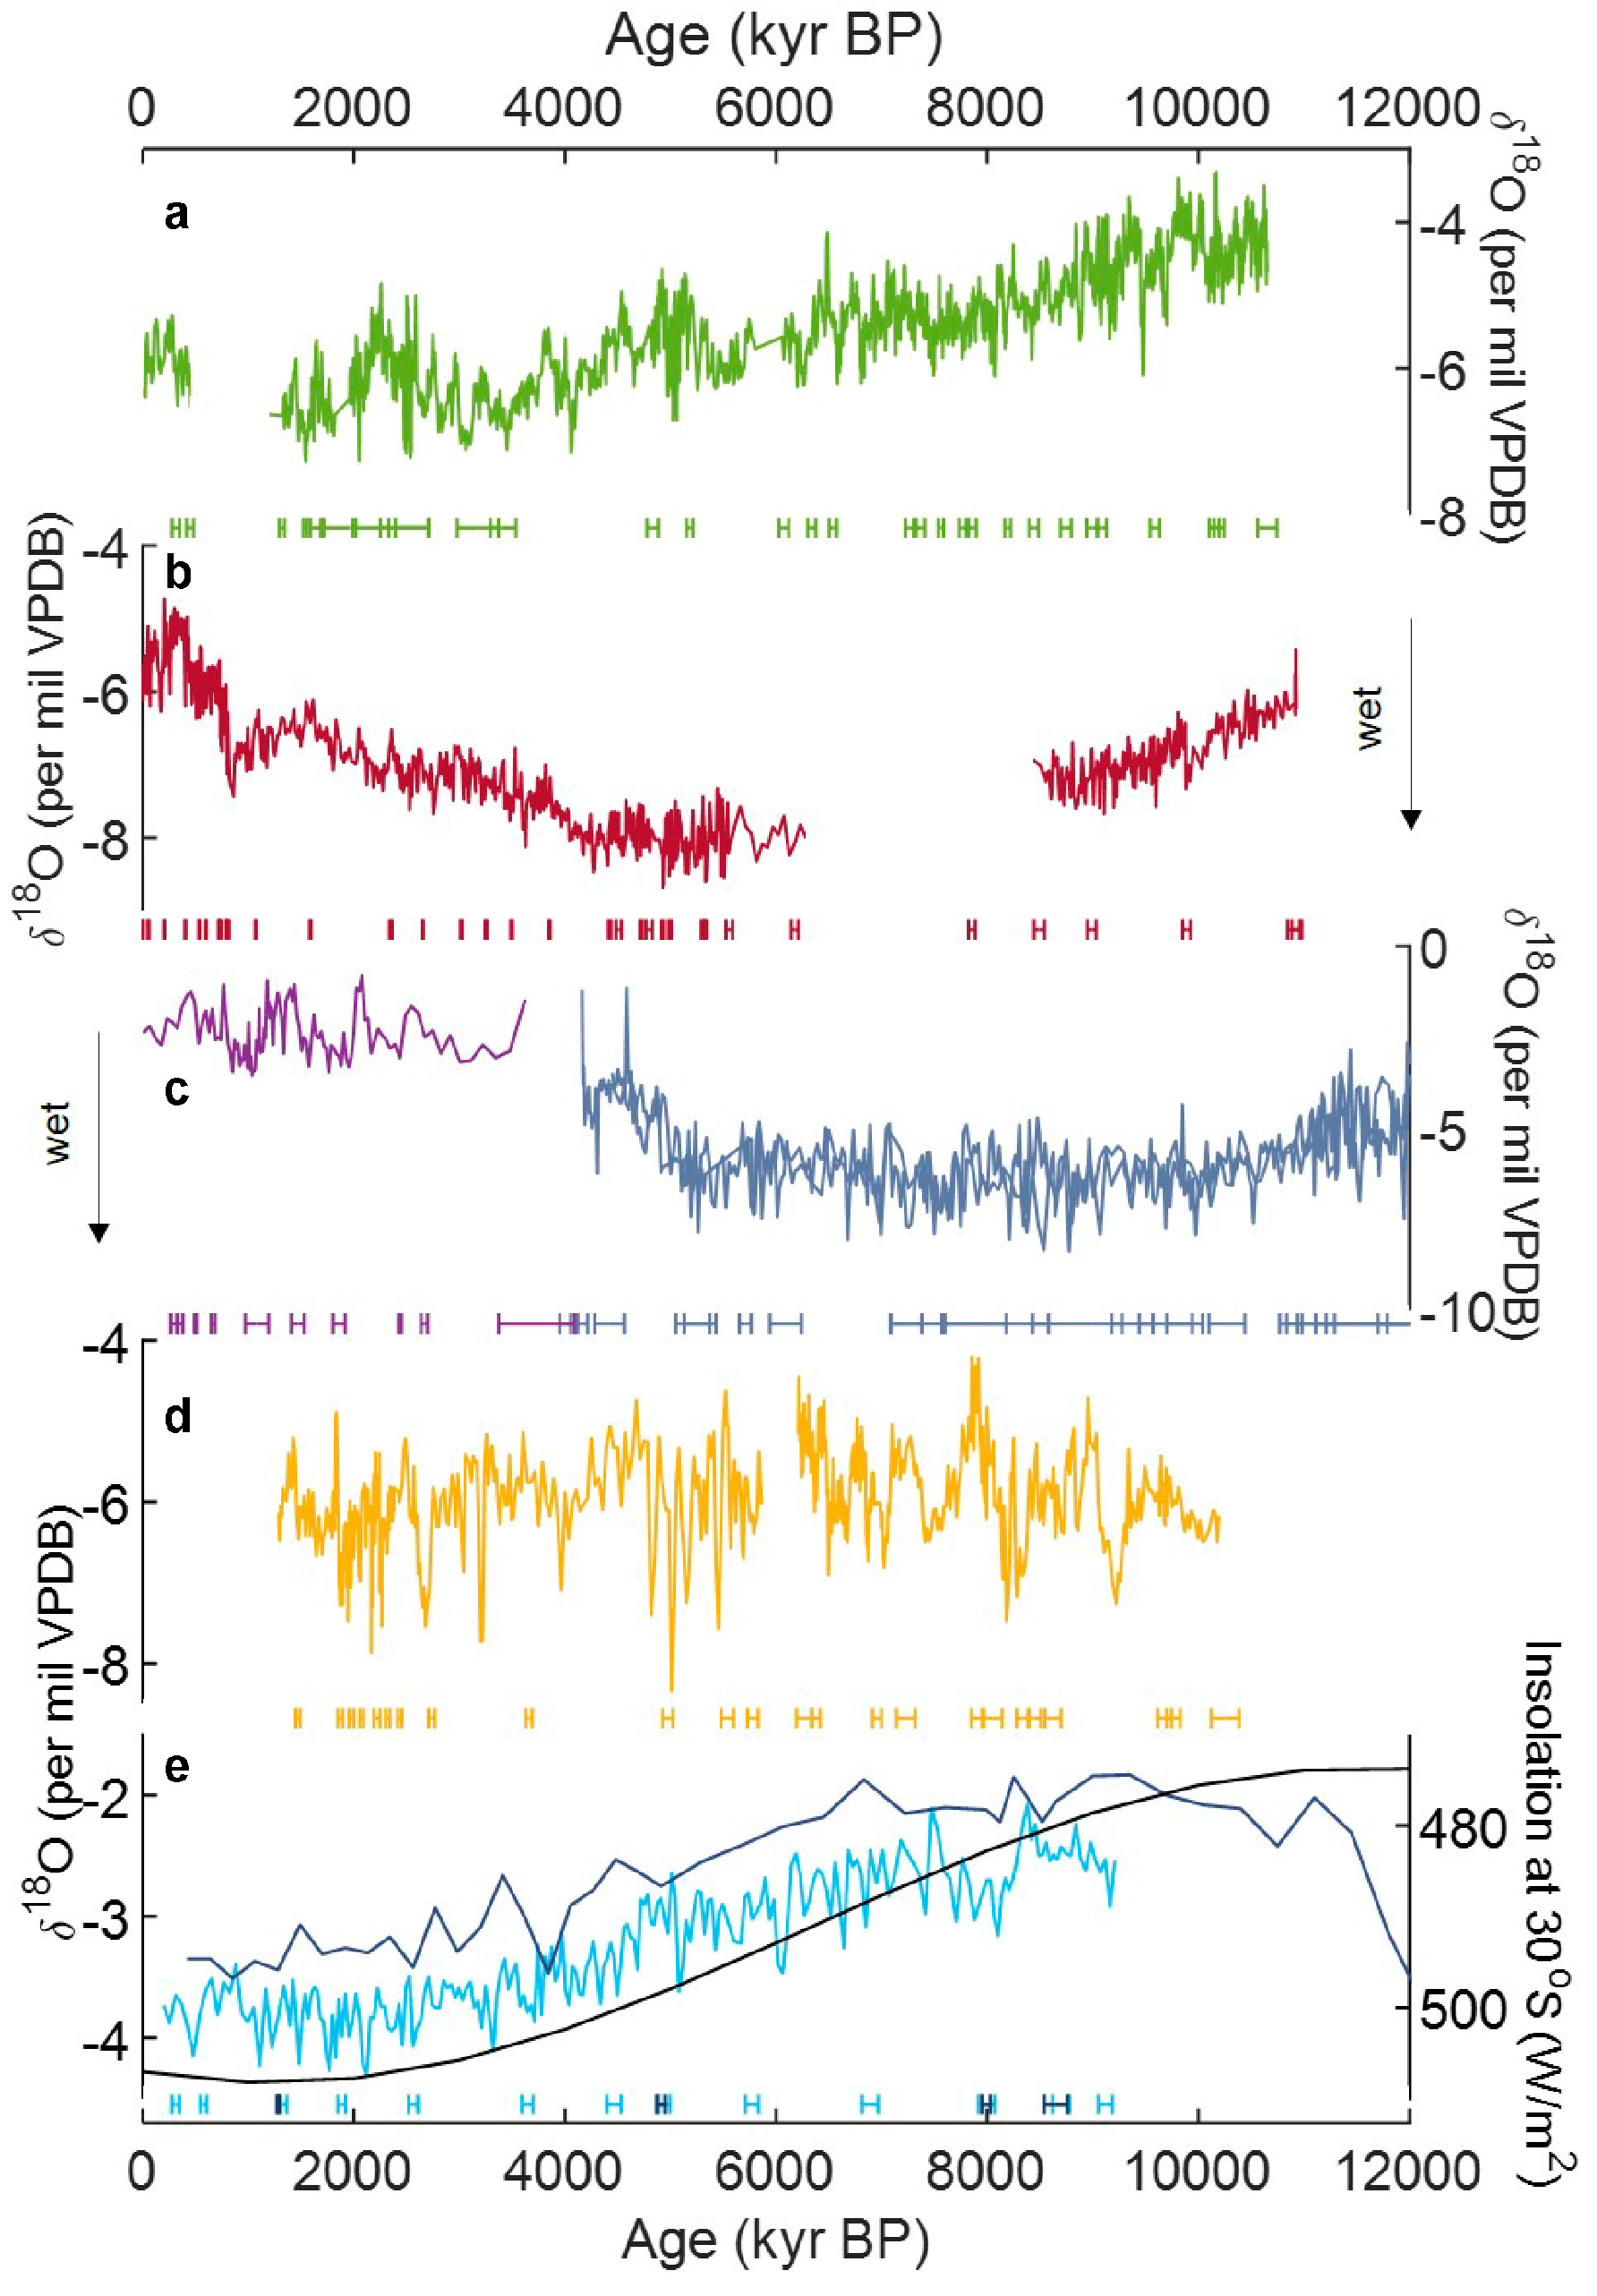
3.2.1. Insolation Driven Holocene δ18O Records

The proposed mechanism driving the Botuverá δ18O record in southeast Brazil is intensification of the SAMS, as driven by increasing austral summertime insolation, suggesting a progressive increase in precipitation amount throughout the Holocene. However, this does not necessarily suggest that increased precipitation in southeast Brazil is coupled with increasing monsoon intensity, but rather that southeast Brazil received more δ18O-depleted precipitation from increased convection upstream, within the core of convection in the monsoon region (Figure 2) [7]. That is, increased convection within the core monsoon region leads to more depleted water masses, which then lead to depleted precipitation along the entire water mass trajectory, relative to periods of weakened monsoon convection. Thus, it might be expected that any regions along the monsoon trajectory will exhibit the same long-term δ18O trend, unless mechanisms beyond monsoon intensity are driving these records [7]. Such mechanisms may be increased (or decreased) local precipitation (i.e., the amount effect) or changes in relative contributions of water-mass sources (e.g., [8]). However, a speleothem Sr/Ca time series from Botuverá Cave, a proxy for the local effective rainfall [38], shows that rainfall amounts increased in this region with increasing influence of SAMS rainfall during the course of the Holocene [9]. This highlights the pertinence of complementing speleothem measurements, such as trace elements, which may provide further information on processes driving speleothem δ18O variability, past monsoon variability, and variability in local moisture conditions. Speleothem δ18O records from the western Amazonia exhibit long-term trends that follow both the Botuverá Cave δ18O record and austral summertime insolation (Figure 7), suggesting that these sites along the monsoon water-mass trajectory (Figure 2) are influenced by increased monsoon convection and/or increases in local precipitation amount as driven by increased water availability due to increased monsoon strength.

3.2.2. Dipole of Holocene δ18O Values

The South American rainfall dipole, inferred by speleothem δ18O records from eastern and western South America, is well-documented [8] and is persistent during the Holocene as evidenced by δ18O records (Figure 7). The proposed rainfall dipole between Nordeste and the other regions influenced by the SAMS is distinct in the period from the mid- to the late Holocene (Figure 7) but is not readily apparent in the early-Holocene (~12 to 8 kyr BP) as evidenced by the δ18O time series, where the Nordeste record exhibits a distinct decreasing trend, in-phase with other records across the SAMS region (Figure 7c). Notably, the RN records are in-phase with the Paraiso δ18O records (eastern Amazonia) from ~12 kyr BP to the end of the RN records at 4 kyr BP (Figure 7). However, the RN long-term trend is notably steeper than the Paraiso long-term trend from ~8 kyr BP to 4 kyr BP. This correspondence suggests a similar mechanism(s) driving precipitation δ18O values over both Nordeste and eastern Amazonia during the Holocene, although these two regions fall in different climate regimes in the present day.

3.2.3. Holocene Variations of the South Atlantic Convergence Zone

The constant mean δ18O values at Lapa Grande Cave, central Brazil, is unique among the speleothem δ18O time series available in SISAL_v1 (Figure 7). One possible driver of the variability in the Lapa Grande δ18O time series are changes in regional rainfall amounts associated with latitudinal fluctuations of the SACZ (Figure 2). Latitudinal fluctuations and shifts of the SACZ affect rainfall amounts in boundary regions, while precipitation amounts in the centre of the SACZ are inferred to be constant [22]. Thus, Lapa Grande’s position in the centre of the SACZ, and steady mean δ18O values of Lapa Grande speleothems during the Holocene, imply little changes in precipitation amount at this site and suggest it was under the influence of the SACZ during the entire Holocene. This would suggest that speleothem δ18O time series from Lapa Grande Cave are not dominantly influenced by upstream rainout in the core monsoon region, but rather local rainfall amount associated with the strength of the SACZ. If so, this suggests the SACZ has not increased or decreased in intensity during the Holocene, despite increasing insolation and increasing intensity in the core of monsoon convection in the Amazon Basin. Stríkis et al. (2011) [23] identify depleted δ18O episodes in the Lapa Grande record that coincide with the cold Bond events in the Northern Hemisphere. They suggest the low δ18O values were the result of a southward movement of the ITCZ, following the same mechanism that occurred during Heinrichs stadials, but with smaller amplitude. Notably, abrupt climate events that occurred at 2.7 kyrs and 8.1 kyrs are also documented in speleothems in Northeast Brazil [19,54].

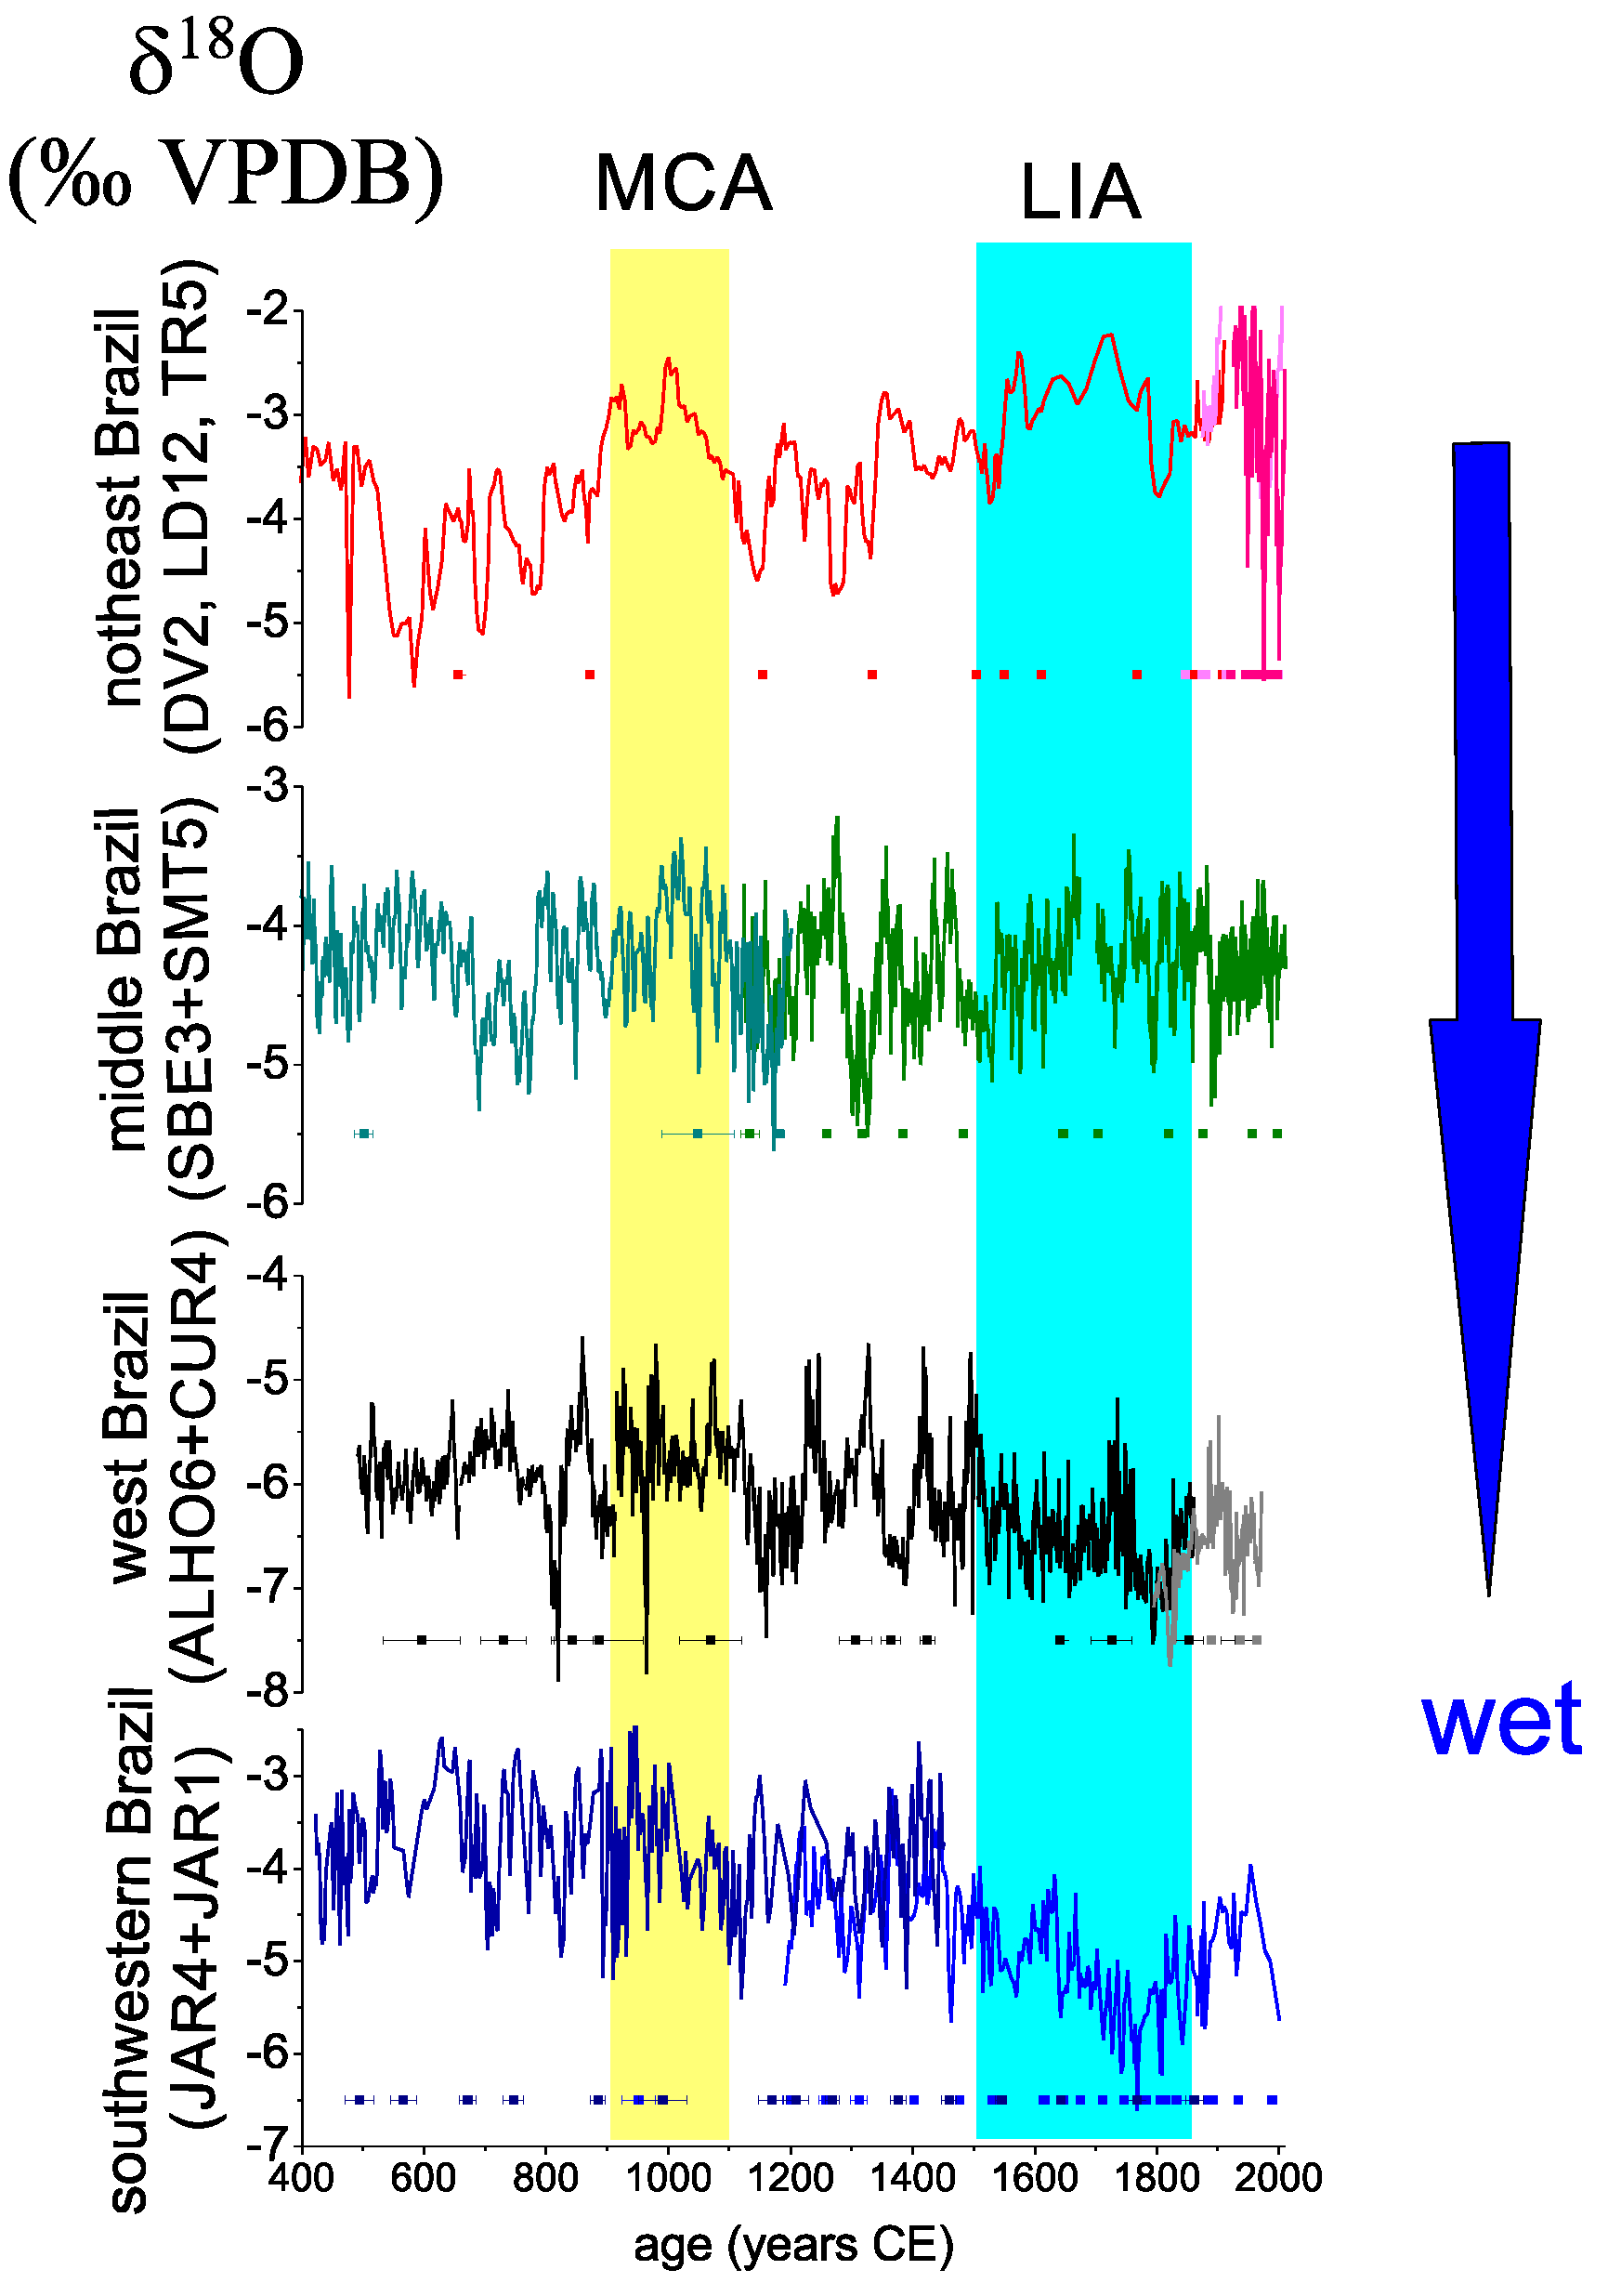
3.3. Variations of the South American Monsoon System during the Last 2 kyrs as Recorded by Speleothem δ18O Time Series

There are 10 stalagmite records from 6 different regions covering the last two millennia in the SISAL_v1 database. Most of the records only have δ18O data, their resolution is approximately annual, and, with exception of the ALHO6 stalagmite that is annually laminated, all speleothems’ age models are based on U/Th ages. The records included are DV2 (Diva Cave), TR5 (Torrinha Cave), LD12 (Lapa Doce Cave) from northeast Brazil [19]; CR1* (Cristal Cave) from southeast Brazil [7]; SBE3 (São Bernardo Cave), SMT5 (São Matheus Cave), TM0 (Tamboril Cave) from central Brazil [22,32]; ALHO6 (Pau d’Alho Cave), CUR4 (Curupira Cave) from middle-western Brazil [18,22]; PAR1 (Paraiso Cave) from eastern Amazonia [29]; CAS-A (Cascayunga), CAS-D (Cascayunga), PAL3 (Palestina Cave), PAL4 (Palestina Cave) from the Peruvian Andes [13,28,31] and Boto1 (Chiflonkhakh Cave), Boto3 (Chiflonkhakh Cave), Boto7, (Chiflonkhakh Cave), Boto 10 (Umajalanta Cave) from the Bolivian Andes [14].
The main climate features over the last two millennia in South America were forced by NH warm and cold periods during the Medieval Climate Anomaly (MCA) and the Little Ice Age (LIA), respectively [7,55]. Warm conditions in the NH force a northward positioning of the ITCZ that weakened the convective activity of the SAMS. This weakening was exhibited as an increase in speleothem δ18O values during the MCA in the records: Diva Cave from Northeast Brazil [19], Pau d’Alho and Jaraguá caves from mid-western Brazil [18,22], Palestina [28] and Cascayunga caves [13] from the Peruvian Andes. However, speleothem records from Tamboril [32] and São Bernardo [22] caves located in central Brazil, and Cristal Cave [7] from southeast Brazil do not show a significant anomaly during the MCA. Conversely, the speleothem records from the Umajalanta–Chiflonkhakha Cave system in the eastern Bolivian Andes [14] suggest increased convective activity during the MCA period, with decreasing speleothem δ18O values, which was interpreted as a result of a different mechanism (not ITCZ/SAMS system), implying that moisture was sourced mainly from the southern tropical Atlantic [14].
The ITCZ likely shifted southward during the LIA, leading to wetter conditions, as evidenced by several speleothem records in South America [22], such as Pau d’Alho [18], Jaraguá [22], Palestina [28], Cascayunga [13], and Cristal [7] caves. However, the SACZ is thought to have also shifted southward during this period, driving an antiphase of convection between the southwest and northeast portions of the SAMS domain [22]. Thus, while records from the southwest region of the SAMS domain indicate wet conditions [7,13,14,18,22,28], speleothem records from the northeast region of the SAMS, represented mainly by the speleothems from Diva Cave [19], suggest dry conditions. Further, records located near to the node of this dipole in central Brazil (São Matheus and Tamboril caves) probably experienced a continuous influence of the SACZ, indicated by the stable mean δ18O values during the LIA period, as well over the entire last millennium (Figure 8) [22]. During the CWA, the convective conditions over South America appear to be similar to the MCA, with warming in the NH leading to a northward positioning of ITCZ and a progressive weakening of the SAMS.
A centennial periodicity of the SAMS (around 210 years) was reported from different sites [18,19,28] and is associated with the de Vriess–Suess solar cycle, exhibiting depleted δ18O during periods of high solar irradiance. It is proposed that this relationship is due to several feedbacks involving amplification of solar forcing by coupled air-sea dynamics, cloud formation and stratospheric warming due to enhanced UV absorption through increased stratospheric ozone concentration. A resulting adjustment in the Hadley cell modulates then the position of the ITCZ and SACZ, respectively [18]. Multidecadal variability (60–90 years) associated with the Atlantic Multidecadal Oscillation (AMO) also affects the SAMS, with a more southerly position of the ITCZ during its negative phase (warm in southern tropical Atlantic) [18,19,28]. Although the El Niño–Southern Oscillation (ENSO) climate mode may be a predominant forcing of the present SAMS, there is no evidence of the influence of this mode during the past two millennia. The argument against an ENSO influence during the last two millennia is related to the often synchronous climate conditions observed between the Peruvian Andes and southeast Brazil during this period, even though the canonical ENSO impact in these two regions is the exact opposite [7,22].

4. Conclusions and Outlook

4.1. Summary on South American Monsoon System Variability

Speleothem δ18O records from South America are interpreted mainly as proxies of amount effect and convective activity of the monsoon and are mostly used to infer past variations of the ITCZ, the SAMS and the SACZ. Precession driven insolation is the main driver of convective variability over the continent during the last 250 kyrs, including the Holocene. A climate dipole is observed between the west and east portions of the continent, which is most prominent on orbital time scales, and apparent during the Holocene. Records located in the central region of Brazil appear to be weakly affected by insolation and are more susceptible to variations of either the positioning or intensity of the SACZ. Cold episodic events in the Northern Hemisphere force a southward displacement of the ITCZ, which in turn increases convective activity of the SAMS domain on all times scales, as documented during Heinrich events during the last glacial period, Bond events during the Holocene, and during the LIA. Variations in Northern Hemisphere temperatures were the main forcing of changes in SAMS during the last two millennia, which resulted in predominantly dry conditions during the MCA and wet conditions during the LIA, followed by progressively more arid conditions during the CWP.

4.2. Outlook and Potentials for Future Speleothem-Based Empirical Research

Speleothem records from South America are located predominantly in the tropical and subtropical region of the Southern Hemisphere. No South American speleothem records are available from north of the equator and only one record from south of the subtropics (Figure 1 and Figure 2). New speleothem records from outside the SAMS domain, and the generation of longer records from the whole of South America, are required to improve our understanding of South American hydroclimate. Most existing records consist of composite records shorter than 50 kyrs, and only few time series are longer than 100 kyrs (Figure 3). Other types of measurements on speleothems, such as trace element concentrations or elemental isotope ratios (e.g., 87Sr/86Sr), could be used to explore the relationship between local precipitation and regional monsoon strength [9,32]. Speleothem δ13C records could also be exploited for reconstruction of the palaeovegetation or soil dynamics [56,57].

4.3. Next Steps and Potentials for SISAL-Based Research

Speleothem isotope time-series not included in the SISAL_v1 database (Table 1) would improve the spatio-temporal coverage for the SAMS domain (Figure 1) and allow detailed characterization of past variations of the SAMS. Such analysis should not only be focused on speleothem δ18O time series but also on the available δ13C time series. This is of particular interest, because δ13C yields insights in the response of the vegetation to variations of the SAMS. Better understanding of vegetation feedbacks are important for a better understanding of the contribution of moisture recycling in δ18O variability [29] and also for predicting the response of the tropical rain forest (an important carbon sink and source) to precipitation changes in the Amazon Basin in response to global warming.
Speleothem δ18O time series in the SISAL database are very appropriate for data-model comparisons. This does not necessarily include only isotope enabled climate models, because trends in speleothem δ18O time series—and patterns—also yield information on whether specific regions became wetter or drier in the past, which is in many cases already sufficient to test the response of a climate model. The Heinrich stadials or the transition from the early to the late Holocene could be an ideal opportunity for data-model comparisons, since there are many speleothem δ18O records available. A strategic region for such tests is northeast Brazil (Nordeste), which is at present dominated by semi-arid conditions, but was much wetter during Heinrich stadials or in the mid-Holocene [8,45]. Since variations of precipitation in northeast Brazil are linked to the low-level circulation of the SAMS, which appears to be linked to the tropical atmospheric circulation in Africa [8], accurate modelling of the precipitation in Nordeste is a crucial benchmark test for the tropical atmospheric circulation in climate models.
A deeper understanding of past spatio-temporal changes of the SAMS could be gained using Monte Carlo Principal Component Analyses (MC-PCA) techniques [58]. This would help to constrain the different forcing and coherence of precipitation changes in the core monsoon region and regions that are mainly influenced by shifts of the SACZ and to understand the drivers of speleothem δ18O variations, in particular the role of local effects and downstream processes associated with precipitation history and moisture recycling [7,16,29]. In summary, the SISAL database makes it possible to conduct a variety of different analysis of the SAMS, which will ultimately yield a better understanding of its past changes.

Author Contributions

M.D., B.M.W., and V.F.N. contributed equally to this manuscript with support from F.W.C. M.D. led the writing of the Pleistocene section, B.M.W. of the Holocene section and V.F.N. of the 2k section with support of all authors.

Funding

M.D. acknowledges funding by the German Research Foundation (DFG) grant DE 2398/3-1. This work was supported by the São Paulo Research Foudation (FAPESP grants 2016/15807-5 and 2018/12285-3 to V.F.N.; 2013/50297-0 and 2017/50085-3 to F.W.C.).

Acknowledgments

SISAL is a working group of the Past Global Changes (PAGES) programme and we thank PAGES for their support of this activity. We thank the scientific editors Sandy P. Harrison and Laia Comas-Bru as well as three anonymous reviewers for comments, which helped to improve the manuscript and for editorial handling of the manuscript. We thank the World Karst Aquifer Mapping project (WOKAM) team for providing us with the karst region map presented in Figure 1.

Conflicts of Interest

The authors declare no conflict of interest.

References

  1. Schneider, T.; Bischoff, T.; Haug, G.H. Migrations and dynamics of the intertropical convergence zone. Nature 2014, 513, 45–53. [Google Scholar] [CrossRef] [PubMed]
  2. Vera, C.; Higgins, W.; Amador, J.; Ambrizzi, T.; Garreaud, R.; Gochis, D.; Gutzler, D.; Lettenmaier, D.; Marengo, J.; Mechoso, C.R.; et al. Toward a Unified View of the American Monsoon Systems. J. Clim. 2006, 19, 4977–5000. [Google Scholar] [CrossRef]
  3. Atsawawaranunt, K.; Comas-Bru, L.; Amirnezhad Mozhdehi, S.; Deininger, M.; Harrison, S.P.; Baker, A.; Boyd, M.; Kaushal, N.; Ahmad, S.M.; Ait Brahim, Y.; et al. The SISAL database: A global resource to document oxygen and carbon isotope records from speleothems. Earth Syst. Sci. Data 2018, 10, 1687–1713. [Google Scholar] [CrossRef]
  4. Atsawawaranunt, K.; Harrison, S.; Comas Bru, L. SISAL (Speleothem Isotopes Synthesis and AnaLysis Working Group) Database Version 1.0. 2018. Available online: http://researchdata.reading.ac.uk/139/ (accessed on 4 October 2018).
  5. Comas-Bru, L.; Harrison, S. SISAL: Bringing Added Value to Speleothem Research. Quaternary 2019. accepted for publication. [Google Scholar] [CrossRef]
  6. Chen, Z.; Auler, A.S.; Bakalowicz, M.; Drew, D.; Griger, F.; Hartmann, J.; Jiang, G.; Moosdorf, N.; Richts, A.; Stevanovic, Z.; et al. The World Karst Aquifer Mapping project: Concept, mapping procedure and map of Europe. Hydrogeol. J. 2017, 25, 771–785. [Google Scholar] [CrossRef]
  7. Vuille, M.; Burns, S.J.; Taylor, B.L.; Cruz, F.W.; Bird, B.W.; Abbott, M.B.; Kanner, L.C.; Cheng, H.; Novello, V.F. A review of the South American monsoon history as recorded in stable isotopic proxies over the past two millennia. Clim. Past 2012, 8, 1309–1321. [Google Scholar] [CrossRef]
  8. Cruz, F.W.; Vuille, M.; Burns, S.J.; Wang, X.; Cheng, H.; Werner, M.; Lawrence Edwards, R.; Karmann, I.; Auler, A.S.; Nguyen, H. Orbitally driven east–west antiphasing of South American precipitation. Nat. Geosci. 2009, 2, 210–214. [Google Scholar] [CrossRef]
  9. Bernal, J.P.; Cruz, F.W.; Stríkis, N.M.; Wang, X.; Deininger, M.; Catunda, M.C.A.; Ortega-Obregón, C.; Cheng, H.; Edwards, R.L.; Auler, A.S. High-resolution Holocene South American monsoon history recorded by a speleothem from Botuverá Cave, Brazil. Earth Planet. Sci. Lett. 2016, 450, 186–196. [Google Scholar] [CrossRef]
  10. Cruz, F.W.; Burns, S.J.; Karmann, I.; Sharp, W.D.; Vuille, M.; Cardoso, A.O.; Ferrari, J.A.; Dias, P.L.S.; Viana, O. Insolation-driven changes in atmospheric circulation over the past 116,000 years in subtropical Brazil. Nature 2005, 434, 63–66. [Google Scholar] [CrossRef] [PubMed]
  11. Wang, X.; Auler, A.S.; Edwards, R.L.; Cheng, H.; Ito, E.; Solheid, M. Interhemispheric anti-phasing of rainfall during the last glacial period. Quat. Sci. Rev. 2006, 25, 3391–3403. [Google Scholar] [CrossRef]
  12. Wang, X.; Auler, A.S.; Edwards, R.L.; Cheng, H.; Ito, E.; Wang, Y.; Kong, X.; Solheid, M. Millennial-scale precipitation changes in southern Brazil over the past 90,000 years. Geophys. Res. Lett. 2007, 34. [Google Scholar] [CrossRef]
  13. Reuter, J.; Stott, L.; Khider, D.; Sinha, A.; Cheng, H.; Edwards, R.L. A new perspective on the hydroclimate variability in northern South America during the Little Ice Age. Geophys. Res. Lett. 2009, 36. [Google Scholar] [CrossRef]
  14. Apaéstegui, J.; Cruz, F.W.; Vuille, M.; Fohlmeister, J.; Espinoza, J.C.; Sifeddine, A.; Strikis, N.; Guyot, J.L.; Ventura, R.; Cheng, H.; et al. Precipitation changes over the eastern Bolivian Andes inferred from speleothem (δ18O) records for the last 1400 years. Earth Planet. Sci. Lett. 2018, 494, 124–134. [Google Scholar] [CrossRef]
  15. Lachniet, M.S.; Burns, S.J.; Piperno, D.R.; Asmerom, Y.; Polyak, V.J.; Moy, C.M.; Christenson, K. A 1500-year El Niño/Southern Oscillation and rainfall history for the Isthmus of Panama from speleothem calcite. J. Geophys. Res. Atmos. 2004, 109. [Google Scholar] [CrossRef]
  16. Cheng, H.; Sinha, A.; Cruz, F.W.; Wang, X.; Edwards, R.L.; d’Horta, F.M.; Ribas, C.C.; Vuille, M.; Stott, L.D.; Auler, A.S. Climate change patterns in Amazonia and biodiversity. Nat. Commun. 2013, 4, 1411. [Google Scholar] [CrossRef] [PubMed]
  17. Van Breukelen, M.R.; Vonhof, H.B.; Hellstrom, J.C.; Wester, W.C.G.; Kroon, D. Fossil dripwater in stalagmites reveals Holocene temperature and rainfall variation in Amazonia. Earth Planet. Sci. Lett. 2008, 275, 54–60. [Google Scholar] [CrossRef]
  18. Novello, V.F.; Vuille, M.; Cruz, F.W.; Stríkis, N.M.; de Paula, M.S.; Edwards, R.L.; Cheng, H.; Karmann, I.; Jaqueto, P.F.; Trindade, R.I.F.; et al. Centennial-scale solar forcing of the South American Monsoon System recorded in stalagmites. Sci. Rep. 2016, 6, 24762. [Google Scholar] [CrossRef] [PubMed]
  19. Novello, V.F.; Cruz, F.W.; Karmann, I.; Burns, S.J.; Stríkis, N.M.; Vuille, M.; Cheng, H.; Lawrence Edwards, R.; Santos, R.V.; Frigo, E.; et al. Multidecadal climate variability in Brazil’s Nordeste during the last 3000 years based on speleothem isotope records. Geophys. Res. Lett. 2012, 39. [Google Scholar] [CrossRef]
  20. Kanner, L.C.; Burns, S.J.; Cheng, H.; Edwards, R.L.; Vuille, M. High-resolution variability of the South American summer monsoon over the last seven millennia: Insights from a speleothem record from the central Peruvian Andes. Quat. Sci. Rev. 2013, 75, 1–10. [Google Scholar] [CrossRef]
  21. Novello, V.F.; Cruz, F.W.; Vuille, M.; Stríkis, N.M.; Edwards, R.L.; Cheng, H.; Emerick, S.; de Paula, M.S.; Li, X.; Barreto, E.d.S.; et al. A high-resolution history of the South American Monsoon from Last Glacial Maximum to the Holocene. Sci. Rep. 2017, 7, 44267. [Google Scholar] [CrossRef] [PubMed]
  22. Novello, V.F.; Cruz, F.W.; Moquet, J.S.; Vuille, M.; Paula, M.S.; Nunes, D.; Edwards, R.L.; Cheng, H.; Karmann, I.; Utida, G.; et al. Two Millennia of South Atlantic Convergence Zone Variability Reconstructed From Isotopic Proxies. Geophys. Res. Lett. 2018, 45, 5045–5051. [Google Scholar] [CrossRef]
  23. Stríkis, N.M.; Cruz, F.W.; Cheng, H.; Karmann, I.; Edwards, R.L.; Vuille, M.; Wang, X.; de Paula, M.S.; Novello, V.F.; Auler, A.S. Abrupt variations in South American monsoon rainfall during the Holocene based on a speleothem record from central-eastern Brazil. Geology 2011, 39, 1075–1078. [Google Scholar] [CrossRef]
  24. Stríkis, N.M.; Cruz, F.W.; Barreto, E.A.S.; Naughton, F.; Vuille, M.; Cheng, H.; Voelker, A.H.L.; Zhang, H.; Karmann, I.; Edwards, R.L.; et al. South American monsoon response to iceberg discharge in the North Atlantic. Proc. Natl. Acad. Sci. USA 2018, 115, 3788–3793. [Google Scholar] [CrossRef] [PubMed]
  25. Stríkis, N.M.; Chiessi, C.M.; Cruz, F.W.; Vuille, M.; Cheng, H.; Souza Barreto, E.A.; Mollenhauer, G.; Kasten, S.; Karmann, I.; Edwards, R.L. Timing and structure of Mega-SACZ events during Heinrich Stadial 1. Geophys. Res. Lett. 2015, 42, 5477–5484. [Google Scholar] [CrossRef]
  26. Schimpf, D.; Kilian, R.; Kronz, A.; Simon, K.; Spotl, C.; Worner, G.; Deininger, M.; Mangini, A. The significance of chemical, isotopic, and detrital components in three coeval stalagmites from the superhumid southernmost Andes (53 degrees S) as high-resolution palaeo-climate proxies. Quat. Sci. Rev. 2011, 30, 443–459. [Google Scholar] [CrossRef]
  27. Kanner, L.C.; Burns, S.J.; Cheng, H.; Edwards, R.L. High-Latitude Forcing of the South American Summer Monsoon During the Last Glacial. Science 2012, 335, 570–573. [Google Scholar] [CrossRef] [PubMed]
  28. Apaéstegui, J.; Cruz, F.W.; Sifeddine, A.; Vuille, M.; Espinoza, J.C.; Guyot, J.L.; Khodri, M.; Strikis, N.; Santos, R.V.; Cheng, H.; et al. Hydroclimate variability of the northwestern Amazon Basin near the Andean foothills of Peru related to the South American Monsoon System during the last 1600 years. Clim. Past 2014, 10, 1967–1981. [Google Scholar] [CrossRef]
  29. Wang, X.; Edwards, R.L.; Auler, A.S.; Cheng, H.; Kong, X.; Wang, Y.; Cruz, F.W.; Dorale, J.A.; Chiang, H.-W. Hydroclimate changes across the Amazon lowlands over the past 45,000 years. Nature 2017, 541, 204. [Google Scholar] [CrossRef] [PubMed]
  30. Cruz, F.W.; Burns, S.J.; Karmann, I.; Sharp, W.D.; Vuille, M. Reconstruction of regional atmospheric circulation features during the late Pleistocene in subtropical Brazil from oxygen isotope composition of speleothems. Earth Planet. Sci. Lett. 2006, 248, 495–507. [Google Scholar] [CrossRef]
  31. Bustamante, M.G.; Cruz, F.W.; Vuille, M.; Apaéstegui, J.; Strikis, N.; Panizo, G.; Novello, F.V.; Deininger, M.; Sifeddine, A.; Cheng, H.; et al. Holocene changes in monsoon precipitation in the Andes of NE Peru based on δ18O speleothem records. Quat. Sci. Rev. 2016, 146, 274–287. [Google Scholar] [CrossRef]
  32. Wortham, B.E.; Wong, C.I.; Silva, L.C.R.; McGee, D.; Montañez, I.P.; Troy Rasbury, E.; Cooper, K.M.; Sharp, W.D.; Glessner, J.J.G.; Santos, R.V. Assessing response of local moisture conditions in central Brazil to variability in regional monsoon intensity using speleothem 87Sr/86Sr values. Earth Planet. Sci. Lett. 2017, 463, 310–322. [Google Scholar] [CrossRef]
  33. Berbery, E.H.; Barros, V.R. The Hydrologic Cycle of the La Plata Basin in South America. J. Hydrometeorol. 2002, 3, 630–645. [Google Scholar] [CrossRef]
  34. Dee, D.P.; Uppala, S.M.; Simmons, A.J.; Berrisford, P.; Poli, P.; Kobayashi, S.; Andrae, U.; Balmaseda, M.A.; Balsamo, G.; Bauer, P.; et al. The ERA-Interim reanalysis: Configuration and performance of the data assimilation system. Q. J. R. Meteorol. Soc. 2011, 137, 553–597. [Google Scholar] [CrossRef]
  35. Schneider, U.; Becker, A.; Finger, P.; Anja, M.-C.; Rudolf, B.; Ziese, M. GPCC Full Data Reanalysis Version 6.0 at 1.0°: Monthly Land-Surface Precipitation from Rain-Gauges Built on GTS-Based and Historic Data; Global Precipitation Climatology Centre: Berlin, Germany, 2011. [Google Scholar] [CrossRef]
  36. Cruz, F.W.; Karmann, I.; Viana, O.; Burns, S.J.; Ferrari, J.A.; Vuille, M.; Sial, A.N.; Moreira, M.Z. Stable isotope study of cave percolation waters in subtropical Brazil: Implications for paleoclimate inferences from speleothems. Chem. Geol. 2005, 220, 245–262. [Google Scholar] [CrossRef]
  37. Karmann, I.; Cruz, F.W.; Viana, O.; Burns, S.J. Climate influence on geochemistry parameters of waters from Santana–Pérolas cave system, Brazil. Chem. Geol. 2007, 244, 232–247. [Google Scholar] [CrossRef]
  38. Cruz, F.W.; Burns, S.J.; Jercinovic, M.; Karmann, I.; Sharp, W.D.; Vuille, M. Evidence of rainfall variations in Southern Brazil from trace element ratios (Mg/Ca and Sr/Ca) in a Late Pleistocene stalagmite. Geochim. Cosmochim. Acta 2007, 71, 2250–2263. [Google Scholar] [CrossRef]
  39. Berger, A.; Loutre, M.F. Insolation values for the climate of the last 10 million years. Quat. Sci. Rev. 1991, 10, 297–317. [Google Scholar] [CrossRef]
  40. Böhm, E.; Lippold, J.; Gutjahr, M.; Frank, M.; Blaser, P.; Antz, B.; Fohlmeister, J.; Frank, N.; Andersen, M.B.; Deininger, M. Strong and deep Atlantic meridional overturning circulation during the last glacial cycle. Nature 2015, 517, 73–76. [Google Scholar] [CrossRef] [PubMed]
  41. Grinsted, A.; Moore, J.C.; Jevrejeva, S. Application of the cross wavelet transform and wavelet coherence to geophysical time series. Nonlinear Process. Geophys. 2004, 11, 561–566. [Google Scholar] [CrossRef]
  42. Rehfeld, K.; Marwan, N.; Heitzig, J.; Kurths, J. Comparison of correlation analysis techniques for irregularly sampled time series. Nonlinear Process. Geophys. 2011, 18, 389–404. [Google Scholar] [CrossRef]
  43. Donohoe, A.; Marshall, J.; Ferreira, D.; Mcgee, D. The relationship between ITCZ location and cross-equatorial atmospheric heat transport: From the seasonal cycle to the Last Glacial Maximum. J. Clim. 2013, 26, 3597–3618. [Google Scholar] [CrossRef]
  44. Marshall, J.; Donohoe, A.; Ferreira, D.; McGee, D. The ocean’s role in setting the mean position of the Inter-Tropical Convergence Zone. Clim. Dyn. 2013, 42, 1967–1979. [Google Scholar] [CrossRef]
  45. Wang, X.; Auler, A.S.; Edwards, R.L.; Cheng, H.; Cristalli, P.S.; Smart, P.L.; Richards, D.A.; Shen, C.-C. Wet periods in northeastern Brazil over the past 210 kyr linked to distant climate anomalies. Nature 2004, 432, 740. [Google Scholar] [CrossRef] [PubMed]
  46. North Greenland Ice Core Project Members; Andersen, K.K.; Azuma, N.; Barnola, J.M.; Bigler, M.; Biscaye, P.; Caillon, N.; Chappellaz, J.; Clausen, H.B.; Dahl-Jensen, D.; et al. High-resolution record of Northern Hemisphere climate extending into the last interglacial period. Nature 2004, 431, 147–151. [Google Scholar]
  47. Chiang, J.C.H.; Friedman, A.R. Extratropical Cooling, Interhemispheric Thermal Gradients, and Tropical Climate Change. Annu. Rev. Earth Planet. Sci. 2012, 40, 383–412. [Google Scholar] [CrossRef]
  48. Jouzel, J.; Masson-Delmotte, V.; Cattani, O.; Dreyfus, G.; Falourd, S.; Hoffmann, G.; Minster, B.; Nouet, J.; Barnola, J.M.; Chappellaz, J.; et al. Orbital and Millennial Antarctic Climate Variability over the Past 800,000 Years. Science 2007, 317, 793. [Google Scholar] [CrossRef] [PubMed]
  49. Dansgaard, W.; Johnsen, S.J.; Clausen, H.B.; Dahl-Jensen, D.; Gundestrup, N.S.; Hammer, C.U.; Hvidberg, C.S.; Steffensen, J.P.; Sveinbjörnsdottir, A.E.; Jouzel, J.; et al. Evidence for general instability of past climate from a 250-kyr ice-core record. Nature 1993, 364, 218. [Google Scholar] [CrossRef]
  50. Petit, J.R.; Jouzel, J.; Raynaud, D.; Barkov, N.I.; Barnola, J.M.; Basile, I.; Bender, M.; Chappellaz, J.; Davis, M.; Delaygue, G.; et al. Climate and atmospheric history of the past 420,000 years from the Vostok ice core, Antarctica. Nature 1999, 399, 429. [Google Scholar] [CrossRef]
  51. Bond, G.; Kromer, B.; Beer, J.; Muscheler, R.; Evans, M.N.; Showers, W.; Hoffmann, S.; Lotti-Bond, R.; Hajdas, I.; Bonani, G. Persistent solar influence on North Atlantic climate during the Holocene. Science 2001, 294, 2130–2136. [Google Scholar] [CrossRef] [PubMed]
  52. Gingele, F.X. Holocene climatic optimum in Southwest Africa—Evidence from the marine clay mineral record. Palaeogeogr. Palaeoclimatol. Palaeoecol. 1996, 122, 77–87. [Google Scholar] [CrossRef]
  53. Liu, F.; Feng, Z. A dramatic climatic transition at ~4000 cal. yr BP and its cultural responses in Chinese cultural domains. Holocene 2012, 22, 1181–1197. [Google Scholar] [CrossRef]
  54. Cheng, H.; Fleitmann, D.; Edwards, R.L.; Wang, X.; Cruz, F.W.; Auler, A.S.; Mangini, A.; Wang, Y.; Kong, X.; Burns, S.J.; et al. Timing and structure of the 8.2 kyr B.P. event inferred from δ18O records of stalagmites from China, Oman, and Brazil. Geology 2009, 37, 1007–1010. [Google Scholar] [CrossRef]
  55. Bird, B.W.; Abbott, M.B.; Vuille, M.; Rodbell, D.T.; Stansell, N.D.; Rosenmeier, M.F. A 2300-year-long annually resolved record of the South American summer monsoon from the Peruvian Andes. Proc. Natl. Acad. Sci. USA 2011, 108, 8583. [Google Scholar] [CrossRef] [PubMed]
  56. Cruz, F.W.; Burns, S.J.; Karmann, I.; Sharp, W.D.; Vuille, M.; Ferrari, J.A. A stalagmite record of changes in atmospheric circulation and soil processes in the Brazilian subtropics during the Late Pleistocene. Quat. Sci. Rev. 2006, 25, 2749–2761. [Google Scholar] [CrossRef]
  57. Jaqueto, P.; Trindade, R.I.F.; Hartmann, G.A.; Novello, V.F.; Cruz, F.W.; Karmann, I.; Strauss, B.E.; Feinberg, J.M. Linking speleothem and soil magnetism in the Pau d’Alho cave (central South America). J. Geophys. Res. Solid Earth 2016, 121, 7024–7039. [Google Scholar] [CrossRef]
  58. Deininger, M.; McDermott, F.; Mudelsee, M.; Werner, M.; Frank, N.; Mangini, A. Coherency of late Holocene European speleothem δ18O records linked to North Atlantic Ocean circulation. Clim. Dyn. 2017, 49, 595–618. [Google Scholar] [CrossRef]
Figure 1. Map showing the distribution of carbonate and evaporite rocks in South America, provided by the World Karst Aquifer Mapping project (WOKAM [6]). Green triangles indicate study sites in the region identified by the Speleothem Isotopes Synthesis and Analysis (SISAL) working group but not included in the current version of the database, while purple circles show sites that are already in SISAL_v1 [3]. Specific information on sites and entities is given in Table 1. The dashed envelope frames the Amazon basin while acronyms and names show specific regions mentioned in the text: EA, eastern Amazonia; WA, western Amazonia; CB, central Brazil; NEB, northeastern Brazil; SEB, southeastern Brazil.
Quaternary 02 00006 g001
Figure 2. Map showing the core region of the South American Monsoon System (SAMS), the South American Convergence Zone (SACZ), the Atlantic Intertropical Convergence Zone (ITCZ) (colour shading), the South American Low-Level jet (SALLJ), and the location of the Bolivian High (H) and the Nordeste Low (L). Cave sites are indicated by closed red circles: 1) Chilibrillo Cave; 2) Cueva del Diamante; 3) Tigre Perdido; 4) El Condor Cave; 5) Huagapo Cave; 6) Pacupahuain; 7) Paraiso Cave; 8) Rainha Cave, Abissal Cave; 9) Pau d’Alho Cave, Curupira Cave and Abissal Cave; 10) São Bernardo and São Matheus Cave; 11) Tamboril Cave; 12) Diva Cave, Torrinha Cave, Lapa Doce Cave, Marota Gigante Cave and Paixão Cave; 13) Lapa Grande and Lapa Sem Fim; 14) Umajalanta Cave and Chiflonkhakha Cave; 15) Jaraguá Cave; 16) Botuverá Cave; 17) Marcelo Arévalo Cave. Also illustrated is the austral summer (December–February, DJF) 850 hPa wind field and fractional DJF precipitation. The core region of the SAMS is defined where the fraction of total annual precipitation falling during austral summer (DJF) > 0.3. The contour interval of the colour shading is 0.05. Wind data are from ERA-Interim [34] and precipitation data from GPCC [35] reanalyses datasets, with averages calculated for the period from 1979 to 2014. Figure modified from reference [18].
Quaternary 02 00006 g002
Figure 3. Histogram of South American speleothems in SISAL_v1 during the last 120 kyrs. The 120 kyrs time window was subdivided in 250-year long bins and available speleothems were counted if at least one δ18O value of the individual speleothem time series was within a bin. The two vertical lines indicate the last 10 kyrs and 2 kyrs, respectively, when the available speleothems show local maxima. Further, from about 20 to 15 kyrs BP, the available speleothem isotope time series also show a clear peak.
Quaternary 02 00006 g003
Figure 4. Orbital scale changes in South American speleothems indicating insolation driven changes of the SAMS. (a) Speleothem δ18O time series of BT2, Botuverá Cave (southeastern Brazil) [10] and the austral summer insolation in February at 30° S. (b) Mg/Ca and Sr/Ca ratios of BT2 indicating wetter (decreasing X/Ca ratios) and drier (increasing X/Ca ratios) climates at Botuverá cave [38]. (c) Residual speleothem δ18O time series from El Condor (red) and Cueva del Diamante (orange), Western Amazonia [16] and the austral summer insolation in February at 30° S [39]. To account for the effect of the different altitude of El Condor (680 m above sea level) and Cueva del Diamante (960 m above sea level) on speleothem δ18O values only residual δ18O values are shown here. The residuals were calculated from the original composite speleothem δ18O time series by subtracting the mean δ18O value. Speleothem δ18O values indicate wetter conditions if δ18O values are decreasing. Vertical dashed lines indicate orbital-scale maxima of the BT2 δ18O time series. For all precipitation-sensitive proxy time series shown, the arrow is indicating increasing precipitation amounts. (d) 231Pa/230Th time series from ODP site 1063 which infers variations in the strength of the Atlantic Overturning Circulation (AMOC) [40]. A decreasing 231Pa/230Th ratio indicates an increase of the strength of the AMOC while decreasing 231Pa/230Th ratio point towards a slowing down of the vigour of the AMOC. If the 231Pa/230Th ratio is close to or reaches the production ratio the AMOC is in its off mode. This 231Pa/230Th time series indicates that AMOC is in its warm mode (strong AMOC) until about 70 kyrs when it begins to weaken until the Last Glacial Maximum (LGM) where two pronounced stops of the AMOC are recognised associated with Heinrich Stadial 1 and 2, respectively (light blue bars at bottom of the figure). During the Holocene the AMOC is again in its warm mode. See Böhm et al. [40] for details. The error bars show the 2-sigma age uncertainty of individual U-Th ages for all stalagmites.
Quaternary 02 00006 g004
Figure 5. Wavelet analyses of the BT2 and Western Amazonia (WA) δ18O time series. (a) Wavelet analysis of the BT2 δ18O time series using a wavelet toolbox for MATLAB® [41]. Prior to the wavelet analysis, the unequally distributed δ18O time series is transformed to an equally distributed (50 years) time series using a Gaussian kernel [42]. The white shaded area indicates the cone of influence, whereas the black envelopes frame statistically significant periods. (b) Same as panel (a) but for the WA δ18O time series.
Quaternary 02 00006 g005
Figure 6. Millennial-scale changes in South American speleothems during the last 50 kyrs reveal coherent changes in rainfall associated with variations in the SAMS activity. (a) North GRIP δ18O time series showing millennial scale climate changes associated with Dansgaard-Oeschger (DO) stadials [46]. DOs are numbered, beginning at 1 and increasing with time; a vertical dashed line indicates the beginning of each DO. (b) 231Pa/230Th time series from ODP site 1063 (see also Figure 4), indicates variations in the strength of the Atlantic Overturning Circulation (AMOC) [40]. This 231Pa/230Th-based reconstruction of the vigour of the AMOC shows that the AMOC-strength is greatly reduced during Heinrich stadials (HS) (blue shaded bars), especially during HS1 and HS2, when the AMOC is in its off mode. (c) Sea-surface temperature (SST) reconstruction from the Alboran Sea, show pronounced SST changes associated with Heinrich and DO stadials. Western Amazonia (WA) speleothem δ18O time series include speleothems from (d) El Condor (ELC-A*, ELC-B*), (e) Cueva del Diamante (NAR-C*, NAR-D*, NAR-F*) [16] and (f) Pacupahuain Cave [27]. (g) Speleothem δ18O time series from eastern Amazonia (EA) are from Paraiso Cave (PAR01, PAR03, PAR06, PAR07, PAR08, PAR16, PAR24) [29]. (h) Speleothem δ18O time series from Eastern Brazil (EB) include stalagmites from Lapa Sem Fim Cave (LSF3, LSF9, LSF11, LSF13, LSF15, LSF16) and Lapa Grande Cave (LG10, LG12, LG25) [24,25]. (i) Speleothems from northeastern Brazil (NEB) are from Paixão Cave (PX7) and Marota Gigante Cave (MAG) [24,25]. (j) The speleothem δ18O time series from Rio Grande do Norte (Nordeste) is composed of stalagmites from Rainha Cave (RN1, RN4), Abissal Cave (Abisal, Ale-1) and Furna Nova Cave (FN1) [8]. (k) Jaraguá Cave (JAR7, JAR14, JAR13) is located in central Brazil (CB) [21] while (l) Botuverá Cave (BT2) is located in southeastern Brazil (SEB) [10]. The error bars show the 2-sigma age uncertainty of individual U-Th ages for all stalagmites. Temporal uncertainties for isotope values were not available.
Quaternary 02 00006 g006
Figure 7. Holocene speleothem δ18O time series indicating precipitation changes associated with the variability of the SAMS. (a) Shatuca Cave (Sha-2 and Sha-3), (b) Paraiso Cave (PAR01, PAR03, and PAR16) and (c) Rio Grande do Norte, Nordeste, (RN-1, RN-4, FN1), (d) Lapa Grande (LG3 and LG11), and (e) Botuverá Cave (BT-2 and BTV21a). Different colours indicate individual speleothems for the same cave (e.g., Lapa Grande or Botuverá Cave). The error bars show the 2-sigma age uncertainty of individual U-Th ages for all stalagmites.
Quaternary 02 00006 g007
Figure 8. Holocene speleothem δ18O time series for the last 2kyrs: northeast Brazil (DV2 stalagmite–Diva Cave, TR5 stalagmite–Torrinha Cave, LD12–Lapa Doce); middle Brazil (SBE3 stalagmite–São Bernardo Cave, SMT5 stalagmite–São Matheus Cave); middle Brazil (ALHO6 stalagmite–Pau d’Alho Cave, CUR4–Curupira Cave), and southwestern Brazil (JAR4 and JAR1 stalagmites–Jaraguá Cave). The yellow and blue shading indicates the Little Ice Age (LIA) and the Medieval Climate Anomaly (MCA). Figure modified from reference [22]. CE is Common Era.
Quaternary 02 00006 g008
Table 1. Cave sites (name and id. in SISAL) and entities (name and id. in SISAL) (i.e., speleothems) in South America. Cave sites and entities in SISAL_v1 have a unique identifier (id.). This field is empty for caves and entities not in the current version of the database. Minimum (min) and maximum (max) year are the youngest and oldest age of the isotope time series in the SISAL_v1 database. Headers in italic (e.g., Site name) are searchable variables in SISAL_v1 database.
Site_nameSide_idCountryEntity_nameEntity_idLatitude ° NLongitude ° EMin Year BPMax Year BPReference
Abissal Cave18BrazilAbissal79−5.6−37.7324,16425,694[8]
Abissal Cave18BrazilAle-180−5.6−37.7315,05717,199[8]
Botuverá Cave144BrazilBTV21a311−27.22−49.161969211[9]
Botuverá Cave144BrazilBT2312−27.22−49.16−55116,100[10]
Botuverá Cave144BrazilBTV4A −27.22−49.16 [11]
Botuverá Cave144BrazilBTV4C −27.22−49.16 [11]
Botuverá Cave144BrazilBT3A −27.22−49.16 [12]
Cascayunga Cave PeruCAS-A −6.09−77.22 [13]
Cascayunga Cave PeruCAS-D −6.09−77.22 [13]
Chiflonkhakha Cave BoliviaBoto1 −18.12−65.77234375[14]
Chiflonkhakha Cave BoliviaBoto3 −18.12−65.771801106[14]
Chiflonkhakha Cave BoliviaBoto7 −18.12−65.7791315[14]
Chilibrillo Cave78PanamaCHIL-11679.17−79.626902180[15]
Cristal Cave BrazilCR1 −24.58−48.58 [7]
Cueva Del Diamante PeruNAR-C −5.73−77.5 [16]
Cueva Del Diamante PeruNAR-D −5.73−77.5 [16]
Cueva Del Diamante PeruNAR-F −5.73−77.5 [16]
Cueva del Tigre Perdido PeruNC-A −5.94−77.31 [17]
Cueva del Tigre Perdido PeruNC-B −5.94−77.31 [17]
Curupira Cave35BrazilCUR4110−15.02−56.78−21155[18]
Diva Cave38BrazilDV2113−12.37−41.57392765[19]
El Condor Cave PeruELC-A −5.93−77.3 [16]
El Condor Cave PeruELC-B −5.93−77.3 [16]
Huagapo Cave PeruP00-H1 −11.27−75.79 [20]
Huagapo Cave PeruP09-H2 −11.27−75.79 [20]
Jaraguá Cave10BrazilJAR755−21.08−56.58548918596[21]
Jaraguá Cave10BrazilJAR1456−21.08−56.5815,33122,305[21]
Jaraguá Cave10BrazilJAR1357−21.08−56.5821,85227,906[21]
Jaraguá Cave BrazilJAR4 −21.08−56.58-50760[22]
Jaraguá Cave BrazilJAR1 −21.08−56.584991508[22]
Lapa Doce Cave103BrazilLD12203−12.37−41.57−6139[22]
Lapa Grande BrazilLG3 −14.36−44.28 [23]
Lapa Grande BrazilLG11 −14.36−44.28 [23]
Lapa Grande BrazilLG12B −14.36−44.28 [24]
Lapa Grande BrazilLG19 −14.36−44.28 [24]
Lapa Grande BrazilLG25 −14.36−44.28 [24]
Lapa Sem Fim BrazilLSF3 −16.26−44.6 [24]
Lapa Sem Fim BrazilLSF9 −16.26−44.6 [24]
Lapa Sem Fim BrazilLSF11 −16.26−44.6 [24]
Lapa Sem Fim BrazilLSF13 −16.26−44.6 [24]
Lapa Sem Fim BrazilLSF15 −16.26−44.6 [24]
Lapa Sem Fim BrazilLSF16 −16.26−44.6 [24]
Lapa Sem Fim 24BrazilLSF1691−16.15−44.6314,37318,168[25]
Lapa Sem Fim 24BrazilLSF392−16.15−44.6317,29619,304[25]
Marcelo Arévalo Cave ChileMA-1 −52.68−73.38 [26]
Marcelo Arévalo Cave ChileMA-2 −52.68−73.38 [26]
Marcelo Arévalo Cave ChileMA-3 −52.68−73.38 [26]
Marota Gigante Cave BrazilMAG −12.58−41.03 [24]
Pacupahuain Cave PeruP09 −11.24−75.82 [27]
Pacupahuain Cave PeruPH2 −11.24−75.82 [27]
Paixão Cave BrazilPX7 −12.61−41.02 [24]
Paixato Cave113BrazilPX7228−12.62−41.0214,98319,144[25]
Palestina Cave25BrazilPAL393−5.92−77.3522851[28]
Palestina Cave25BrazilPAL494−5.92−77.351001537[28]
Paraiso Cave3BrazilPAR0120−4.07−55.457144812[29]
Paraiso Cave3BrazilPAR0321−4.07−55.45−48768[29]
Paraiso Cave3BrazilPAR0622−4.07−55.4540,68344,636[29]
Paraiso Cave3BrazilPAR0723−4.07−55.4517,95745,144[29]
Paraiso Cave3BrazilPAR0824−4.07−55.4526,49028,444[29]
Paraiso Cave3BrazilPAR1625−4.07−55.45444010,927[29]
Paraiso Cave3BrazilPAR2426−4.07−55.45947628,286[29]
Pau d’Alho Cave52BrazilALHO6128−15.21−56.8901458[18]
Rainha Cave111BrazilRN1219−5.6−37.73404523,890[8]
Rainha Cave111BrazilRN4220−5.6−37.73439317,222[8]
Santana Cave BrazilSt-8 −24.53−48.73 [30]
São Bernardo Cave BrazilSBE3 −13.81−46.35−60827[22]
São Matheus Cave BrazilSMT5 −13.81−46.357491686[22]
Shatuca Cave BrazilSha-2 −5.7−77.9 [31]
Shatuca Cave BrazilSha-3 −5.7−77.9 [31]
Tamboril Cave27BrazilTM097−16−47−321678[32]
Tamboril Cave27BrazilTM298−16−4714853847[32]
Torrinha Cave62BrazilTR5146−12.37−41.57−5776[19]
Umajalanta BoliviaBoto10 −18.12−65.776041328[14]

