Modeling the 2013 Zika Outbreak in French Polynesia: Intervention Strategies


Department of Computer Science and Engineering, University of North Texas, 1155 Union Circle #305310, Denton, TX 76203-5017, USA
*
Author to whom correspondence should be addressed.
Appl. Syst. Innov. 2018, 1(3), 31; https://doi.org/10.3390/asi1030031
Submission received: 28 June 2018
/
Revised: 4 August 2018
/
Accepted: 20 August 2018
/
Published: 24 August 2018
(This article belongs to the Special Issue Healthcare System Innovation)
Abstract
:The ongoing Zika virus (ZIKV) in the Americas has been a serious public health emergency since 2015. Since Zika is a vector-borne disease, the size of the vector population in the affected area plays a key role in controlling the scale of the outbreak. The primary vectors for Zika, the Aedes Agypti and Aedes Albopictus species of mosquitoes, are highly sensitive to climatic conditions for survival and reproduction. Additionally, increased international travel over the years has caused the disease outbreak to turn into a pandemic affecting five continents. The mosquito population and the human travel patterns are the two main driving forces affecting the persistence and resurgence of Zika and other vector-borne diseases. This paper presents an enhanced dynamic model that simulates the 2013–2014 French Polynesia Zika outbreak incorporating the temperature dependent mosquito ecology and the local transit network (flights and ferries). The study highlights the importance of human travel patterns and mosquito population dynamics in a disease outbreak. The results predict that more than 85% of the population was infected by the end of the outbreak and it lasted for more than five months across the islands. The basic reproduction number () for the outbreak is also calculated using the next-generation-matrix for validation purposes. Additionally, this study is focused on measuring the impact of intervention strategies like reducing the mosquito population, preventing mosquito bites and imposing travel bans. French Polynesia was chosen as the region of interest for the study because of available demographic, climate and transit data. Additionally, results from similar studies for the region are available for validation and comparison. However, the proposed system can be used to study the transmission dynamics of any vector-borne disease in any geographic region by altering the climatic and demographic data, and the transit network.
1. Introduction
The 2015–2016 Zika virus (ZIKV) epidemic in the Americas was one of the largest vector borne disease outbreaks with over a million reported cases. The causal links between ZIKV infection and serious neurological disorders, like microcephaly [1] and Guillan-Barré Syndrome (GBS) [1] have led to a major global concern. The reasons for the virus’ higher infectivity and increased severity are being researched extensively. Some studies have partially shown that the enhanced viremia of Zika in humans is a result of a new mutation of the virus acquired after the Micronesia outbreak in 2007 [2,3]. Zika can be transmitted to humans by infected Aedes Agypti or Aedes Albopictus mosquito bites, sexual contact, or blood transfusions [1]. ZIKV is very similar to the other arboviruses like Dengue Virus (DNV) and West Nile Virus (WNV) in terms of diagnostics, and additionally Zika is asymptomatic in about 80% cases [1]. The asymptomatic nature and difficult differential diagnosis of the disease lead to inconsistent case reporting. This makes predicting and controlling the scale of a Zika epidemic challenging, and thus necessitates computational methods to simulate outbreaks, study the transmission dynamics of the disease, and develop effective intervention strategies.
Since Zika is a vector-borne disease, the size of the vector population in the affected area plays a key role in governing the scale of the outbreak. The Aedes mosquitoes are highly sensitive to environmental conditions, and thus temperature and precipitation are critical to mosquito survival and breeding [4]. Additionally, increased international travel is another major factor that has caused the disease outbreak to turn into a pandemic affecting five continents. The 2013–2014 Zika outbreak in French Polynesia was the largest Zika outbreak before the Americas outbreak in 2015 [5]. This study presents an enhanced dynamic model that simulates the transmission of Zika in 23 islands of French Polynesia incorporating a temperature dependent mosquito ecology instead of using a static vector population and the local transit network (flights and ferries) in French Polynesia. Furthermore, the model is used to study the effectiveness of outbreak control and mitigation methods like prevention of mosquito bites and imposition of travel bans after a set number of cases have been reported. The results also highlight the importance of early reporting and effectuation of prevention and control strategies. Markov Chain Monte Carlo experiments were conducted to estimate the size of the outbreak for each configuration of the model.
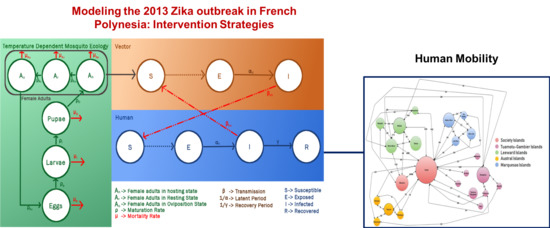
In order to estimate the size of the mosquito population, it is important to model the mosquito life cyle which includes four distinct forms: eggs, larvae, pupae and adults. The eggs hatch into larvae, which develop into pupae, which mature into adults and female adults lay eggs under suitable conditions. In this study, each stage in the gonotrophic life cycle of mosquitoes is modeled as compartments governed by a set of differential equations. The progression rates from one compartment to another and the mortality rate in each compartment may vary with temperature. Because only female mosquitoes bite, the daily female adult population computed using this model are used as an input for the Zika transmission model, which is a combination of two other compartmental models, an SEI (Susceptible-Exposed-Infectious) model for the mosquitoes and an SEIR (Susceptible-Exposed-Infectious-Recovered/Removed) model for the humans, such that the infectious mosquitoes infect the susceptible humans and vice versa. The interaction between these three compartmental models and the associated parameters are shown in Figure 1. The differential equations governing these models are discretized on a per day basis and an agent based model (both vectors and humans are agents) is created for the disease transmission. The human travel patterns have not been taken into account in the existing models for studying the transmission dynamics for Zika in French Polynesia [6,7]. The transit network for the 23 islands is used to transport people from one island to another on each day.
Because of the short life span of mosquitoes, they are assumed not to recover from the disease. Mosquitoes fly over very short distances, therefore migration of mosquitoes from one island to another is not taken into account. There is no infection induced mortality for humans or mosquitoes. Humans are long lived compared to the duration of the outbreak and the life span of mosquitoes therefore human mortality and birth rates are ignored. Humans are assumed to have lifelong immunity after being infected once [8,9]. All humans are assumed to be susceptible to the disease at the start of the outbreak because of the non-availability of any vaccine. Despite the possibility of sexual transmission of Zika, it is ignored in this research because it is difficult to model sexual transmission of any disease unless the sexual contact network is known for the population and assuming homogeneous random sexual contacts between individuals is not reflective of real life human behavior. Furthermore, research conducted by Gao, Lou et al. in [10] has shown that sexual transmission contributes only about 3% to the basic reproduction number for Zika. Additionally, the possibility of vertical transmission of Zika in mosquitoes is still being explored [11,12,13] and is therefore not considered to be a factor in this research.
Additionally, we explored the effect of implementing intervention measures to control the mosquito population, or to prevent mosquito bites, or to restrict travel to infected islands. It was seen that reducing the mosquito population and preventing mosquito bites led to a significant decrease in the size of the outbreak, but imposing travel bans after the start of the outbreak did not change the outcome unless islands were totally isolated before the infection reached them. It is seen that proactive mosquito control measures addressing both reducing the size of the vector population and preventing contact mosquito-human contact are significantly more effective than controlling human travel patterns.
In the next section, we discuss research that has been conducted in the area of vector borne disease modeling. Section 3 describes the system and all the parameters associated with each model in detail. The computation of the basic reproduction number is also discussed at the end of Section 3. The experiments and results are explained in Section 4 and we conclude the paper in Section 5.
2. Related Work
The conventional SEIR/SIR/SIS mathematical models have been used to model outbreaks and predict the scale of epidemics in the past. A review of the basic SIR model and its variations for modeling Dengue outbreaks is presented by Bakach [14]. The basic SIR model for infectious diseases, and the general setup for mathematical models for vector borne diseases have been described in detail in this work. The transmission dynamics of Zika in French Polynesia have been studied to predict the scale of future epidemics in the island populations in [6]. In this study, the authors use a mathematical model to estimate the basic reproduction number for the ZIKV virus in six archipelagos in French Polynesia. However, the mosquito population is scaled relative to the size of the human population, and human travel patterns are not considered for the model, making the human population on each island static. Additionally, the variation in the outbreak outcomes with change in mosquito population due to climatic changes or intervention strategies has not been studied in [6]. The importance of human travel in a disease outbreak for H1N1 and influenza is highlighted in [15,16], respectively. The authors in [16] show that frequent travelers affect the spread of disease only if they are infected early in the outbreak and the spread of the disease is not rapid. This result is important with respect to Zika because of the low ranging basic reproduction number for Zika, which highlights the importance of international travelers in Zika outbreaks. The effect of climate on the mosquito breeding cycle is discussed in [17,18]. They present mathematical and compartmental models to include seasonal variations in predicting the population dynamics of mosquitoes.
In this paper, human travel patterns and temperature dependent mosquito ecology have been integrated with the conventional human and vector compartmental models to improve the system’s realism and to study the change in the outbreak outcomes as these two parameters are varied. Furthermore, the measure of effectiveness of mosquito control and bite prevention methods, and travel advisories to control or prevent the outbreak is a novel contribution of this study. This model can be extended to control the mosquito population in areas with large mosquito populations that are also visited by a high number of humans if the commute data is available as highlighted by Adams and Kapan in [19]. They have investigated the role of highly structured human commuting patterns in metropolitan cities in the epidemiology of Dengue. The impact of spatial heterogeneity of resources like hosts and breeding sites on the size of mosquito population in an area is modeled in [20]. The mosquito population is assumed to be uniformly distributed across the islands in our system which can be extended to take into account breeding sites and number of humans given land use data.
3. Methodology
The system is divided into three phases: (1) the mosquito gonotrophic cycle, to determine the number of human biting female mosquitoes (only these mosquitoes play a part in the spread of the disease) (2) the Zika transmission phase, to study the outbreak dynamics and (3) the local transit network to simulate the human movement from one island to another. Phases 1 and 2 are a combination of three compartmental models governed by three sets of differential equations. The three models and their interaction with each other is shown in Figure 1. The phases are explained in detail below.
3.1. Mosquito Ecology
The mosquito life cycle can be modeled using differential equations that define the rates of change in each stage with respect to time. This continuous system governs the transition from eggs to larvae, larvae to pupae, and pupae to adults and their respective mortality rates [18,20,21]. In this study, the differential equations are discretized and the number of mosquitoes in each compartment, Eggs (E)), Larvae (L), Pupae (P) and Adults (A) are computed on a daily basis. Because only female mosquitoes bite, and contribute to the transmission of Zika, the adult compartment represents just the female population; the gender ratio for the mosquitoes is assumed to be 1:1 [22]. The adult compartment is further divided into three stages, the female mosquitoes searching for hosts for a blood meal (), female mosquitoes in the resting stage waiting for eggs to develop (), and the females in the oviposition stage () who lay eggs and return to the stage. This model was introduced and is described in detail in [20]. The maturation of mosquitoes in stage j into the next stage is governed by the maturation rate (mosquitoes per day) and each stage j has its own mortality rate (mosquitoes per day) where . is the oviposition rate instead of the maturation rate for mosquitoes in the oviposition stage. Furthermore, the larval stage has a density independent mortality rate () and a density dependent mortality rate () because competition for food and other resources is a considerable factor in this stage [20].
3.1.1. Variation with Temperature
The dependence of the population dynamics of Aedes Agypti mosquitoes on temperature is taken into account by varying the maturation and mortality rates with temperature [18]. The rates are computed by regressing values of rates at different temperatures, available in [23,24,25]. The historical temperature data for 2013–2014 in Tahiti were collected from [26]. All of the 23 islands are assumed to have the same daily temperatures during the outbreak period due to lack of available data and similar weather conditions across the islands [27]. After regressing the available data, it was observed that the maturation rates for Pupae, Eggs, and Larvae, and the mortality rate for Eggs showed the most variation with temperature. The oviposition rate and the number of eggs laid per oviposition were not regressed because of lack of data. The other rates did not vary significantly with temperature so were assumed to be independent of temperature. The regression functions and the ranges for temperature independent rates are shown in Table 1. The rates were regressed with temperature to find the best fit curve, and the curve that had the minimum sum squared of residuals and hence an adjusted R-squared value closer to one was selected for calculating the rates at varying temperature. The data points and the corresponding graphs are shown in Figure 2.
3.1.2. Synthetic Mosquito Population
The number of mosquitoes in each of the six stages were estimated by discretizing the system defined by Equation (1):
Since data for the density of mosquitoes in French Polynesia are not available, the initial adult population was estimated as a proportion of the human population on each island. The average values for all the parameters, as shown in Table 1, were used to solve for the equilibrium state for the system defined by Equation (1). The ratio of the adult population in the three stages, oviposition, resting, and hosting at the equilibrium state were used to divide the initial adult population, and the ratio between the adult population and eggs, larvae and pupae were used to initialize those populations. A control factor was added to prevent the adult population from growing or declining exponentially. The control parameters account for the additional factors like competition for resources, availability of breeding sites, predators, etc., which were not considered in the model.
3.2. Mosquito Human Interaction (SEI-SEIR Model)
The outbreak was simulated using agent-based models, where the human and adult mosquito population in the hosting stage are the agents that participate in the transmission of the disease. The total number of adult mosquitoes at the start of the experiment were assumed to be proportional to the size of the human population. The number of mosquitoes per human (m) has been shown to vary between two and four in previous studies [28,29]. The base value for this parameter was set to three and reduced to study the impact of intervention strategies. This count includes both male and female adult populations. Since only female mosquitoes in the hosting stage are vectors of the disease, only these mosquitoes are treated as agents for this phase.
As stated earlier, the transmission is controlled by two compartmental systems interacting with each other (Figure 1). The transition from one compartment to another is governed by the system of differential equations in Equations (2) and (3):
The total human population on each island, , is divided into four compartments, Susceptibles (), Exposed (), Infectious () and Recovered (), such that , and the vector population is divided into three compartments, Susceptibles (), Exposed () and Infectious (). The total vector population is dynamic as described in Section 3.1. Infectious vectors that bite susceptible humans transmit the disease with a probability of (probability of transmission from vectors to humans) and susceptible vectors that bite infected humans contract the disease with a probability of (probability of transmission from humans to vectors). The transmission coefficient for transmission from vector to human () is defined as the product of the corresponding transmission probability and the bite rate (, number of bites per day) for infectious mosquitoes, similarly the transmission coefficient for transmission from human to vector () is the product of the corresponding transmission probability and the bite rate (, number of bites per day) for susceptible mosquitoes. The transmission probabilities and the bite rates vary with temperature and the expressions derived for Dengue in [17] were used to calculate these parameters (Equation (4)). The bite rate for infectious mosquitoes is assumed to be higher (double) than the bite rate for susceptible mosquitoes in case of Dengue [30]. The same was assumed for Zika, . An infected vector bites humans every day, the bites corresponding to susceptible humans out of these bites is equal to and the bites that successfully transmit the disease are , therefore the number of humans that are infected each day is equal to . The number of infected mosquitoes is calculated as similarly. The exposed individuals become infectious after days and the infectious individuals recover after days. Similarly the exposed mosquitoes become infectious in days. The values of all the parameters and their sources are listed in Table 2.
3.3. Transit Network
French Polynesia is divided into five administrative divisions. Transmission of Zika in all islands with population greater than 500 people was studied to make the simulation as complete as possible. Table 3 shows the population and administrative divisions for all the islands that were part of the simulation. The census 2012 data was used to get the population count for the islands [32].
The transit between the islands is taken into account in the simulation of the outbreak. The data on maximum passengers traveling from one island to another via flights and ferries per week were collected from [33]. A symmetric graph (Figure 3) with islands as nodes and number of passengers traveling from one node to another each day was constructed using these data. In the simulation, human agents were transported from one island to another as per the graph at the start of each day.
3.4. Basic Reproduction Number
The basic reproduction number () for a disease is defined as the average number of new cases of an infection caused by one infected individual during their infectious period in a completely susceptible population [34]. The basic reproduction number for multi-category compartmental models can be calculated using the next-generation matrix (NGM) [35]. The next-generation matrix, K, introduced in [36] relates the numbers of newly infected individuals in the various categories in consecutive generations [37]. The element of the matrix K represents the number of new cases in state i caused by a new born individual in state j. A generation is defined by the number of individuals infected by the previous generation.
Construction of NGM
The process of constructing the NGM for a heterogeneous epidemiological system is described in detail in [35]. The steps are:
- (1)
- Linearize the infected subsystem to get the Jacobian matrix, J.
- (2)
- Decompose the Jacobian matrix into T and , where T is the transmission part and is the transition part, such that . T represents the birth of new infections and represents all other transitions (recovery, mortality, etc.). is the rate at which individuals in state i give rise to individuals in state j and represents the time an individual in state j will spend in state i in their future life.
- (3)
- Compute K as
The basic reproduction number for the infection is defined as power of the growth of K in n generations (geometric mean across n generations) as n grows to infinity, which is also equal to its spectral radius or its largest eigenvalue [37].
is calculated as the largest eigenvalue of the matrix . Estimates for the basic reproduction number ranged from 1.56–2.95 (95% CI: 2.0767–2.2026), which is comparable to the values estimated in [6].
4. Experiments and Results
The outbreak was set to begin on 1 October 2013 and it was simulated until 30 April 2014 for a total of 212 days, keeping in mind the timeline of the actual outbreak. This 7-month period provided sufficient time for the outbreak to subside.
The infectious humans and mosquitoes were introduced in Tahiti in the simulation. The system has two input parameters which were varied to test the intervention strategies:
- Ratio of mosquito-human population (m): The ratio of mosquito-human population was used to estimate the initial vector population, such that total mosquito population is m times the total human population on each island. The base ratio was chosen as 3.
- Transit network load (load): The network shown in Figure 3 represents the daily average of the maximum passengers that travel from one island to another. Since all the flights or ferries may not be full everyday, the simulation was executed by changing the load from 1 (maximum) to {0.75, 0.50, 0.25, 0.10}.
4.1. Base Case and Validation
One-hundred Markov Chain Monte Carlo experiments were conducted for each set of values of these parameters, and the average of the duration and size across these experiments were calculated. The outbreak results were compared with the number of reported cases estimated in [7] using the base case for the above two parameters, m = 3 and load = 1. The comparison for the count of reported cases calculated using our model and as estimated is shown in Table 4. It is estimated that around 30,000 cases attended health facilities with Zika like symptoms [38], the lower count of reported cases as per this model (≈26,000) could be because of the concurrent Dengure outbreak. Additionally, the reporting rates used to calculate the reported cases are based on the models in [6,7] which use the base value of 30,000 to calculate the estimates of rates hence a direct comparison is not reasonable. The size of the outbreak across all islands was calculated as 86.27% (85.2799–87.27%, CI: 95%) of the total population which is comparable to the results obtained in [6].
4.2. Intervention Strategies
Experiments were conducted to study the impact of intervention strategies on the size of the outbreak.
4.2.1. Travel Bans/Advisories
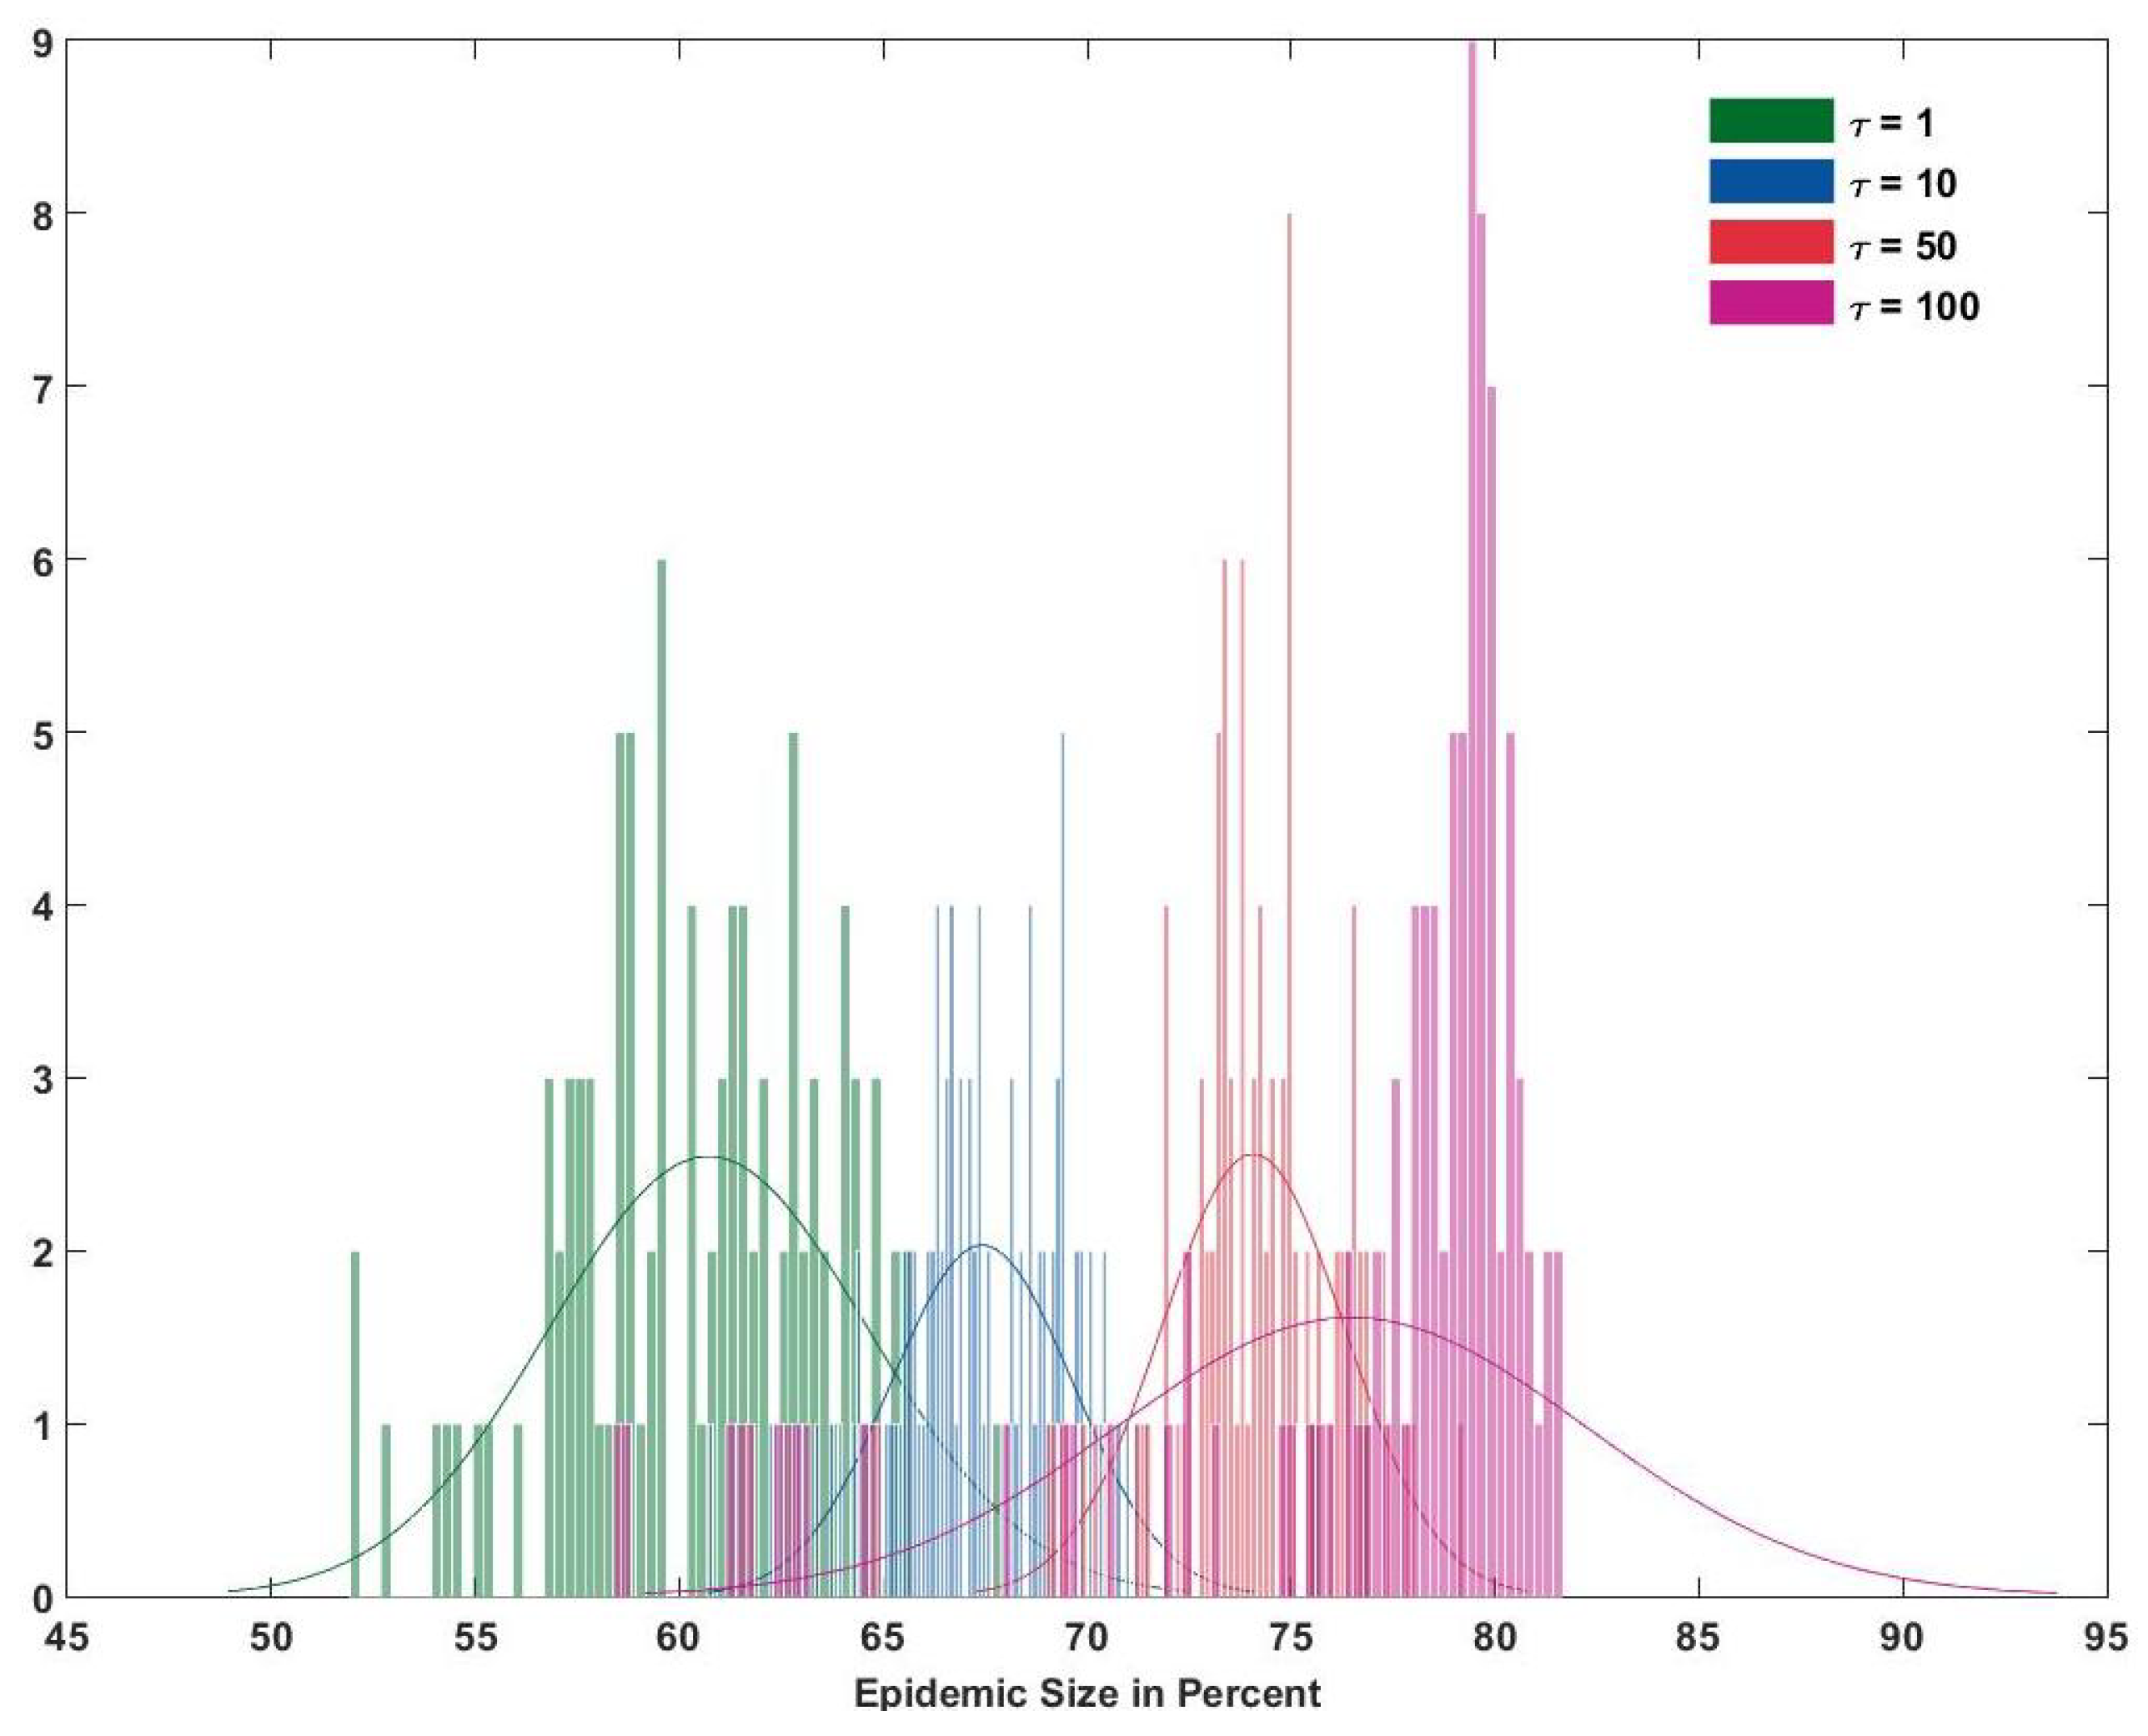
The effect of implementing travel bans in areas where sufficient cases were reported was measured. The travel bans were effectuated by reducing the transit load parameter to (75%, 50%, 25%, 10%) from 100 % after number of cases were reported. was varied from {1, 10, 50, 100}. It was seen that travel bans had no effect on the size of the outbreak even if they were imposed after the first case was reported. The first reported case was recorded using the reporting rate data available for the major archipelagos for Zika (Table 4).
The results for the size obtained from the four reduction rates and no reduction were compared using ANOVA. Even the most radical reduction of 10 % did not change the size of the outbreak significantly in all islands. It is shown in Figure 4 that the size of the outbreak in Tahiti doesn’t change in relation to reducing the transit load. However, reduction in the transit load from 100% to 25% at the start of the simulation delayed the start of the outbreak in all other islands except for Tahiti (the infection was introduced in Tahiti). This can be seen in Figure 5.
4.2.2. Mosquito Control
Mosquito control methods like aerial spraying, removal of breeding places and stagnant water, or use of adulticides in places with large mosquito populations is recommended by the Centers for Disease Control and Prevention (CDC) before the spread of diseases like Zika or Chikungunya [1]. The ratio of the human–mosquito population was reduced to 2, 1.5 and 1 to see the effect of a reduced mosquito population on the outbreak size. The effect of reducing the vector population was tested using a left tailed 2 sample t-test with a significance value of 0.05. It can be seen in Figure 6 that the average size of the epidemic in all islands is directly proportional to the initial size of the vector population. Figure 7 shows that reducing the vector population reduces the number of infected individuals significantly, and reducing the vector population by half reduces the number of infectious individuals by around 30%.
4.2.3. Bite Prevention
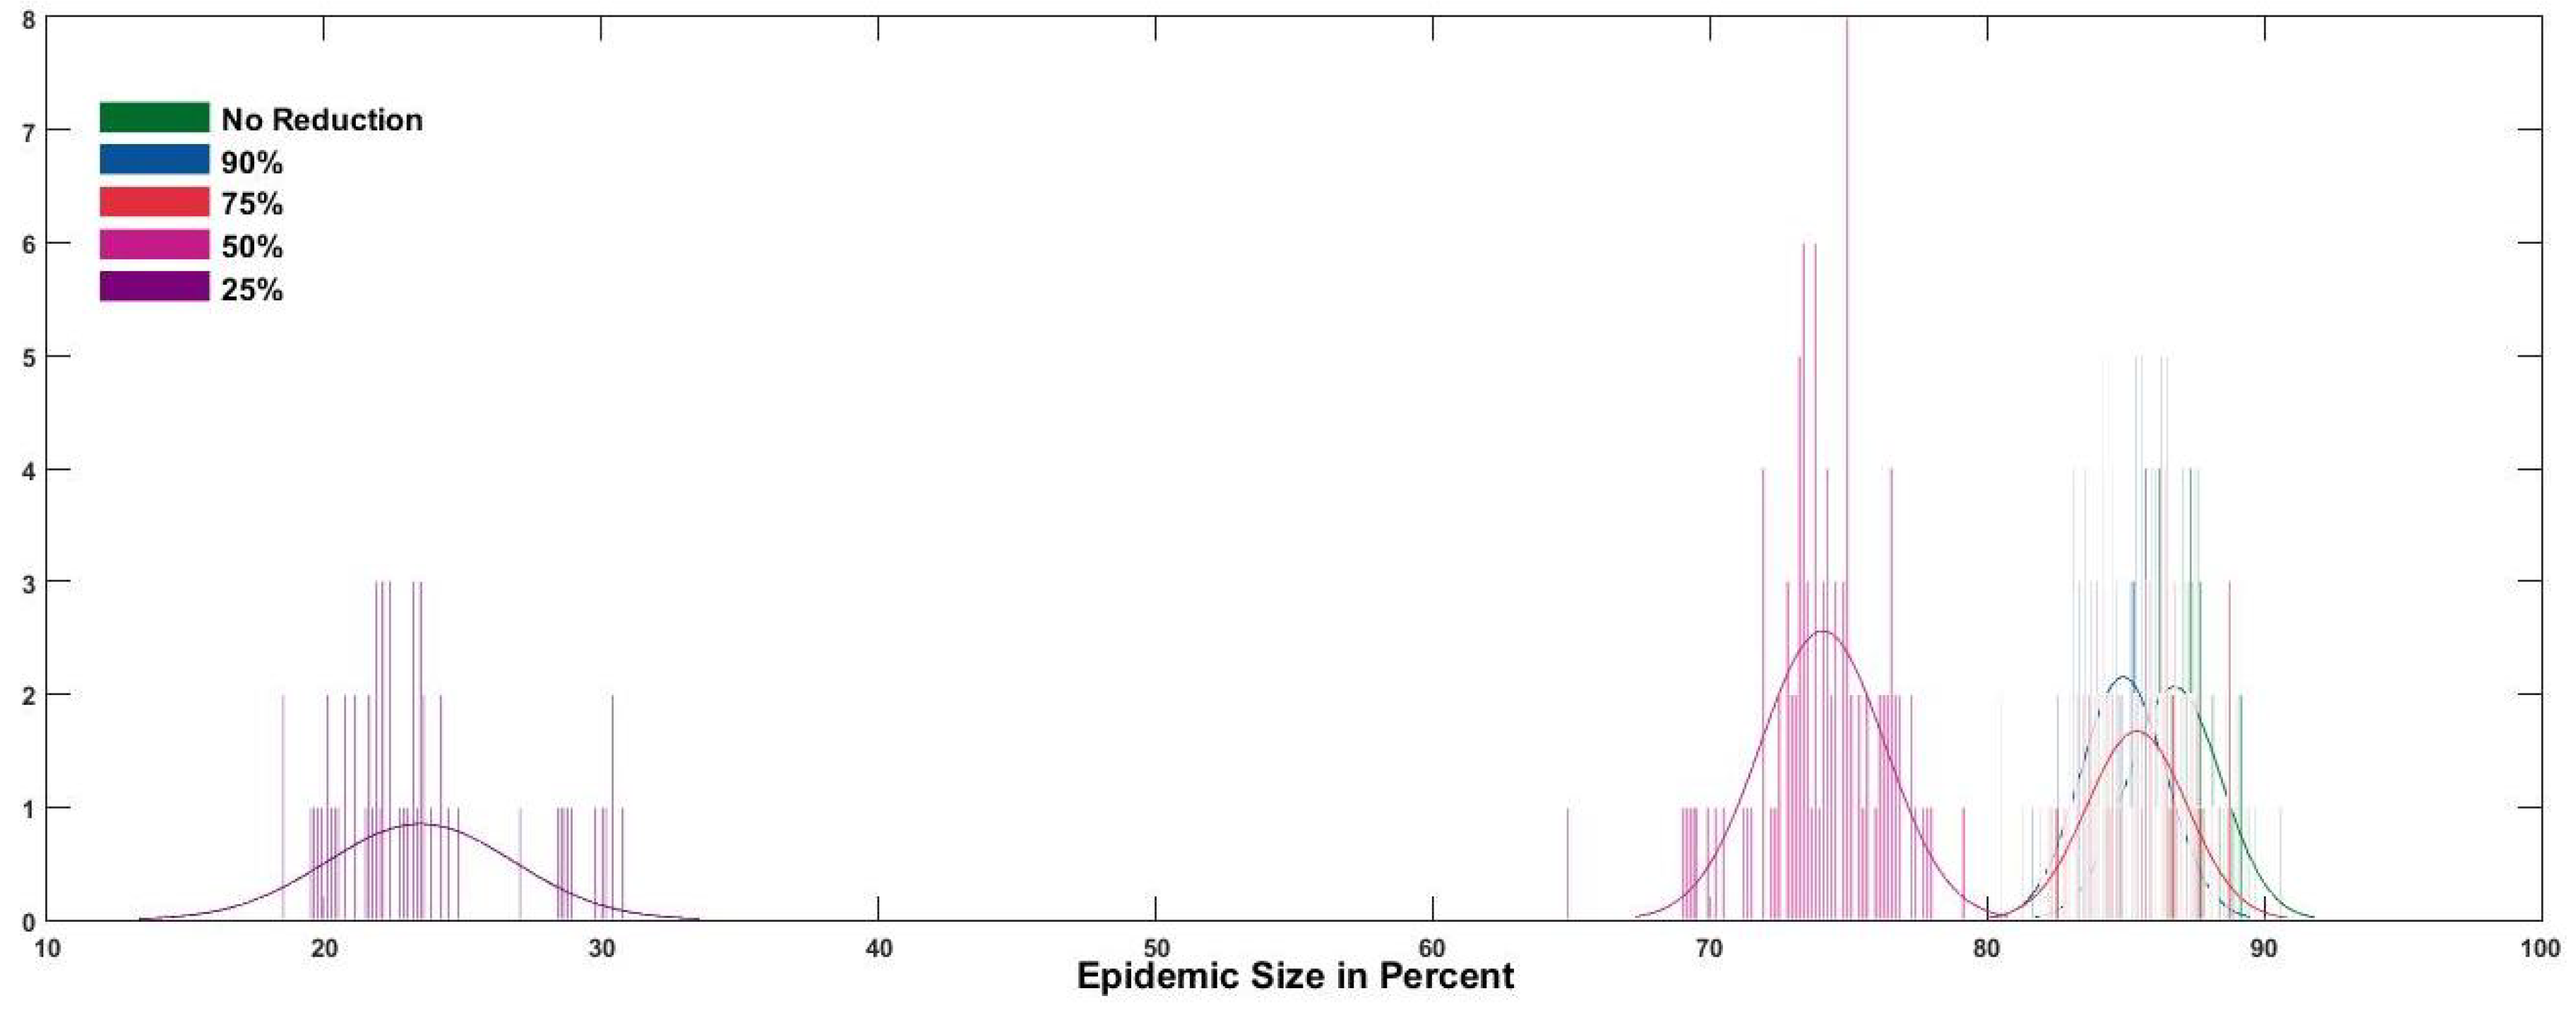
Protection from mosquito bites by using mosquito repellents and wearing long sleeved shirts and long pants is another way to prevent Zika transmission. The effect of bite reduction was measured by reducing the bite rate to (90%, 75%, 50%, 25%) (reduction factor) of the original bite rate after number of cases were reported. was varied from (1, 10, 50, 100). Figure 8 shows the the variation in average size of the epidemic in all islands with respect to the reduction factor. Figure 9 shows the effect of reducing the bite rate after 50 reported cases on the size of the epidemic in all 23 islands. It can be seen that reducing the bite rate to 90% and 75% from the normal bite rate reduces the size only by around 5%, while reducing it further has a much more significant effect. The effect of reducing the bite rate was tested using a left tailed 2-sample t-test with a significance value of 0.05. It can be seen in Figure 10 that early action to prevent mosquito bites is more effective than late action in reducing the size of the epidemic. Reducing the bite rate after 50 or less cases are reported works considerably better than reducing the bite rate later.
5. Discussion
The scale of the 2015–2016 Zika epidemic in Americas has raised public health concerns worldwide. Understanding the dynamics of the disease requires the investigation of the major drivers of a vector-borne disease outbreak: the mosquito population and human travel patterns. A dynamic model that simulates the transmission of Zika in 23 islands of French Polynesia incorporating a temperature dependent mosquito ecology and the local transit network was presented in the study. If base case values for the mosquito population (initial vector population is three times the human population) and transit network (100% load on the network ) are used, then 86% of the total population in the affected islands were infected by the end of the outbreak, which lasted for about 160 days. Additionally, the model can be used to test the effectiveness of intervention strategies like mosquito and bite control, and travel bans. Mosquito control measures like biocontrol and mosquito bite prevention help in containing the outbreak by reducing the probability of transmission. Implementing travel bans or advisories even after the first reported case was shown to be ineffective on this network because of the combination of high connectivity of the nodes and under reporting. Even though the disease reached all the islands eventually, reduction in the load introduces a delay in the start of the outbreak which can be used to prepare for the outbreak.
The basic reproduction number () for the entire population was calculated to be 2.135 (CI 95%: 2.07–2.20) using the Next Generation Matrix. These results are in line with the calculated reproduction numbers for the French Polynesia outbreak by other studies [6]. Although is used to predict the scale of future outbreaks, it is sensitive to demographic and geographical circumstances. Therefore, calculated for a disease in one region should not be used to predict the disease outcomes for a different geographic and demographic location [39]. This is emphasized further by the wide range of values published for Zika in the literature which vary significantly from one region to another [6,40,41,42]. The process described to calculate using the next-generation matrix can be applied to other heterogeneous epidemiological systems like Lyme disease, plague, malaria, dengue, etc. by changing the differential equations and the parameters associated with them.
The availability of demographic, climatic, and transit data was critical in developing the model discussed in the paper. The proposed model can be used to study and control the outbreak of other vector-borne diseases in other regions globally if the aforementioned data are available. This highlights the importance of data collection, particularly on the size of the mosquito population and high risk areas, so that contact rates can be altered accordingly and vulnerable populations/areas can be identified. For example, the number of mosquito breeding sites or control measures may vary across islands, and therefore using a uniform mosquito to human ratio is not the most accurate. Collecting the data for these variables can improve the accuracy of the results and facilitate region specific predictions and planning.
The results from this study show that public-health planners need to be proactive with mitigation strategies when cases are being reported in neighboring regions. This is particularly critical for neighboring regions with high volumes of commuter traffic. Activating any strategy only after a case has been detected in the affected jurisdiction is often too late to make a meaningful impact on the severity of an outbreak. Thus, if a case is detected in a region, enacting preventative measures i.e., mosquito net distribution and fumigation, in neighboring regions will aid in reducing the size of the outbreak significantly.
Supplementary Materials
The supplementary materials are available online at https://www.mdpi.com/2571-5577/1/3/31/s1.
Author Contributions
Conceptualization, H.G.; Data curation, K.X.; Formal analysis, A.R.M. and H.G.; Methodology, H.G. and F.H.; Software, H.G. and F.H.; Validation, H.G. and A.R.M.; Writing–original draft, H.G.; Writing–review & editing, A.R.M. and H.G.
Funding
This research received no external funding.
Conflicts of Interest
The authors declare no conflicts of interest.
References
- CDC. Zika Virus:Information for Clinicians. 2016. Available online: www.cdc.gov/zika (accessed on 3 August 2018).
- Ridler, C. CNS infections: Zika virus mutation associated with increased infectivity, mortality and severe microcephaly. Nat. Rev. Neurol. 2017. [Google Scholar] [CrossRef] [PubMed]
- Xia, H.; Luo, H.; Shan, C.; Muruato, A.E.; Nunes, B.T.D.; Medeiros, D.B.A.; Zou, J.; Xie, X.; Giraldo, M.I.; Vasconcelos, P.F.C.; et al. An evolutionary NS1 mutation enhances Zika virus evasion of host interferon induction. Nat. Commun. 2018, 9. [Google Scholar] [CrossRef] [PubMed]
- CDC. Dengue and Climate. 2012. Available online: www.cdc.gov (accessed on 1 December 2017).
- Musso, D. Zika Virus Transmission from French Polynesia to Brazil. Emerg. Infect. Dis. 2015, 21. [Google Scholar] [CrossRef] [PubMed]
- Kucharski, A.J.; Funk, S.; Eggo, R.M.; Mallet, H.P.; Edmund, W.J.; Nilles, E.J. Transmission Dynamics of Zika Virus in Island Populations: A Modelling Analysis of the 2013–14 French Polynesia Outbreak. PLos Negl. Trop. Dis. 2016, 10. [Google Scholar] [CrossRef] [PubMed]
- Riou, J.; Poletto, C.; Boëlle, P. A comparative analysis of Chikungunya and Zika transmission. Epidemics 2017, 19, 43–52. [Google Scholar] [CrossRef] [PubMed]
- Hyer, R.; Covello, V. Top Questions on Zika: Simple Answers; Association of State, and Territorial Health Officials: Arlington, VA, USA, 2017. [Google Scholar]
- Osuna, C.E.; Lim, S.; Deleage, C.; Griffin, B.D.; Stein, D. Zika viral dynamics and shedding in rhesus and cynomolgus macaques. Nat. Med. 2016, 22, 1448–1455. [Google Scholar] [CrossRef] [PubMed] [Green Version]
- Gao, D.; Lou, Y.; He, D. Prevention and Control of Zika as a Mosquito-Borne and Sexually Transmitted Disease: A Mathematical Modeling Analysis. Nat. Sci. Rep. 2016, 6. [Google Scholar] [CrossRef] [PubMed]
- Ciota, A.T.; Bialosuknia, S.M.; Ehrbar, D.J.; Kramer, L.D. Vertical Transmission of Zika Virus by Aedes aegypti and Ae. albopictus Mosquitoes. Emerg. Infect. Dis. 2017, 23, 880–882. [Google Scholar] [CrossRef] [PubMed] [Green Version]
- Nelms, B.M.; Fechter-Leggett, E.; Carroll, B.D.; Macedo, P.; Kluh, S.; Reisen, W.K. Experimental and natural vertical transmission of West Nile virus by California Culex (Diptera: Culicidae) mosquitoes. J. Med. Entomol. 2013, 50, 371–378. [Google Scholar] [CrossRef] [PubMed]
- Rosen, L.; Shroyer, D.A.; Tesh, R.B.; Freier, J.E.; Lien, J.C. Transovarial transmission of dengue viruses by mosquitoes: Aedes albopictus and Aedes aegypti. Am. J. Trop. Med. Hyg. 1983, 32, 1108–1119. [Google Scholar] [CrossRef] [PubMed]
- Bakach, I. A Survey of Mathematical Models of Dengue Fever. Ph.D. Thesis, Department of Mathematics, The University of Iowa, Iowa City, IA, USA, 2015. [Google Scholar]
- Apolloni, A.; Poletto, C.; Colizza, V. Age-specific contacts and travel patterns in the spatial spread of 2009 h1n1 influenza pandemic. BMC Infect. Dis. 2013, 13. [Google Scholar] [CrossRef] [PubMed]
- Hollingsworth, T.D.; Ferguson, N.M.; Anderson, R.M. Frequent travelers and rate of spread of epidemics. Emerg. Infect. Dis. 2007, 13. [Google Scholar] [CrossRef] [PubMed]
- Liu-Helmersson, J.; Stenlund, H.; Wilder-Smith, A.; Rocklöv, J. Vectorial Capacity of Aedes aegypti: Effects of Temperature and Implications for Global Dengue Epidemic Potential. PLoS ONE 2014, 9, e0089783. [Google Scholar] [CrossRef] [PubMed]
- Vaidya, A.; Mikler, A.R.; Bravo-Salgado, A.D. Modeling climate-dependent population dynamics of mosquitoes to guide public health policies. In Proceedings of the 5th ACM Conference on Bioinformatics, Computational Biology, and Health Informatics, Newport Beach, CA, USA, 20–23 September 2014; pp. 380–389. [Google Scholar] [CrossRef]
- Adams, B.; Kapan, D.D. Man bites mosquito: Understanding the contribution of human movement to vector-borne disease dynamics. PLoS ONE 2009, 4, e0006763. [Google Scholar] [CrossRef] [PubMed] [Green Version]
- Lutambi, A.M.; Penny, M.A.; Smith, T.; Chitnis, N. Mathematical modelling of mosquito dispersal in a heterogeneous environment. Math. Biosci. 2013, 241, 198–216. [Google Scholar] [CrossRef] [PubMed] [Green Version]
- Ewing, D.A.; Cobbold, C.A.; Purse, B.V.; Nunn, M.A.; White, S.M. Modelling the effect of temperature on the seasonal population dynamics of temperate mosquitoes. J. Theor. Biol. 2016, 400, 65–79. [Google Scholar] [CrossRef] [PubMed] [Green Version]
- Lounibos, L.P.; Escher, R.L. Sex ratios of mosquitoes from long-term censuses of florida tree holes. J. Am. Mosq. Control Assoc. 2008, 24, 11–15. [Google Scholar] [CrossRef] [PubMed]
- Beserra, E.B.; de Castro, F.P., Jr.; dos Santos, J.W.; Santos, T.; Fernandes, C.R.M. Biologia e Exigências Térmicas de Aedes aegypti (L.) (Diptera:Culicidae) Provenientes de Quatro Regiões Bioclimáticas da Paraíba. Neotrop. Entomol. 2006, 35, 853–860. [Google Scholar] [CrossRef] [PubMed]
- Otero, M.; Solari, H.G.; Schweigmann, N. A stochastic population dynamics model for Aedes aegypti: formulation and application to a city with temperate climate. Bull. Math. Biol. 2006, 68. [Google Scholar] [CrossRef] [PubMed]
- Rueda, L.M.; Patel, K.J.; Axtell, R.C.; Stinner, R.E. Temperature-dependent development and survival rates of culex quinquefasciatus and aedes aegypti (diptera: Culicidae). J. Med. Entomol. 1990, 27, 892–898. [Google Scholar] [CrossRef] [PubMed]
- The weather company LLC. Weather History for Tahiti, French Polynesia. 2017. Available online: https://www.wunderground.com/history (accessed on 25 July 2017).
- Fages, J.; Robineau, C. French Polynesia. World Atlas of Agriculture, Verona: Centro di Geografia Agraria 1972, 9, 613. [Google Scholar]
- Caminade, C.; Turnera, J.; Metelmann, S. Global risk model for vector-borne transmission of Zika virus reveals the role of El Niño 2015. PNAS 2016, 114. [Google Scholar] [CrossRef] [PubMed]
- Zhang, Q.; Suna, K.; Chinazzia, M.; Piontti, A.P. Spread of Zika virus in the Americas: Supporting Information. PNAS 2017, 114. [Google Scholar] [CrossRef] [PubMed]
- Derouich, M.; Boutayeb, A.; Twizell, E.H. A model of dengue fever. BioMed. Eng. OnLine 2003, 2. [Google Scholar] [CrossRef]
- Musso, D.; Gubler, D.J. Zika Virus. Clin. Microbiol. Rev. 2016, 29, 487–524. [Google Scholar] [CrossRef] [PubMed] [Green Version]
- Statistical Institute of French Polynesia (SISPF). Population by Geography Archipelagos / Islands and by Ten-Year Age. 2015. Available online: www.ispf.pf/bases/Recensements/2012/Donnees_detaillees/Population.aspx (accessed on 3 August 2018).
- AirTahiti. Flying in an ATR. 2016. Available online: www.airtahiti.com/fleet-atr (accessed on 20 March 2017).
- Heffernan, J.M.; Smith, R.J.; Wahl, L.M. Perspectives on the basic reproductive ratio. J. R. Soc. Interface 2005, 2. [Google Scholar] [CrossRef] [PubMed]
- Deikmann, O.; Heesterbeek, J.A.P.; Roberts, M.G. The construction of next-generation matrices for compartmental epidemic models. J. R. Soc. Interface 2010, 7, 873–885. [Google Scholar] [CrossRef] [PubMed] [Green Version]
- Deikmann, O.; Heesterbeek, J.A.P.; Roberts, M.G. On the definition and the computation of the basic reproduction ratio r0 in models for infectious diseases in heterogeneous populations. J. Math. Biol. 1990, 28, 365–383. [Google Scholar] [CrossRef]
- Deikmann, O.; Heesterbeek, J.A.P. Mathematical Epidemiology of Infectious Diseases: Model Building, Analysis and Interpretation; John Wiley: Hoboken, NJ, USA, 2003. [Google Scholar]
- Centre d’hygiene et de salubrite publique. Surveillance de la dengue et du zika en Polynésie française. 2014. Available online: www.hygiene-publique.gov.pf (accessed on 7 July 2017).
- Johnson, T.V.; Mikler, A.R. Chasing r0: Understanding the effects of population dynamics on the basic reproduction number. J. Biol. Syst. 2011, 19. [Google Scholar] [CrossRef]
- Champagne, C.; Salthouse, D.G.; Paul, R.; Cao-Lormeau, V.; Roche, B.; Cazelles, B. Structure in the variability of the basic reproductive number (R0) for Zika epidemics in the Pacific islands. eLife 2016, 5. [Google Scholar] [CrossRef] [PubMed]
- Nishiura, H.; Mizumoto, K.; Villamil-Gómez, W.E.; Rodríguez-Morales, A.J. Preliminary estimation of the basic reproduction number of Zika virus infection during Colombia epidemic, 2015–2016. Travel Med. Infect. Dis. 2016, 14, 274–276. [Google Scholar] [CrossRef] [PubMed] [Green Version]
- Towers, S.; Brauer, F.; Castillo-Chaveza, C.; Falconar, A.K.I. Estimate of the reproduction number of the 2015 Zika virus outbreak in Barranquilla, Colombia, and estimation of the relative role of sexual transmission. Epidemics 2016, 17, 50–55. [Google Scholar] [CrossRef] [PubMed]
Figure 1.
Phase 1 and 2: Interaction between the three compartmental models. Red solid arrows indicate mortality and removal from the system. Red dashed arrows indicate contact between infectious and susceptible entities. The dotted arrow from Susceptibles to Exposed indicates indirect movement from S to E, dependent on the infectious mosquitoes/humans. Solid arrows indicate direct movement from one compartment to another.

Figure 2.
The variation of maturation and mortality rates with temperature. The dotted line represents the best curve that fit the data points. The purple dots represent the data points.
Figure 2.
The variation of maturation and mortality rates with temperature. The dotted line represents the best curve that fit the data points. The purple dots represent the data points.

Figure 3.
The flight and ferry transit network: the weights on the edges denote the number of passengers traveling from one island to another [33]. Tahiti, Raitea, Nuku Hiva, Tupuai and Rangiroa are the capitals of their respective admistrative divisions
Figure 3.
The flight and ferry transit network: the weights on the edges denote the number of passengers traveling from one island to another [33]. Tahiti, Raitea, Nuku Hiva, Tupuai and Rangiroa are the capitals of their respective admistrative divisions

Figure 4.
The effect of introducing travel bans (reduced transit load) on the size of the outbreak in Tahiti (distribution of epidemic size).
Figure 4.
The effect of introducing travel bans (reduced transit load) on the size of the outbreak in Tahiti (distribution of epidemic size).

Figure 5.
The effect of load of transit network (load) on the start of the outbreak on each island (m = 3).
Figure 5.
The effect of load of transit network (load) on the start of the outbreak on each island (m = 3).

Figure 6.
The effect of reducing the initial vector population on the average size of the epidemic in all islands (average epidemic size).
Figure 6.
The effect of reducing the initial vector population on the average size of the epidemic in all islands (average epidemic size).

Figure 7.
The effect of reducing the initial vector population on the size of the outbreak in French Polynesia (distribution of epidemic size).
Figure 7.
The effect of reducing the initial vector population on the size of the outbreak in French Polynesia (distribution of epidemic size).

Figure 8.
The effect of reducing the daily bite rate after 50 reported cases on the average size of the outbreak in all islands (average epidemic size).
Figure 8.
The effect of reducing the daily bite rate after 50 reported cases on the average size of the outbreak in all islands (average epidemic size).

Figure 9.
The effect of reducing the daily bite rate after 50 reported cases on the size of the outbreak in French Polynesia (distribution of epidemic size).
Figure 9.
The effect of reducing the daily bite rate after 50 reported cases on the size of the outbreak in French Polynesia (distribution of epidemic size).

Figure 10.
The variation in the size of the outbreak with change in the threshold cases () when the bite rate is reduced to 50% (distribution of epidemic size).
Figure 10.
The variation in the size of the outbreak with change in the threshold cases () when the bite rate is reduced to 50% (distribution of epidemic size).

Table 1.
Mosquito ecology parameters, all rates are counts per day and T is the daily temperature in °Celsius.
Table 1.
Mosquito ecology parameters, all rates are counts per day and T is the daily temperature in °Celsius.
| Parameter | Symbol | Type | Value |
|---|---|---|---|
| Number of eggs laid per oviposition | b | Ranged | random (50–300) [20] |
| Oviposition Rate | Ranged | random (3.0–4.0) [20] | |
| Egg Mortality Rate | Regression | ||
| Egg Maturation Rate | Regression | ||
| Density Independent Larvae Mortality Rate | Ranged | random (0.32–0.80) [20] | |
| Density Dependent Larvae Mortality Rate | Constant | 0.05 [20] | |
| Larva Maturation Rate | Regression | ||
| Pupa Mortality Rate | Ranged | random (0.33–1.0) [20] | |
| Pupa Maturation Rate | Regression | ||
| Adult Mortality Rate (Hosting stage) | Ranged | random (0.322–0.598) [20] | |
| Adult Maturation Rate (Hosting stage) | Ranged | random (0.322–0.598) [20] | |
| Adult Maturation Rate (Resting stage) | Ranged | random (0.30–0.56) [20] | |
| Adult Mortality Rate (Resting stage) | Ranged | random (0.0034–0.01) citemosquitomodel | |
| Adult Mortality Rate (Oviposition stage) | Ranged | random (0.41–0.56) [20] |
Table 2.
Disease Parameters for Zika.
| Parameter | Value |
|---|---|
| Transmission Probability (human to vector), | Temperature dependent [17] |
| Transmission Probability (vector to human), | Temperature dependent [17] |
| Bite Rate of susceptible mosquitoes(in bites per day), | Temperature dependent [17] |
| Bite Rate of infectious mosquitoes(in bites per day), | 2 [30] |
| Latent Period for humans(in days), | random (3–15) [1] |
| Recovery Period for humans(in days), | 7 [1] |
| Latent Period for mosquitoes(in days), | 15 [31] |
Table 3.
Population and administrative divisions of the islands (the capital islands are asterisk marked *). Source: Census 2012 [32].
Table 3.
Population and administrative divisions of the islands (the capital islands are asterisk marked *). Source: Census 2012 [32].
| Island | Admin Division | Population |
|---|---|---|
| Tahiti* | Windward Islands | 183,480 |
| Moorea | Windward Islands | 16,899 |
| Bora Bora | Leeward Islands | 9596 |
| Raitea* | Leeward Islands | 12,237 |
| Tahaa | Leeward Islands | 5220 |
| Huahine | Leeward Islands | 6303 |
| Maupiti | Leeward Islands | 1194 |
| Nuku Hiva* | Marquesas Islands | 2967 |
| Ua Huka | Marquesas Islands | 621 |
| Ua Pou | Marquesas Islands | 2175 |
| Hiva Oa | Marquesas Islands | 2184 |
| Arutua | Tuamotu Gambier Islands | 680 |
| Rangiroa* | Tuamotu Gambier Islands | 2567 |
| Manihi | Tuamotu Gambier Islands | 685 |
| Fakarava | Tuamotu Gambier Islands | 806 |
| Hao | Tuamotu Gambier Islands | 1066 |
| Makemo | Tuamotu Gambier Islands | 832 |
| Takaroa-Takapoto | Tuamotu Gambier Islands | 1262 |
| Gambier | Tuamotu Gambier Islands | 1239 |
| Tupuai* | Austral Islands | 2170 |
| Rimatara | Austral Islands | 873 |
| Rurutu | Austral Islands | 2322 |
| Raivavae | Austral Islands | 940 |
Table 4.
Reported Cases Comparison, reporting rates are percent of infected cases that were reported.
Table 4.
Reported Cases Comparison, reporting rates are percent of infected cases that were reported.
| Place | Reporting Rate [7] | Calculated Cases (Reported, CI-95%) | Reported Cases in [7] |
|---|---|---|---|
| Tahiti | 12% | 19,098 (19,022–19,175) | 21,406 |
| Moorea | 8% | 1156 (1150–1161) | 1235 |
| Austral Islands | 17% | 933 (920–946) | 1208 |
| Leeward Islands | 12% | 3517 (3473–3562) | 3912 |
| Marquesas Islands | 11% | 750 (738–762) | 994 |
| Tuamotu Gambier Islands | 8% | 641 (630–653) | 1211 |
| Total | 26,095 (25,933–26,259) | 29,966 |
© 2018 by the authors. Licensee MDPI, Basel, Switzerland. This article is an open access article distributed under the terms and conditions of the Creative Commons Attribution (CC BY) license (http://creativecommons.org/licenses/by/4.0/).
Share and Cite
MDPI and ACS Style
Gwalani, H.; Hawamdeh, F.; Mikler, A.R.; Xiong, K. Modeling the 2013 Zika Outbreak in French Polynesia: Intervention Strategies. Appl. Syst. Innov. 2018, 1, 31. https://doi.org/10.3390/asi1030031
AMA Style
Gwalani H, Hawamdeh F, Mikler AR, Xiong K. Modeling the 2013 Zika Outbreak in French Polynesia: Intervention Strategies. Applied System Innovation. 2018; 1(3):31. https://doi.org/10.3390/asi1030031
Chicago/Turabian StyleGwalani, Harsha, Faris Hawamdeh, Armin R. Mikler, and Katherine Xiong. 2018. "Modeling the 2013 Zika Outbreak in French Polynesia: Intervention Strategies" Applied System Innovation 1, no. 3: 31. https://doi.org/10.3390/asi1030031