
State of the Art in Metal Matrix Composites Research: A Bibliometric Analysis


1
Symbiosis Institute of Technology, Symbiosis International (Deemed University), Pune 412115, India
2
Department of Computer Science Engineering, School of Engineering and Applied Sciences, Bennett University, Greater Noida, Uttar Pradesh 201310, India
*
Author to whom correspondence should be addressed.
Appl. Syst. Innov. 2021, 4(4), 86; https://doi.org/10.3390/asi4040086
Submission received: 27 August 2021
/
Revised: 16 October 2021
/
Accepted: 29 October 2021
/
Published: 4 November 2021
(This article belongs to the Section Industrial and Manufacturing Engineering)
Abstract
:Metal matrix composites (MMC) are the materials of tomorrow. This paper presents an in-depth analysis of the MMC research articles published in Web of Science (WoS) during 2001–2020. The study firstly included year on year publications, publication types, sources, research directions as well as the most productive researchers, organizations and nations. Secondly, a detailed analysis of collaborations among various MMC researchers, organizations and countries has been presented. Thirdly, citations based linkages among the published articles, sources, researchers, institutions and places have been discussed relative to their respective collaborative link strengths. A co-occurrence analysis of MMC keywords was also conducted to highlight the most important keywords trending in this area. Finally, burst detection analyses of keywords and references were carried out to unearth sudden citation spikes of keywords and documents. Primary results indicate that research articles formed 80.54% of all MMC publications in WoS. The journal ‘Materials Science and Engineering A: Structural Materials, Properties, Microstructure and Processing’ published maximum MMC articles. Collaboration analysis results indicate that Zhang D, the Chinese Academy of Science and People’s Republic of China, attained topmost collaboration based total link strengths (TLS). Citations based analysis showed that Zhang D, the Shanghai Jiao Tong University (China), People’s Republic of China and the journal ‘Materials Science and Engineering A: Structural Materials, Properties, Microstructure and Processing’ received highest citation TLS values. Keyword ‘Graphene’ scored the highest citation burst strength (2018–2020). The future of MMC research lies in processing and characterization of novel nanocomposites with reinforcements such as graphene and boron carbide for various applications.
1. Introduction
Advancement in science and technology is directly correlated with the discovery, processing and applied investigations of novel materials. Modern materials are more complex, functionally efficient and commercially viable as compared to their simpler and functionally limited predecessors. Composites form a large group of new age materials that combine the positive attributes of two or more different constituents resulting in a superior combination. These materials help fulfill the conflicting requirements of maximising performance and minimising energy consumption simultaneously [1,2]. Composites typically consist of reinforcements added to base materials to make them stronger, tougher and more resilient [3,4,5]. The base materials can vary from metals to polymers, whereas the reinforcements may vary from ceramics to fibres and fly ash [6]. The current study focuses on the research trends pertaining to metal based composites reinforced with ceramic particles. The following subsection gives a brief overview of the properties, compositions, force/tool wear/surface generation mechanisms, machining challenges as well as the simulation/modeling techniques explored by researchers to characterize these complex materials.
1.1. Metal Matrix Composites
Metal matrix composites refer to a class of new age materials consisting of base metal alloys primarily reinforced with ceramic particles for enhanced functional properties. Figure 1 shows a pictorial representation of metal matrix composite structure reinforced with (a) single and (b) multiple types of particles. The composites with multiple types of reinforcement particles are called hybrid metal matrix composites. Composites with nano sized inclusions are termed nano metal matrix composites, or simply, nano-composites. Hybrid metal matrix composites can also consist combinations of metal matrices in the form of alloys such as aluminum-magnesium, aluminum-copper and titanium based compositions [7].
These materials offer superior mechanical characteristics as compared to monolithic alloys. These characteristics include strength to weight ratio, stiffness to weight ratio, wear resistance, corrosion resistance, strength, hardness and more [8]. However, these materials are difficult to prepare and to machine. One of the challenges involving these materials is to obtain uniform dispersion of the reinforcement particles in the base alloy matrix. Hence, researchers have explored various processing techniques such as stir casting and powder metallurgy to ensure the same [9]. Investigators have also studied various machining methods such as turning, milling, drilling and grinding to process these materials efficiently [10]. Others have tried different simulation and control methods towards accurate predictive modeling [11,12] and automation of the MMC machining process outcomes such as surface roughness [13,14,15,16], tool chip interface friction [17] and more. Aluminium is a commonly preferred base metal alloy for most MMC compositions because of its good strength, light weight machinability and aerospace applications [18,19,20,21]. Common reinforcement materials include silicon carbide, boron carbide, alumina and others. Recently, nano scale reinforcement particles such as carbon nanotubes and graphene are also becoming popular among MMC researchers [13].
Metal matrix composites exhibit very unique strengthening and fracture mechanisms that make them difficult to machine. Researchers have conducted detailed experiments to understand the behavior of MMCs under quasi static as well as high strain rate processing conditions [22,23,24]. For instance, particle reinforcements tend to enhance the sensitivity of strain hardening to strain rate effects of machining [25], resulting in higher strain hardening rates at smaller increments in machining speeds. The hard ceramic reinforcements tend to generate higher tool wear during machining of composites [26]. Higher volume fractions of reinforcements lead to greater tool wear and damage [27]. These enhanced tool wear modes include edge chipping, grooving and notch wear [28,29,30]. The tool wear modes are generated during composite machining include two body and three body abrasion mechanisms caused by the mutual rubbing of the hard ceramic particles with the work surface and the tool flank face [31,32,33,34]. The abrasions between the ceramic particles and the work/tool surfaces is enhanced because of completely/partially pulled out, debonded and fractured particles leading to greater tool wear [35,36,37,38]. Additionally, the particle reinforcements improve the yield strength of the base metal alloy leading to high cutting force generation during machining. Alloy yield strength gets enhanced due to the numerous dislocations created by the particle inclusions in the matrix microstructure [26,39,40,41,42,43,44,45,46]. During machining, the dislodged and broken ceramic particles plough through the machined surface to generate higher machined surface roughness as compared to monolithic alloys [47,48,49,50]. In order to account for the various complex mechanisms active during MMC machining, the researchers categorised MMC machining forces into shearing, ploughing and particle fracture/debonding for improved force modeling and prediction [51,52,53,54]. These modeling theories are primarilybased on the seminal works of Merchant (orthogonal cutting model) [55], Oxley (slip line field model) [56] and Colwell (equivalent cutting edge concept) [57]. The Johnson–Cook’s constitutive equation [58] is also widely used by researchers to model shear stress generation during MMC machining. This model incorporates strain hardening, strain rate as well as thermal softening phenomena to predict material flow stress.
The foregoing discussion gives a brief insight into the complex nature of some aspects of metal matrix composites. Similarly, researchers have extensively worked upon other MMC aspects such as preparation methods, characterisation techniques, varied applications and more. In the present study, a detailed bibliometric analysis has been carried out to understand the important contributing authors, institutions, countries as well as the current and upcoming trends of this rapidly emerging field.
1.2. Bibliometric Studies
Bibliometric analysis complements the traditional literature reviews by providing an objective evaluation of the trends and future potential of a research area [59,60,61,62]. This analysis is useful to highlight the evolution of a particular research area over a period of years or decades [61]. There are many methods to review the scientific research developments in a particular field [63]. These methods can be categorised under two broad classifications—evaluative and relational reviews [64,65]. Evaluative reviews generally deal with the quantitative analysis of the absolute research impacts of research articles, authors, organizations and nations. This analysis includes various productivity metrics such as the number of publications, publications per year, number of citations and more [66,67,68,69]. Evaluative reviews can also be conducted qualitatively based on expert opinions of research impact metrics in a particular area [70]. On the other hand, the relational review methodology focuses on inter-relationships among the above-mentioned evaluative impact metrics. These inter-relationships are measured and expressed in terms of the number of collaborative outputs, collaborative linkages and respective link strengths. Other relational metrics include citations based linkages, co-occurrences and co-citations based analyses [71]. Co-authorship linkages are important indicators of knowledge sharing among different research groups [72]. Citation linkages are vital for understanding research relationships among productive authors and organizations [73]. Determination of linkage strengths reveals the extent of collaborations/co-citations across geographies [74]. The current study considers both evaluative as well as relational tools for a balanced bibliometric analysis of metal matrix composites research. Bibliometric surveys provide insights into the development of a research area over a time period of one or more decades [59,75]. These analyses typically yield vital information about research outputs of individual authors and respective affiliating organizations [68,69,76]; collaboration and citation networks among documents, authors, organizations and places [76,77,78]; trending topics and keywords [70,79]; top publishing journals, inter-journal linkages [66,80,81] and more.
The above mentioned bibiliometric results can be effectively analysed and displayed by employing visual data representation tools such as VoS viewer [82], CiteSpace [83,84], ATLAS.ti [85], BiPlot [86], BibExcel [87], Network Workbench [88,89], VantagePoint [90] and many more. Data visualization tools are vital for effectively communicating the analysis results as well as for quickly arriving at useful conclusions [91,92]. In the present work, VoSviewer and CiteSpace were utilized for the quantitative data analysis and visualization of MMC research published in WoS during 2001–2020. VoSviewer generates author and journal network maps based on bibliometric analysis of the collaboration/citation data. It can also create keyword maps showing inter-linkages among various co-occurring terms related to a research area [82,93]. CiteSpace is a Java application designed to analyse and visualize citation based networks [83], co-authorship links, time series analysis of important topics and citation/reference bursts [94].
Recently, few researchers have conducted bibliometric analysis on some aspects of metal matrix composites. Laad and Ghule [95] analysed MMCs reinforced with environment friendly silica. Vencl et al. [96] studied the tribological properties and applications of composite materials with special emphasis on eastern European nations. Saxena et al. [97] used bibliometric analysis to explore the impact of friction stir processing to produce MMCs for industry 4.0 applications. Ghule and Laad [98] conducted another bibliometric survey on energy storage applications of polymer matrix composites. Koo and Jeong [99] applied bibliometric analysis to survey research conducted only on carbon nanotube reinforced composites. Costa and Moura [100] analysed the performance of and strategy for the develpment of polymer matrix nanocomposites with a special emphasis on Brazil. Pecas et al. [101] reviewed various natural fibre composites including their applications using the bibliometric methodology. Bibliometric studies of general areas include an analysis of knowledge maps in metallurgy [102], applications of artificial neural networks in engineering [103] and an analysis of materials research in India with a focus on international linkages [104]. The above section shows that there is a need to report an in-depth, comprehensive bibliometric analysis on the subject of metal matrix composites. The present work aims to bridge this research gap by providing multi-dimensional insights to the researchers for identifying current and future trends in this exciting field.
1.3. Data Selection and Extraction
The web of science (WoS) repository was selected as the primary database for the bibliometric analysis carried out in the current study. This database is a premium collection of high quality and high impact research articles published in the most prestigious journals across the globe. It catalogues manuscripts published in indexed journals since the year 1990. The WoS core collection includes eight citation indices viz. Emerging Science Citation Index (ESCI), Science Citation Index Expanded (SCIE), Social Sciences Citation Index (SSCI), Arts and Humanities Citation Index (AHCI), Conference Proceedings Citation Index—Social Sciences and Humanities (CPCI-SSH), Book Citation Index—Social Sciences and Humanities (BCI-SSH), Conference Proceedings Citation Index—Science (CPCI-S) and the Book Citation Index—Science (BCI-S). This entire WoS core collection was searched for the keywords: (“nano” OR “aluminium” OR “machining” OR “fabrication” OR “characterization” OR ((“mechanical’ OR “electrical” OR “tribological”) In addition, “properties”) OR “mechanisms” OR “modeling” OR “preparation” OR “novel” OR “in situ” OR “scanning electron microscopy” OR “advanced” OR “carbon nanotube reinforced” OR “particle reinforced” OR “safety aspects of nano” OR “applications” OR “aerospace”) AND “metal matrix composites” for two decades spanning from 2001 to 2020. The search options were set to ’full record and cited references’ with regard to the aforementioned keywords. The search yielded a total of 10,018 research articles which were exported from the database in plain text forms on 3 June 2021. The most exact records matching the specified MMC keywords were obtained from the ESCI, SCIE, CPCI-S, CPCI-SSH and BCI-S indices. The following sections present and discuss the different MMC research insights revealed by the bibiliometric analysis.
2. Publication Distribution along Various Verticals
This section details upon the distribution of the searched articles on the basis of publication years, types, source titles, MMC research areas and their trends. Moreover, the top MMC research contributing nations, organizations, authors and their respective nationalities are also presented along with their respective publication counts.
2.1. Year on Year Vertical
The year on year progression of WoS research publications in the field of metal matrix composites is depicted in Figure 2. The x-axis of this figure shows the publication years from 2001 to 2020, whereas the y-axis depicts the WoS publication numbers. In addition, the exact publication counts for each year have been marked on top of the yearly publication bars. The figure shows a stagnant number of MMC publications from 2001 to 2006. These numbers started rising gradually from 2007, indicating an increasing interest in MMC research. The years 2016 and 2017 witnessed a significant jump in publication counts as compared to the previous years. In fact, the number of MMC articles published in WoS in the year 2017 tripled the number of manuscripts published in 2002. The MMC research outputs crossed 1000 WoS articles in 2018, with 2019 and 2020 registering almost similar publication levels. The year on year publications count analysis highlights the rising interest in MMC research sustained over a period of two decades.
The primary reason behind this phenomenon is the sheer variety of metal matrix compositions that can be prepared using various combinations of base alloys, particle inclusions, reinforcement fractions and processing techniques. There is also a rising interest in the synthesis and analysis of metal matrix composites infused with various nano particles. In addition, there is an almost limitless scope for MMC modeling, application specific deployments, conventional and non conventional MMC machining and much more. Hence, the interest of researchers in this ever green topic is likely to be sustained in the future as well. The following subsection discusses the diversity of the publication types in the area of metal matrix composites.
2.2. Publication Types
The complete corpus of 10,018 MMC publications obtained from the WoS database was categorized into research articles, proceedings, review papers, early access documents and more. All these publication types and their respective counts are pictorially depicted in Figure 3. Research articles (8068) make up a major chunk (80.54%) of the total publications. Proceedings’ articles (2198) form the second largest group of MMC publications (21.94%), whereas review articles (309) comprise 3.08% of the entire corpus. Book chapters (111) and early access manuscripts (44) on metal matrix composites contributed 1.11% and 0.44% to the total, respectively. Remaining publication types viz. letters, corrections, editorials, data papers, reprints and others constituted less than 0.25% of the exported database.
2.3. Publication Sources
This subsection provides insights into the top sources publishing metal matrix composite research indexed in WoS. Figure 4 indicates these sources and their respective published article counts through a colorful pictorial presentation. The source-wise distribution analysis shows that the journal ‘Materials Science and Engineering A: Structural Materials, Properties, Microstructure and Processing’ published maximum articles (640) in the field of metal matrix composites, comprising 6.39% of all published material. The ‘Journal of Alloys and Compounds’ stood second with 468 (4.67%) MMC publications. ‘Materials Today Proceedings’, ‘Materials Design’, Composites Part A Applied Science and Manufacturing’ and ‘Composites Part B Engineering’ published the third (435, 4.34%), fourth (273, 2.73%), fifth (200, 2.00%) and sixth (199, 1.99%) biggest number of MMC papers during 2001–2020. The other journals to make it to the top ten MMC publisher list were ‘Materials Science Forum’ (seventh), Composites Science and Technology’ (eighth), ‘Journal of Composite Materials’ (ninth) and ’Journal of Materials Processing Technology’ (tenth). These journals published 187 (1.87%), 185 (1.85%), 160 (1.60%) and 157 (1.57%) articles during the surveyed period, respectively.
2.4. Research Directions
After the previous subsection on the distribution of the publication sources, the present sub section throws light on the various research directions focused by investigators in the field of MMCs. Figure 5 provides these research directions with their specific article counts filtered by the WoS corpus search. The analysis results indicate that the maximum publications (7580, 75.66%) were categorized under the general topic of ‘materials science’, indicating the materials specific focus of most articles. The topic of ‘metallurgy/metallurgical engineering’ emerged as the next most investigated area (3242, 32.36%). This indicates the number of articles dedicated to the various processing methods of the metal matrix composites. The next most significant chunk of the publications (2703, 26.98%) belonged to the general area of ‘engineering’, indicating a more general engineering based approach to the problems associated with MMC fabrication, machining and testing. Similarly, ‘science technology and other topics’ included 1082 (10.80%) articles, showing the percentage of investigations into novel scientific and technological aspects of metal matrix composites. The articles dealing with the physical and chemical properties of the various particulate materials and corresponding reinforced metal matrices numbered 839 (8.38%) and 738 (7.37%), respectively. About 436 (4.35%) articles reported investigations upon the various mechanics and mechanisms involved in processing and machining these advanced materials. Researchers also published 151 (1.51%) papers aimed at the integration of MMC machining aspects in industrial control systems for automated manufacturing. In addition, 83 articles focused on the mining, extraction and treatment of micro and nano particles for imparting desirable properties to the reinforced base metal alloys. Investigators also worked on applications of metal matrix composites in the field of and fibre optics and optical instruments (72 articles). Figure 6 depicts the publication trends of each of the above-mentioned research directions during 2001–2020. These results clearly indicate the prevalence of ‘materials science’ as the highest trending general research area in the field of metal matrix composites. It is readily evident that the majority of all published MMC articles have ‘materials science’ as their central theme. The next most important trending topics are ‘metallurgy metallurgical engineering’ and ‘engineering’, implying the ever increasing general interest in processing, machining and engineering applications of various MMCs. The related topics of ‘science technology’, ‘chemistry’ and ‘physics’ witnessed moderately incremental interest over the past two decades. Research areas such as ‘automation control systems’, ‘mining mineral processing’ and ‘optics’ do not indicate any upward publication trend. Hence, these research directions offer maximum opportunities for carrying out novel MMC investigations.
2.5. Popular Places Vertical
This subsection focuses on the top ten publishing nations that have contributed MMC articles in WoS—Peoples Republic of China, India, USA, Germany, Iran, Turkey, South Korea, England, Japan and France. Figure 7 depicts the publishing trends of these countries across twenty years starting 2001. It is evident from this figure that, during the initial years (2001–2004), researchers affiliated with the USA were publishing the most MMC papers of all (60 papers published under USA affiliation in 2004). However, the Chinese authors surpassed the annual MMC research output of USA from 2005. The MMC publications of People’s Republic of China witnessed a steady rise from 2001 (48 publications) to 2020 (260 articles); and Chinese authors published the maximum number of articles in WoS till the year 2012 (114 papers). However, post 2012, the MMC publication output of the Indian researchers surpassed that of their Chinese counterparts. The number of Indian author publications in MMCs soared steeply during 2015 (134 articles)—2020 (415 WoS papers); and this count is expected to continue its upward trend. In comparison, the MMC research output of the USA authors increased marginally over the last two decades (from 62 articles in 2001 to 81 articles in 2020). Similarly, the number of MMC publications of the remaining countries in the top ten remained below 50 per year with no signs of any significant upward trend to be expected in the near future. The highest annual publication counts of these countries stand as follows: Germany—41 (2014), Iran—50 (2018), Turkey—31 (2020), South Korea—25 (2011, 2017 and 2018), England—41 (2019), Japan—30 (2001) and France—38 (2018). The next subsection throws light upon the flagship institutions whose researchers have published the maximum number of MMC articles.
2.6. Productive Organizations and Researchers Vertical
This subsection discusses an analysis of the top ten institutes publishing MMC related articles in WoS during 2001–2020. Figure 8 shows that the Harbin Institute of Technology, China published the maximum number (335, 3.34%) of WOS papers in the field of metal matrix composites. The Shanghai Jiao Tong University, China published the second highest number (271, 2.71%) of WoS articles during 2001–2020. It was followed by the Chinese Academy of Sciences with a total of 227 (2.27%) publications in MMCs. The Indian Institutes of Technology arrived a close fourth with 225 (2.25%) publications during the same period. The National University, Singapore bagged 162 (1.62%) articles on MMCs, whereas the researchers at the National Institutes of Technology, India published 156 (1.56%) articles on MMCs. These were followed by the Northwestern Polytechnic University, China and the University of Science and Technology, Beijing, China with 132 (1.32%) and 118 (1.18%) publications, respectively. Finally, the Anna University, India and the Islamic Azad University, Iran arrived ninth and tenth on this list, wherein the affiliated researchers published 113 (1.13%) and 108 (1.08%) WoS papers on MMCs, respectively. This analysis showcases the detailed affiliations of the Chinese and Indian authors contributing significantly to the metal matrix composites research over the past two decades.
Figure 9 depicts the top 13 Indian institutions publishing MMC papers in WoS. Researchers affiliated with the group of Indian Institutes of Technology published the maximum articles (225) during 2001–2020. They were followed by the authors belonging to the group of the National Institutes of Technology, with 156 papers published in WoS. The Anna University arrived third with 113 papers, whereas the Council of Scientific Industrial Research (CSIR) came fourth with 75 articles in WoS. Other top publishing Indian institutions included the Indian Institute of Science, PSG College of Technology, Annamalai University, Vellore Institute of Technology, Siddaganga Institute of Technology, Amrita Vishwa Vidyapeetham, Thapar Institute of Engineering Technology and the Coimbatore Institute of Technology with 51, 47, 46, 39, 37, 32, 32 and 31 MMC papers in Web of Science, respectively.
Table 1 lists the top ten researchers worldwide with maximum MMC publications in WoS. Although the topmost contributing author hails from Singapore (Gupta M, 140 articles, 1.40% of total corpus), all of the next nine top authors are affiliated with Chinese institutions. This analysis highlights the presence of high output MMC research groups in China. The next section showcases an analysis of the various research collaborations in the field of MMCs.
3. Collaboration Analysis
Collaboration is very important for useful sharing of knowledge, ideas and resources among the national/international research community. Collaborative teams tend to be more productive, efficient and innovative. The following subsections present analyses of MMC research collaborations at various levels, viz. researchers, organizations and countries. In the present work, VOSviewer software was utilised for obtaining the MMC collaboration insights.
3.1. Collaboration among Researchers
For researcher–collaboration analysis, the VoSviewer threshold was set at a minimum of five documents and zero citations per author. This criteria was met by 1616 authors out of a total of 16,735. These 1616 authors were examined for mutual co-authorship links and the researchers with the greatest total link strengths (TLS) were ranked. The VOSviewer revealed that these authors produced 1429 WoS articles through their mutual collaborations! The top ten collaborative researchers in the field of metal matrix composites are listed in Table 2. The column ‘P’ refers to the number of MMC articles published by the respective authors in WoS during 2001–2020. ‘Links’ column refers to the total number of investigators in collaboration with each of these authors (appearing as co-authors in ‘P’ publications). Thus, each link represents a collaboration between two researchers. The strength of this link is determined on the basis of the number of published articles featuring these two researchers. The total link strength of a researcher is computed as the sum of the strengths of all his/her links.
Table 3 and Table 4 clearly depict the difference between the scale of co-author linkages of Fan G and Wang X. The top six collaborators of Fan G have many more joint publications with Fan G (minimum 22 articles) as compared to the number of joint publications of the top most collaborator of Wang X (17 papers). Therefore, higher research outputs may not always correspond with higher collaboration strengths. In fact, some authors, like Gupta, M with high research outputs (Table 1) are not even mentioned in the top ten TLS rankings because of their lower collaboration linkages (60) and corresponding link strengths (TLS 223). Figure 10 shows the collaboration network map of the 1616 researchers with their respective inter-linkages. This map highlights different network groups in different colors and shows link thicknesses based on the respective link strengths. Moreover, Figure 11 depicts the collaboration network of the author with the highest TLS as per Table 2, i.e., Zhang D. This figure provides information of the collaborative linkages and the relative link strengths of this author at a glance. Herein, the respective author ‘nodes’ are depicted with varying sizes depending on their individual TLS values. It is evident from the link ‘thicknesses’ that Zhang D. has more publications with co-authors such as Li Z, Su Y, Tan Z, Fan G and Guo Q relative to the number of articles produced with Ji G, Zhang J, Li S, Guo X and others. On the other hand, Figure 12 shows the collaboration network of Gupta M, the author with the most MMC publications in WoS. It may be noted that this author does not figure in the list of researchers with the top ten TLS values. This occurrence is readily understood on mutual comparison of the two author’s (Gupta M and Zhang D) collaboration networks. Figure 12 shows that both the collaboration authors’ nodal weights (TLS of co-authors) as well as the collaboration link strengths (number of articles published in every collaboration) of Gupta M are lesser in comparison to those of Zhang D.
As is evident from Table 2, all MMC researchers with the top ten TLS hail from China. Together, these researchers were able to publish a comparatively larger number of WoS articles. It may be observed that some researchers with lesser number of publications/links have higher TLS values over some of their colleagues with more WoS articles. This is due to the higher number of co-authors collaborated by these researchers in a comparatively lesser number of articles. For instance, Fan G has 46 articles and 48 links in comparison to the 80 papers and 133 links of Wang X. Still, Fan G has higher TLS of 288, whereas the TLS of Wang X is 286. This implies that Fan G included many more co-authors per paper as compared to Wang X.
3.2. Collaboration among Organizations
This subsection discusses the analysis results pertaining to the collaboration networks among various organizations involved in the metal matrix composites research. For this analysis, the VoS viewer thresholds were set at a minimum of five documents and zero citations per organization. About 801 institutes met these criteria out of a total of 4462 organizations. At the outset, the analysis revealed a total 765 articles penned through inter-institute collaboration networks. This number is far lesser than the total number of articles (1429) published through researcher networks, highlighting the scope to improve cross organizational research networking. Table 5 depicts the top thirteen institutes with the highest TLS values. Five of these institutions hail from China, three from India and one each from Singapore, Afghanistan, USA, Germany and Japan. These numbers indicate higher inter-institute collaboration environment present in Chinese organizations over others. It is interesting to note how Anna University, India scores slightly better TLS of 95 in comparison to the National Institutes of Technology, India (TLS 91, links 45, papers 155) despite having less WoS publications (112). This observation highlights the higher number of co-authors from different institutes collaborating per paper published by the Anna University researchers over those of the National Institutes of Technology. Table 6 and Table 7 list the top collaborators of these two organizations for a deeper analysis of their respective link strengths. The Anna University researchers have collaborated with those from Sri Sivasubramaniya Nadar College of Engineering, University College of Engineering Kancheepuram and the University of Witwatersrand (South Africa), among others. On the other hand, the MMC investigators affiliated with the National Institutes of Technology have scored joint publications with their collaborators at the Indian Institutes of Technology, Jadvapur University (India), Indian Institute of Science and the National University Singapore among others. A similar observation may be made (Table 5) with regard to the Leibniz Institute for Solid State and Materials Research, Germany (TLS 68, links 25, papers 33) and the Nanjing University of Aeronautics and Astronautics, China (TLS 63, links 22, papers 78), wherein the former institute has better inter-institute collaborations in lesser publications as compared to the latter organization.
Figure 13 shows a pictorial representation mapping the inter-institute research networks in the field of metal matrix composites. This figure shows collaborative networks of the top TLS institutes (Table 5) in different colored nodes and linkages. For instance, the light blue colored network headed by the Indian Institutes of Technology depicts the various partner universities like the Indian Institute of Sciences, Siddaganga Institute of Technology, Amrita University and Visvesvaraya Technological University, among others. Similarly, the red colored network of Amrita University is joined by institutions such as the National Institute of Technology Tiruchirapalli, Thiagarajar College of Engineering, Covenant University and the University of Johannesburg among many more.
3.3. Collaboration among Places
For a macro perspective of MMC research collaborations amongst various nations, the VoS viewer thresholds were set at five documents and zero citations per country. These conditions were met by 67 countries out of a total of 93. Table 8 lists the top thirteen countries with the highest TLS values. Once again, the People’s Republic of China tops the list with a TLS of 681, featuring 2475 WoS publications and 42 linkages with international co-authors. Interestingly, Indian authors published the maximum number of articles (2509) in WoS during 2001–2020. However, Indian researchers feature neither in the list of top ten publishing authors (Table 1) nor in the list of the top ten TLS researchers (Table 2). This unique observation provides insights into a large number of Indian researchers publishing less MMC articles per author with relatively lesser collaborations. Another remarkable observation is with respect to the comparison of MMC research outputs of USA and India. The researchers affiliated with the USA scored higher international co-author linkages (47) and greater publications via these linkages (TLS 537) despite publishing much fewer WoS articles (1104) as compared to India (links 45, TLS 350, papers 2509). This observation also highlights the greater international collaboration oriented research environment prevalent in the USA as compared to India. Table 9 and Table 10 depict the international co-author linkages of these two nations. The MMC investigators of USA have a large number of co-authored publications with Chinese authors. In comparison, their collaboration with Indian authors is far less. The Indian authors, on the other hand, have their maximum collaborations with the researchers based in the USA. Their collaborations with other nationals are still lesser in quantity. Similarly, the French researchers exhibit better international links (36) and TLS (259) over their Japanese counterparts (links 28, TLS 186, papers 312) despite having lesser publications (282). The same trend is evident among the Canadian (TLS 155, links 27, papers 259) and the Iranian (TLS 145, links 26, papers 463) researchers working on metal matrix composites. This pattern is repeated by the researchers located in Australia (TLS 142, links 23, papers 172) over their colleagues situated in Spain (TLS 130, links 26 and papers 245). Thus, the researchers of India, Japan, Iran and Spain need to improve international collaborative linkages in proportion to their respective MMC publication outputs.
Figure 14 shows a colorful representation of the various international MMC research collaboration networks. This figure depicts international networks of the top TLS nations like the People’s Republic of China, USA, India, England, Canada and Spain using distinct colors. Figure 15 shows the international collaboration network of the People’s Republic of China, the country with the maximum TLS. This figure reveals strong collaborations of Chinese researchers with their colleagues in Japan, Australia and South Korea. There is also a strong linkage among the networks of Chinese and USA investigators. Furthermore, this figure indicates relatively minor inter linkages of Chinese authors with international collaborators from India, Egypt, England, Canada, Iran, Spain, Denmark and North Ireland. Similarly, Figure 16 depicts international linkages from the perspective of MMC researchers located in India. The Indian authors’ led network includes participants from Singapore, Egypt, Saudi Arabia, Qatar, Oman, United Arab Emirates, Norway and others. Indian researchers have also collaborated with the investigators of other international networks such as Germany, Austria, Poland, Sweden, Brazil, Spain, Chile, Mexico, South Africa and Japan. Lastly, Figure 17 showcases the diverse network span of USA led MMC research. The USA researchers have international collaborations with MMC investigators from Germany, Austria, Hungary, Turkey, Slovenia, Taiwan, Ethiopia and South Africa. Their cross network linkages include India, England, Spain, Canada, Poland and Japan. With regard to the relatively smaller networks, researchers of England published MMC articles in collaboration with their contemporaries located in Wales, Portugal, Romania, Brazil, Malaysia, Iraq and others (Figure 14). Lastly, the researchers of Canada and Spain worked together on MMCs with partners from Chile and others (Figure 14).
4. Citation Landscapes
Citations are an important indicator of the actual research impact of a published article. This section presents an analysis of the MMC articles’ citations and citations based linkages during 2001–2020. The MMC article citation analysis has been categorized as per the cited papers, associated/linked researchers, organizations, countries, publishing sources and keywords to understand the relative impacts of MMC research outputs under these classifications.
4.1. Citation Landscape of Published Articles
The first subsection of citation landscapes is concerned with the MMC publications having topmost citation based linkages with other WoS documents in the same field. The VoS viewer threshold was set at a minimum of five citations per document. Out of a total of 10,018, 5796 documents fulfilled this criterion. Of these, 5381 number of documents were found to be linked together by mutual citations. Table 11 shows the top ten WoS documents having the highest number of citations based links with other MMC articles of the selected database. Of these, three articles (Bakshi et al., 2010; Tjong, 2013; Tjong, 2007) [105,106,107] are concerned with the review, processing and properties of the nano particle reinforced metal matrix composites. Another three papers (Kok, 2005; Torralba et al., 2003; Chawla et al., 2001) [108,109,110] are related to the production and mechanical properties of particle reinforced MMCs. Two articles (Hashim et al., 2002 and Shorowordi et al., 2003) [111,112] deal with the microstructural analysis of processed metal matrix composites that includes the study of particle distribution and particle–matrix interface characteristics. The remaining two papers (Miracle, 2005 and Mortensen, 2010) [113,114] address general review of metal matrix composites and associated science, technology and application aspects. Figure 18 shows the mutual citation network graphs of the MMC articles published in WoS during 2001–2020.
4.2. Citation Landscape of Researchers
To determine the citations based links among various MMC researchers, the VoS viewer threshold was set at a minimum of five documents and zero citations per author. Of the total of 16,735 authors, only 1616 met this criterion. Together, these 1616 authors cited each other in 1612 WoS articles. Table 12 lists the top thirteen authors sorted as per their TLS values. The table also lists their nationalities, number of publications in WoS, citations and mutually cited author links. This list is primarily dominated by Chinese authors, with an author each from Singapore and Australia. It may be observed that Gupta M has the highest citations (3546) for 140 documents published in WoS. In comparison, Zhang D has 3278 citations for 113 published articles. Nevertheless, Zhang D has more mutually cited author linkages (777) than those of Gupta M (738). Similarly, Zhang D has a higher sum of mutual citations with all network links (TLS 7016) as compared to that of Gupta M (TLS 3287). Interestingly, Gupta M does not figure in the top ten co-author TLS listings (Table 2) but attains the eighth spot in the citations based TLS rankings. This indicates that this author may not have a high number of co-authored works but has a good number of mutually cited articles in WoS. Analyzing the Table 2 and Table 12 further, it is evident that six researchers feature in both of these lists—Zhang D, Li Z, Li J, Guo Q, Fan G and Wang X. All of these authors are from China. This analysis provides insights into the level of collaboration and mutual citations based linkages among the MMC authors of China. There are some authors having high collaborative linkages but not having enough citation linkages—Liu, Wang H, Zhang Y and Li Y. Conversely, authors such as Su Y, Gupta M, Tan Z, Ji G, Xiong Db, Wu G and Chen Z have very good citation networks but moderate collaborative linkages. Table 13 and Table 14 list the top ten mutually cited author links of Zhang D and Gupta M along with their respective link strengths for a comparative analysis. For instance, Zhang D and Li Z have cited each other’s WoS articles 334 times, whereas Zhang D and Li J have cited each other’s papers only 70 times. On the other hand, Gupta M and Tun Ks have cited each other’s article 112 times, whereas Gupta M and Adeva P referenced each other’s articles in only 31 instances. Figure 19 shows the network map of mutually cited authors in the field of metal matrix composites.
4.3. Citation Landscape of Organizations
This subsection analyses the citation based links among the various organizations of the MMC researchers. For this analysis, the VoS viewer thresholds were set at a minimum of five documents and zero citations per organization. About 801 organizations qualified this criterion from a total of 446. These organizations cited each other’s WoS articles 800 times. Table 15 lists the top thirteen organizations having maximum mutually cited TLS values in their respective networks. It may be observed that the Nanjing University of Aeronautics and Astronautics (NUAA) is missing from this list. This university was listed at number 12 in the top co-authored TLS list (Table 5). On the other hand, the University of Wisconsin-Madison, featuring at number thirteen in Table 15, did not appear at all in the top co-authored TLS list (Table 5). This observation delineates the difference between the co-authored and mutually cited linkages. For instance, the Chinese Academy Science is the top listed co-authored TLS institution (Table 5), whereas it only has the fourth highest TLS of mutual citations (Table 15). Conversely, the Shanghai Jiao Tong University is only the fourth highest co-authored TLS scoring institution in Table 5, whereas it has the highest mutual citations among its links making it the topmost TLS university (Table 15). Similarly, in Section 3.2, it was pointed out that the Anna University attained higher co-authored TLS over the National Institutes of Technology (India) despite having relatively less publications in WoS. This scenario is reversed in the case of citations based TLS rankings, wherein the National Institutes of Technology has much higher TLS value (2187) as compared to that of the Anna University (1602). These observations indicate higher mutual citation linkages for lower co-authored linkages or vice versa in the case of the above-mentioned institutions. Other organizations like the Indian Institutes of Technology, National University of Singapore and Northwestern Polytechnic University maintained their respective positions viz. third, fifth and ninth spots in both of the top co-authored as well as citations based TLS listings. These organizations exhibited balanced levels of collaborative as well as citation linkages amongst their network institutions. Taking a macro view of the co-authored and citation TLS lists, it is evident that mostly the same organizations feature in both of these top rankings. Hence, it may be inferred that inter-institute research collaborations lead to inter-institute citation links as well. In addition, the citation TLS values tend to be much higher than the co-authored TLS numbers. For example, the highest mutually cited TLS value is 4463 (of Shanghai Jiao Tong University), whereas the greatest co-authored TLS values is just 212 (of Chinese Academy Science). Table 16 and Table 17 show the top ten citations based organizational links of the National Institutes of Technology and Anna University, India. It is evident that the MMC researchers of the National Institutes of Technology and the Indian Institutes of Technology have cited each other 73 times. On the other hand, MMC investigators at the Anna University and the National Institutes of Technology have cited each other’s MMC WoS papers on 49 occasions. The Harbin Institute of Technology has equal citations link strength of 29 with both the National Institute of Technology as well as the Anna University. However, Gazi University (Turkey) has varying citation link strengths of 30 and 15 with the National Institutes of Technology and the Anna University, respectively. Figure 20 shows the citation based inter-institutional networks in different colors.
4.4. Citation Landscape of Places
To determine the citation based linkages for MMC research among various countries, the VoS viewer threshold was set at a minimum of five WoS documents and zero citations per nation. Only 63 countries met this criterion out of a total of 97. Table 18 shows the top thirteen countries having the best citations based TLS values. Compared with the collaboration TLS rankings given in Table 8, it may be observed that the People’s Republic of China has topped both the lists. The authors of this country have maximum co-authored links (681) in MMC papers as well as the highest number of mutual citations (20,878) in these WoS articles. India, listed as the nation with the third highest co-authored linkages (350), bagged the second spot in international citation linkage rankings (17,501). Conversely, the USA attained the third highest citation linkages (13,112), although it has the second highest co-authored links (537) in its MMC articles. Similarly, nations like Germany, England, France, Japan, Canada and Spain also attained relatively lower citation based TLS ranks as compared to their respective co-authored works based TLS rankings. However, some countries improved their citation rankings over collaboration ranks. These countries included India, Iran and South Korea. Australia maintained the same rank in both listings. The biggest rankings difference is observed in the case of Iran. Iran has the fourth highest mutually cited TLS (5938), whereas it is ranked only ninth in the co-authored MMC research linkages based TLS (145). This analysis shows that Iranian researchers have relatively higher mutual citations with their international colleagues as compared to other top TLS nations; and lesser internationally co-authored publications against the rest of the top linked countries. Table 19 lists the top ten countries having MMC articles’ citation based linkages with the Iranian authors. The top three linked nations are India, People’s Republic of China and the USA having their mutual MMC citation link strengths with Iran at 1407, 988 and 568, respectively. Figure 21 depicts the citation network graph among the various countries engaged in MMC research, whereas Figure 22 shows the international citation linkages of Iranian authors.
4.5. Citation Landscape of Sources
The citation landscape of publication sources was determined using the VoS viewer threshold of a minimum of five WoS documents and zero citations per source. Out of a total of 1471 sources, only 270 made it to the threshold limit. Table 20 shows the list of journals having the highest citations based TLS values. This table gives source-wise numbers of MMC papers published in WoS, their citations, number of journals linked via mutual citations and the total strengths (TLS) of these linkages. Considering the relative metrics of the International Journal of Advanced Manufacturing Technology (TLS rank 11) and Scripta Materialia (TLS rank 12), it may be observed that the former source has higher publications, lower citations, lower links and higher TLS as compared to the latter journal. This observation indicates that, in case of International Journal of Advanced Manufacturing Technology, the number of mutual citations per link is much greater than that of Scripta Materialia. Table 21 and Table 22 show the top ten citation based links of these two journals. The Journal of Materials Processing Technology is the strongest citation link for the International Journal of Advanced Manufacturing Technology with 187 mutual citations in WoS. Similarly, the Materials Science and Engineering: A—Structural Materials: Properties, Microstructure and Processing is the link with the highest strength, i.e., having the maximum number of mutual citations with the MMC articles published in Scripta Materialia during 2001–2020. A similar analysis shows that the Acta Materialia (rank 9, articles 131, citations 7726, links 172, TLS 1983) has more publications, citations and TLS despite having lesser linkages as compared to the journal Wear (rank 10, articles 129, citations 6007, links 191, TLS 1883). Figure 23 shows the citation based linkages between the various sources publishing MMC papers in the WoS. Figure 24 shows citation linkages of the top ranked TLS source—Materials Science and Engineering: A—Structural Materials: Properties, Microstructure and Processing.
4.6. Co-Occurrence Landscape of Keywords
This subsection describes the co-occurrence based analysis of the technical keywords most quoted by the MMC researchers in their WoS articles. For this analysis, the WoS viewer threshold was set at a minimum of five occurrences per keyword. From a total of 11,569 keywords, only 1068 could qualify for this condition. Table 23 lists thirteen keywords with top TLS values based on co-occurrence links with other keywords appearing in MMC publications. It is evident that the keyword ‘Metal Matrix Composites’ is the top TLS keyword having 2135 occurrences in WoS documents. It has co-occurred with 845 other keywords, with a total strength of such linkages at 5566. It is interesting to note that the fifth, eighth and the tenth ranked keywords, viz. ‘Metal-Matrix Composites (mmcs)’, ‘Metal Matrix Composite’ and ‘Metal-Matrix Composites’ are instances of the top TLS keyword itself. Similarly, the sixth and the thirteenth ranked keywords—‘Composites’ and ‘Composite’ are also generalized versions the keyword with the highest TLS. Thus, six out of the thirteen top co-occurred keywords refer to the same term. The second ranked keyword ‘Mechanical Properties’ indicates the focus of most WoS articles on investigating the physical properties of the MMCs for varied applications. The fourth and ninth ranked keywords—‘Wear’ and ‘Hardness’ reveal the most important mechanical properties considered by researchers during MMC performance tests. Similarly, the keywords ranked seventh and eleventh—‘Powder Metallurgy’ and ‘Stir Casting’ indicate the most important techniques explored by various researchers for preparing MMCs of various compositions. After mechanical properties, the next most widely studied aspect of MMCs is ‘Microstructure’, listed as the third highest TLS keyword in WoS articles. Lastly, the twelfth ranked keyword—‘Aluminium’ indicates the favorite base metal alloy material used most widely by the researchers for processing MMCs with different micro/nano particulate inclusions. Figure 25 shows the network map of these and other keywords co-appearing in WoS articles during 2001–2020. These figures show inter-linkages among keywords belonging to various MMC materials, methods of preparation, characterization, testing, analyses, processing/machining and applications. Figure 26, Figure 27 and Figure 28 showcase the co-occurrence based linkages of the top three MMC keywords for deeper insights into their individual networks. For instance, the top TLS keyword ‘Metal Matrix Composites’ is connected to keywords related to MMC materials like nano structured materials and processing techniques such as the spark plasma sintering, selective laser melting, mechanical alloying, laser cladding, powder processing and friction stir processing among others. The term ‘Metal Matrix Composite’ is also connected to keywords pertaining to the properties such as tensile strength, plastic deformation, fracture, fatigue, residual stress, wear resistance and damage mechanics. The analyses based links of ‘Metal Matrix Composites’ include electron microscopy, thermal analysis, liquid-solid reactions, neutron diffraction, finite element analysis and modeling. Similarly, the keyword ‘Mechanical Properties’ is linked to important terms such as damping capacity, electrical properties, strengthening mechanism and tribological properties. Lastly, the keyword ‘Microstructure’ is connected to related terms such as transmission electron microscopy and SEM (scanning electron microscopy) among others.
5. Burst Detection Analysis
Burst detection analysis reveals the specific time periods wherein particular keywords and/or sources witnessed sudden increase in research interest (indicated by the number of citations) [63]. In the current study, burst detection analyses of keywords and references related to MMCs were carried out based on the research published during 2001–2020.
5.1. Keyword Burst Detection
Burst detection for the MMC keywords used by WoS articles during 2001–2020 was analysed using the CiteSpace software tool. Table 24 shows the top MMC research related keywords ranked as per their relative burst strengths, i.e., the degrees of sudden increase in their respective citation frequencies. As per this list, the keyword ‘graphene’ witnessed the highest spike in citations as compared to all other keywords related to MMC research. CiteSpace determined the strength of ‘graphene’ keyword burst at 33.6453. Moreover, this burst assumes additional significance because of its latest burst duration, i.e., 2018–2020. This particular citation spike indicates a sudden increase in nano-scale particle reinforced metal matrix composites research in the last two years. During the first decade of this century, keywords like ‘fracture’, ‘damage’, ‘deformation’, ‘creep’, ‘flow’, ‘residual stresses’ and ‘particulate composites’ witnessed citation bursts with respective strengths of 24.5309, 24.1626, 22.9149, 20.4049, 16.3026, 15.6975 and 15.6215. These citation bursts indicate an initial interest in the investigation of various mechanical properties of the developed composite materials. Later on, this focus gradually started shifting towards the novel processing techniques, indicated by the citation bursts of keywords like ‘powder processing’, ‘metal matrix composites (mmc)’ and ‘pressureless infiltration’ with burst strengths of 15.1708 (2007–2016), 14.8633 (2006–2011) and 14.2745 (2006–2011), respectively. During the last four years, MMC researchers have favored keywords (including ‘graphene’) like ‘strengthening mechanism’, ‘stir casting’, ‘nanocomposite’ and ‘B4C’ having burst strengths of 20.45 (2017–2020), 19.9426 (2018–2020), 16.9666 (2016–2018), and 13.6994 (2018–2020), respectively. These citation bursts indicate a renewed emphasis on mechanisms and methods of preparing different metal matrix composites. In addition, the recent keyword bursts also indicate a lot of researchers exploring various kinds of nanocomposites reinforced with particulate materials like graphene and boron carbide for various applications.
5.2. Reference Burst Detection
References burst detection analysis was also carried out using the CiteSpace software to gain insights into the top MMC articles that received the highest citation bursts during 2001–2020. Table 25 lists fifteen publications having the highest burst strengths based on citations in WoS. Three of these articles (ranked 1, 2 and 15) are review papers dealing with the different particle reinforced metal matrix composites [115,116], associated preparation techniques and characteristics [117]. The remaining papers (ranked 3 to 14) reported investigations into specific mechanical properties of MMCs such as deformation [118], tensile strength [119,120], creep [121], fracture [122,123], dislocation generation [41,124], ductility [125], elastic energy [126] and others [127]. It may be observed that all of these articles were published before 2001. Seven of them were published during 1991–2000 and six articles were published during 1981–1990. Two papers were published as far back as 1973 and 1957! This analysis shows that researchers have been working on metal matrix composites for the last five decades. All of the fifteen strongest citation bursts have been attained by the articles published before 2001, with zero instances of the MMC articles published during 2001–2020. In fact, all of these citation bursts have been recorded during the initial period of 2001–2005. Referring to Figure 2, it may be observed that relatively fewer MMC papers were published in WoS in that period. Hence, the documents with top burst strengths were cited at high frequencies by the MMC papers published during 2001–2005. In addition, none of the top cited articles listed in Table 11 have made it to the top citation burst list. This observation implies that the top cited MMC articles did not receive their respective citations in the form of short-term high frequency bursts.
6. Conclusions
This paper presents a comprehensive bibliometric analysis of metal matrix composites research articles published in the web of science database during the last two decades. The MMC related keywords generated a corpus of 10,018 articles from indices such as SCIE, ESCI, CPCI-S, CPCI-SSH and BCI-S. The bibilometric analysis was carried out under four major categories—publications distribution along different verticals, collaboration analysis, citation landscapes and burst detection. The first category of publication distribution was comprised of verticals such as year on year number of articles, publication types, sources, research directions, productive places, organizations and researchers. The second category included analysis of collaboration among various MMC researchers, affiliating organizations and countries. The third category dealt with mutual citation based linkages among MMC articles, researchers, organizations, places and sources. This section also included a co-occurrence based analysis of MMC related keywords quoted by researchers in their WoS articles. The fourth category provided insights into the top keywords and documents that witnessed strongest citation bursts during the last two decades. Following are the primary findings of the entire bibliometric analysis of metal matrix composites research presented in the current study.
- 1.
- The MMC related keywords’ search yielded a total of 10,018 articles from the WoS database.
- 2.
- The number of MMC publications in WoS started rising after 2005. In 2018, 1001 articles were published as compared to just 269 in 2005.
- 3.
- Research articles comprised 80.54% of all publications. Other publication types include proceedings (21.94%), review articles (3.08%), book chapters (1.11%) and early access manuscripts (0.44%).
- 4.
- The journal ‘Materials Science and Engineering A: Structural Materials, Properties, Microstructure and Processing’ published the maximum MMC articles (640 papers) in WoS (6.39% of total corpus). The ‘Journal of Alloys and Compounds’ published 468 (4.67%) articles whereas ‘Materials Today Proceedings’ contributed 435 (4.34%) papers in WoS.
- 5.
- ‘Materials science’ emerged as the most significant research direction with 7580 (75.66%) WoS publications. ‘Metallurgy/metallurgical engineering’ was the second most important research direction with 3242 (32.36%) articles. The third highest number of MMC articles (2703, 26.98%) were categorized under the general research direction of ‘engineering’, dealing with the various engineering aspects of MMCs. These three research directions witnessed steadily increasing publication trends during 2001–2020.
- 6.
- There is a lot of scope in the MMC research directions pertaining to ‘automation control systems’, ‘mining mineral processing’ and ‘optics’.
- 7.
- Researchers affiliated with the USA published the most MMC articles during 2001–2004 (60 papers in 2004). From 2005 to 2012, Chinese authors published the maximum number of WoS papers (114 papers in 2012). Post 2012, Indian investigators contributed maximum articles in WoS (415 papers in 2020).
- 8.
- Globally, the Harbin Institute of Technology, China published the maximum number of WOS papers (335, 3.34%) in the field of metal matrix composites. The Shanghai Jiao Tong University, China (271 papers, 2.71%) and the Chinese Academy of Sciences (227 papers, 2.27%) contributed the second and third highest number of MMC articles in WoS.
- 9.
- Among Indian organizations, the Indian Institutes of Technology published the maximum articles (225) followed by National Institutes of Technology (156 papers) and Anna University (113 papers).
- 10.
- Gupta M (Singapore) published the most MMC papers (140, 1.40%) followed by Zhang D (China) and Wu Gouhua (China) with 97 (0.97%) and 86 (0.86%) publications, respectively.
- 11.
- Zhang D, Li Z and Li J emerged as the MMC researchers with the topmost collaboration based total link strength (TLS) values of 499, 443 and 421, respectively. They published 113, 97 and 117 papers with 108, 110 and 184 co-authors, respectively. Gupta M did not make it to the top ten collaborative TLS list despite having maximum MMC publications due to less co-author linkages and respective link strengths.
- 12.
- The top three organizations with the maximum inter-institute collaborative TLS values are the Chinese Academy of Science (papers 227, links 73, TLS 212), Harbin Institute of Technology, China (papers 335, links 7, TLS 162) and the Indian Institutes of Technology (papers 223, links 71, TLS 154).
- 13.
- Among the Indian organizations, Anna University attained better inter-organizational collaborative TLS value of 95 as compared to the National Institutes of Technology (TLS 91) despite publishing fewer MMC papers in WoS.
- 14.
- The People’s Republic of China, the USA and India attained the highest international collaborative TLS values of 681, 537 and 350, respectively. The authors affiliated with these countries published 2475 (links 42), 1104 (links 47) and 2509 (links 45) articles, respectively.
- 15.
- The MMC researchers of India, Japan, Iran and Spain need to improve international collaborative linkages in proportion to their respective MMC publication outputs.
- 16.
- 17.
- Zhang D, Li Z, Fan G (all from China) were the top ranked MMC researchers with the highest mutual citations based TLS values of 7016, 5921, 4662 with 3278 (links 777), 2617 (links 733) and 2168 (links 581) citations, respectively. Gupta M figured at rank 8 of this list despite having maximum citations (3546) due to lesser mutual citations with the documents of other MMC researchers.
- 18.
- The Shanghai Jiao Tong University, Harbin Institute of Technology and the Indian Institutes of Technology attained the maximum citations network based TLS of 4433, 3938 and 3272, respectively. The authors affiliated with these organizations bagged 5323, 5659 and 5109 citations with 544, 565 and 592 links, respectively.
- 19.
- The top three countries with the highest international linkage based TLS rankings are the People’s Republic of China (TLS 20878), India (TLS 17501) and the USA (13112). These nations have citations based linkages with 66 countries each. Their authors have obtained 43,374, 34,715 and 33,038 WoS citations, respectively.
- 20.
- Iran obtained the fourth highest TLS (5938) based on its international citation linkages (63), whereas it was ranked only ninth in the international co-authored MMC research linkages (links 26, TLS 145).
- 21.
- The top three MMC publication sources with the highest citations based TLS values are the ‘Materials Science and Engineering: A—Structural Materials: Properties, Microstructure and Processing’ (TLS 6634), ‘Journal of Alloys and Compounds’ (TLS 4377) and ‘Materials & Design’ (TLS 4364). Their WoS articles have received 18,715 (links 242), 12,992 (links 2313) and 11,299 (links 229) citations, respectively.
- 22.
- The top three MMC related keywords with the highest co-occurrence based TLS are ‘Metal Matrix Composites’(TLS 5566), ‘Mechanical Properties’ (TLS 3643) and ‘Microstructure’ (TLS 2922). These keywords have occurred in 2135, 1255 and 962 documents with 845, 599 and 597 co-occurrence based links with other MMC keywords, respectively. The other MMC keywords (with high co-occurrence based TLS) are related to MMC materials, processing techniques, properties and analyses.
- 23.
- Keyword burst detection analysis revealed that ‘graphene’, ‘stengthening mechanism’, ‘stir casting’ ‘nanocomposite’ and ‘B4C’ have witnessed significant citation bursts in the last four years. The citation burst strengths of these keywords are 33.6453 (2018–2020), 20.45 (2017–2020), 19.9426 (2018–2020), 16.9666 (2016–2018) and 13.6994 (2018–2020), respectively. This analysis indicates that the current research trend is related to processing and characterisation of nanocomposites with special emphasis on graphene reinforced MMCs.
- 24.
- Reference burst detection analysis showed that all of the top fifteen documents with the highest citation burst strengths were published before 2001. All of these documents witnessed their respective citation bursts during 2001–2005, when the annual number of MMC publications in WoS was the lowest! None of the top cited MMC articles featured in the top fifteen citation burst strength rankings. These top fifteen citation burst documents dealt with a general review of MMCs, methods of preparation, characterisation as well as investigations into their specific functional properties and applications.
Thus, the bibliometric analysis presented in this paper provides deep insights into the various aspects of metal matrix composites’ research articles published in WoS sources during 2001–2020. The researchers affiliated with the institutions and universities of China, the USA and India are expected to continue leading investigations into newer composite materials with nano scale inclusions such as graphene for enhanced functional properties. The collaboration and citations based linkages among various MMC researchers are also expected to increase in terms of numbers and strengths in the near future.
Author Contributions
Conceptualization, D.S.; Methodology, P.S.; Writing – original draft, R.S. All authors have read and agreed to the published version of the manuscript.
Funding
This research received no external funding.
Institutional Review Board Statement
Not applicable.
Informed Consent Statement
Not applicable.
Data Availability Statement
All data is available in the article itself.
Conflicts of Interest
The authors declare no conflict of interest.
References
- Mali, A.S.; Vagge, S.; Kolekar, A. Tribological behaviour of LM25 hybrid metal matrix composites by using Taguchi’s techniques. Mater. Today Proc. 2021. [Google Scholar] [CrossRef]
- Ogawa, F.; Masuda, C. Fabrication and the mechanical and physical properties of nanocarbon-reinforced light metal matrix composites: A review and future directions. Mater. Sci. Eng. A 2021, 820, 141542. [Google Scholar] [CrossRef]
- Chen, H.; Chen, Z.; Cui, Y.; Wang, L.; Wang, M.; Liu, J.; Zhong, S.; Wang, H. The effect of TiB2 ceramic particles on Portevin–Le Chatelier behavior of TiB2/AlMg metal matrix composites. J. Mater. Res. Technol. 2021, 14, 2302–2311. [Google Scholar] [CrossRef]
- Vasanth Kumar, R.; Keshavamurthy, R.; Perugu, C.S.; Alipour, M.; Siddaraju, C. Influence of hot rolling on friction and wear behaviour of Al6061-ZrB2 in-situ metal matrix composites. J. Manuf. Process. 2021, 69, 473–490. [Google Scholar] [CrossRef]
- Huang, J.; Li, W.; He, Y.; Li, Y.; Zhang, X.; Yang, M.; Zheng, S.; Ma, Y. Temperature dependent ultimate tensile strength model for short fiber reinforced metal matrix composites. Compos. Struct. 2021, 267, 113890. [Google Scholar] [CrossRef]
- Bharat, N.; Bose, P. An overview on the effect of reinforcement and wear behaviour of metal matrix composites. Mater. Today Proc. 2021, 46, 707–713. [Google Scholar] [CrossRef]
- Sahoo, B.P.; Das, D.; Chaubey, A.K. Strengthening mechanisms and modelling of mechanical properties of submicron-TiB2 particulate reinforced Al 7075 metal matrix composites. Mater. Sci. Eng. A 2021, 825, 141873. [Google Scholar] [CrossRef]
- Sekhar, R.; Singh, T. Mechanisms in turning of metal matrix composites: A review. J. Mater. Res. Technol. 2015, 4, 197–207. [Google Scholar] [CrossRef] [Green Version]
- Phutane, P.; Jatti, V.K.S.; Sekhar, R.; Singh, T. Synthesis and characterization of SiC reinforced HE-30 Al alloy particulate MMCs. Int. J. Eng. Technol. (IJET) 2013, 5, 2866–2870. [Google Scholar]
- Rathod, S.; Shekhar, R.; Jatti, V.; Singh, T. Optimization of tool shape and size in EDM Al alloy metal matrix composites. Int. J. Appl. Eng. Res. 2013, 8, 639–646. [Google Scholar]
- Sekhar, R.; Singh, T. Determination of Johnson Cook parameters in turning of micro and nano reinforced aluminum composites using trust region reflective algorithm. Int. J. Innov. Technol. Explor. Eng. (IJITEE) 2019, 9, 1712–1716. [Google Scholar]
- Shah, P.; Sekhar, R.; Kulkarni, A.J.; Siarry, P. Metaheuristic Algorithms in Industry 4.0; CRC Press: Boca Raton, FL, USA, 2021. [Google Scholar]
- Sekhar, R.; Singh, T.; Shah, P. Machine learning based predictive modeling and control of surface roughness generation while machining micro boron carbide and carbon nanotube particle reinforced Al-Mg matrix composites. Part. Sci. Technol. 2021, 1–18. [Google Scholar] [CrossRef]
- Sekhar, R.; Singh, T.P.; Shah, P. Complex order PIα Dγ design for surface roughness control in machining CNT Al-Mg hybrid composites. Adv. Sci. Technol. Eng. Syst. J. 2020, 5, 299–306. [Google Scholar] [CrossRef]
- Sekhar, R.; Singh, T.; Shah, P. Micro and nano particle composite machining: Fractional order control of surface roughness. In Proceedings of the Third International Conference on Powder, Granule and Bulk Solids: Innovations and Applications PGBSIA, Patiala, India, 26–28 February 2020; pp. 35–42. [Google Scholar]
- Sekhar, R.; Singh, T.; Shah, P. ARX/ARMAX modeling and fractional order control of surface roughness in turning nano-composites. In Proceedings of the 2019 International Conference on Mechatronics, Robotics and Systems Engineering (MoRSE), Bali, Indonesia, 4–6 December 2019; pp. 97–102. [Google Scholar]
- Sekhar, R.; Singh, T.; Shah, P. System identification of tool chip interface friction while machining CNT-Mg-Al composites. AIP Conf. Proc. 2021, 2317, 020019-1–020019-9. [Google Scholar]
- Vishwakarma, P.; Sekhar, R.; Singh, T. Finite element analysis of force variation with cutting speed in orthogonal turning of aluminum AA6351 alloy. Int. J. Appl. Eng. Res. 2015, 10, 10055–10064. [Google Scholar]
- Jatti, V.; Sekhar, R.; Patil, R. Study of ball nose end milling of LM6 Al alloy: Surface roughness optimisation using genetic algorithm. Int. J. Eng. Technol. 2013, 5, 2859–2865. [Google Scholar]
- Jatti, V.S.; Sekhar, R. Surface Roughness Study on LM6 Al-Alloy: A Taguchi Approach. In Proceedings of the International Conference on Advanced Research in Engineering and Technology (ICARET 2013)—International Technology Innovation, Gunt, India, 8–9 February 2013; pp. 550–553. [Google Scholar]
- Xu, H.; Huang, H. Plasma remelting and injection method for fabricating metal matrix composite coatings reinforced with tungsten carbide. Ceram. Int. 2021. [Google Scholar] [CrossRef]
- Li, Y.; Ramesh, K.; Chin, E. The compressive viscoplastic response of an A359/SiCp metal–matrix composite and of the A359 aluminum alloy matrix. Int. J. Solids Struct. 2000, 37, 7547–7562. [Google Scholar] [CrossRef]
- Li, Y.; Ramesh, K.; Chin, E. The mechanical response of an A359/SiCp MMC and the A359 aluminum matrix to dynamic shearing deformations. Mater. Sci. Eng. A 2004, 382, 162–170. [Google Scholar] [CrossRef]
- Li, Y.; Ramesh, K.; Chin, E. Viscoplastic deformations and compressive damage in an A359/SiCp metal–matrix composite. Acta Mater. 2000, 48, 1563–1573. [Google Scholar] [CrossRef]
- Li, Y.; Ramesh, K. Influence of particle volume fraction, shape, and aspect ratio on the behavior of particle-reinforced metal–matrix composites at high rates of strain. Acta Mater. 1998, 46, 5633–5646. [Google Scholar] [CrossRef]
- El-Gallab, M.; Sklad, M. Machining of Al/SiC particulate metal-matrix composites: Part I: Tool performance. J. Mater. Process. Technol. 1998, 83, 151–158. [Google Scholar] [CrossRef]
- Li, X.; Seah, W. Tool wear acceleration in relation to workpiece reinforcement percentage in cutting of metal matrix composites. Wear 2001, 247, 161–171. [Google Scholar] [CrossRef]
- Ding, X.; Liew, W.; Liu, X. Evaluation of machining performance of MMC with PCBN and PCD tools. Wear 2005, 259, 1225–1234. [Google Scholar] [CrossRef]
- Chambers, A. The machinability of light alloy MMCs. Compos. Part A Appl. Sci. Manuf. 1996, 27, 143–147. [Google Scholar] [CrossRef]
- Ciftci, I.; Turker, M.; Seker, U. Evaluation of tool wear when machining SiCp-reinforced Al-2014 alloy matrix composites. Mater. Des. 2004, 25, 251–255. [Google Scholar] [CrossRef]
- Jaspers, S.; Dautzenberg, J. Material behaviour in metal cutting: Strains, strain rates and temperatures in chip formation. J. Mater. Process. Technol. 2002, 121, 123–135. [Google Scholar] [CrossRef]
- Lin, C.; Hung, Y.; Liu, W.C.; Kang, S.W. Machining and fluidity of 356Al/SiCp composites. J. Mater. Process. Technol. 2001, 110, 152–159. [Google Scholar] [CrossRef]
- Davim, J. Diamond tool performance in machining metal–matrix composites. J. Mater. Process. Technol. 2002, 128, 100–105. [Google Scholar] [CrossRef]
- Heath, P.J. Developments in applications of PCD tooling. J. Mater. Process. Technol. 2001, 116, 31–38. [Google Scholar] [CrossRef]
- Zhang, Z.; Zhang, L.; Mai, Y.W. Particle effects on friction and wear of aluminium matrix composites. J. Mater. Sci. 1995, 30, 5999–6004. [Google Scholar] [CrossRef]
- Yan, C.; Zhang, L. Single-point scratching of 6061 Al alloy reinforced by different ceramic particles. Appl. Compos. Mater. 1994, 1, 431–447. [Google Scholar] [CrossRef]
- El-Gallab, M.; Sklad, M. Machining of Al/SiC particulate metal matrix composites: Part II: Workpiece surface integrity. J. Mater. Process. Technol. 1998, 83, 277–285. [Google Scholar] [CrossRef]
- Hung, N.P.; Venkatesh, V.; Loh, N. Machining of metal matrix composites. Manuf. Eng. Mater. Process. 1999, 53, 295–356. [Google Scholar]
- Yuan, Z.; Geng, L.; Dong, S. Ultraprecision machining of SiCw/Al composites. CIRP Ann. 1993, 42, 107–109. [Google Scholar] [CrossRef]
- Arsenault, R.; Wang, L.; Feng, C. Strengthening of composites due to microstructural changes in the matrix. Acta Metall. Mater. 1991, 39, 47–57. [Google Scholar] [CrossRef]
- Arsenault, R.; Shi, N. Dislocation generation due to differences between the coefficients of thermal expansion. Mater. Sci. Eng. 1986, 81, 175–187. [Google Scholar] [CrossRef]
- Miller, W.; Humphreys, F. Strengthening mechanisms in particulate metal matrix composites. Scr. Metall. Mater. 1991, 25, 33–38. [Google Scholar] [CrossRef]
- Kannan, S.; Kishawy, H.; Deiab, I. Cutting forces and TEM analysis of the generated surface during machining metal matrix composites. J. Mater. Process. Technol. 2009, 209, 2260–2269. [Google Scholar] [CrossRef]
- Black, J.T. Flow stress model in metal cutting. J. Eng. Ind. 1979, 101, 403–415. [Google Scholar] [CrossRef]
- Basinski, Z.; Jackson, P. The instability of the work hardened state. I. Slip in extraneously deformed crystals. Phys. Status Solidi (b) 1965, 9, 805–823. [Google Scholar] [CrossRef]
- Basinski, Z.; Jackson, P. The instability of the work hardened state. II. Slip in “Alien” dislocation distributions. Phys. Status Solidi (b) 1965, 10, 45–56. [Google Scholar] [CrossRef]
- Venkatesh, R.; Hariharan, A.; Muthukrishnan, N. Machinability studies of Al/SiC/(20p) MMC by using PCD insert (1300 grade). In Proceedings of the World Congress on Engineering, London, UK, 1–3 July 2009; Volume 2, pp. 1–3. [Google Scholar]
- Arokiadass, R.; Palaniradja, K.; Alagumoorthi, N. Predictive modeling of surface roughness in end milling of Al/SiCp metal matrix composite. Arch. Appl. Sci. Res. 2011, 3, 228–236. [Google Scholar]
- Muthukrishnan, N.; Davim, J.P. Optimization of machining parameters of Al/SiC-MMC with ANOVA and ANN analysis. J. Mater. Process. Technol. 2009, 209, 225–232. [Google Scholar] [CrossRef]
- Ge, Y.; Xu, J.; Yang, H.; Luo, S.; Fu, Y. Workpiece surface quality when ultra-precision turning of SiCp/Al composites. J. Mater. Process. Technol. 2008, 203, 166–175. [Google Scholar] [CrossRef]
- Pramanik, A.; Zhang, L.; Arsecularatne, J. Prediction of cutting forces in machining of metal matrix composites. Int. J. Mach. Tools Manuf. 2006, 46, 1795–1803. [Google Scholar] [CrossRef] [Green Version]
- Pramanik, A.; Zhang, L.; Arsecularatne, J. Machining of metal matrix composites: Effect of ceramic particles on residual stress, surface roughness and chip formation. Int. J. Mach. Tools Manuf. 2008, 48, 1613–1625. [Google Scholar] [CrossRef] [Green Version]
- Sikder, S.; Kishawy, H. Analytical model for force prediction when machining metal matrix composite. Int. J. Mech. Sci. 2012, 59, 95–103. [Google Scholar] [CrossRef]
- Kishawy, H.; Kannan, S.; Balazinski, M. An energy based analytical force model for orthogonal cutting of metal matrix composites. CIRP Ann. 2004, 53, 91–94. [Google Scholar] [CrossRef]
- Merchant, M.E. Mechanics of the metal cutting process. I. Orthogonal cutting and a type 2 chip. J. Appl. Phys. 1945, 16, 267–275. [Google Scholar] [CrossRef]
- Kronenberg, M. Machining Science and Application. Theory and Practice for Operation and Development of Machining Processes; Pergamon Press: Oxford, UK, 1966. [Google Scholar]
- Colwell, L. Predicting the angle of chip flow for single-point cutting tools. Trans. ASME 1954, 76, 199–204. [Google Scholar]
- Johnson, G.R. A constitutive model and data for materials subjected to large strains, high strain rates, and high temperatures. In Proceedings of the Seventh International Symposium on Ballistics, Hague, The Netherlands, 19–21 April 1983; pp. 541–547. [Google Scholar]
- van Raan, A.F. For your citations only? Hot topics in bibliometric analysis. Meas. Interdiscip. Res. Perspect. 2005, 3, 50–62. [Google Scholar] [CrossRef]
- Ye, Q.; Song, H.; Li, T. Cross-institutional collaboration networks in tourism and hospitality research. Tour. Manag. Perspect. 2012, 2, 55–64. [Google Scholar] [CrossRef]
- Zupic, I.; Čater, T. Bibliometric methods in management and organization. Organ. Res. Methods 2015, 18, 429–472. [Google Scholar] [CrossRef]
- Sharma, D.; Gupta, P.K.; Andreu-Perez, J. A Review on Cyber Physical Systems and Smart Computing: Bibliometric Analysis. In Metaheuristic Algorithms in Industry 4.0; Shah, P., Sekhar, R., Kulkarni, A.J., Siarry, P., Eds.; Routledge: London, UK, 2021; Chapter 1; pp. 1–31, In press. [Google Scholar]
- Jiang, Y.; Ritchie, B.W.; Benckendorff, P. Bibliometric visualisation: An application in tourism crisis and disaster management research. Curr. Issues Tour. 2019, 22, 1925–1957. [Google Scholar] [CrossRef]
- Borgman, C.L.; Furner, J. Scholarly communication and bibliometrics. Annu. Rev. Inf. Sci. Technol. 2002, 36, 2–72. [Google Scholar] [CrossRef] [Green Version]
- Thelwall, M. Bibliometrics to webometrics. J. Inf. Sci. 2008, 34, 605–621. [Google Scholar] [CrossRef]
- Jamal, T.; Smith, B.; Watson, E. Ranking, rating and scoring of tourism journals: Interdisciplinary challenges and innovations. Tour. Manag. 2008, 29, 66–78. [Google Scholar] [CrossRef]
- McKercher, B. Influence ratio: An alternate means to assess the relative influence of hospitality and tourism journals on research. Int. J. Hosp. Manag. 2012, 31, 962–971. [Google Scholar] [CrossRef]
- Phillips, W.; Canter, D.; Abbot, J. Hospitality and Tourism Research Rankings by Author, University, and Country Using Six Major Journals: The First Decade of the New Millennium. J. Hosp. Tour. Res. 2011, 35, 381–416. [Google Scholar]
- Zhao, W.; Ritchie, J.B. An investigation of academic leadership in tourism research: 1985–2004. Tour. Manag. 2007, 28, 476–490. [Google Scholar] [CrossRef]
- Benckendorff, P. Themes and Trends in Australian and New Zealand Tourism Research: A Social Network Analysis of Citations in Two Leading Journals (1994–2007). J. Hosp. Tour. Manag. 2009, 16, 1–15. [Google Scholar] [CrossRef] [Green Version]
- Benckendorff, P.; Zehrer, A. A network analysis of tourism research. Ann. Tour. Res. 2013, 43, 121–149. [Google Scholar] [CrossRef]
- Hu, C.; Racherla, P. Visual representation of knowledge networks: A social network analysis of hospitality research domain. Int. J. Hosp. Manag. 2008, 27, 302–312. [Google Scholar] [CrossRef]
- White, H.D.; McCain, K.W. Visualizing a discipline: An author co-citation analysis of information science, 1972–1995. J. Am. Soc. Inf. Sci. 1998, 49, 327–355. [Google Scholar] [CrossRef]
- Baggio, R.; Scott, N.; Arcodia, C. Collaboration in the events literature: A co-authorship network study. In Proceedings of the EUTO, Nottingham, UK, 24–25 September 2008. [Google Scholar]
- Yuan, Y.; Gretzel, U.; Tseng, Y.H. Revealing the nature of contemporary tourism research: Extracting common subject areas through bibliographic coupling. Int. J. Tour. Res. 2015, 17, 417–431. [Google Scholar] [CrossRef]
- McKercher, B. A citation analysis of tourism scholars. Tour. Manag. 2008, 29, 1226–1232. [Google Scholar] [CrossRef]
- Howey, R.M.; Savage, K.S.; Verbeeten, M.J.; Van Hoof, H.B. Tourism and hospitality research journals: Cross-citations among research communities. Tour. Manag. 1999, 20, 133–139. [Google Scholar] [CrossRef]
- Ying, T.; Xiao, H. Knowledge linkage: A social network analysis of tourism dissertation subjects. J. Hosp. Tour. Res. 2012, 36, 450–477. [Google Scholar] [CrossRef]
- Ballantyne, R.; Packer, J.; Axelsen, M. Trends in tourism research. Ann. Tour. Res. 2009, 36, 149–152. [Google Scholar] [CrossRef]
- Cheng, C.K.; Li, X.R.; Petrick, J.F.; O’Leary, J.T. An examination of tourism journal development. Tour. Manag. 2011, 32, 53–61. [Google Scholar] [CrossRef]
- McKercher, B.; Law, R.; Lam, T. Rating tourism and hospitality journals. Tour. Manag. 2006, 27, 1235–1252. [Google Scholar] [CrossRef]
- Van Eck, N.J.; Waltman, L. Software survey: VOSviewer, a computer program for bibliometric mapping. Scientometrics 2010, 84, 523–538. [Google Scholar] [CrossRef] [Green Version]
- Chen, C. Searching for intellectual turning points: Progressive knowledge domain visualization. Proc. Natl. Acad. Sci. USA 2004, 101, 5303–5310. [Google Scholar] [CrossRef] [Green Version]
- Chen, C. CiteSpace II: Detecting and visualizing emerging trends and transient patterns in scientific literature. J. Am. Soc. Inf. Sci. Technol. 2006, 57, 359–377. [Google Scholar] [CrossRef] [Green Version]
- Davi, A.; Haughton, D.; Nasr, N.; Shah, G.; Skaletsky, M.; Spack, R. A review of two text-mining packages: SAS TextMining and WordStat. Am. Stat. 2005, 59, 89–103. [Google Scholar] [CrossRef]
- Pan, S.; Chon, K.; Song, H. Visualizing tourism trends: A combination of ATLAS. ti and BiPlot. J. Travel Res. 2008, 46, 339–348. [Google Scholar] [CrossRef] [Green Version]
- Persson, O.; Danell, R.; Schneider, J.W. How to use Bibexcel for various types of bibliometric analysis. Celebr. Sch. Commun. Stud. Festschr. Olle Persson His 60th Birthd. 2009, 5, 9–24. [Google Scholar]
- Börner, K.; Huang, W.; Linnemeier, M.; Duhon, R.; Phillips, P.; Ma, N.; Zoss, A.; Guo, H.; Price, M. Rete-netzwerk-red: Analyzing and visualizing scholarly networks using the Network Workbench Tool. Scientometrics 2010, 83, 863–876. [Google Scholar] [CrossRef] [Green Version]
- Herr, B.W.; Huang, W.; Penumarthy, S.; Börner, K. Designing highly flexible and usable cyberinfrastructures for convergence. Ann. N. Y. Acad. Sci. 2006, 1093, 161. [Google Scholar] [CrossRef] [PubMed]
- Porter, A.L.; Cunningham, S.W. Tech Mining: Exploiting New Technologies for Competitive Advantage; John Wiley & Sons: Hoboken, NJ, USA, 2004; Volume 29. [Google Scholar]
- Brandes, U.; Kenis, P.; Raab, J.; Schneider, V.; Wagner, D. Explorations into the visualization of policy networks. J. Theor. Politics 1999, 11, 75–106. [Google Scholar] [CrossRef] [Green Version]
- Scott, N.; Baggio, R.; Cooper, C. Network Analysis and Tourism; Channel View Publications: Bristol, UK, 2008. [Google Scholar]
- Van Eck, N.J.; Waltman, L. VOS: A new method for visualizing similarities between objects. In Advances in Data Analysis; Springer: Berlin/Heidelberg, Germany, 2007; pp. 299–306. [Google Scholar]
- Cobo, M.J.; López-Herrera, A.G.; Herrera-Viedma, E.; Herrera, F. Science mapping software tools: Review, analysis, and cooperative study among tools. J. Am. Soc. Inf. Sci. Technol. 2011, 62, 1382–1402. [Google Scholar] [CrossRef]
- Datkhile, R.; Laad, M.; Ghule, B. Research trend of metal matrix composites reinforced with silica extracted by green route: A Bibliometric Analysis. Libr. Philos. Pract. 2021, 1–14. Available online: https://digitalcommons.unl.edu/libphilprac/4730/ (accessed on 30 October 2021).
- Vencl, A.; Vaxevanidis, N.M.; Kandeva, M. A bibliometric analysis of scientific research on tribology of composites in Southeastern Europe. IOP Conf. Ser. Mater. Sci. Eng. 2020, 724, 1–8. [Google Scholar] [CrossRef]
- Saxena, P.; Bongale, A.; Kumar, S. Evaluation of friction stir processing for fabrication of composites in the context of Industry 4.0: A Bibliometric Review. Libr. Philos. Pract. 2021, 1–22. Available online: https://digitalcommons.unl.edu/libphilprac/5058/ (accessed on 30 October 2021).
- Ghule, B.; Laad, D. A bibliometric survey on polymer composites in energy storage applications. Libr. Philos. Pract. 2020, 1–17. Available online: https://digitalcommons.unl.edu/libphilprac/4497/ (accessed on 30 October 2021).
- Koo, Y.D.; Jeong, D.H. Analysis of Research Trend of Composite Material Using CNT; Key Engineering Materials; Trans Tech Publications: Bach, Switzerland, 2017; Volume 730, pp. 60–64. [Google Scholar]
- Costa, R.; Moura, E. A Bibliometric Analysis of the Strategy and Performance Measurement of the Polymer Matrix Nanomaterials Development Scenario Globally, and the Participation of Brazil; Springer: Cham, Switzerland, 2020; pp. 329–342. [Google Scholar] [CrossRef]
- Peças, P.; Carvalho, H.; Salman, H.; Leite, M. Natural fibre composites and their applications: A review. J. Compos. Sci. 2018, 2, 66. [Google Scholar] [CrossRef] [Green Version]
- Xu, Y.; Xiang, Y.; Shao, D.; Yu, Z.; Zheng, N.; Chen, W.; Ma, L. Bibliometrics and Visualization Analysis of Knowledge Map in Metallurgical Field; Springer: Cham, Switzerland, 2018; pp. 361–366. [Google Scholar] [CrossRef]
- Kumar, D.; Karwasra, K.; Soni, G. Bibliometric analysis of artificial neural network applications in materials and engineering. Mater. Today: Proc. 2020, 28, 1629–1634. [Google Scholar] [CrossRef]
- Mohan, S.; Gupta, B.; Dhawan, S. Materials science research and development in India: A scientometric analysis of international collaborative output. DESIDOC J. Libr. Inf. Technol. 2003, 23, 11–23. [Google Scholar]
- Bakshi, S.R.; Lahiri, D.; Agarwal, A. Carbon nanotube reinforced metal matrix composites-a review. Int. Mater. Rev. 2010, 55, 41–64. [Google Scholar] [CrossRef]
- Tjong, S.C. Recent progress in the development and properties of novel metal matrix nanocomposites reinforced with carbon nanotubes and graphene nanosheets. Mater. Sci. Eng. R Rep. 2013, 74, 281–350. [Google Scholar] [CrossRef]
- Tjong, S.C. Novel nanoparticle-reinforced metal matrix composites with enhanced mechanical properties. Adv. Eng. Mater. 2007, 9, 639–652. [Google Scholar] [CrossRef]
- Kok, M. Production and mechanical properties of Al2O3 particle-reinforced 2024 aluminium alloy composites. J. Mater. Process. Technol. 2005, 161, 381–387. [Google Scholar] [CrossRef]
- Torralba, J.d.; Da Costa, C.; Velasco, F. P/M aluminum matrix composites: An overview. J. Mater. Process. Technol. 2003, 133, 203–206. [Google Scholar] [CrossRef]
- Chawla, N.; Shen, Y.L. Mechanical behavior of particle reinforced metal matrix composites. Adv. Eng. Mater. 2001, 3, 357–370. [Google Scholar] [CrossRef]
- Hashim, J.; Looney, L.; Hashmi, M. Particle distribution in cast metal matrix composites—Part I. J. Mater. Process. Technol. 2002, 123, 251–257. [Google Scholar] [CrossRef]
- Shorowordi, K.M.; Laoui, T.; Haseeb, A.A.; Celis, J.P.; Froyen, L. Microstructure and interface characteristics of B4C, SiC and Al2O3 reinforced Al matrix composites: A comparative study. J. Mater. Process. Technol. 2003, 142, 738–743. [Google Scholar] [CrossRef]
- Miracle, D. Metal matrix composites–from science to technological significance. Compos. Sci. Technol. 2005, 65, 2526–2540. [Google Scholar] [CrossRef]
- Mortensen, A.; Llorca, J. Metal matrix composites. Annu. Rev. Mater. Res. 2010, 40, 243–270. [Google Scholar] [CrossRef]
- Lloyd, D. Particle reinforced aluminium and magnesium matrix composites. Int. Mater. Rev. 1994, 39, 1–23. [Google Scholar] [CrossRef]
- Ibrahim, I.; Mohamed, F.; Lavernia, E. Particulate reinforced metal matrix composites—A review. J. Mater. Sci. 1991, 26, 1137–1156. [Google Scholar] [CrossRef]
- Rohatgi, P.; Asthana, R.; Das, S. Solidification, structures, and properties of cast metal-ceramic particle composites. Int. Met. Rev. 1986, 31, 115–139. [Google Scholar] [CrossRef]
- Christman, T.; Needleman, A.; Suresh, S. An experimental and numerical study of deformation in metal-ceramic composites. Acta Metall. 1989, 37, 3029–3050. [Google Scholar] [CrossRef]
- Whitehouse, A.; Clyne, T. Cavity formation during tensile straining of particulate and short fibre metal matrix composites. Acta Metall. Mater. 1993, 41, 1701–1711. [Google Scholar] [CrossRef]
- Nardone, V.; Prewo, K. On the strength of discontinuous silicon carbide reinforced aluminum composites. Scr. Metall. 1986, 20, 43–48. [Google Scholar] [CrossRef]
- Bao, G.; Hutchinson, J.; McMeeking, R. Particle reinforcement of ductile matrices against plastic flow and creep. Acta Metall. Mater. 1991, 39, 1871–1882. [Google Scholar] [CrossRef]
- Lloyd, D. Aspects of fracture in particulate reinforced metal matrix composites. Acta Metall. Mater. 1991, 39, 59–71. [Google Scholar] [CrossRef]
- Brechet, Y.; Embury, J.; Tao, S.; Luo, L. Damage initiation in metal matrix composites. Acta Metall. Mater. 1991, 39, 1781–1786. [Google Scholar] [CrossRef]
- Vogelsang, M.; Arsenault, R.; Fisher, R. An in situ HVEM study of dislocation generation at Al/SiC interfaces in metal matrix composites. Metall. Trans. A 1986, 17, 379–389. [Google Scholar] [CrossRef] [Green Version]
- McDanels, D.L. Analysis of stress-strain, fracture, and ductility behavior of aluminum matrix composites containing discontinuous silicon carbide reinforcement. Metall. Trans. A 1985, 16, 1105–1115. [Google Scholar] [CrossRef]
- Mori, T.; Tanaka, K. Average stress in matrix and average elastic energy of materials with misfitting inclusions. Acta Metall. 1973, 21, 571–574. [Google Scholar] [CrossRef]
- Tjong, S.; Ma, Z. Microstructural and mechanical characteristics of in situ metal matrix composites. Mater. Sci. Eng. R Rep. 2000, 29, 49–113. [Google Scholar] [CrossRef]
- Eshelby, J.D. The determination of the elastic field of an ellipsoidal inclusion, and related problems. Proc. R. Soc. Lond. Ser. Math. Phys. Sci. 1957, 241, 376–396. [Google Scholar]
Figure 1.
Pictorial representations of a metal matrix composite structure with (a) single and (b) multiple types of reinforcement particles.
Figure 1.
Pictorial representations of a metal matrix composite structure with (a) single and (b) multiple types of reinforcement particles.
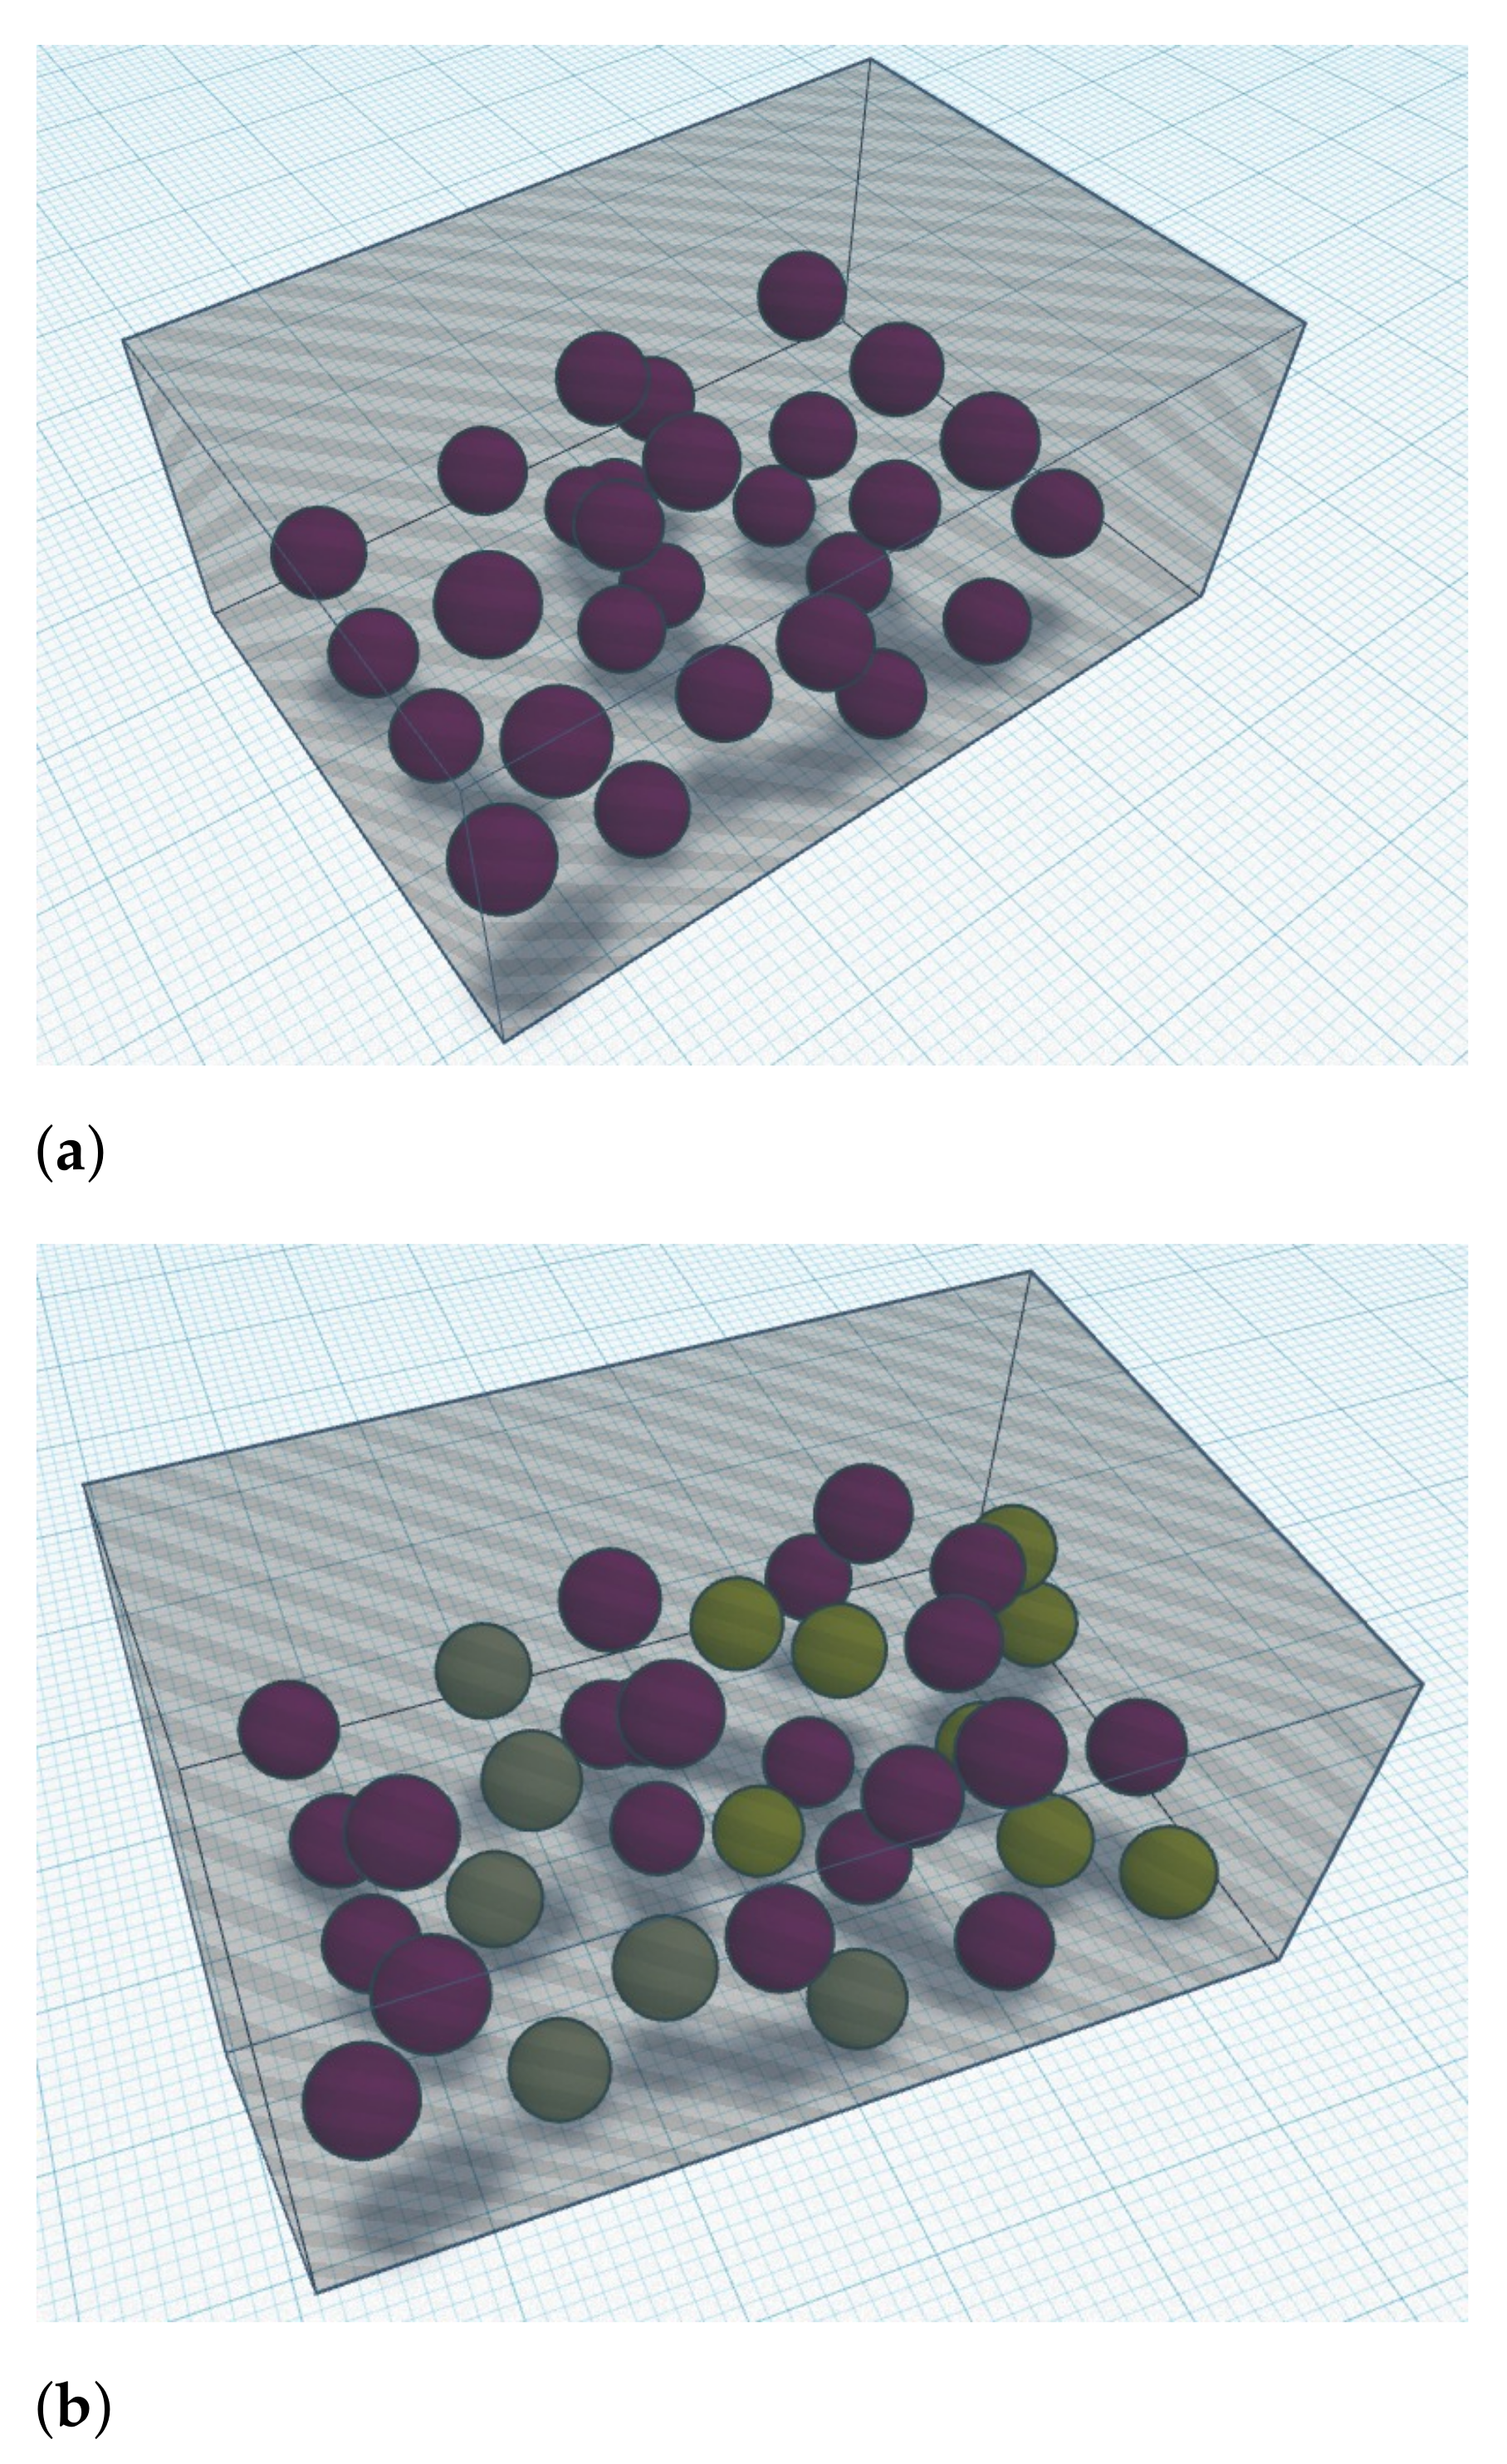
Figure 2.
Annual publications from 2001 to 2020.
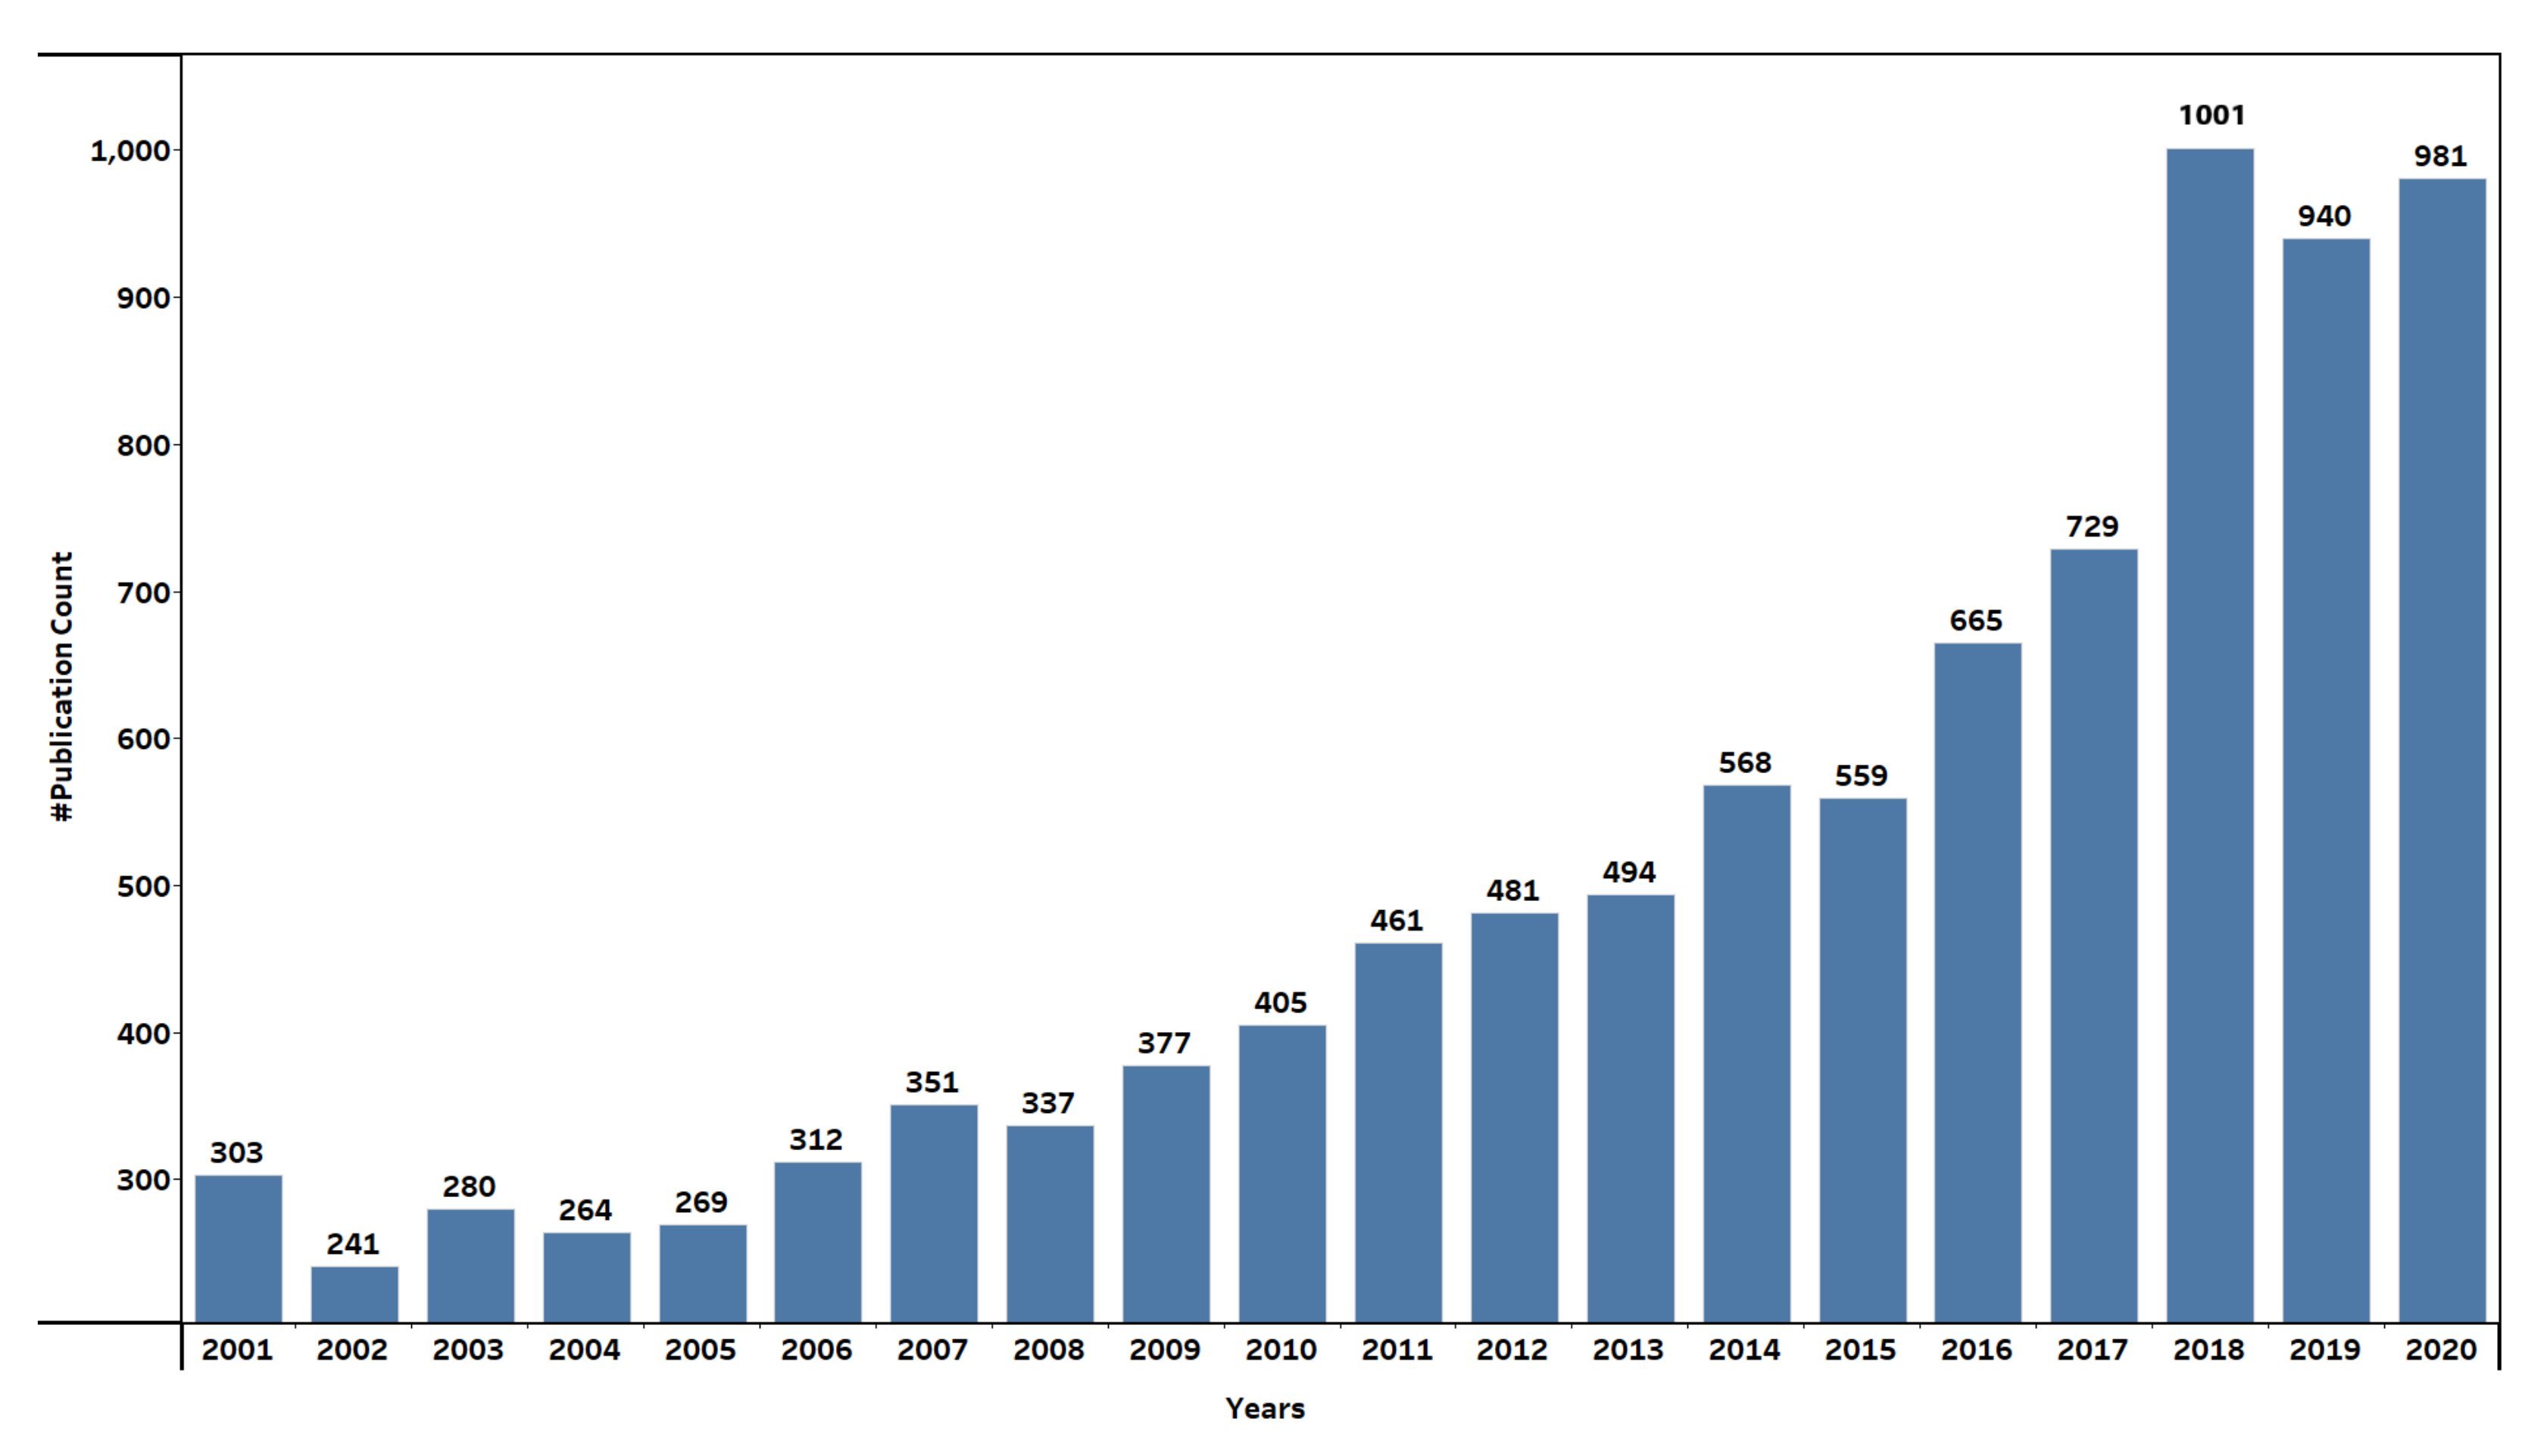
Figure 3.
The top 10 publication types.
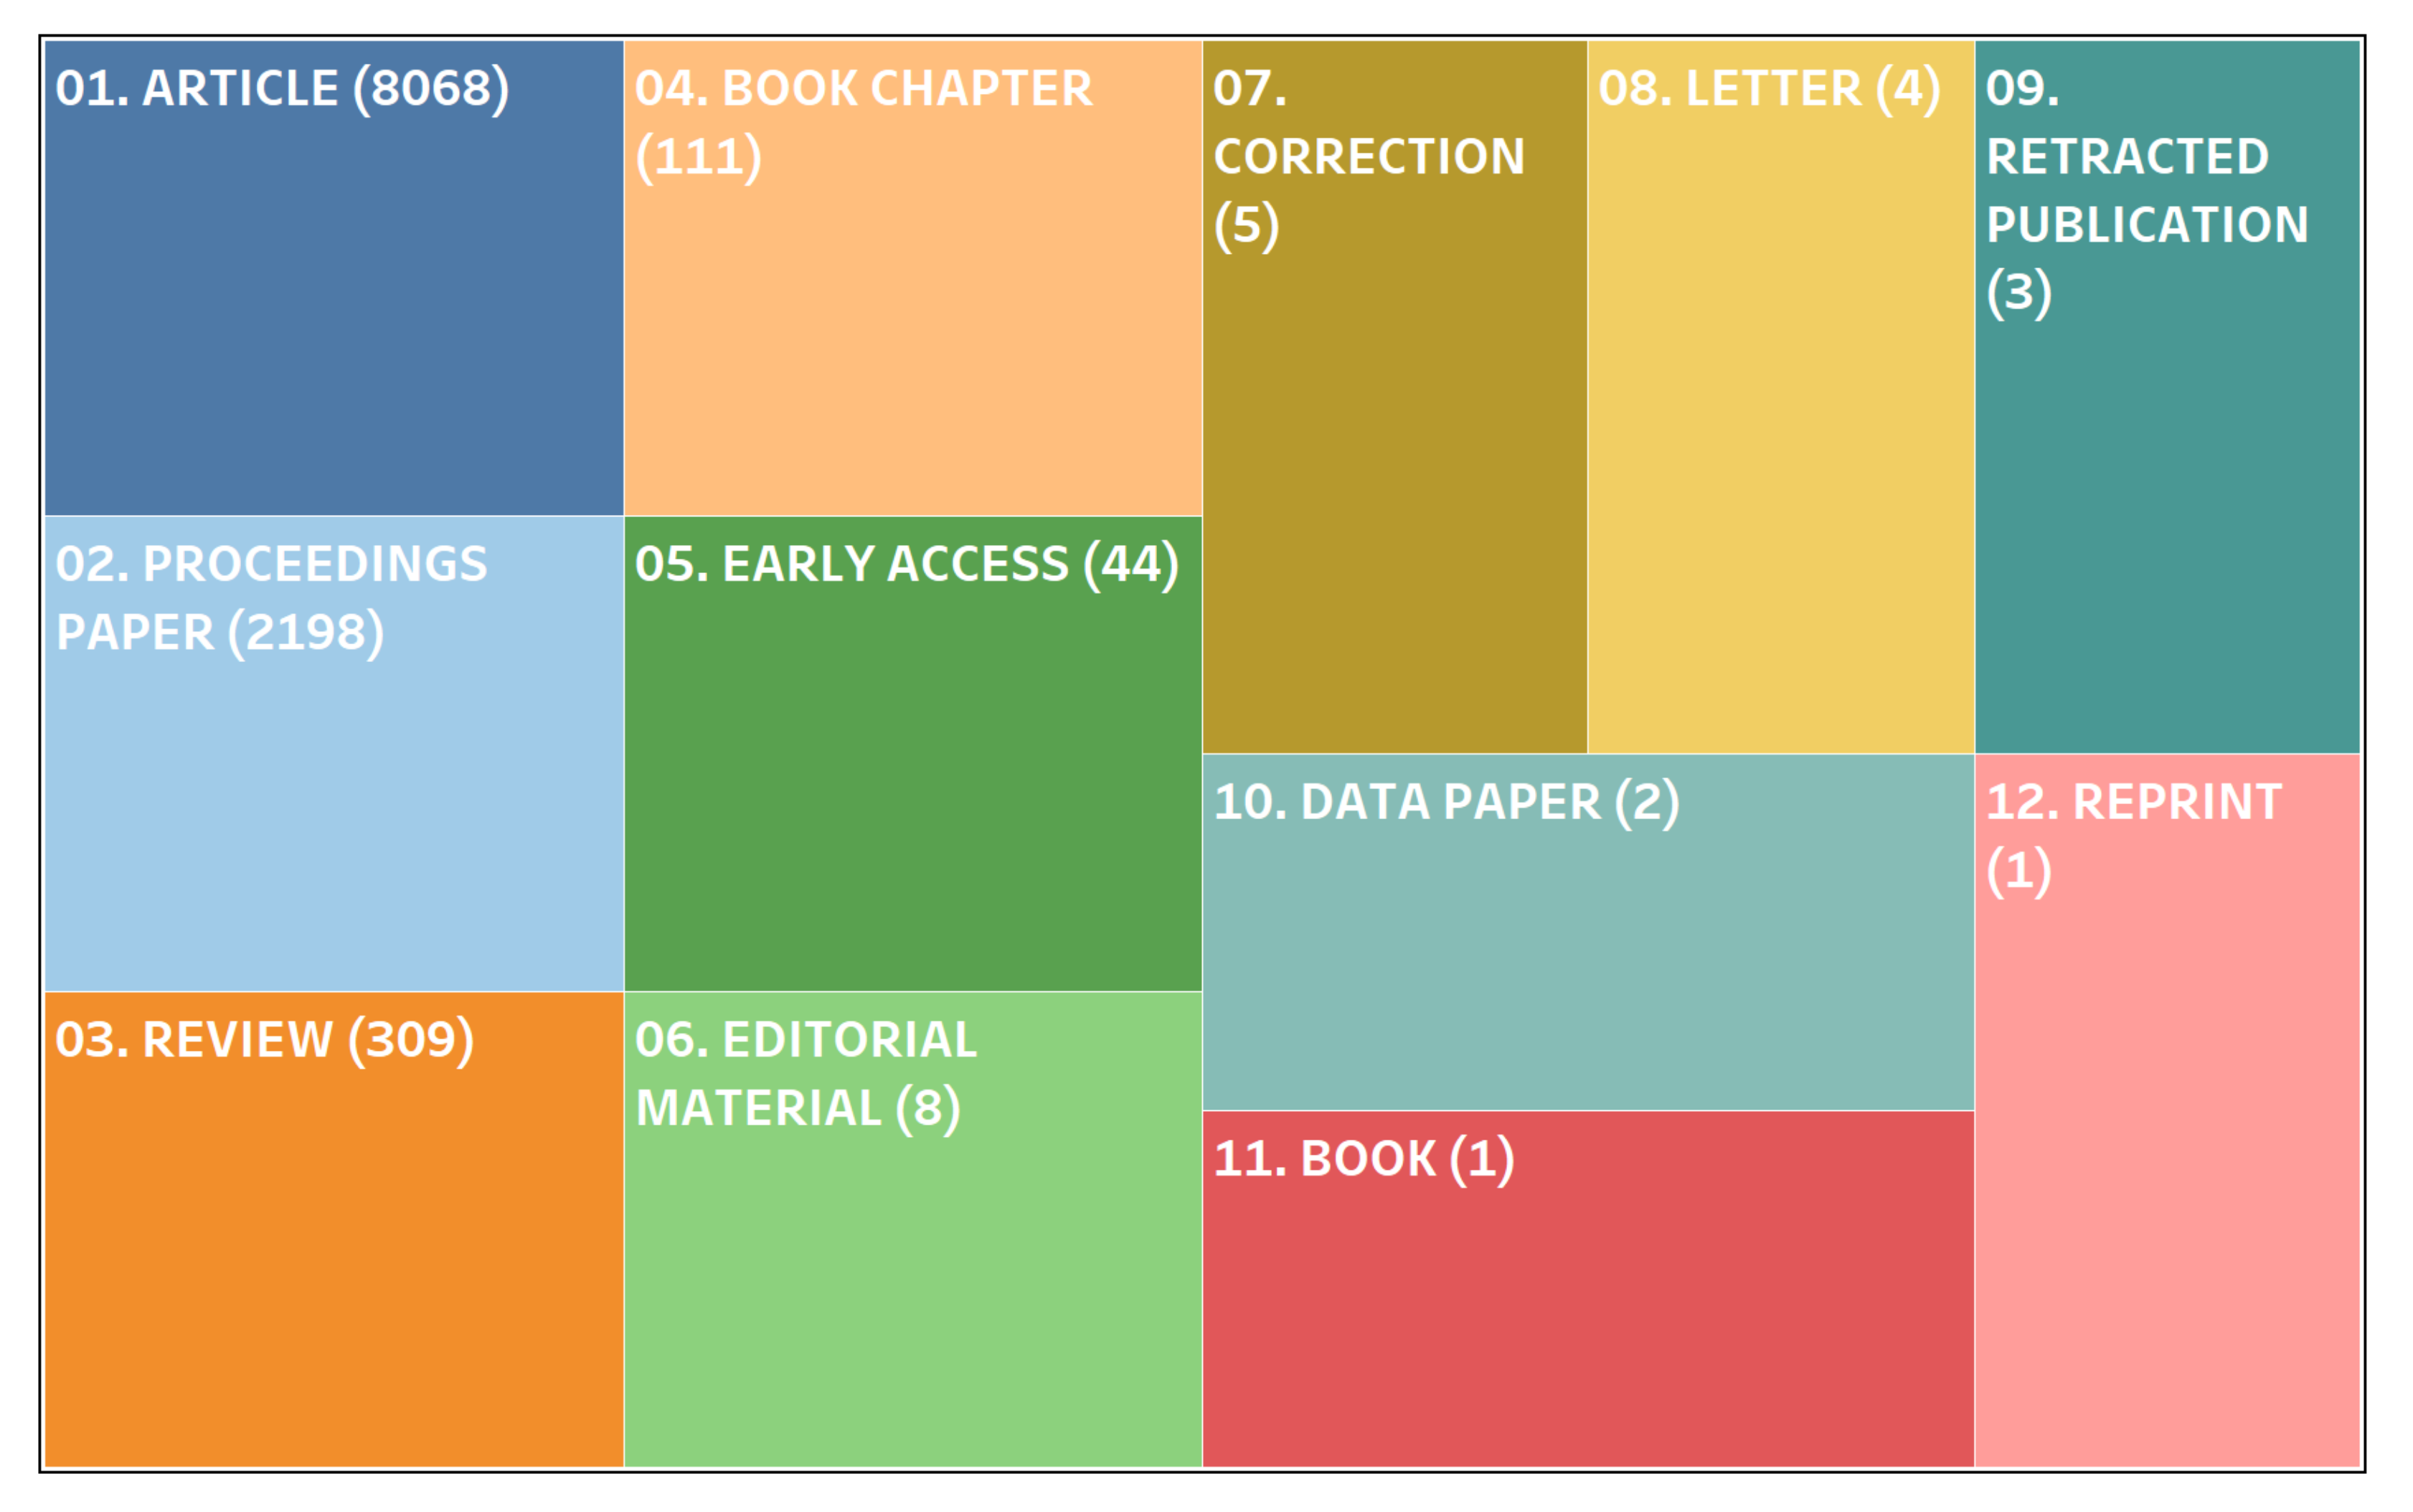
Figure 4.
The top 10 publication sources.

Figure 5.
The top 10 research directions.

Figure 6.
The publications trends of the top 10 research directions.
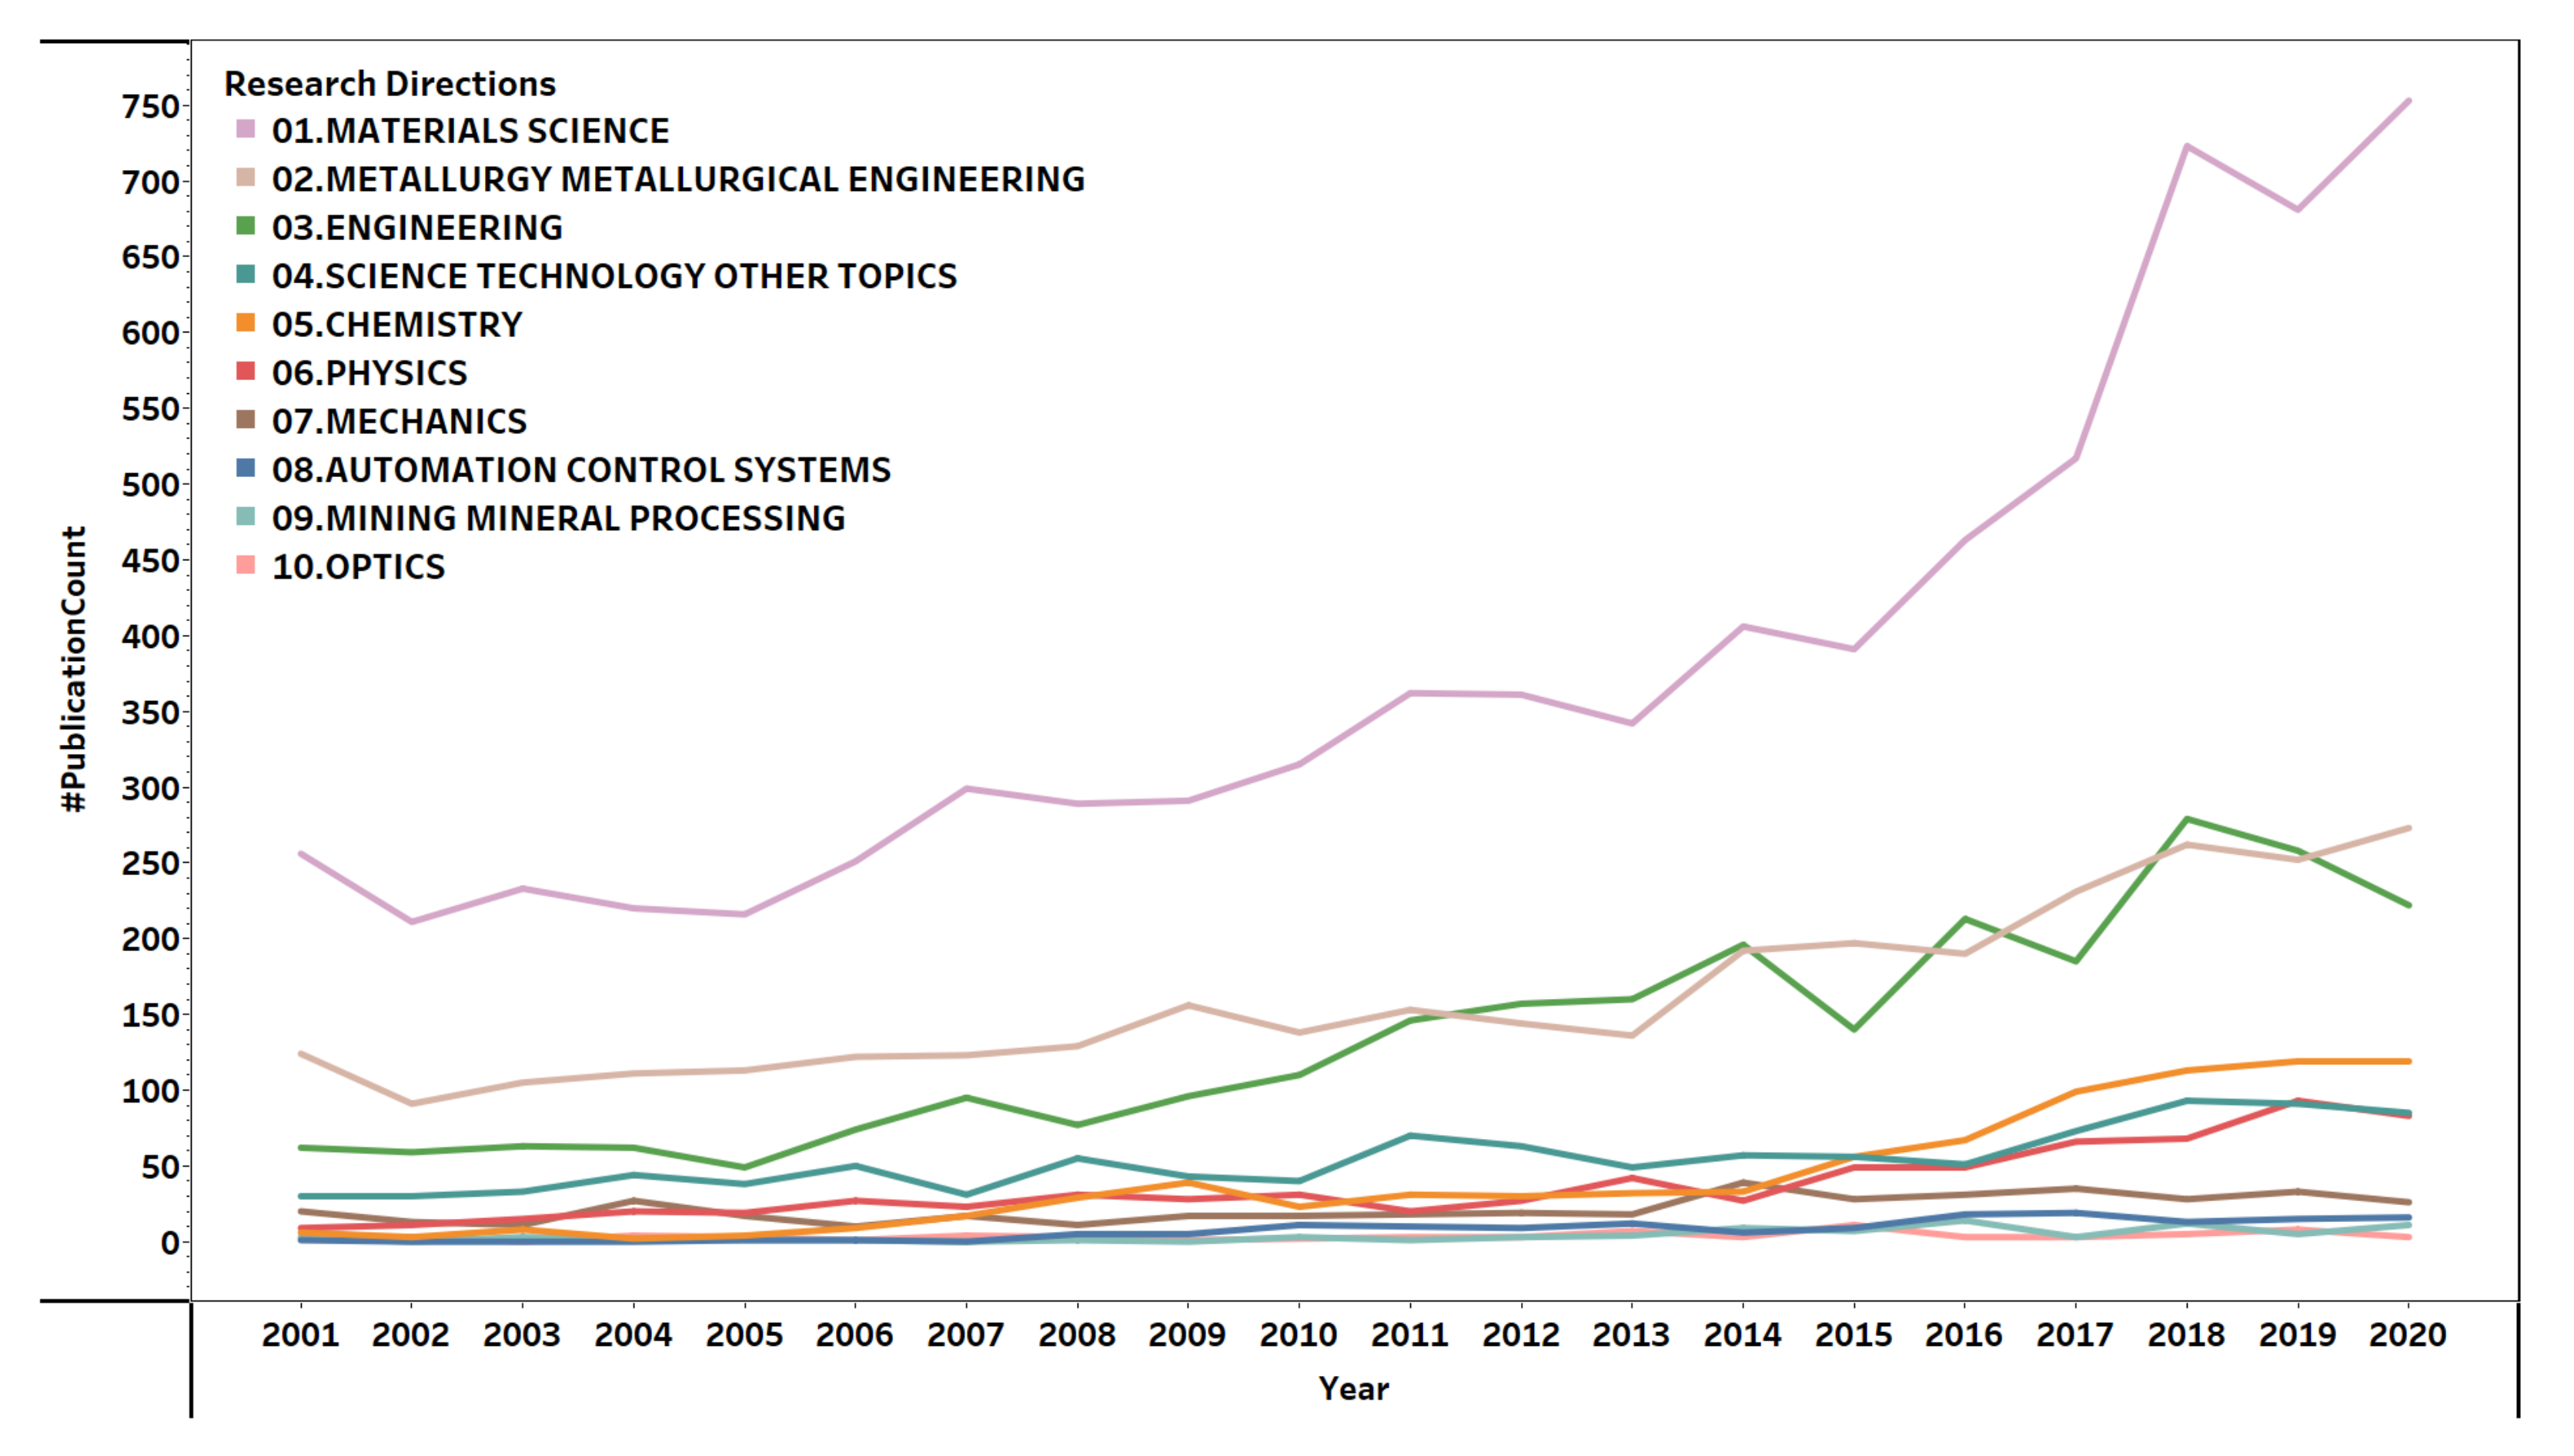
Figure 7.
The top 10 productive places.
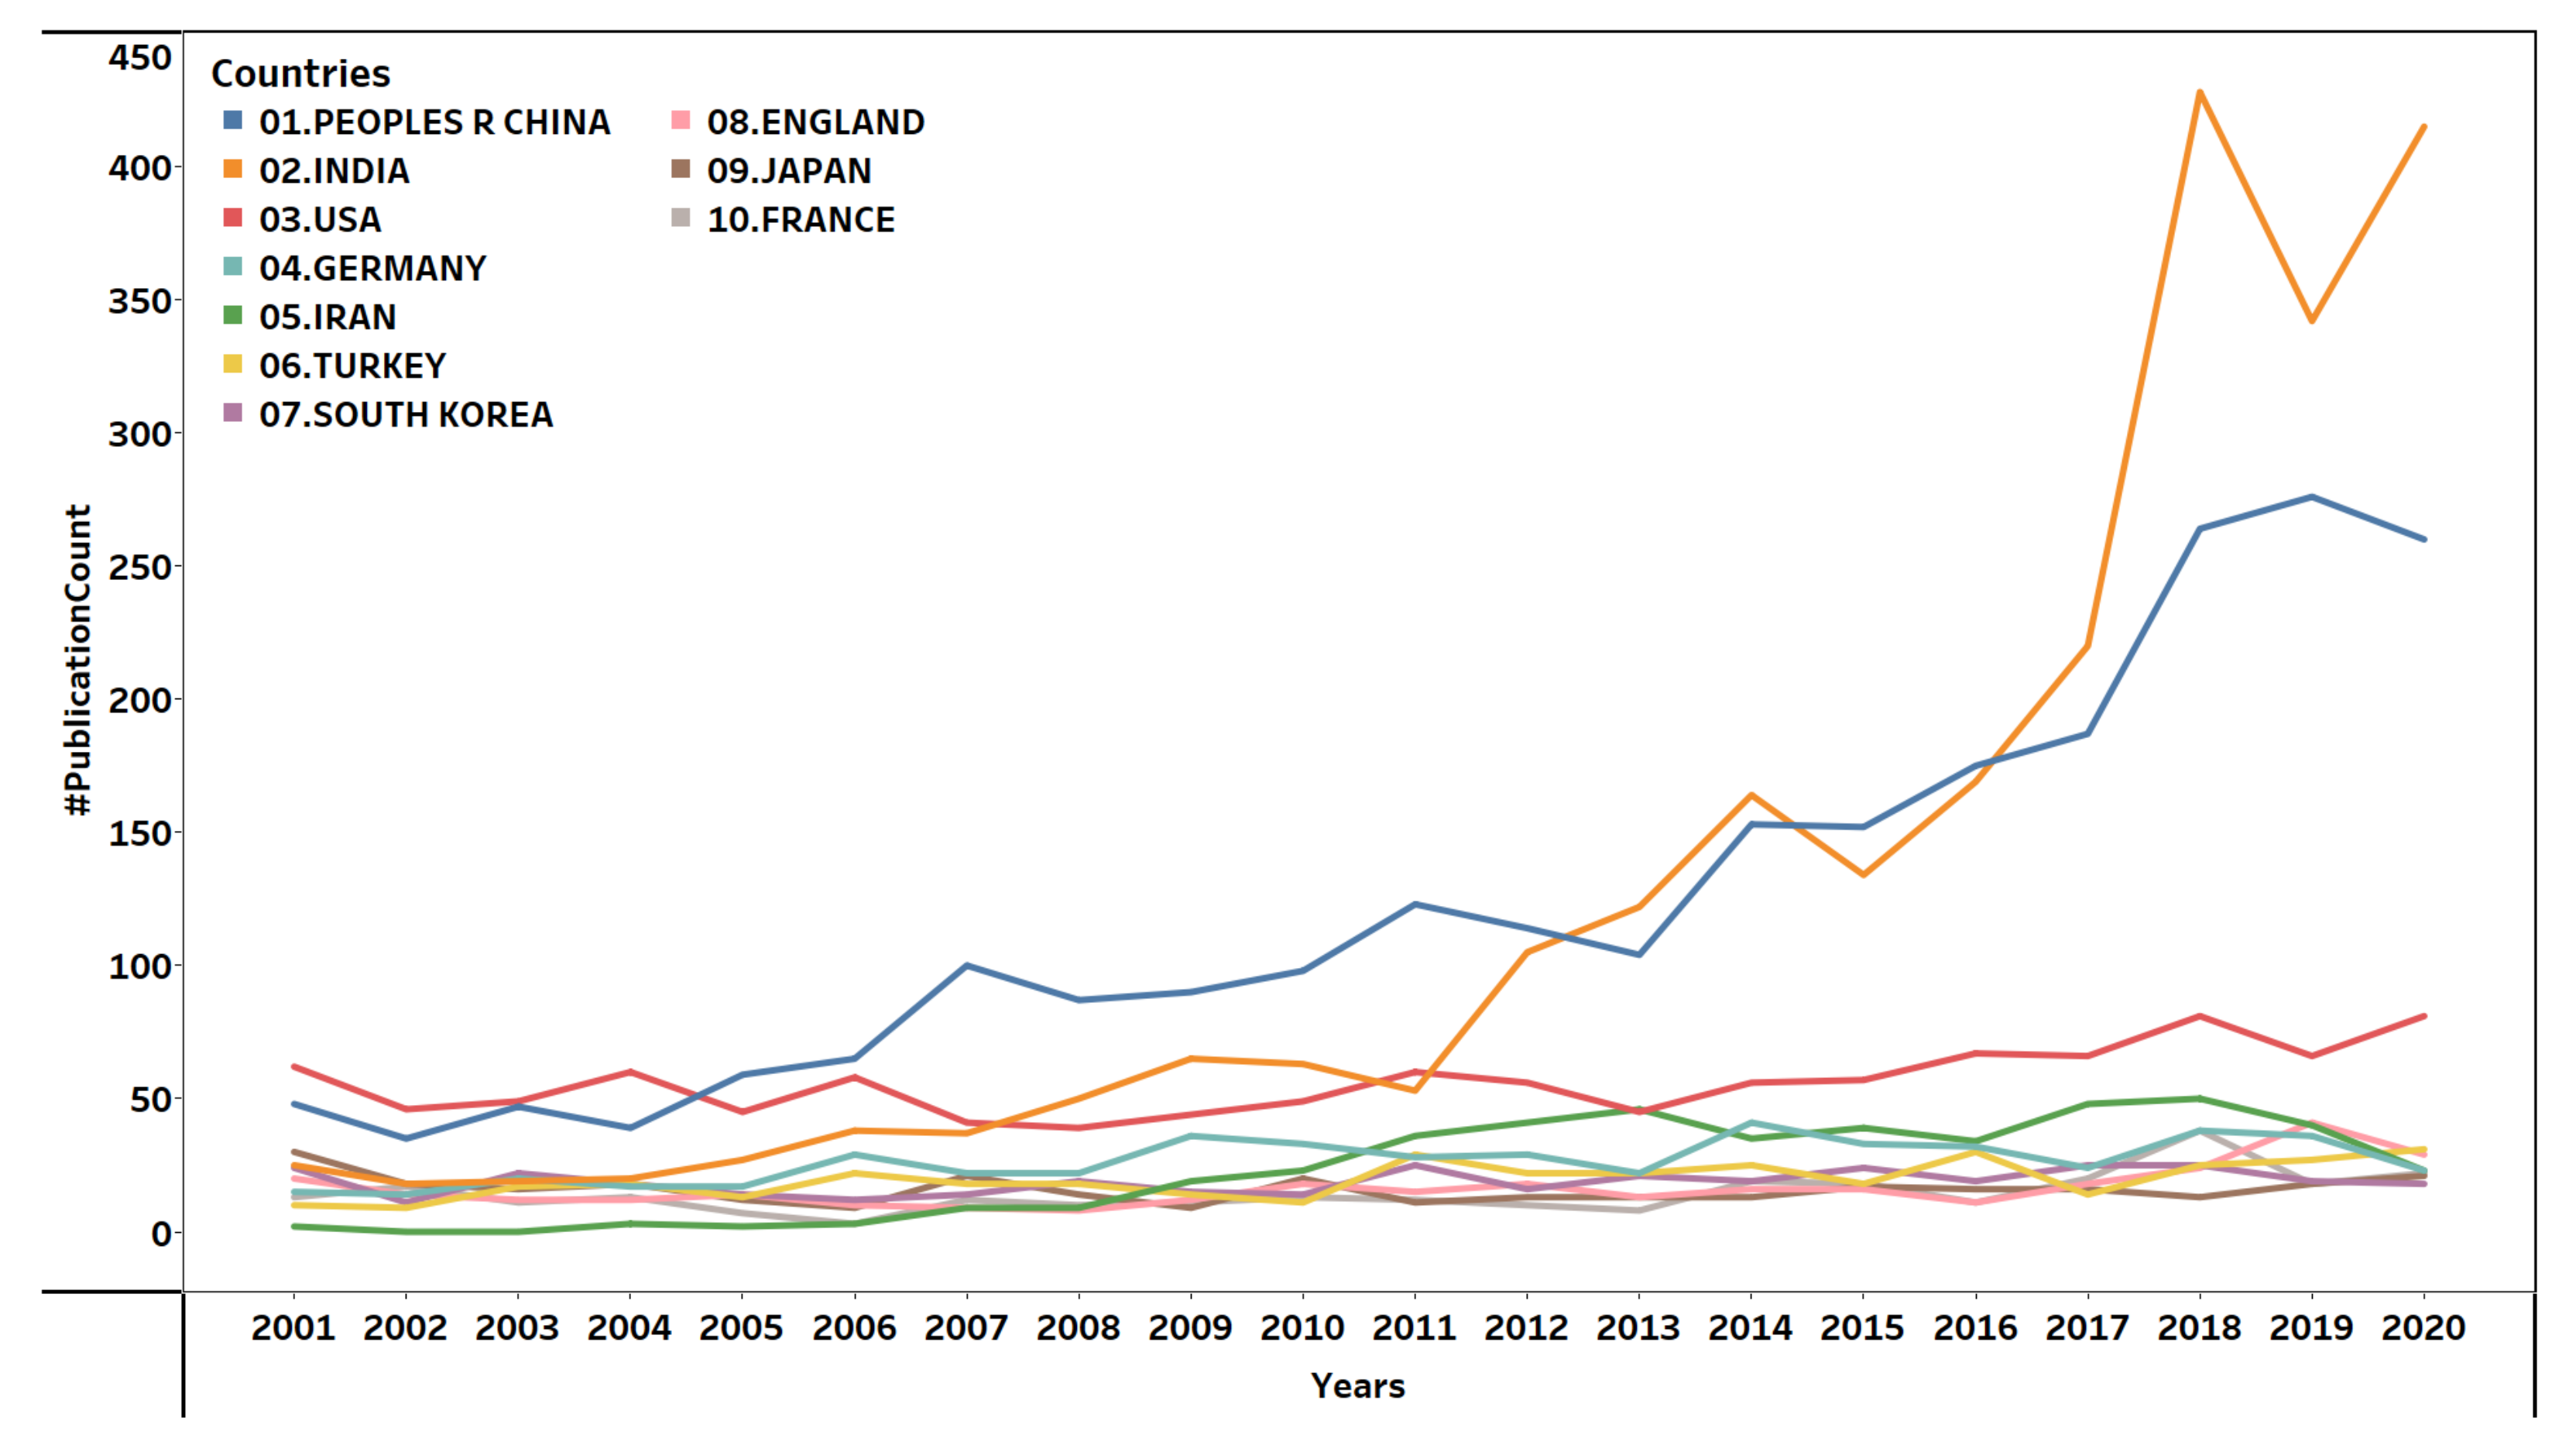
Figure 8.
The top 10 productive organizations worldwide.
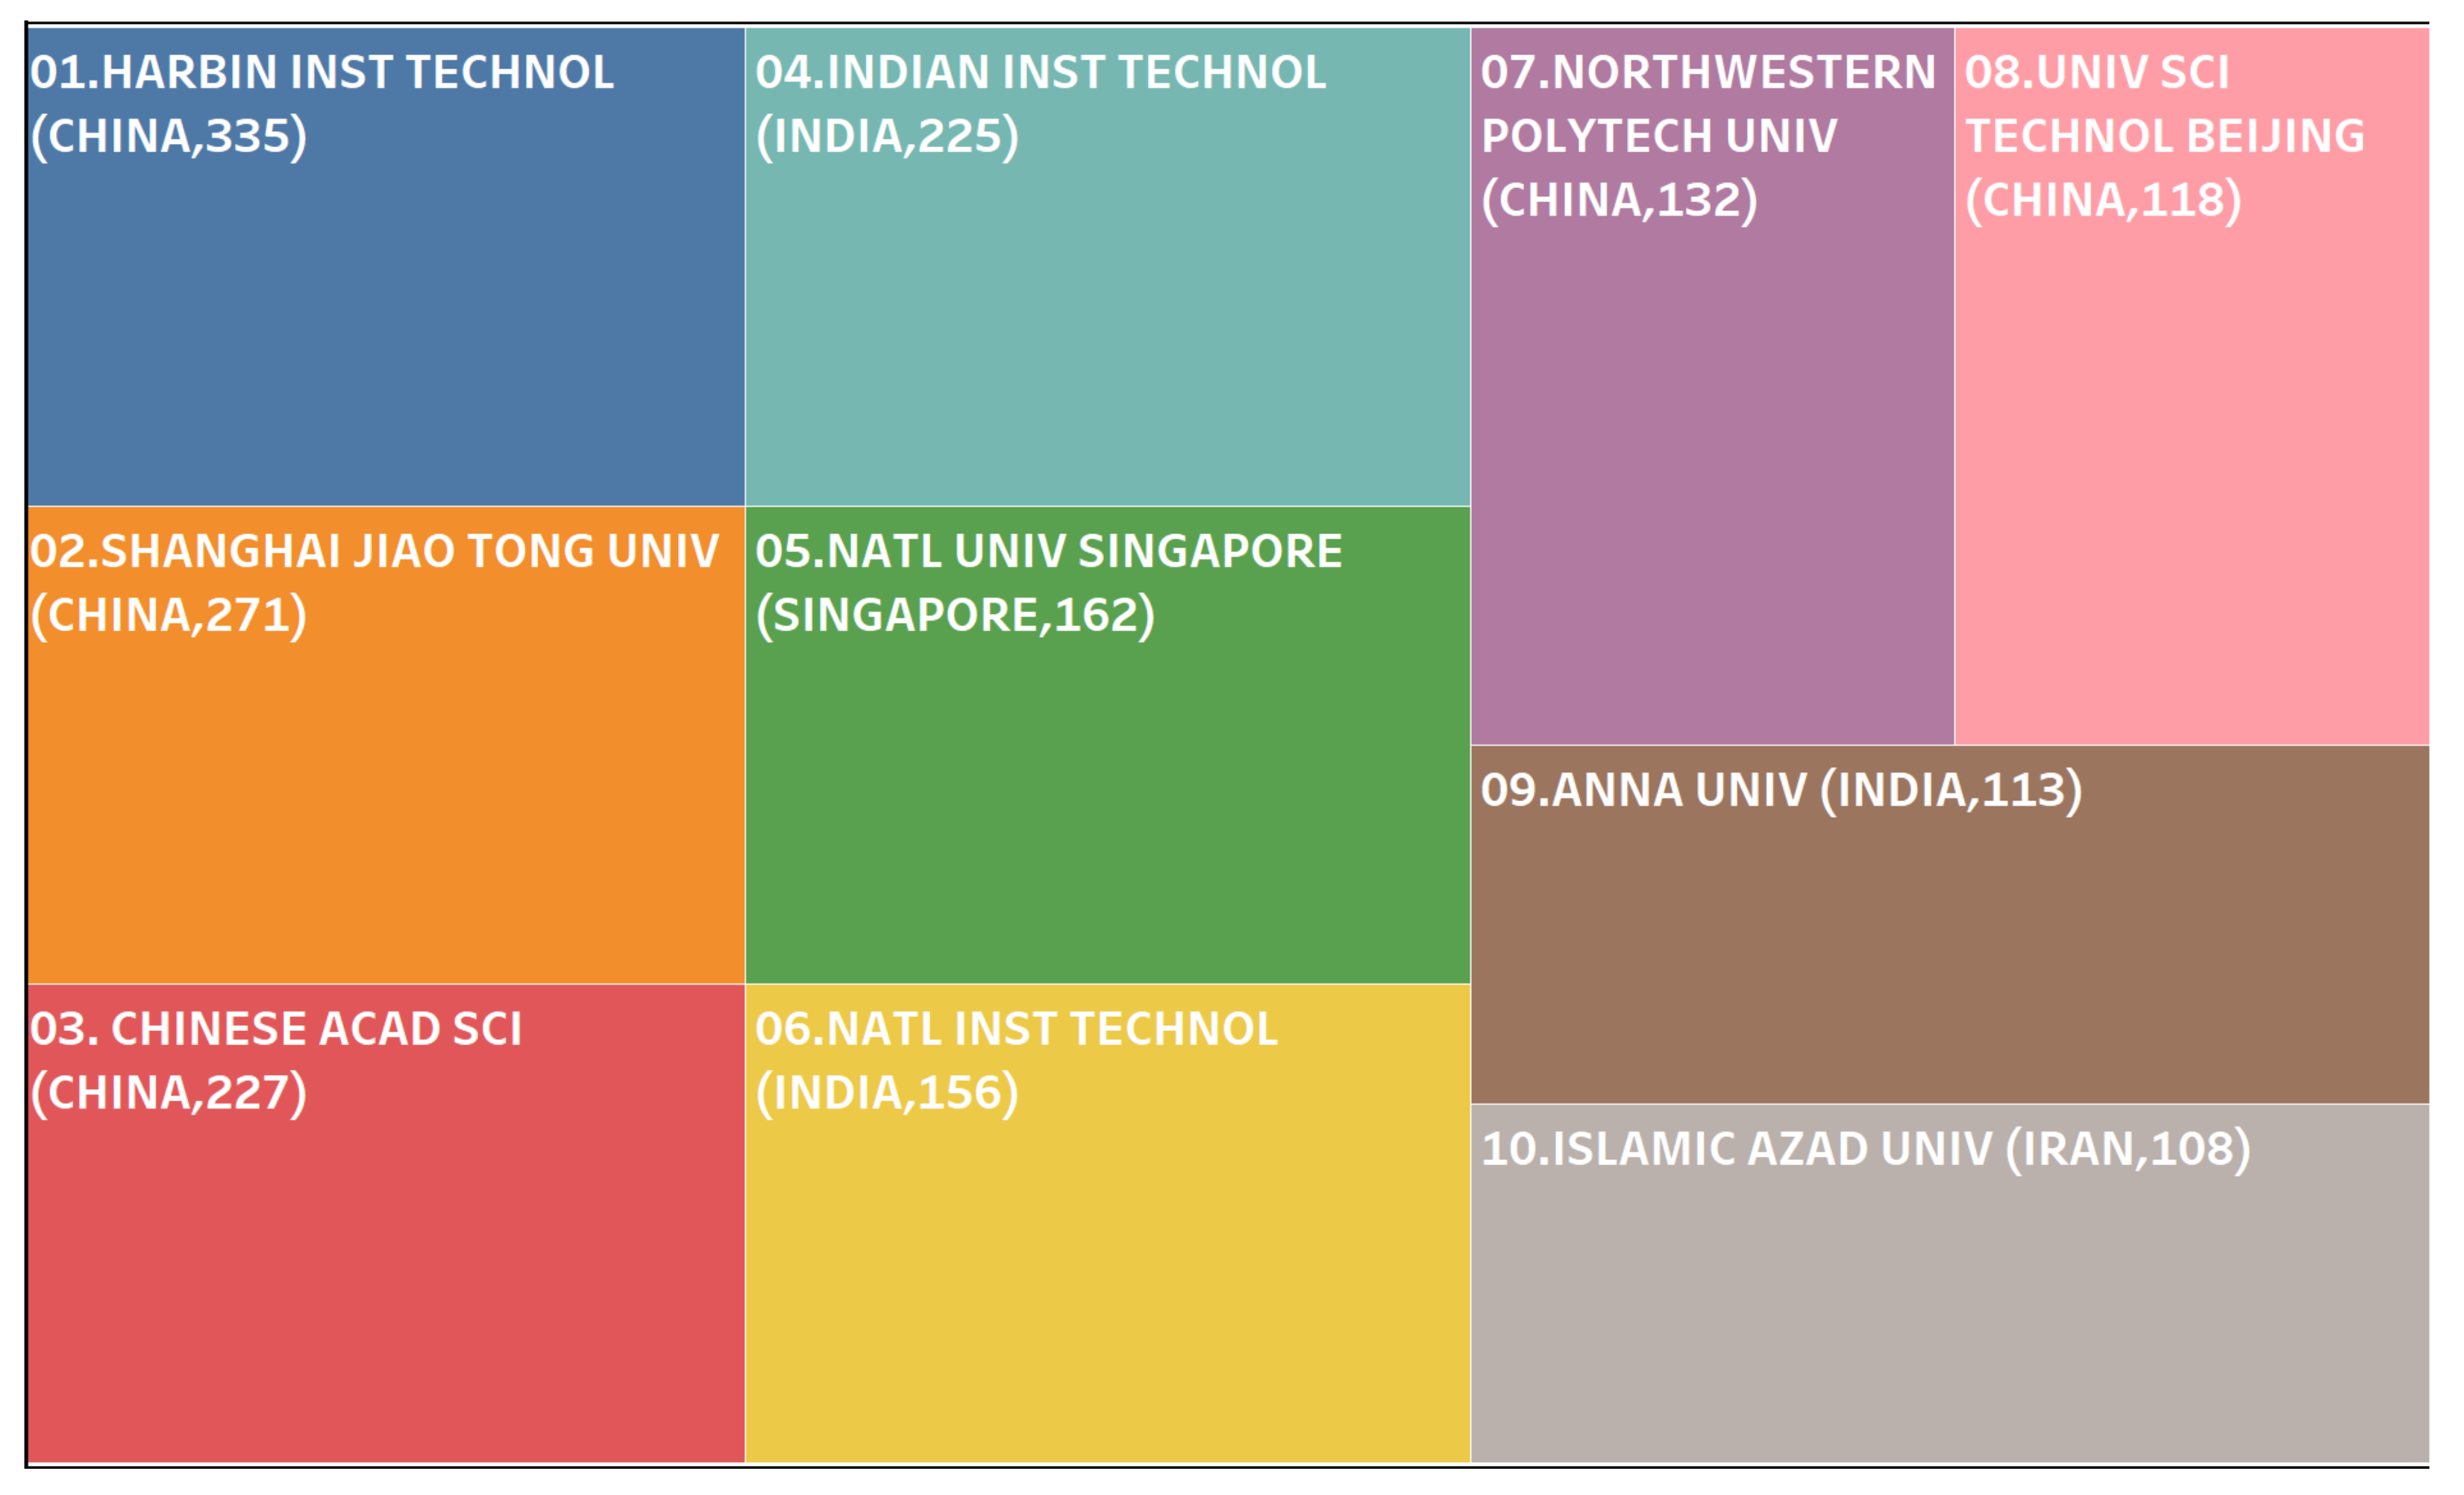
Figure 9.
The top 10 productive Indian organizations.
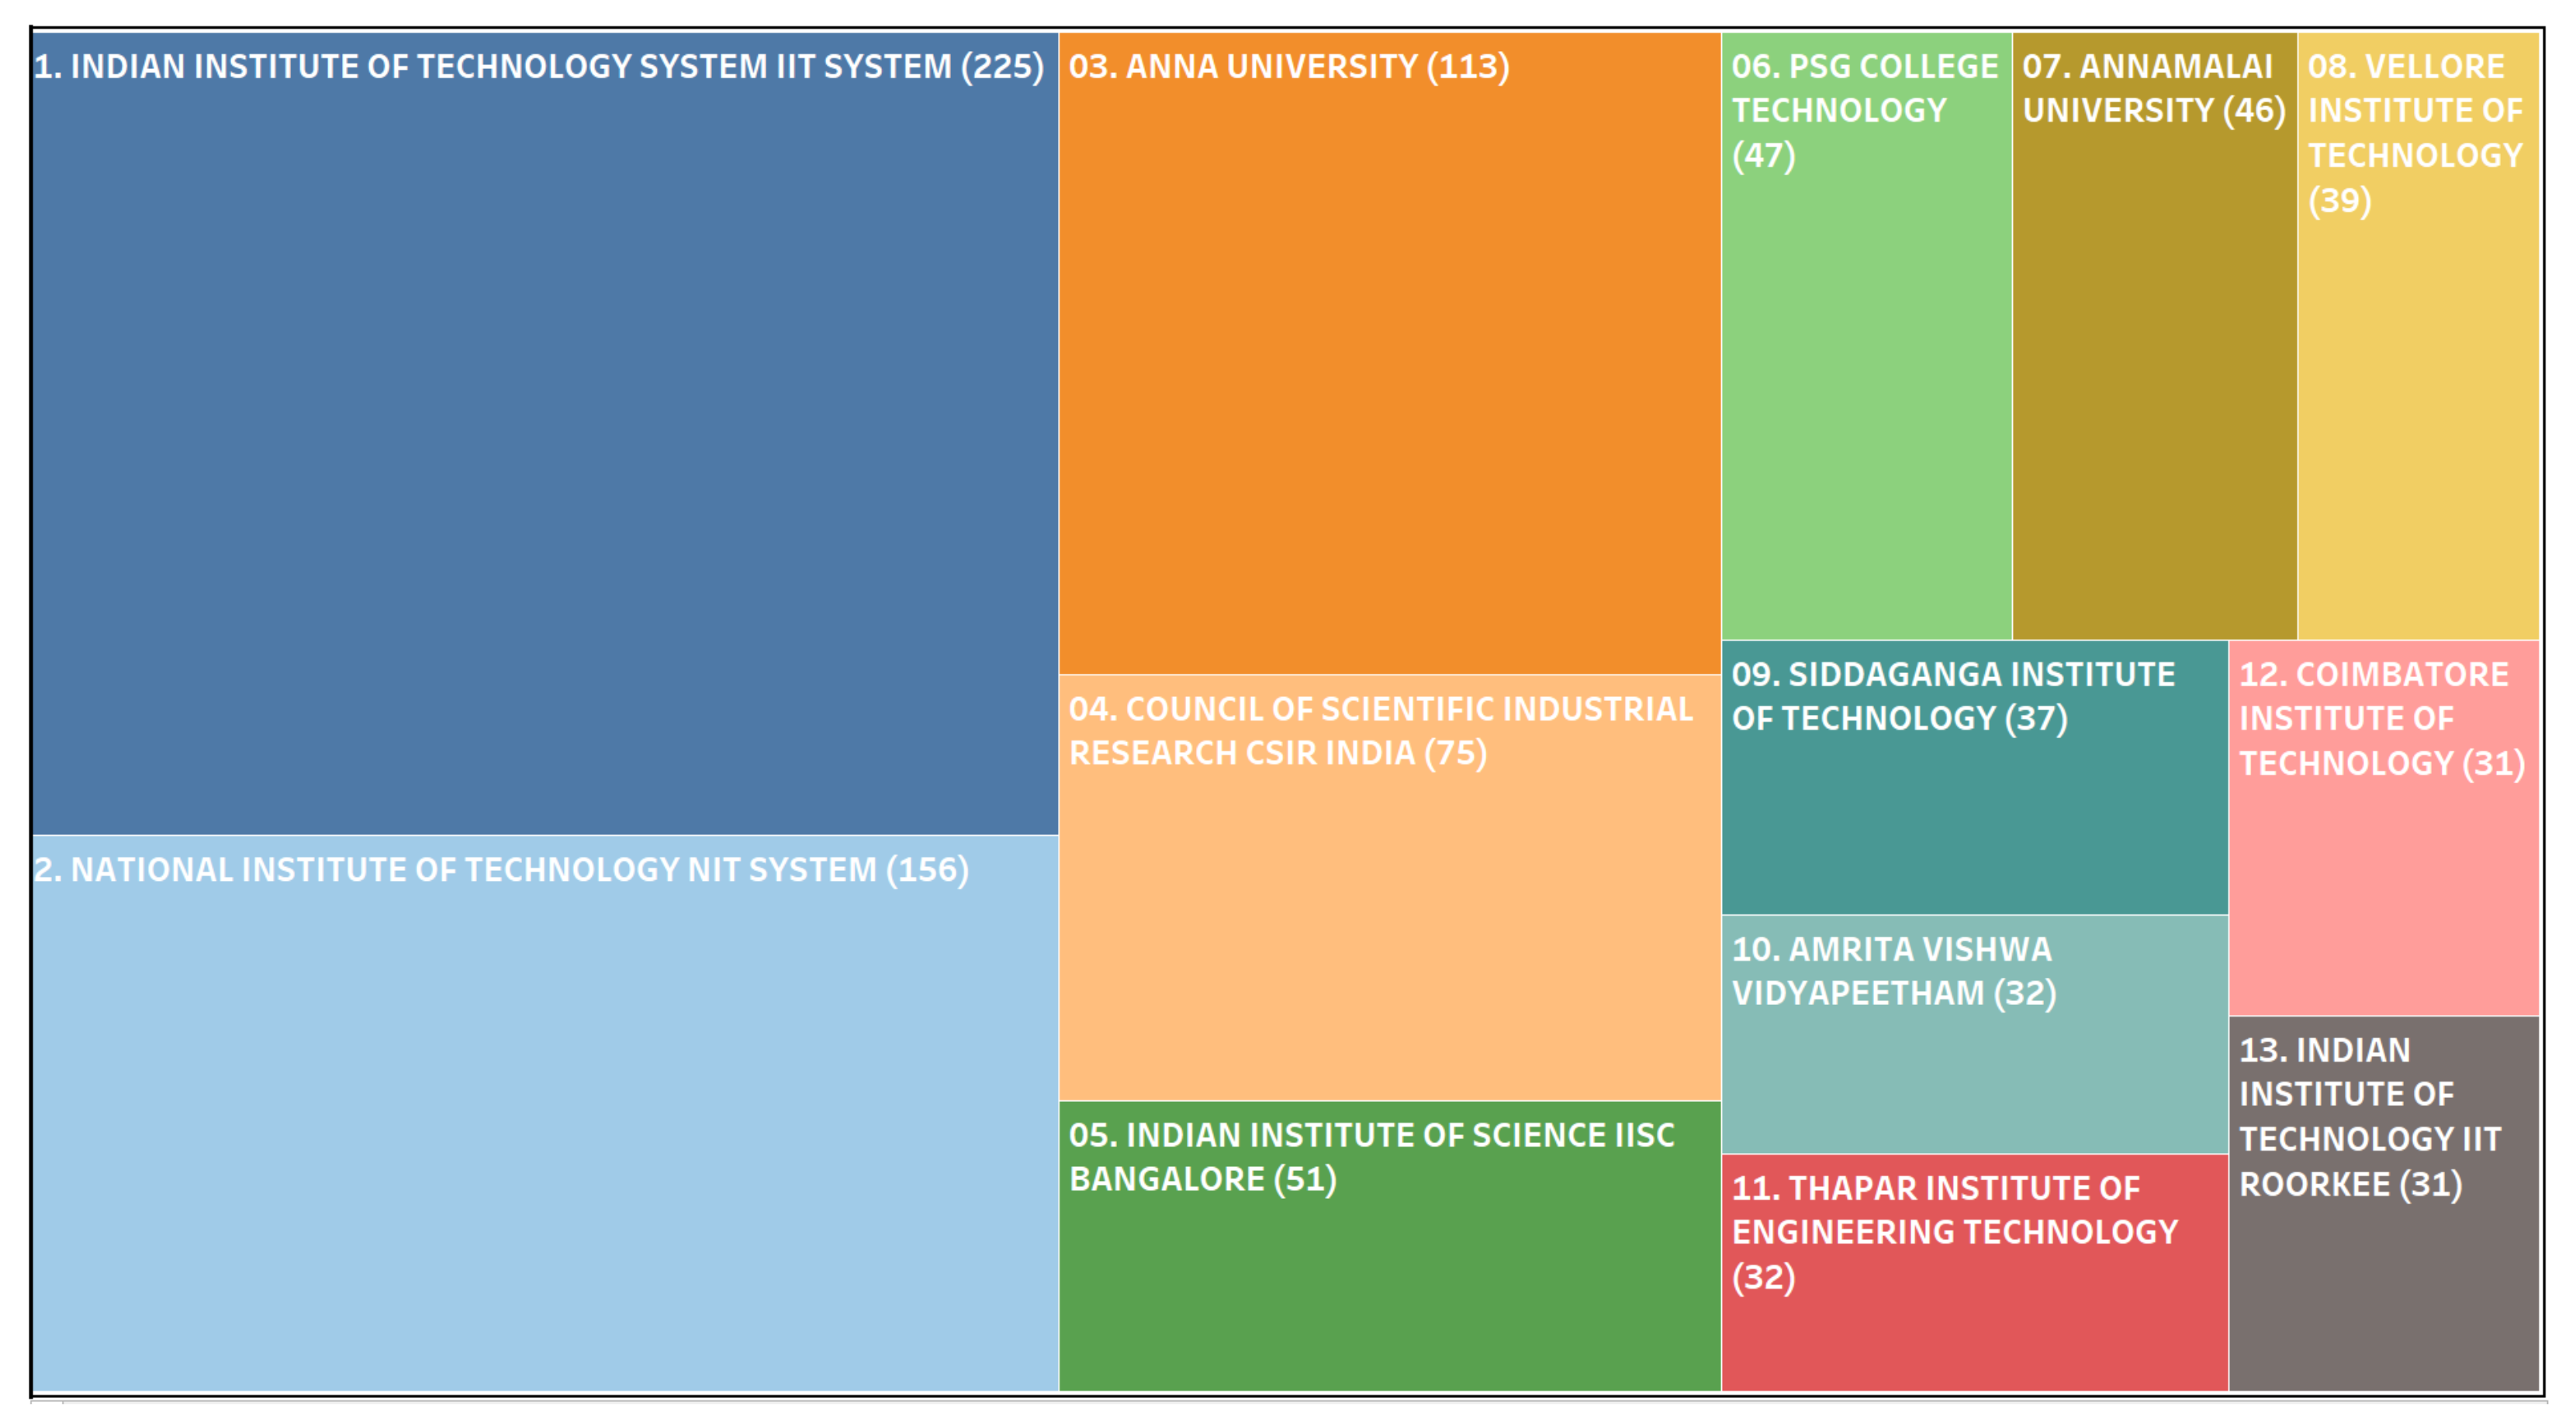
Figure 10.
The collaboration networks of MMC researchers.
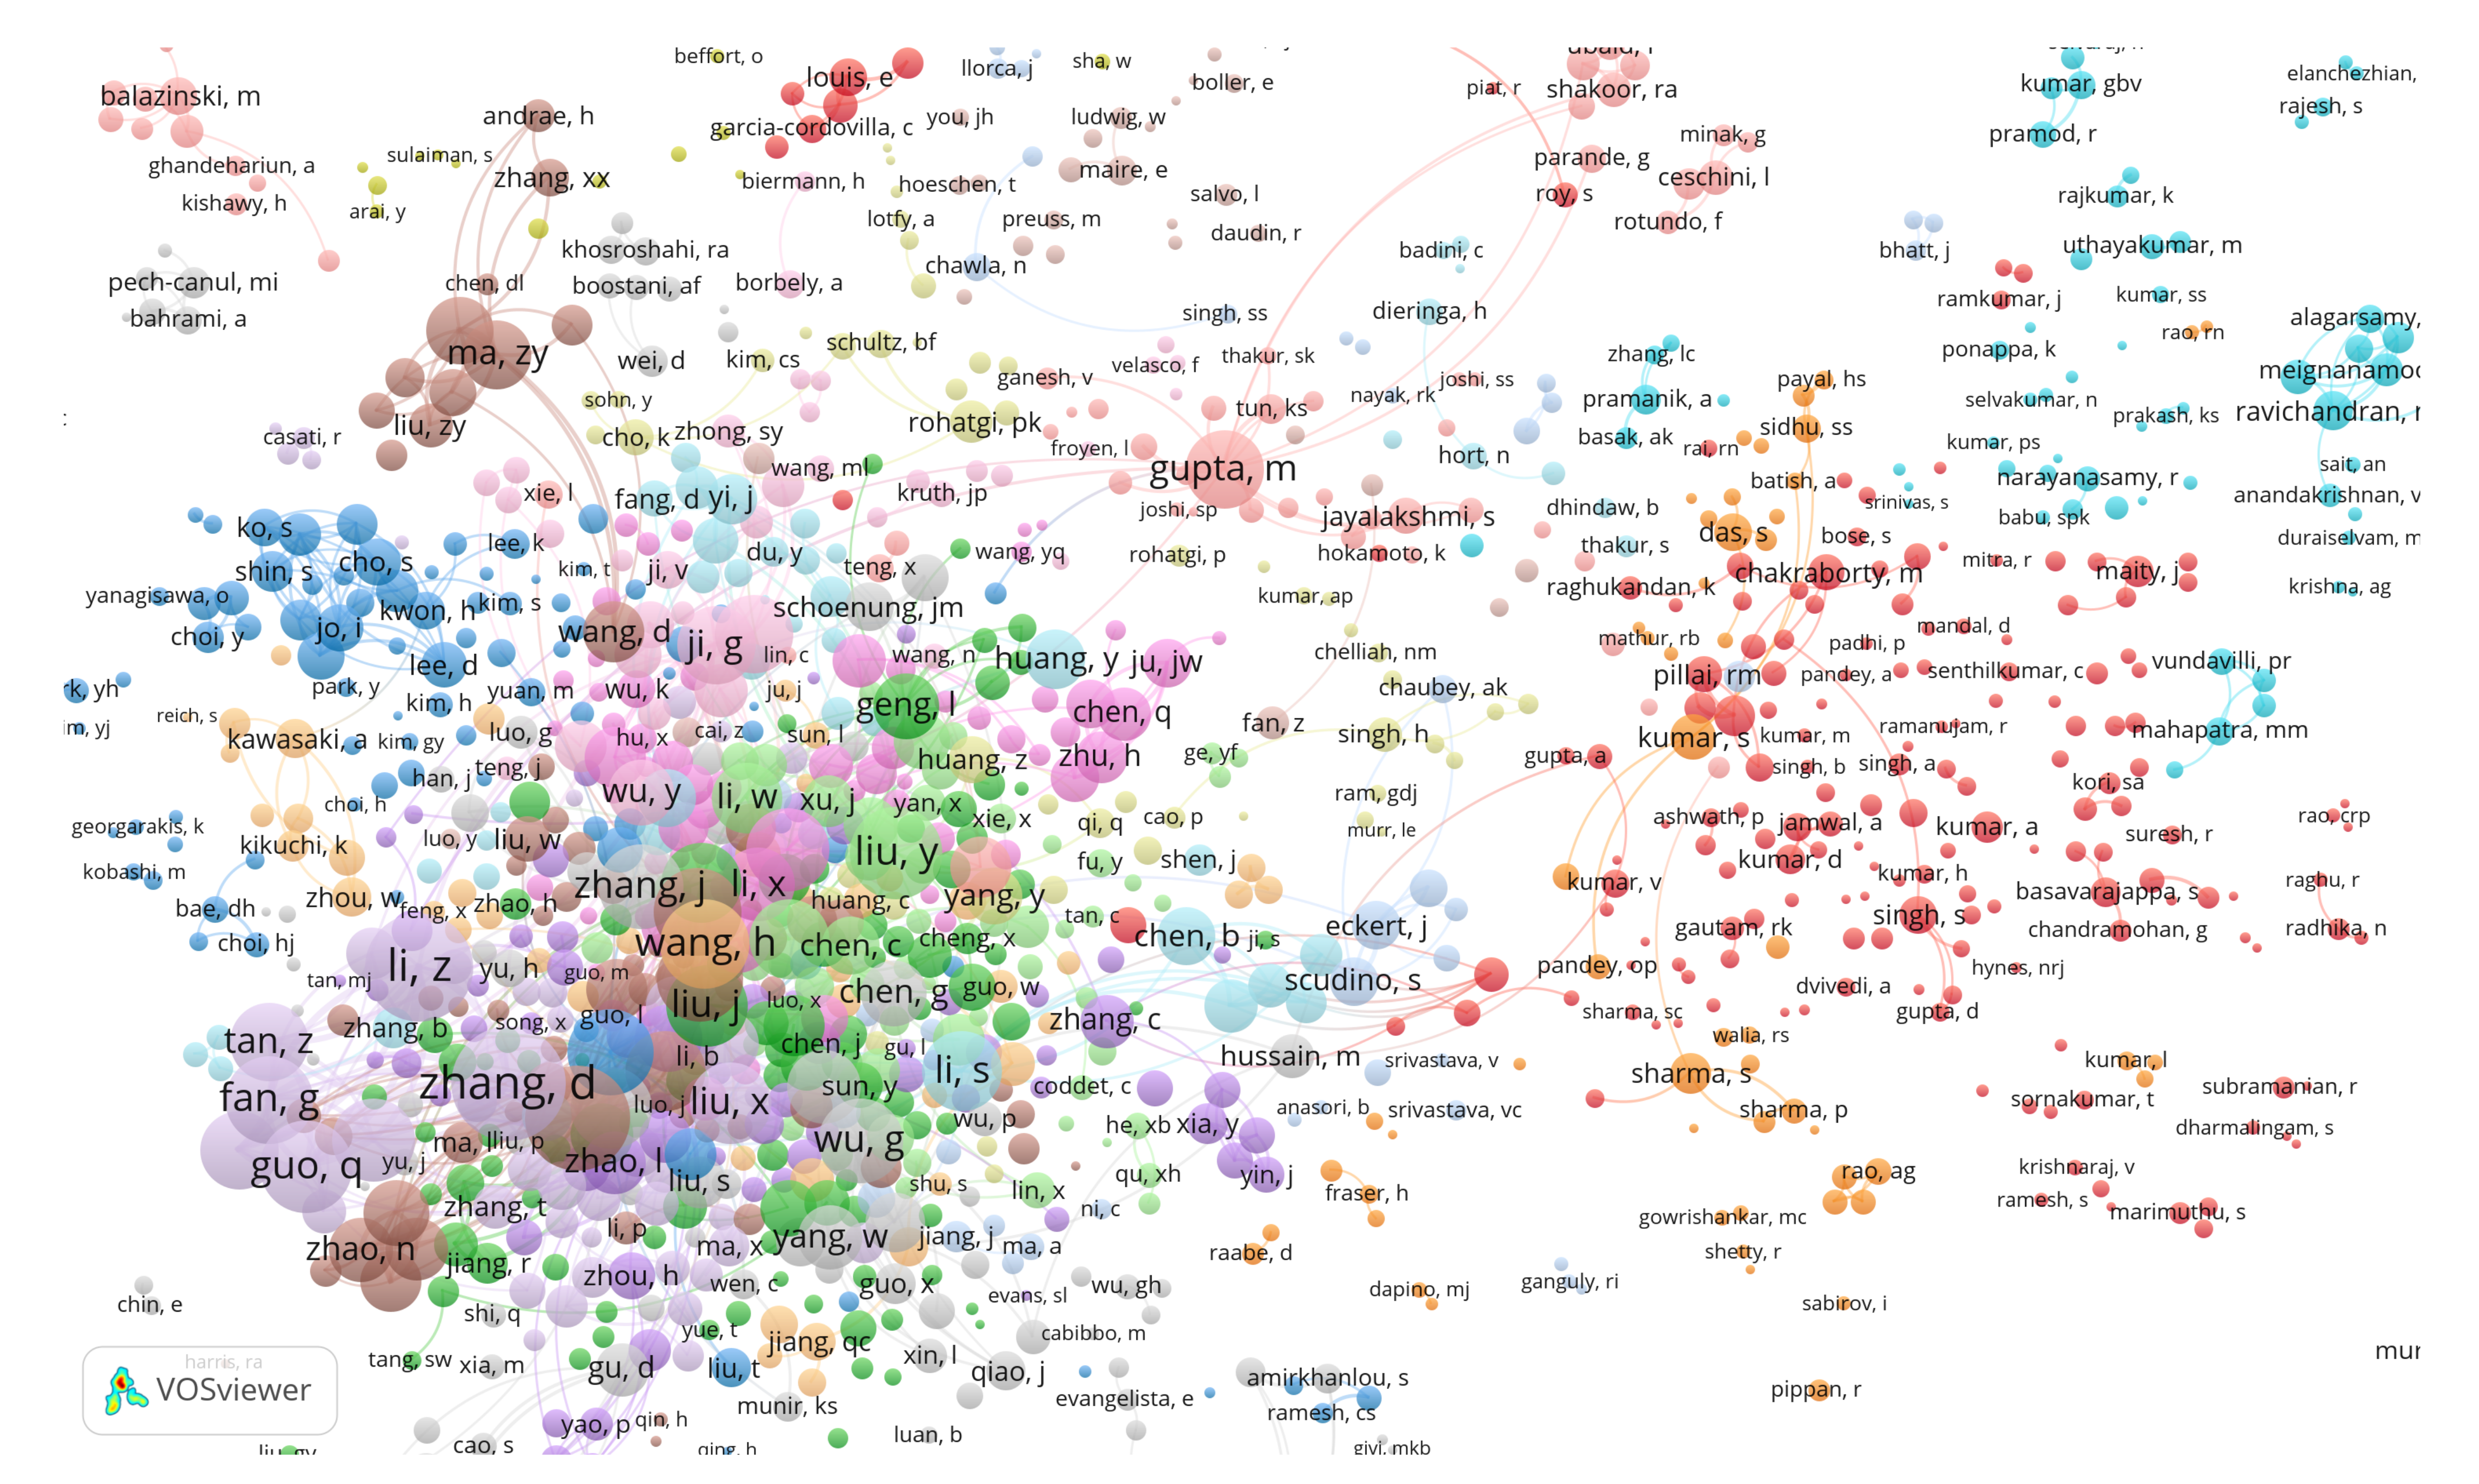
Figure 11.
The collaboration network of Zhang D.

Figure 12.
The collaboration network of Gupta M.
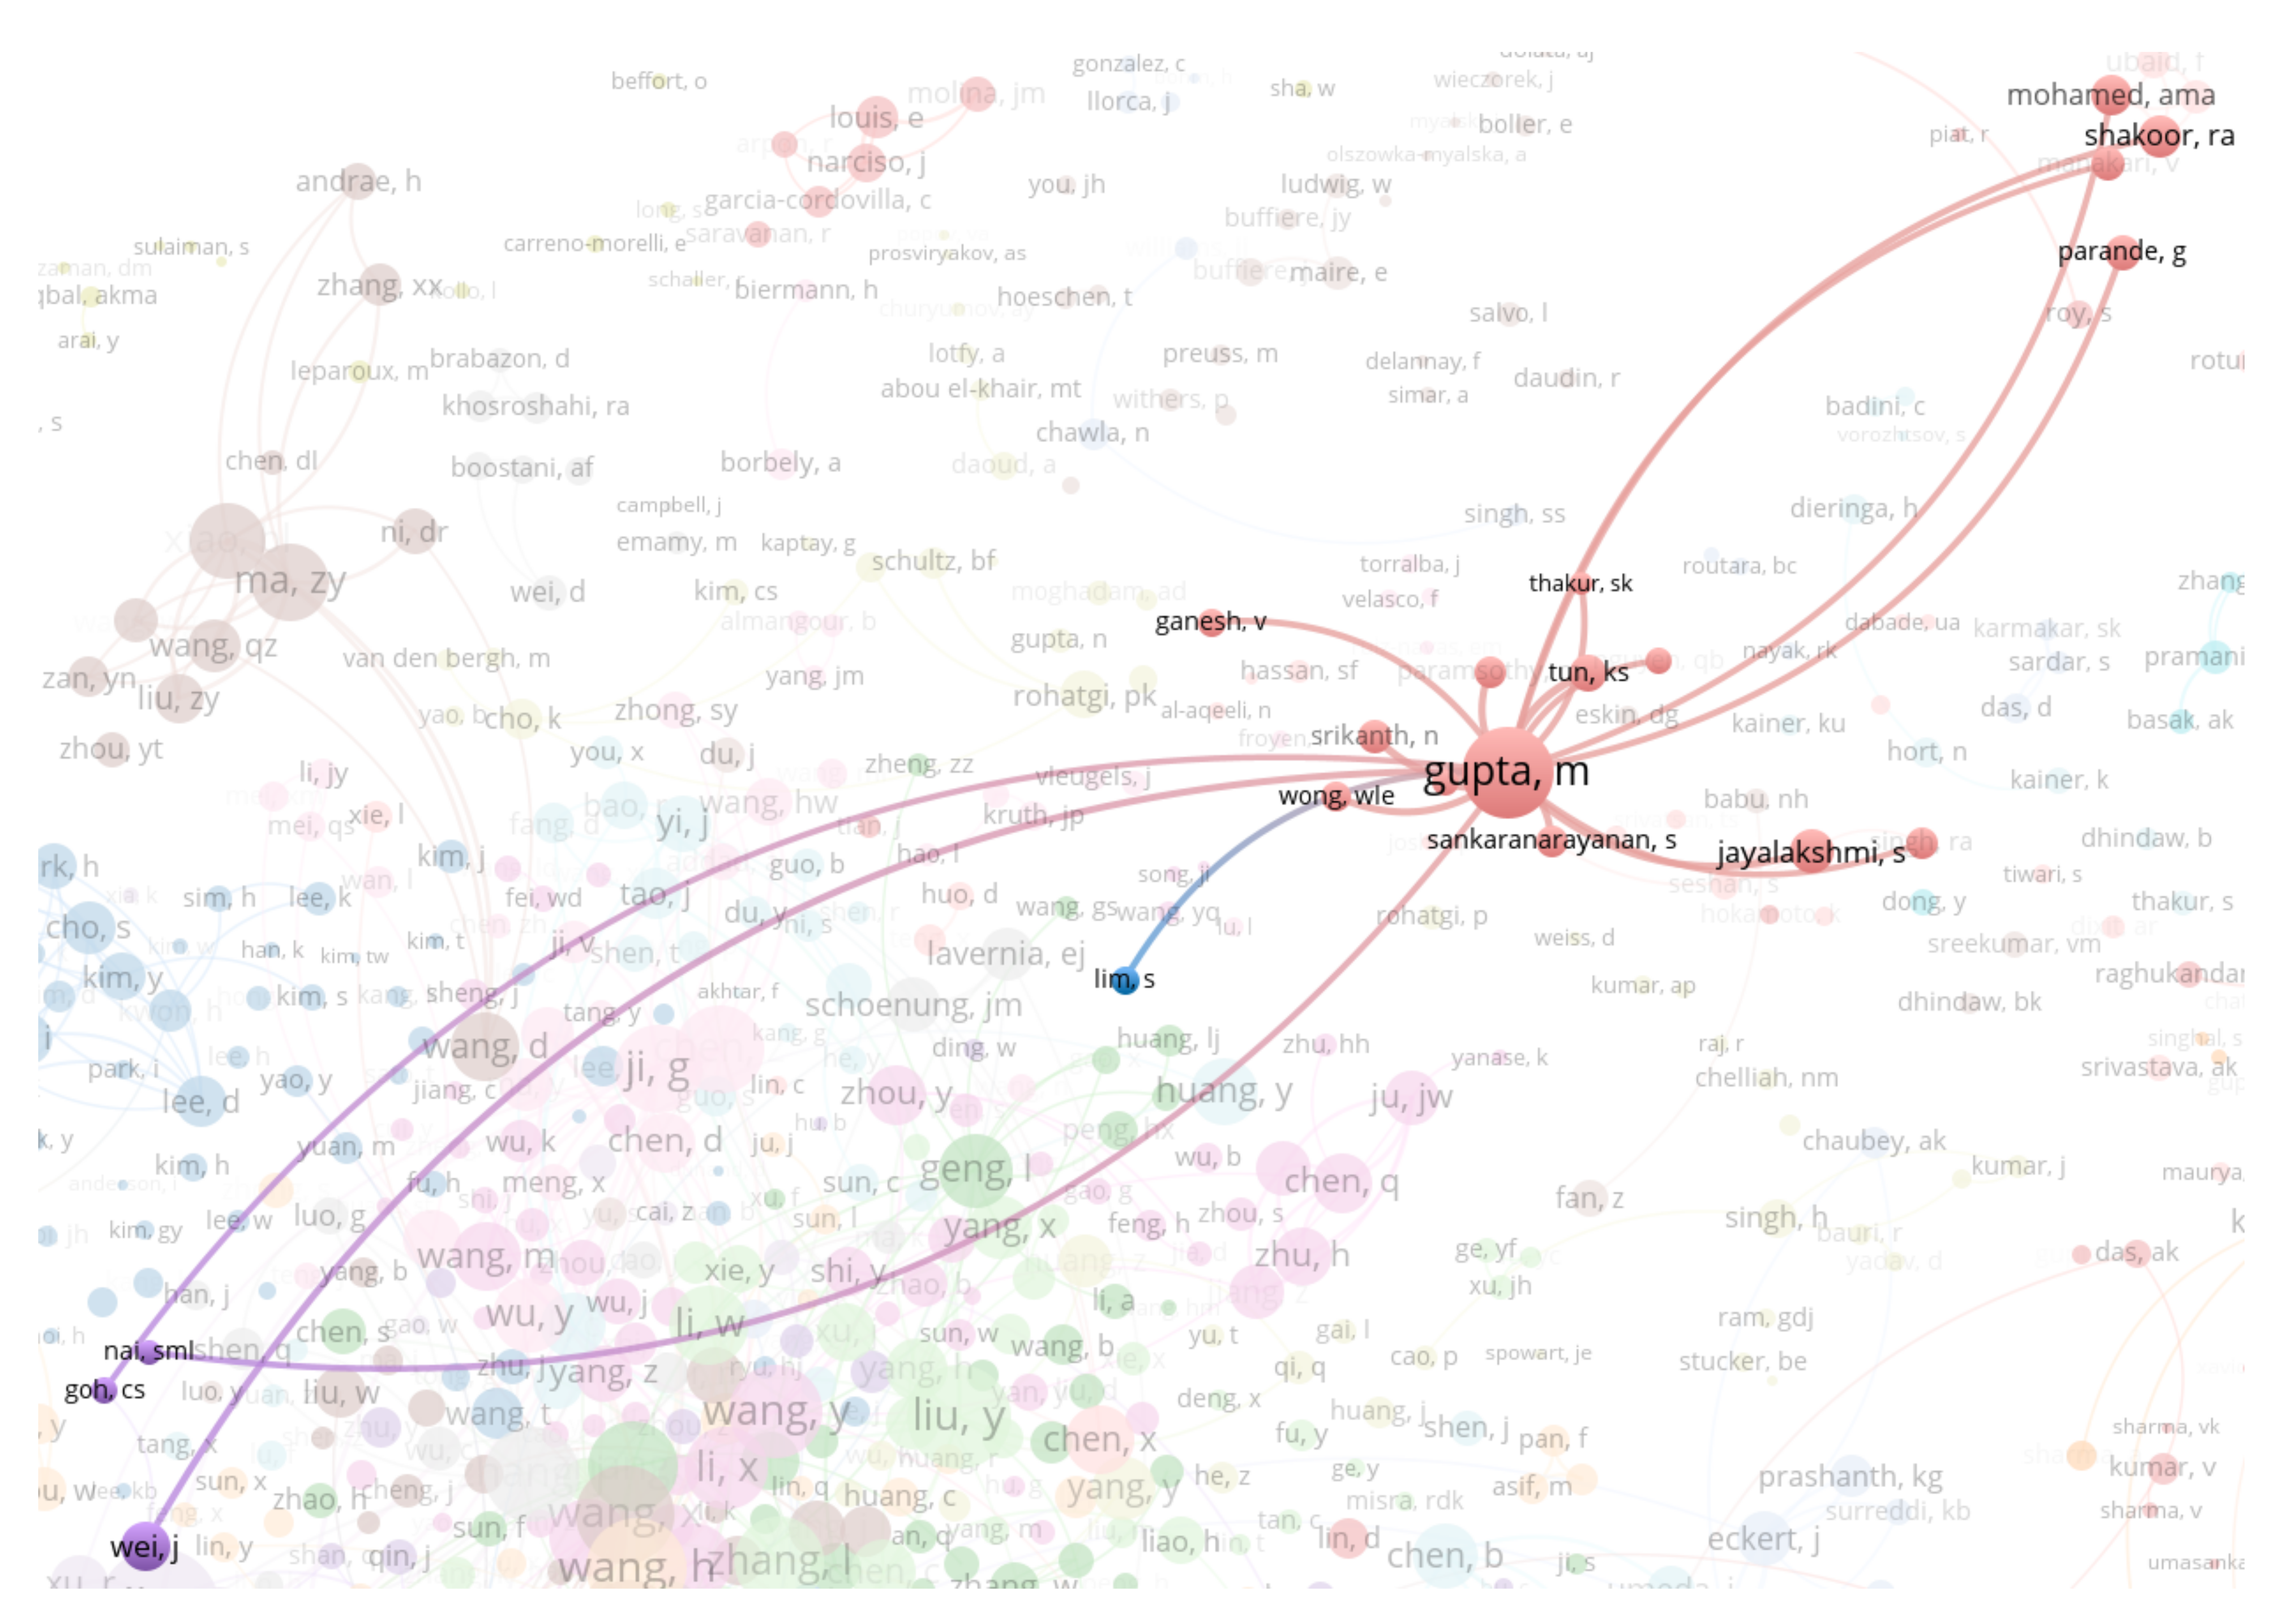
Figure 13.
The collaboration networks of organizations.
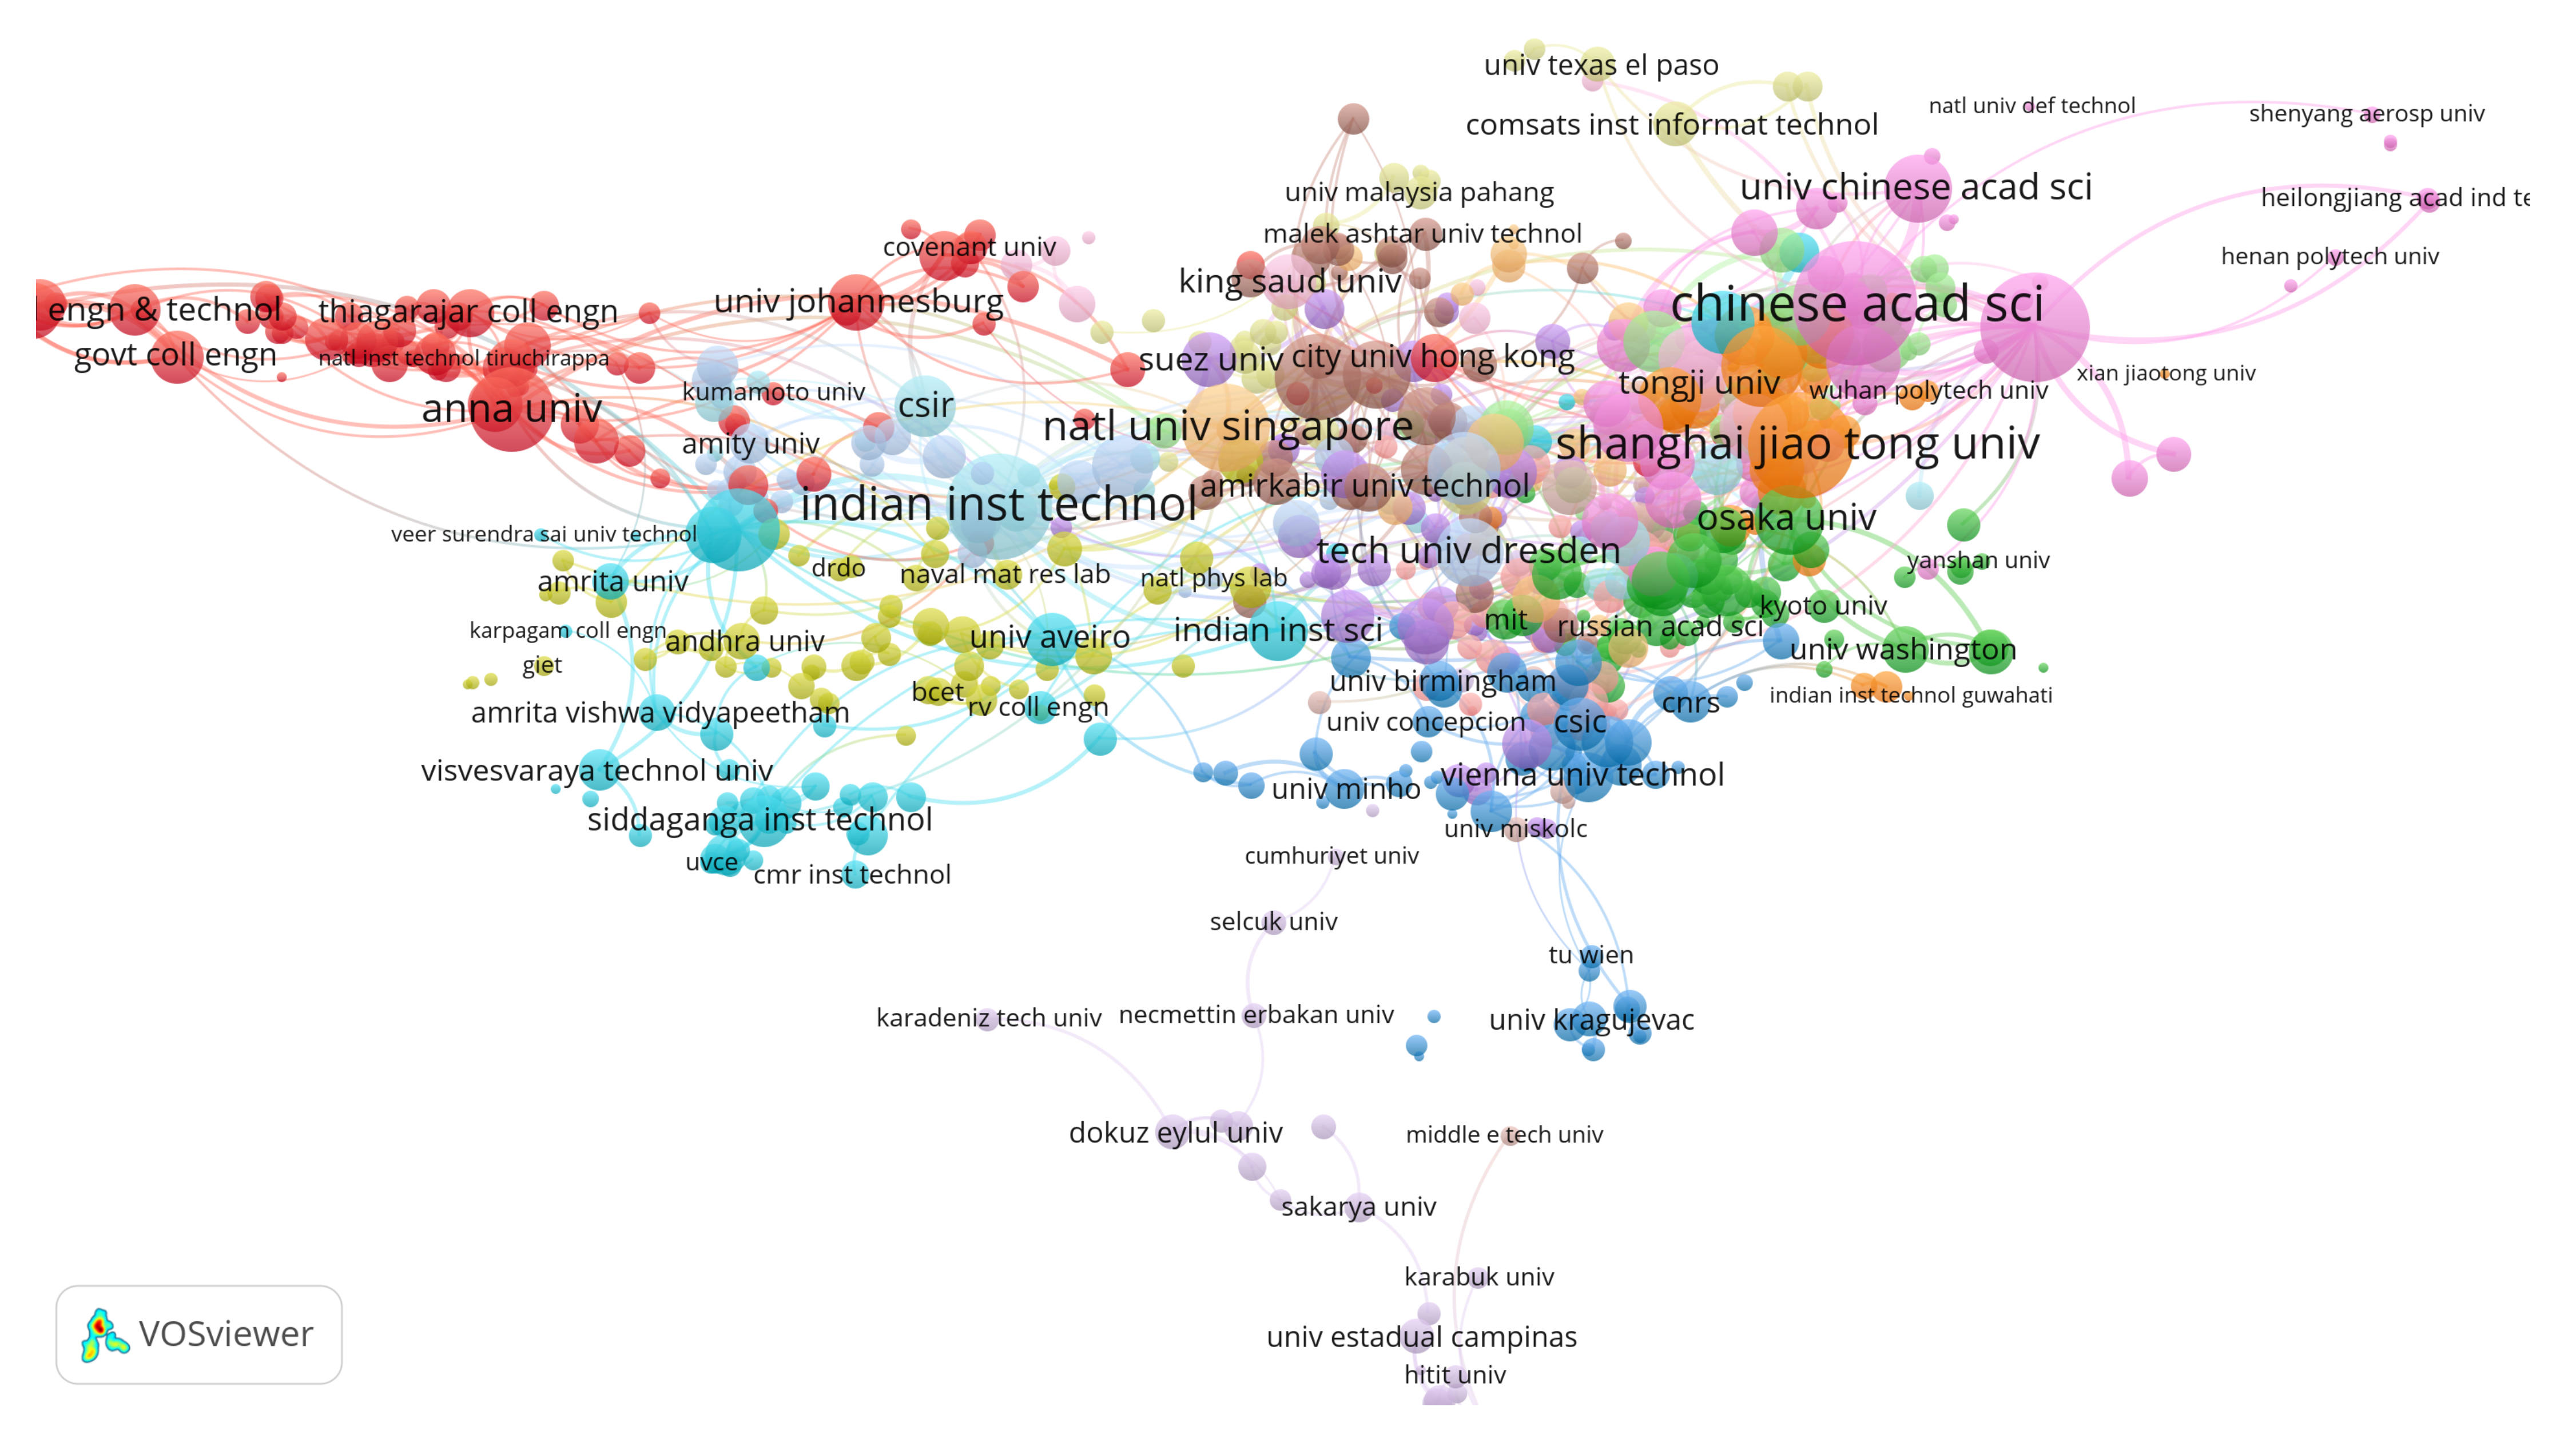
Figure 14.
The collaboration networks among nations.
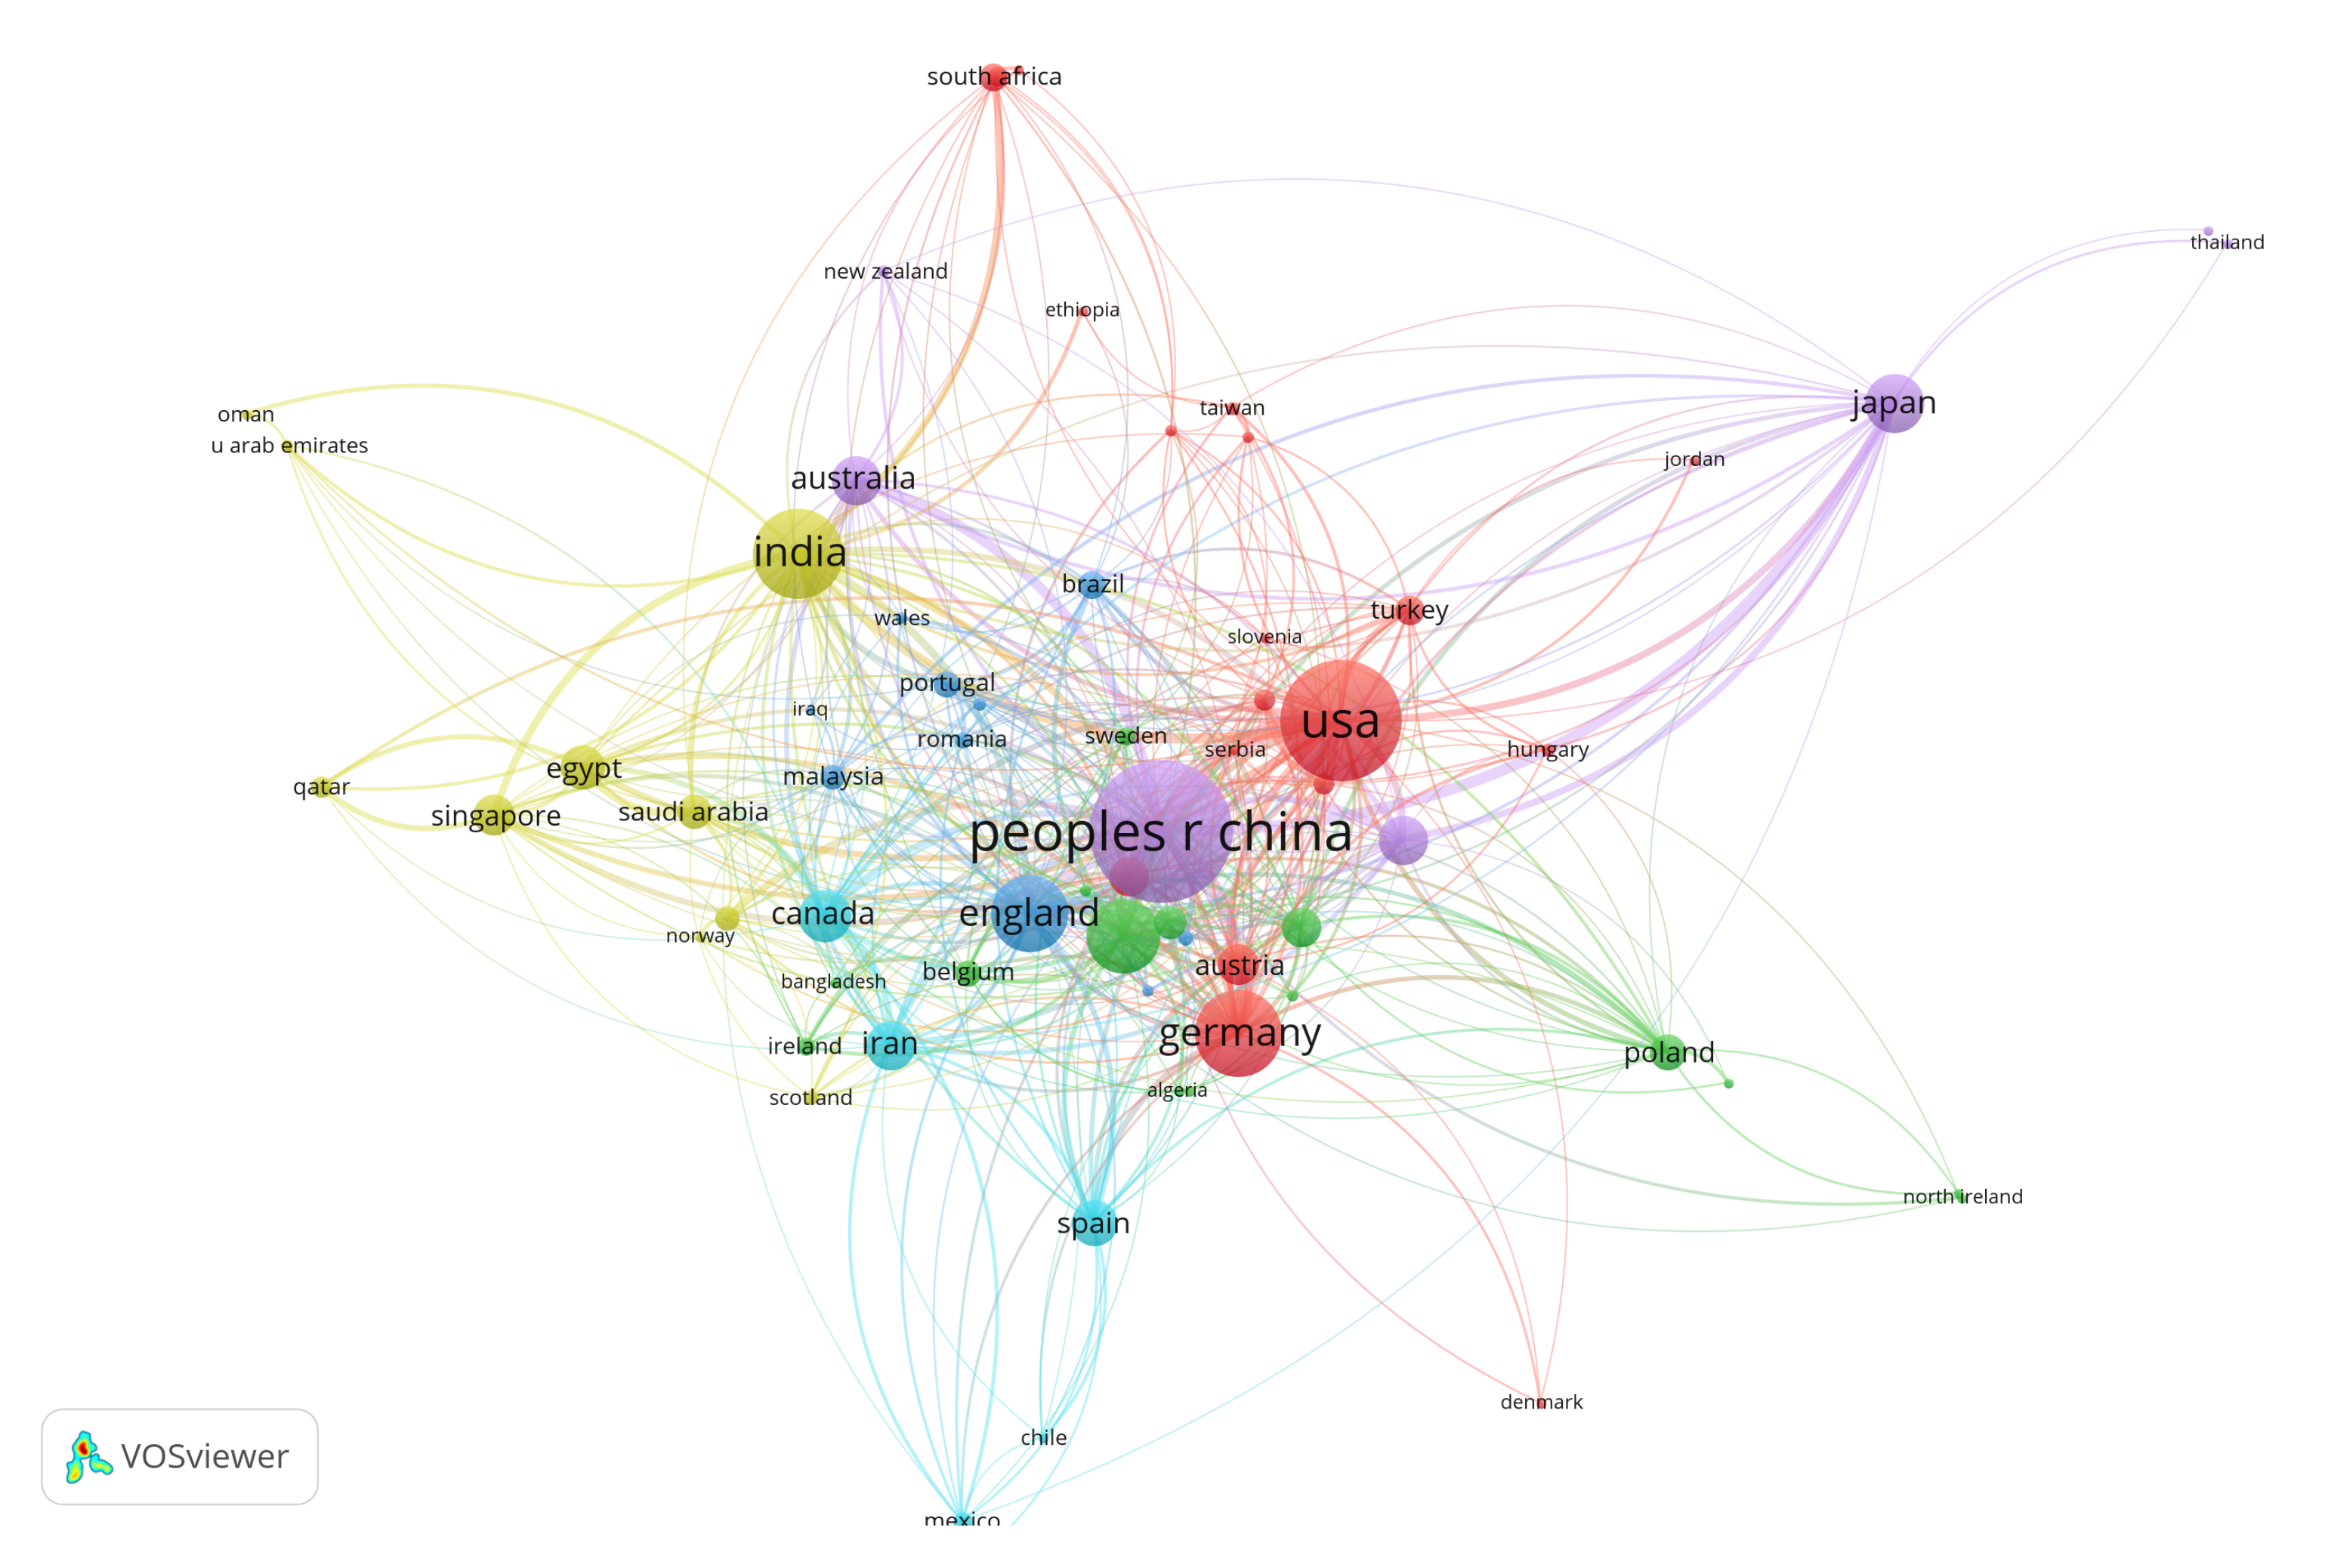
Figure 15.
The international collaboration network of the People’s Republic of China.
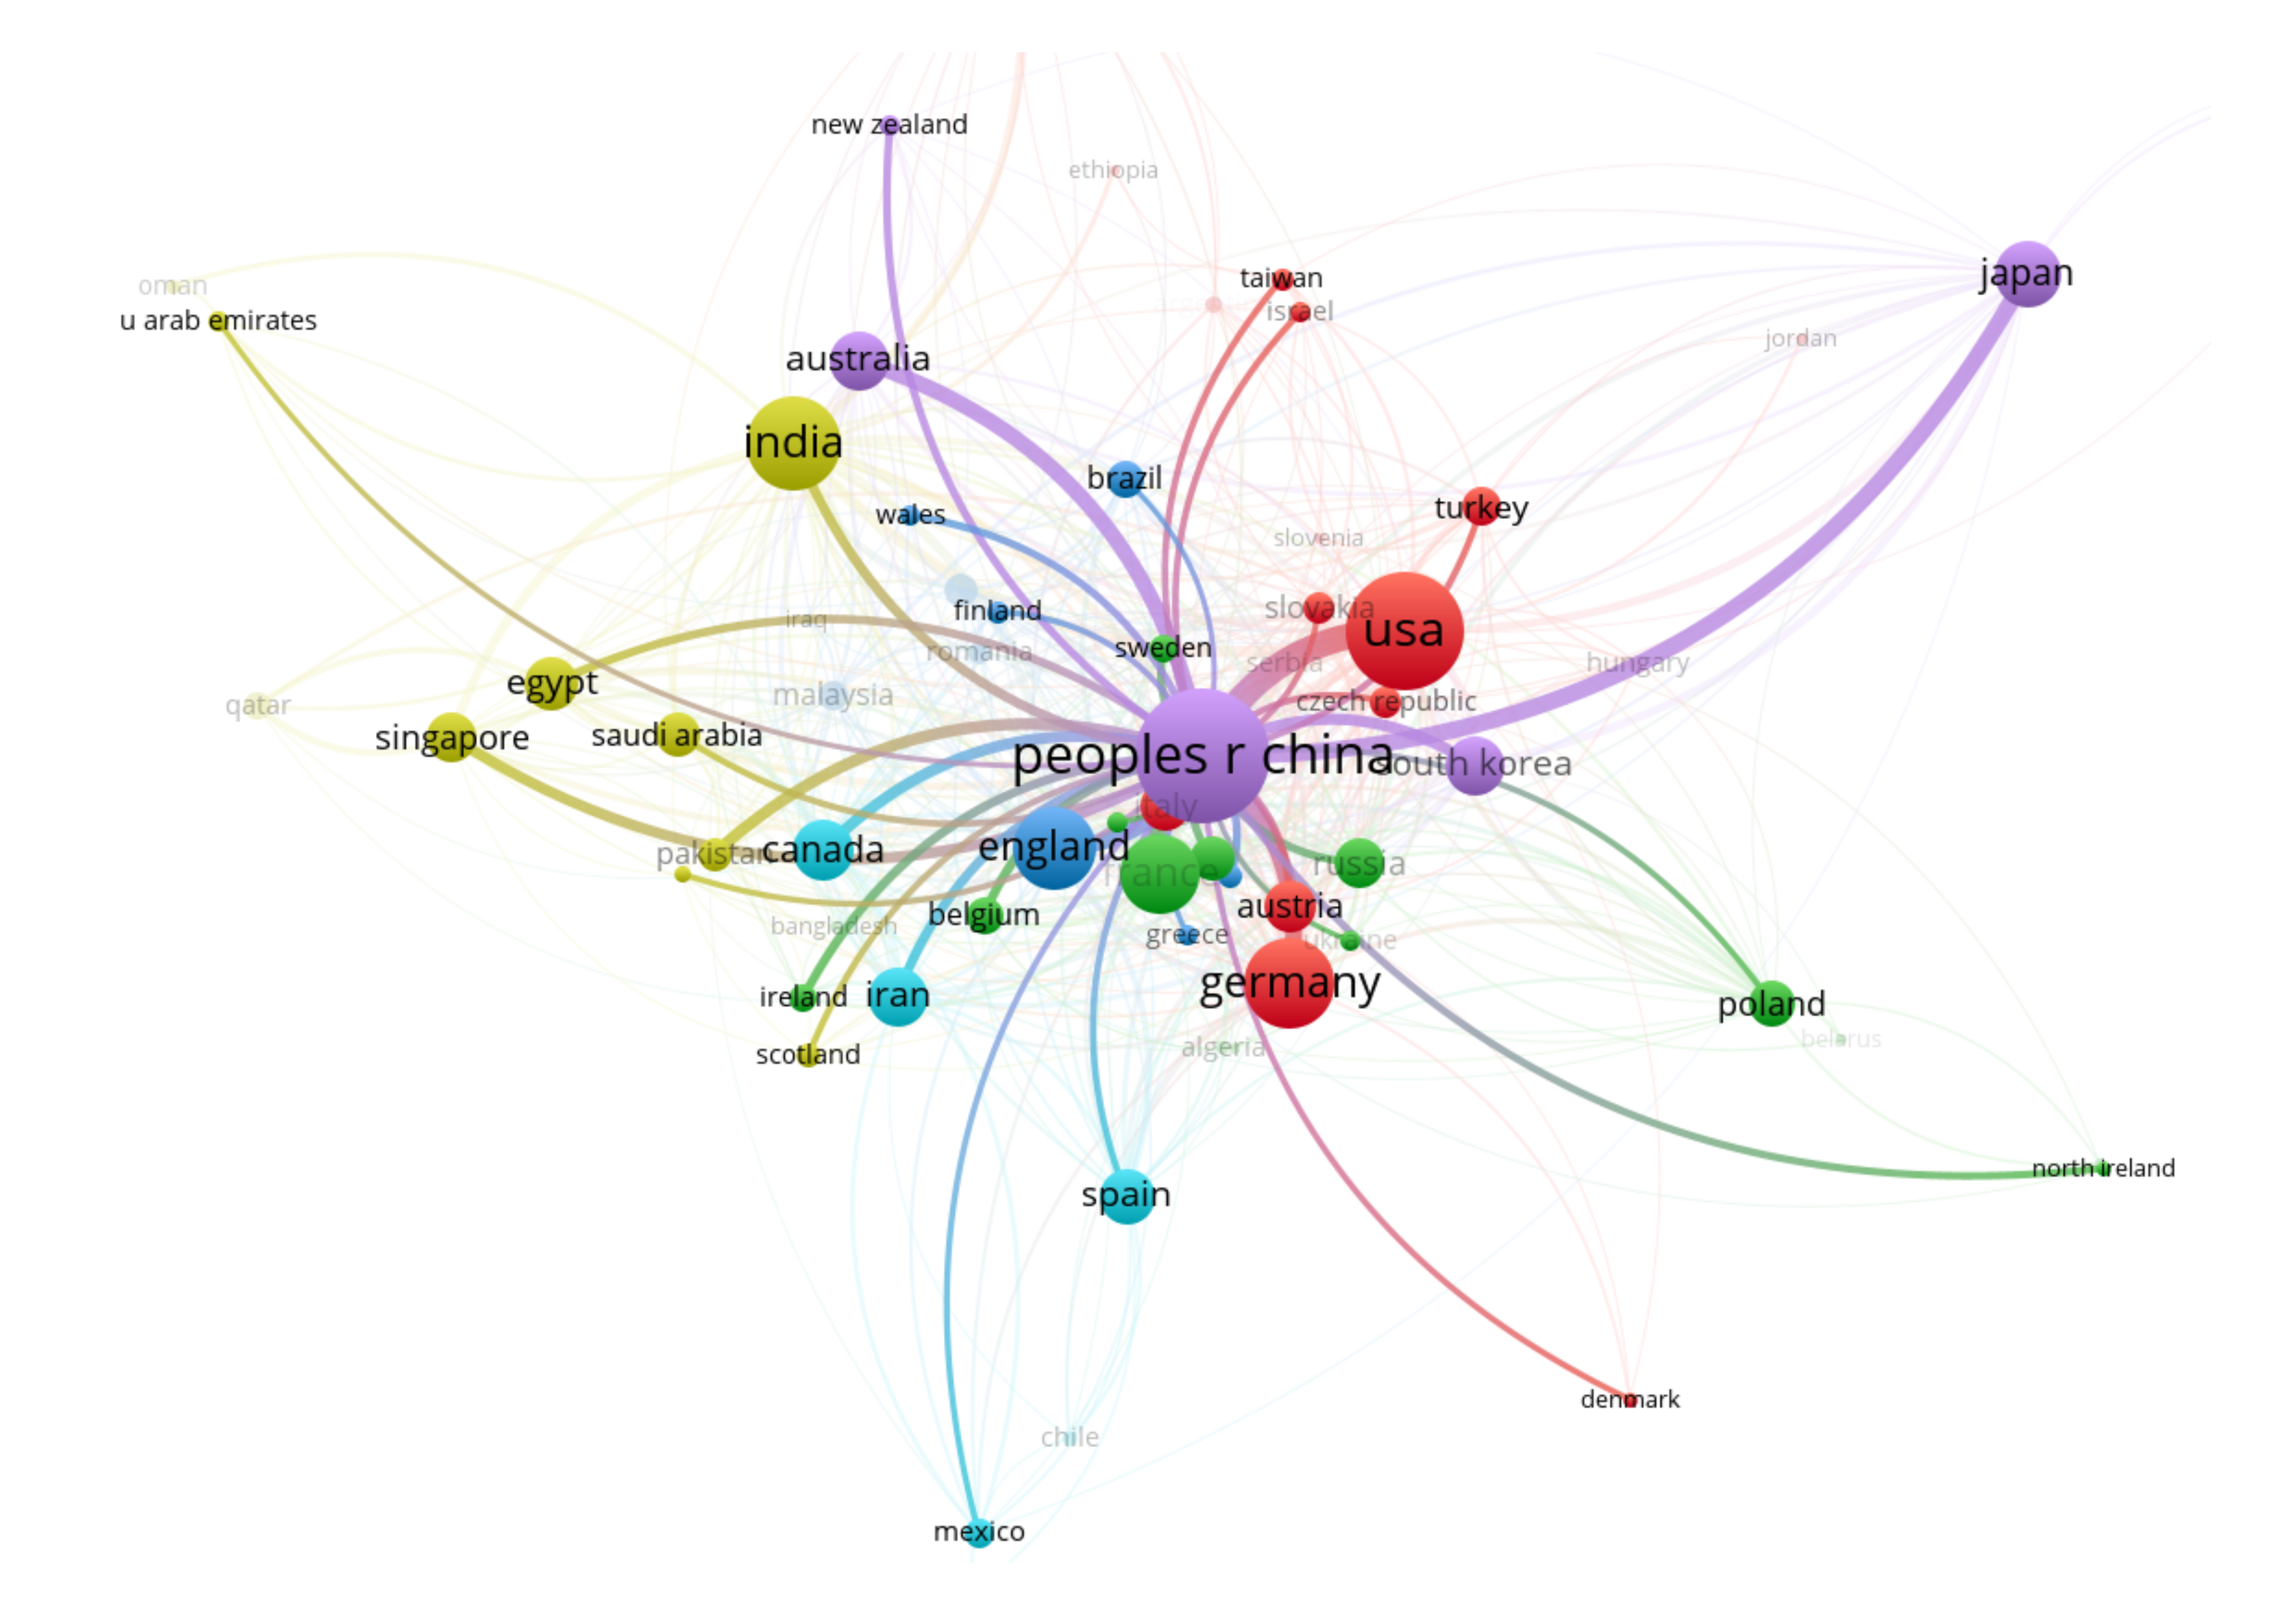
Figure 16.
The international collaboration network of India.
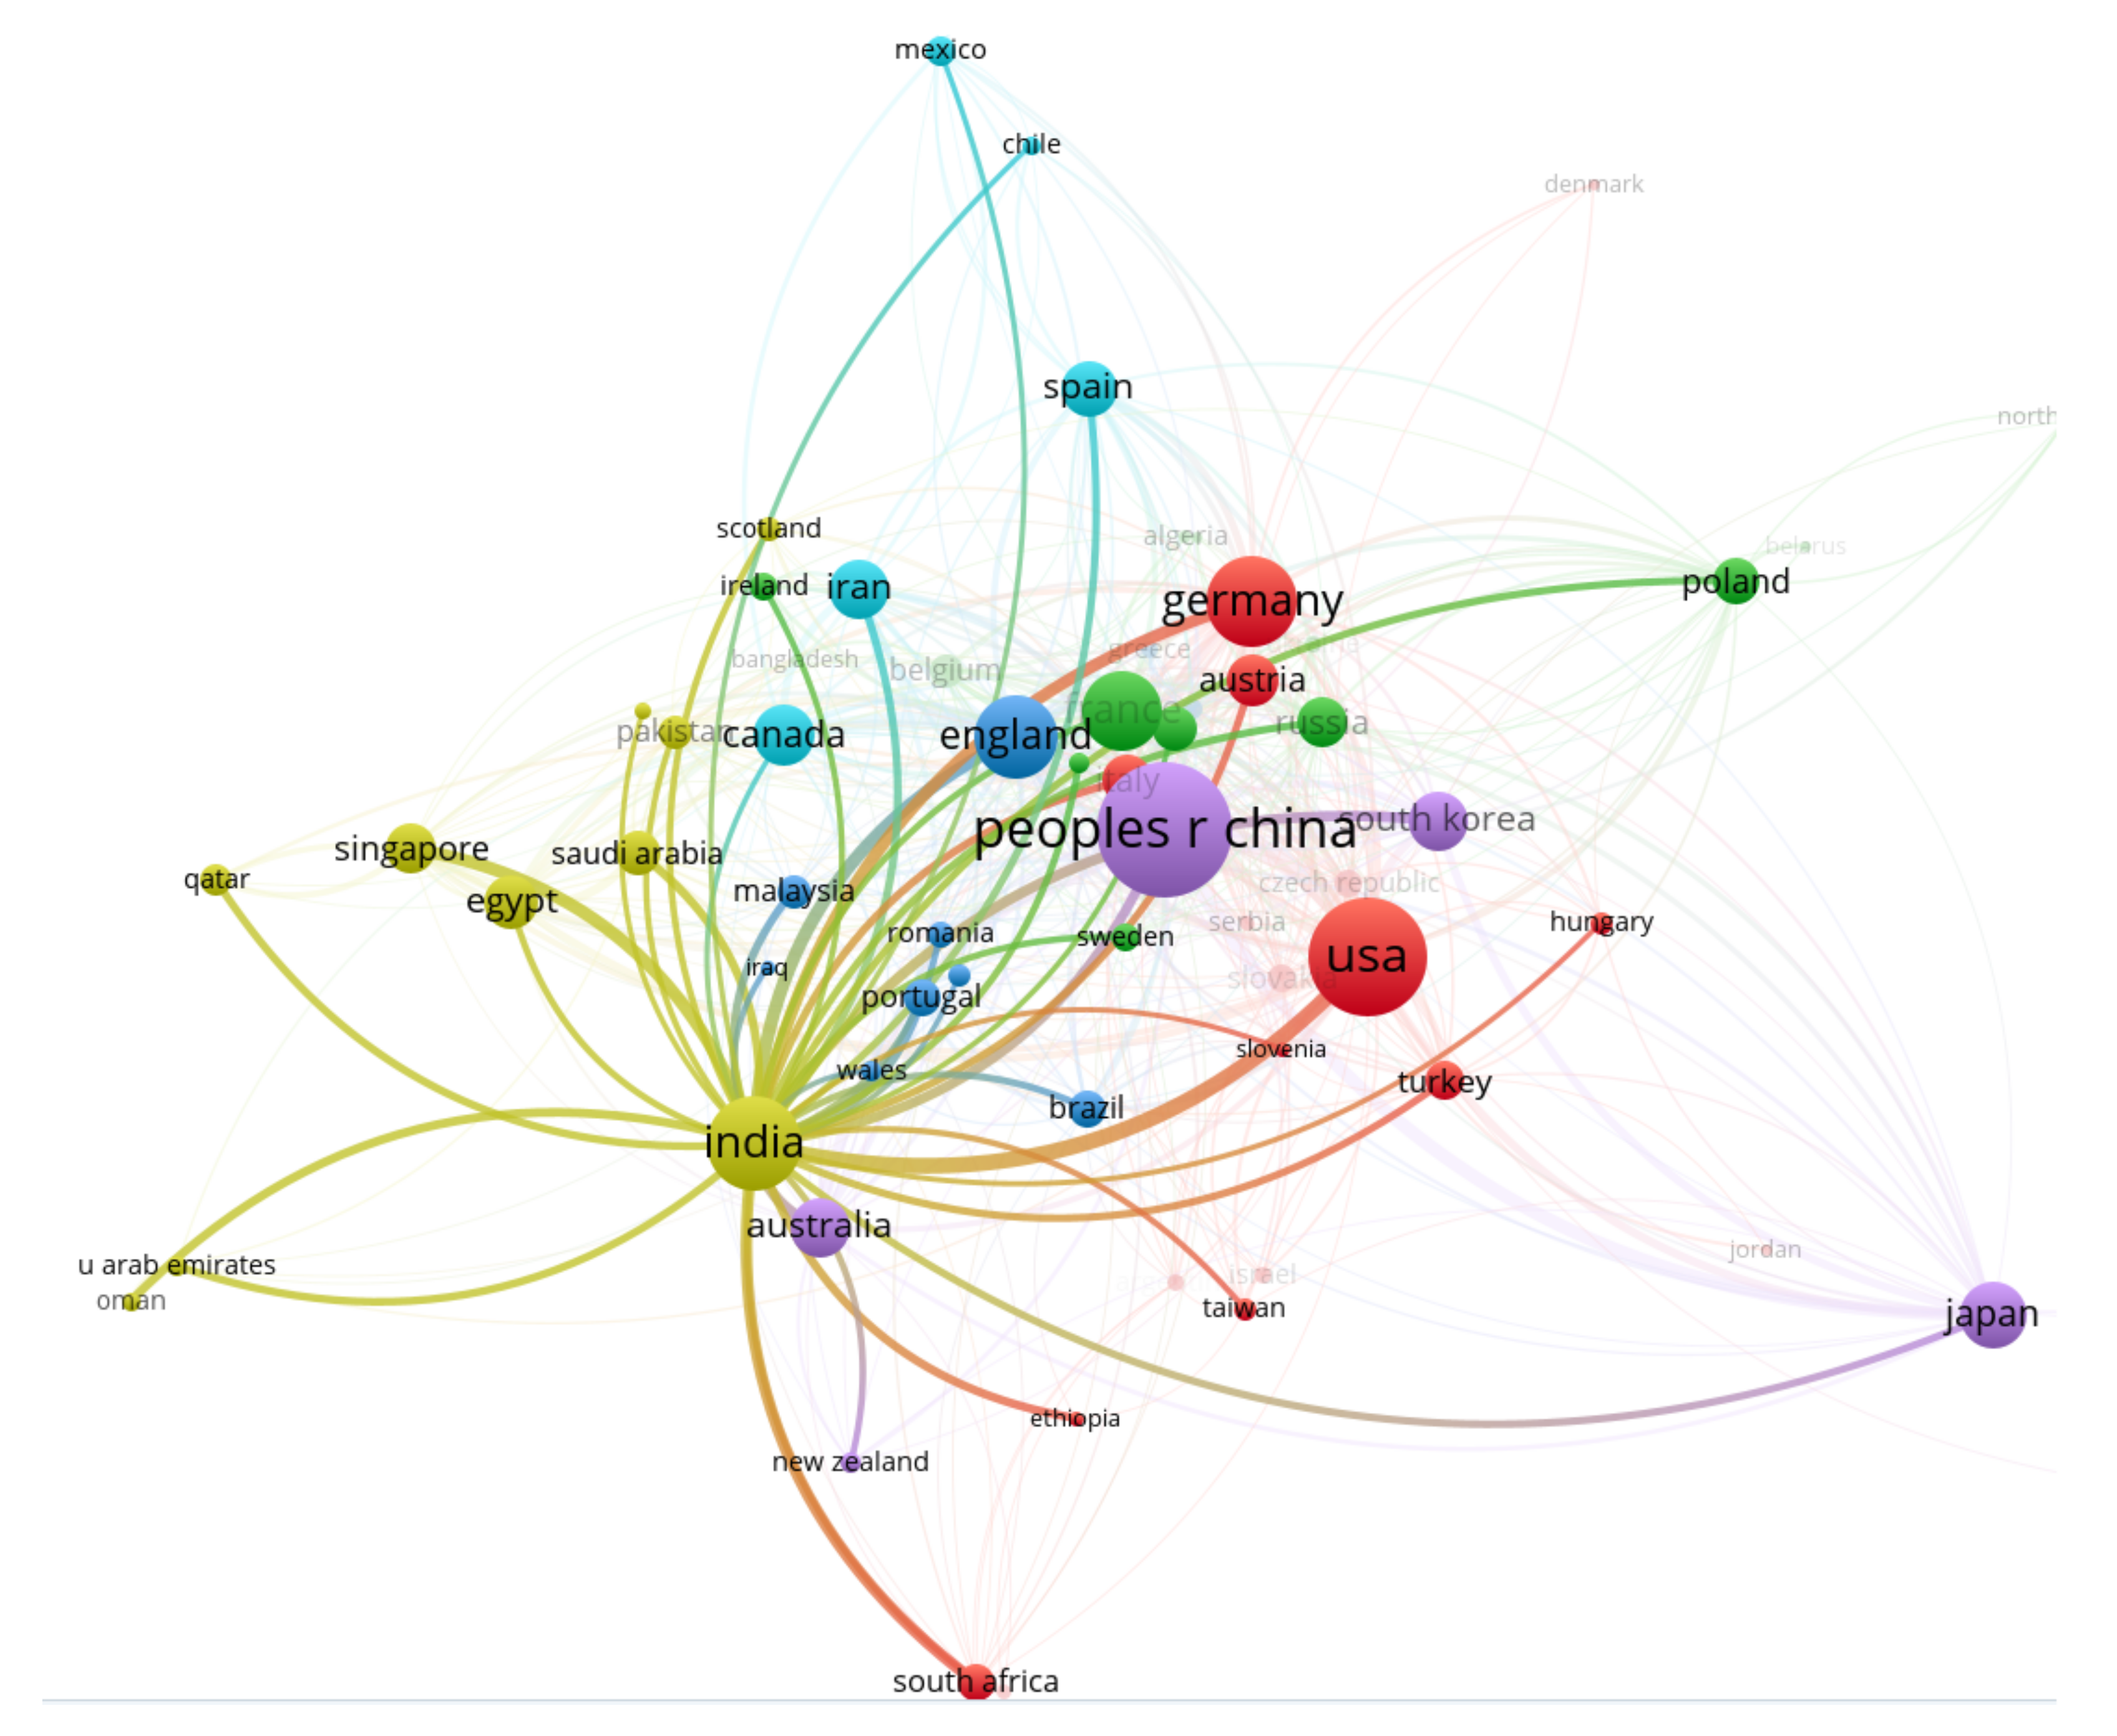
Figure 17.
The international collaboration network of the USA.

Figure 18.
The citation network graph of MMC research articles.

Figure 19.
The citation network graph of MMC authors.
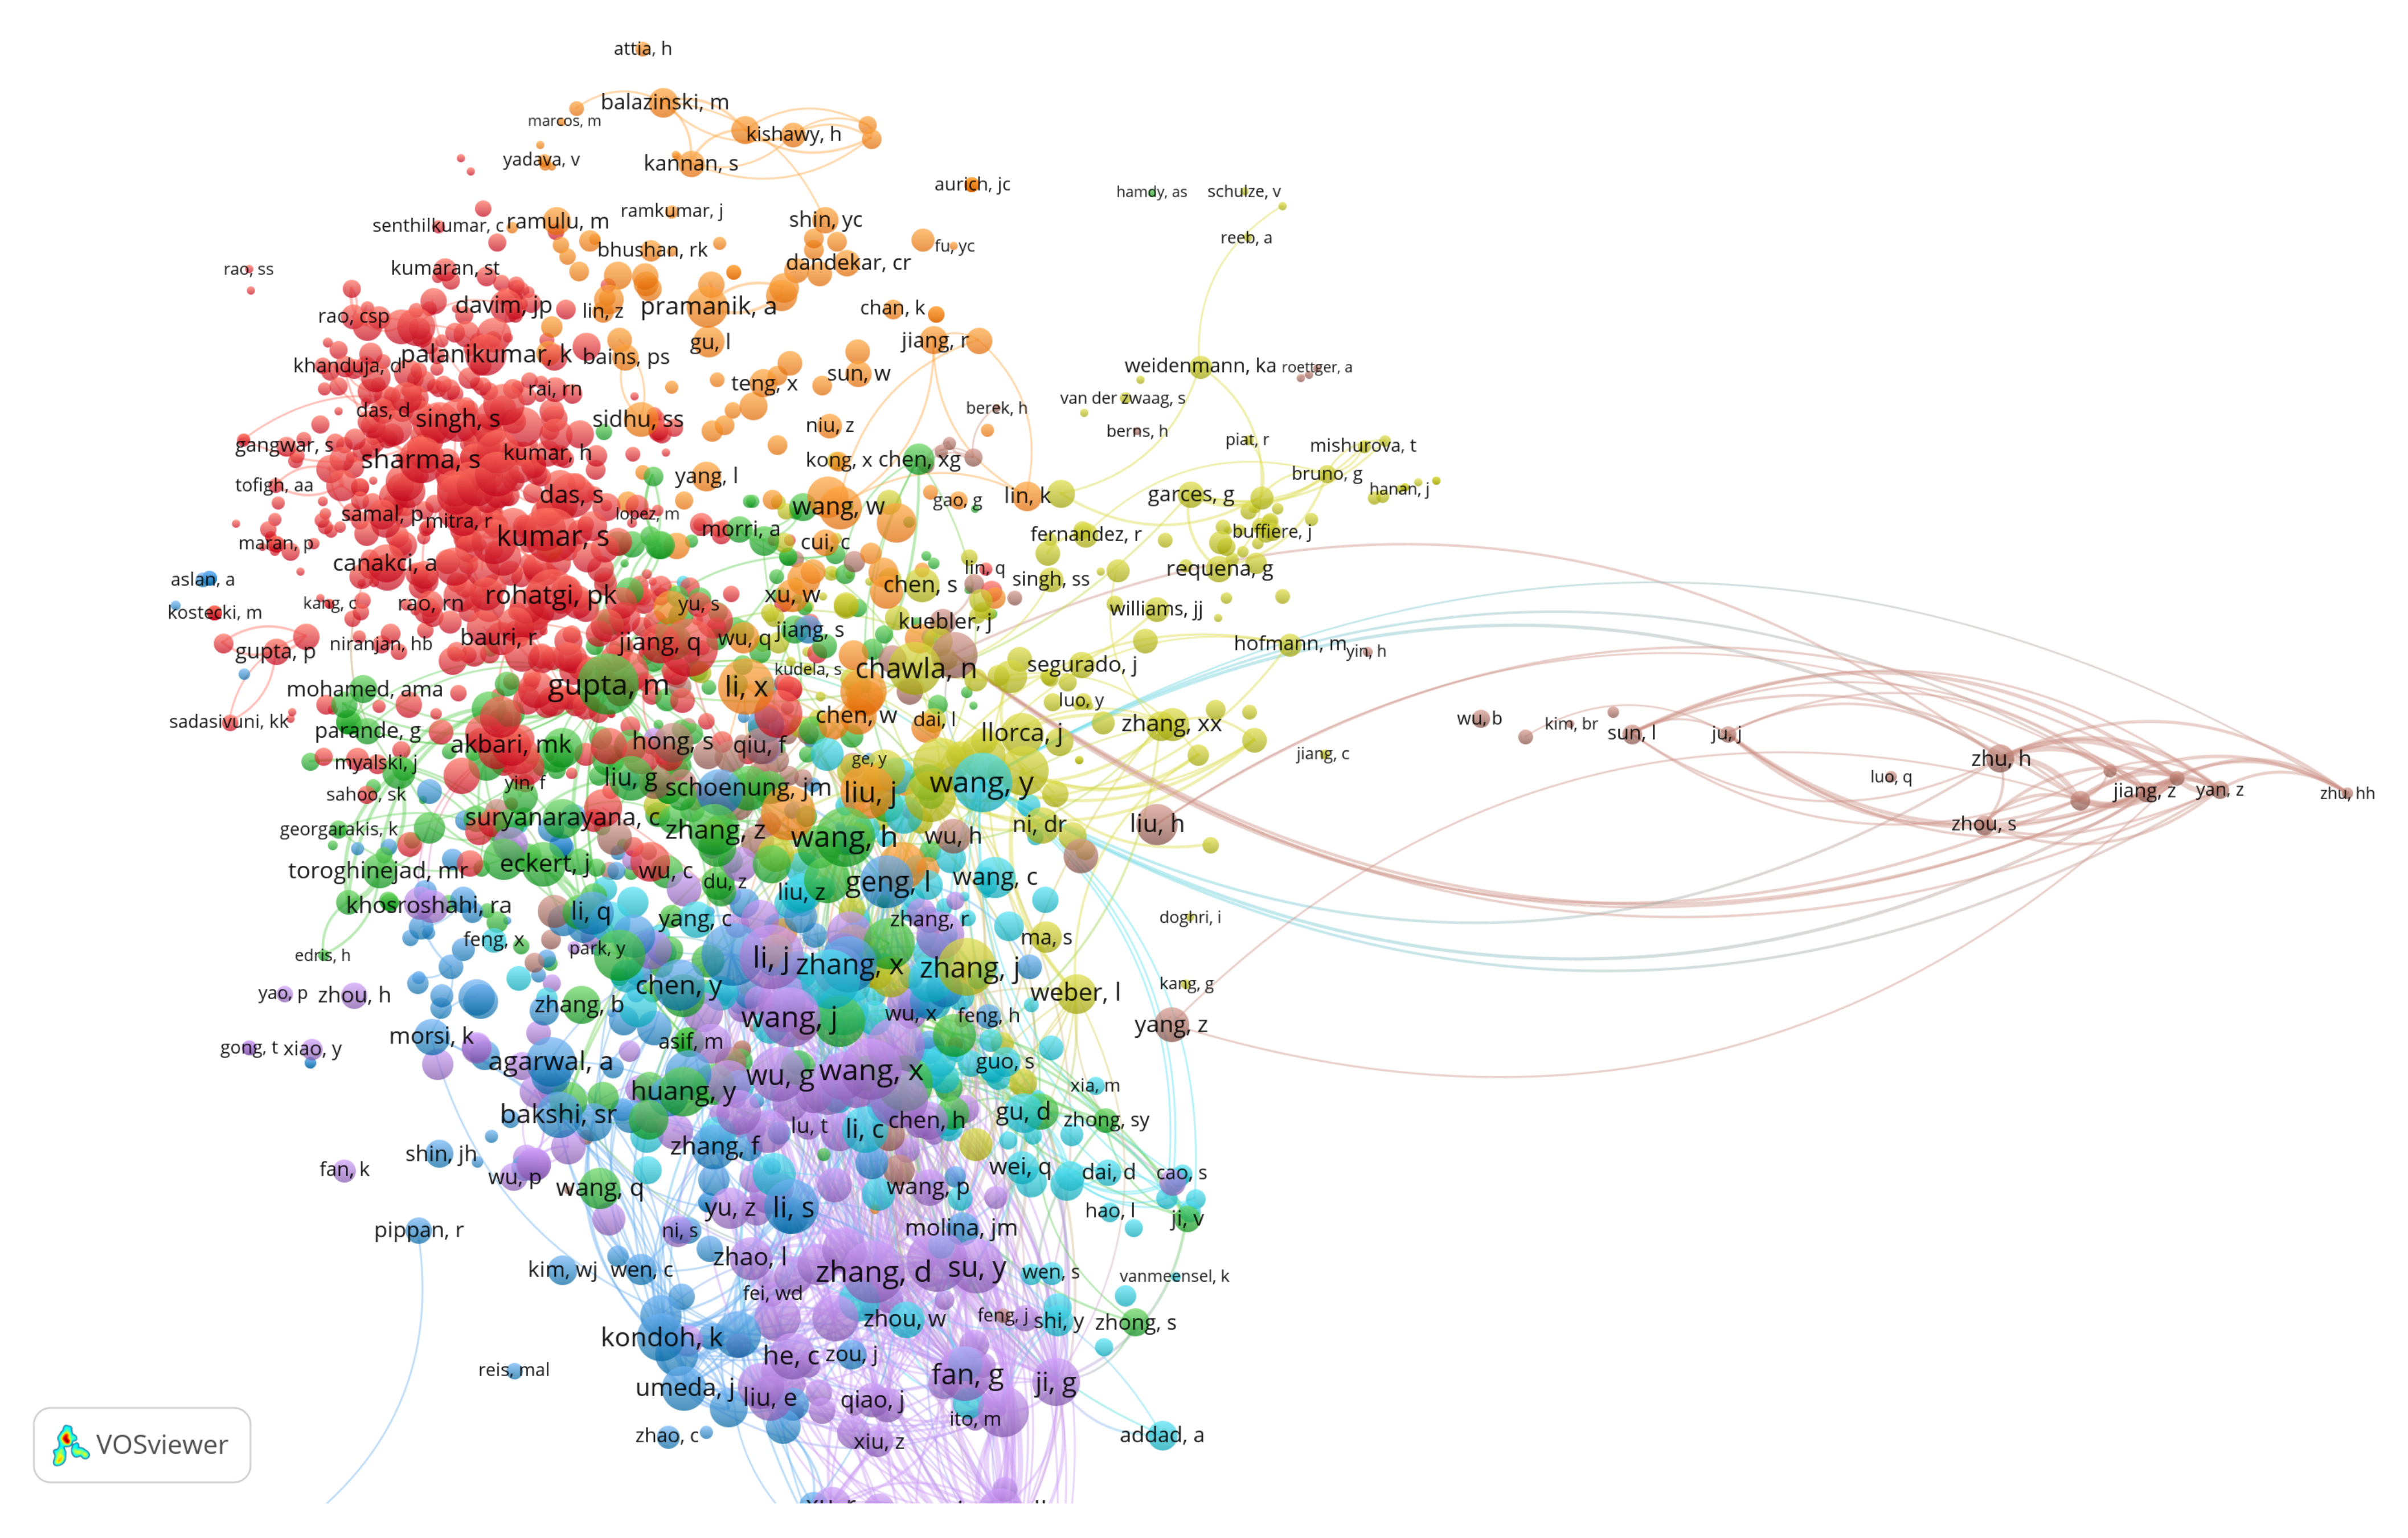
Figure 20.
The citation network graph of organizations.
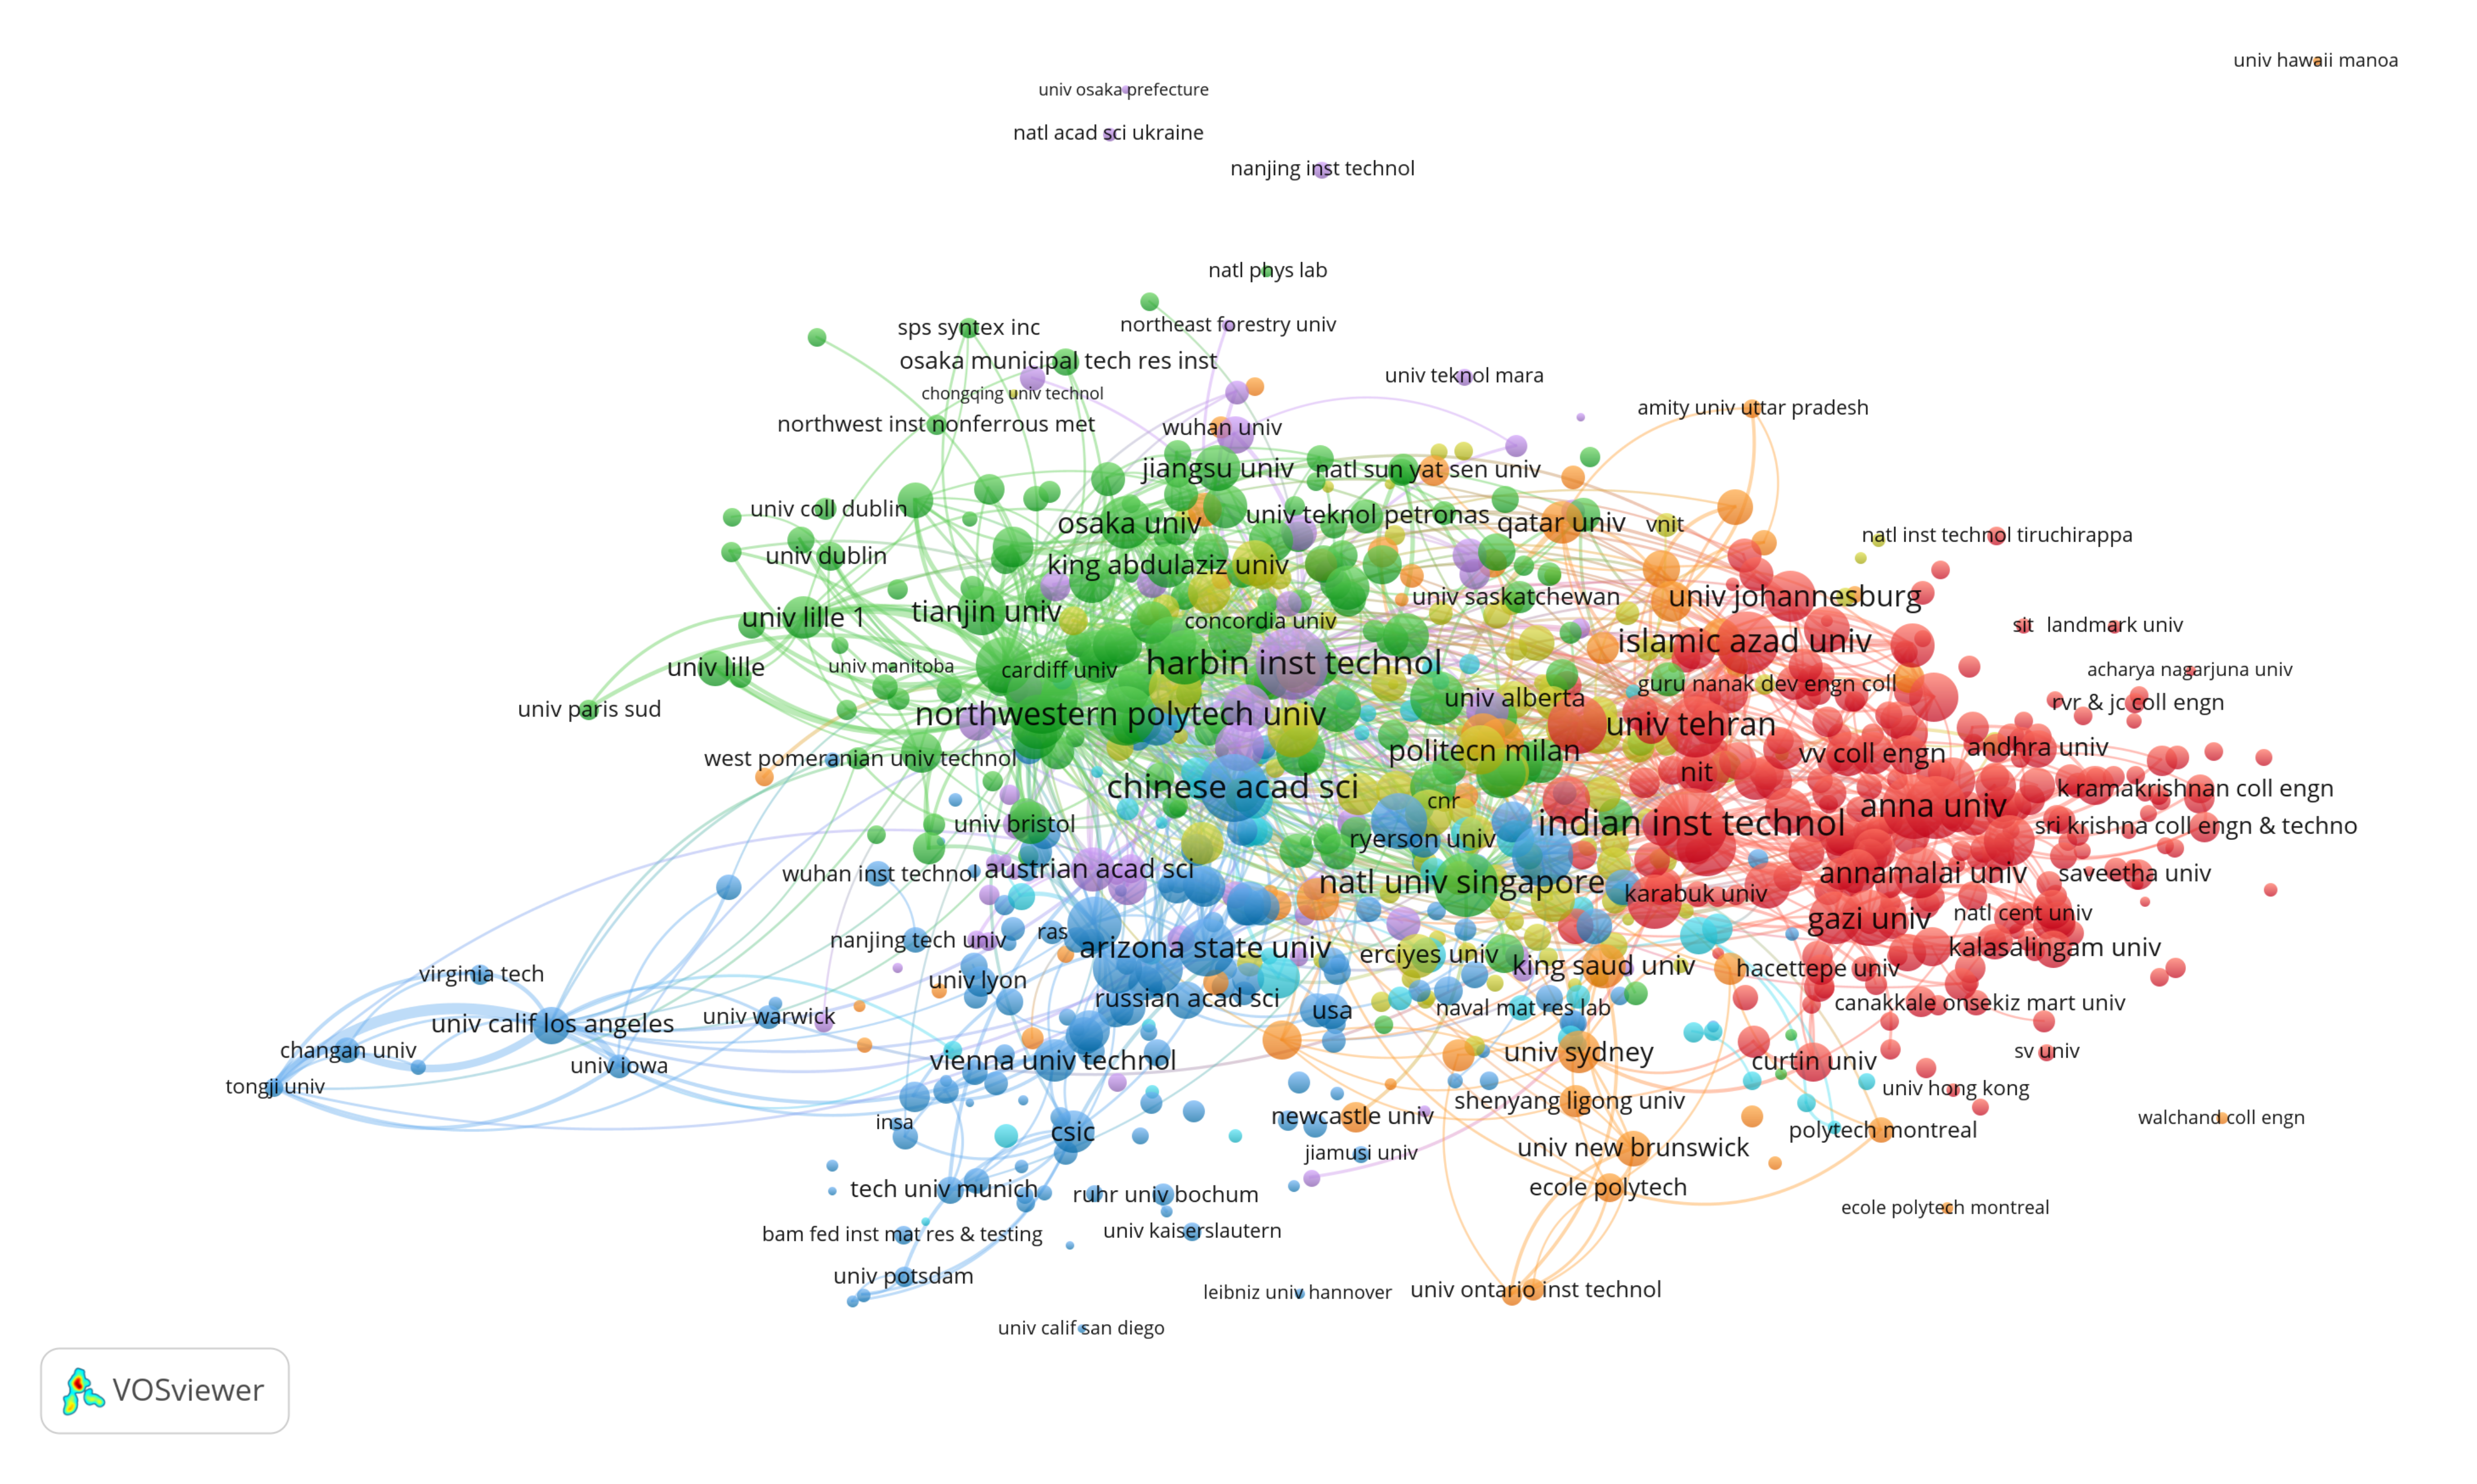
Figure 21.
The citation network graph of countries.
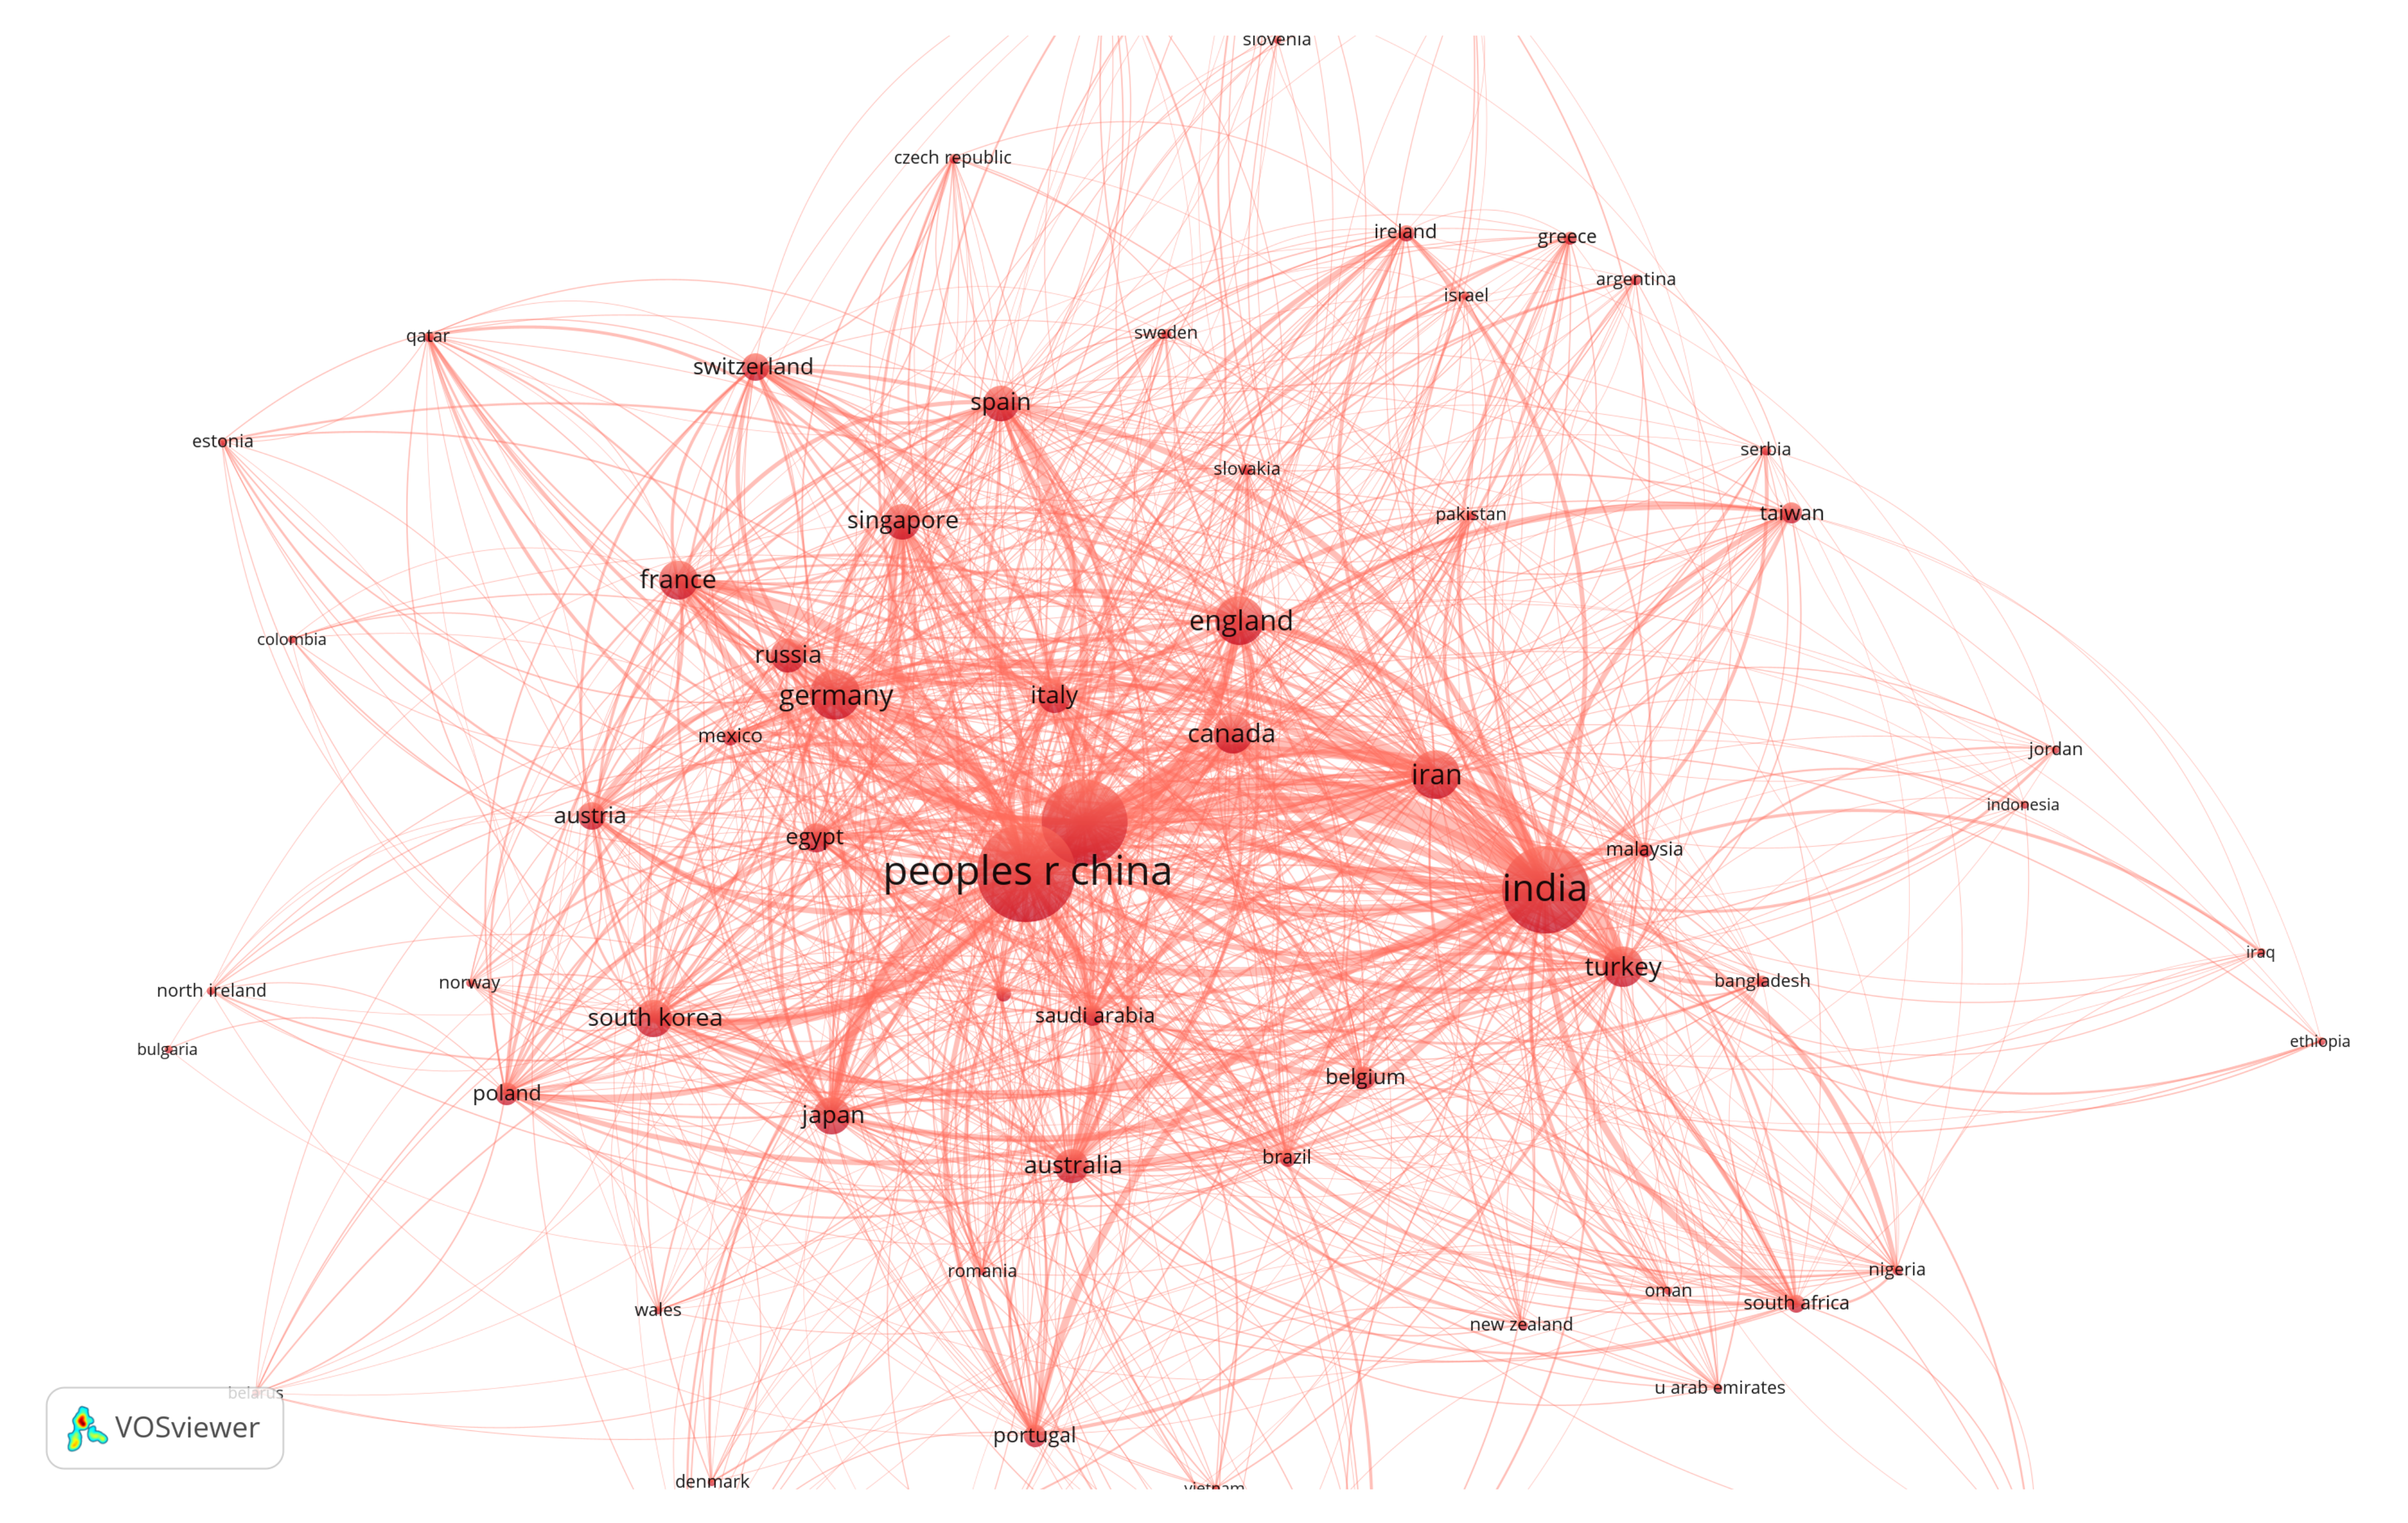
Figure 22.
The international citation network of Iran.

Figure 23.
The citation network graph of sources.
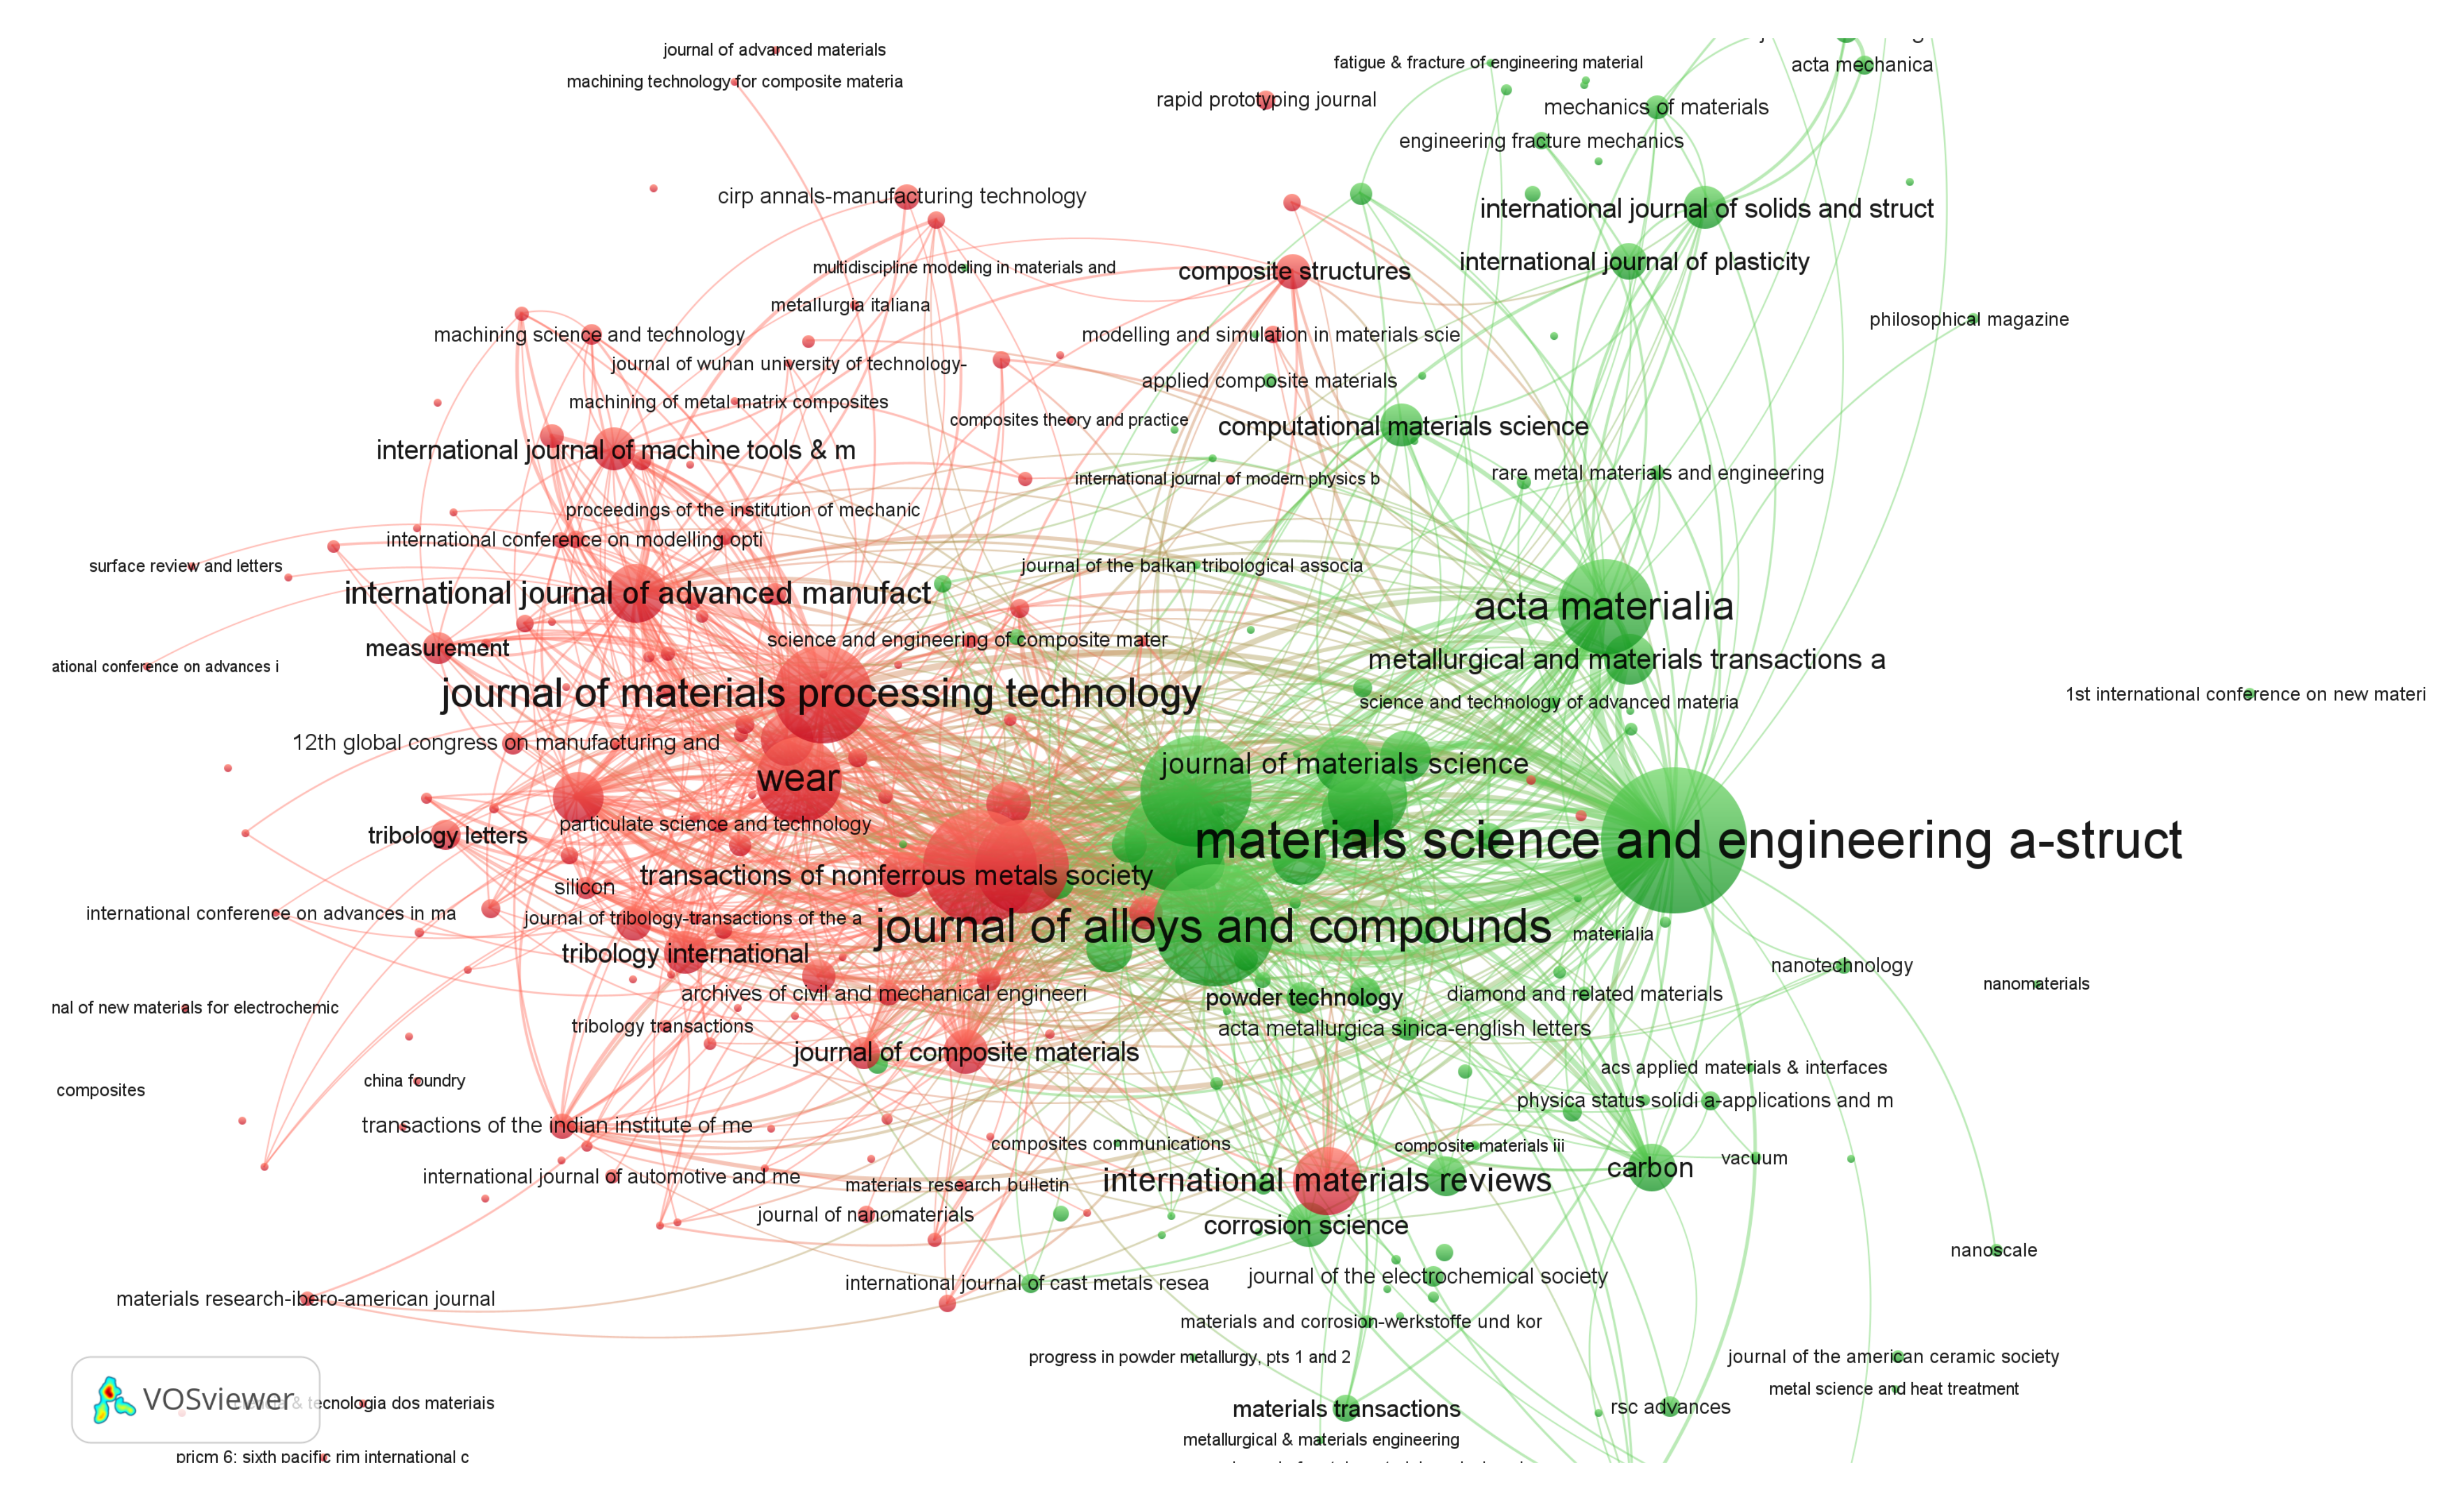
Figure 24.
The citation network graph of source: Materials Science and Engineering: A—Structural Materials: Properties, Microstructure and Processing.
Figure 24.
The citation network graph of source: Materials Science and Engineering: A—Structural Materials: Properties, Microstructure and Processing.
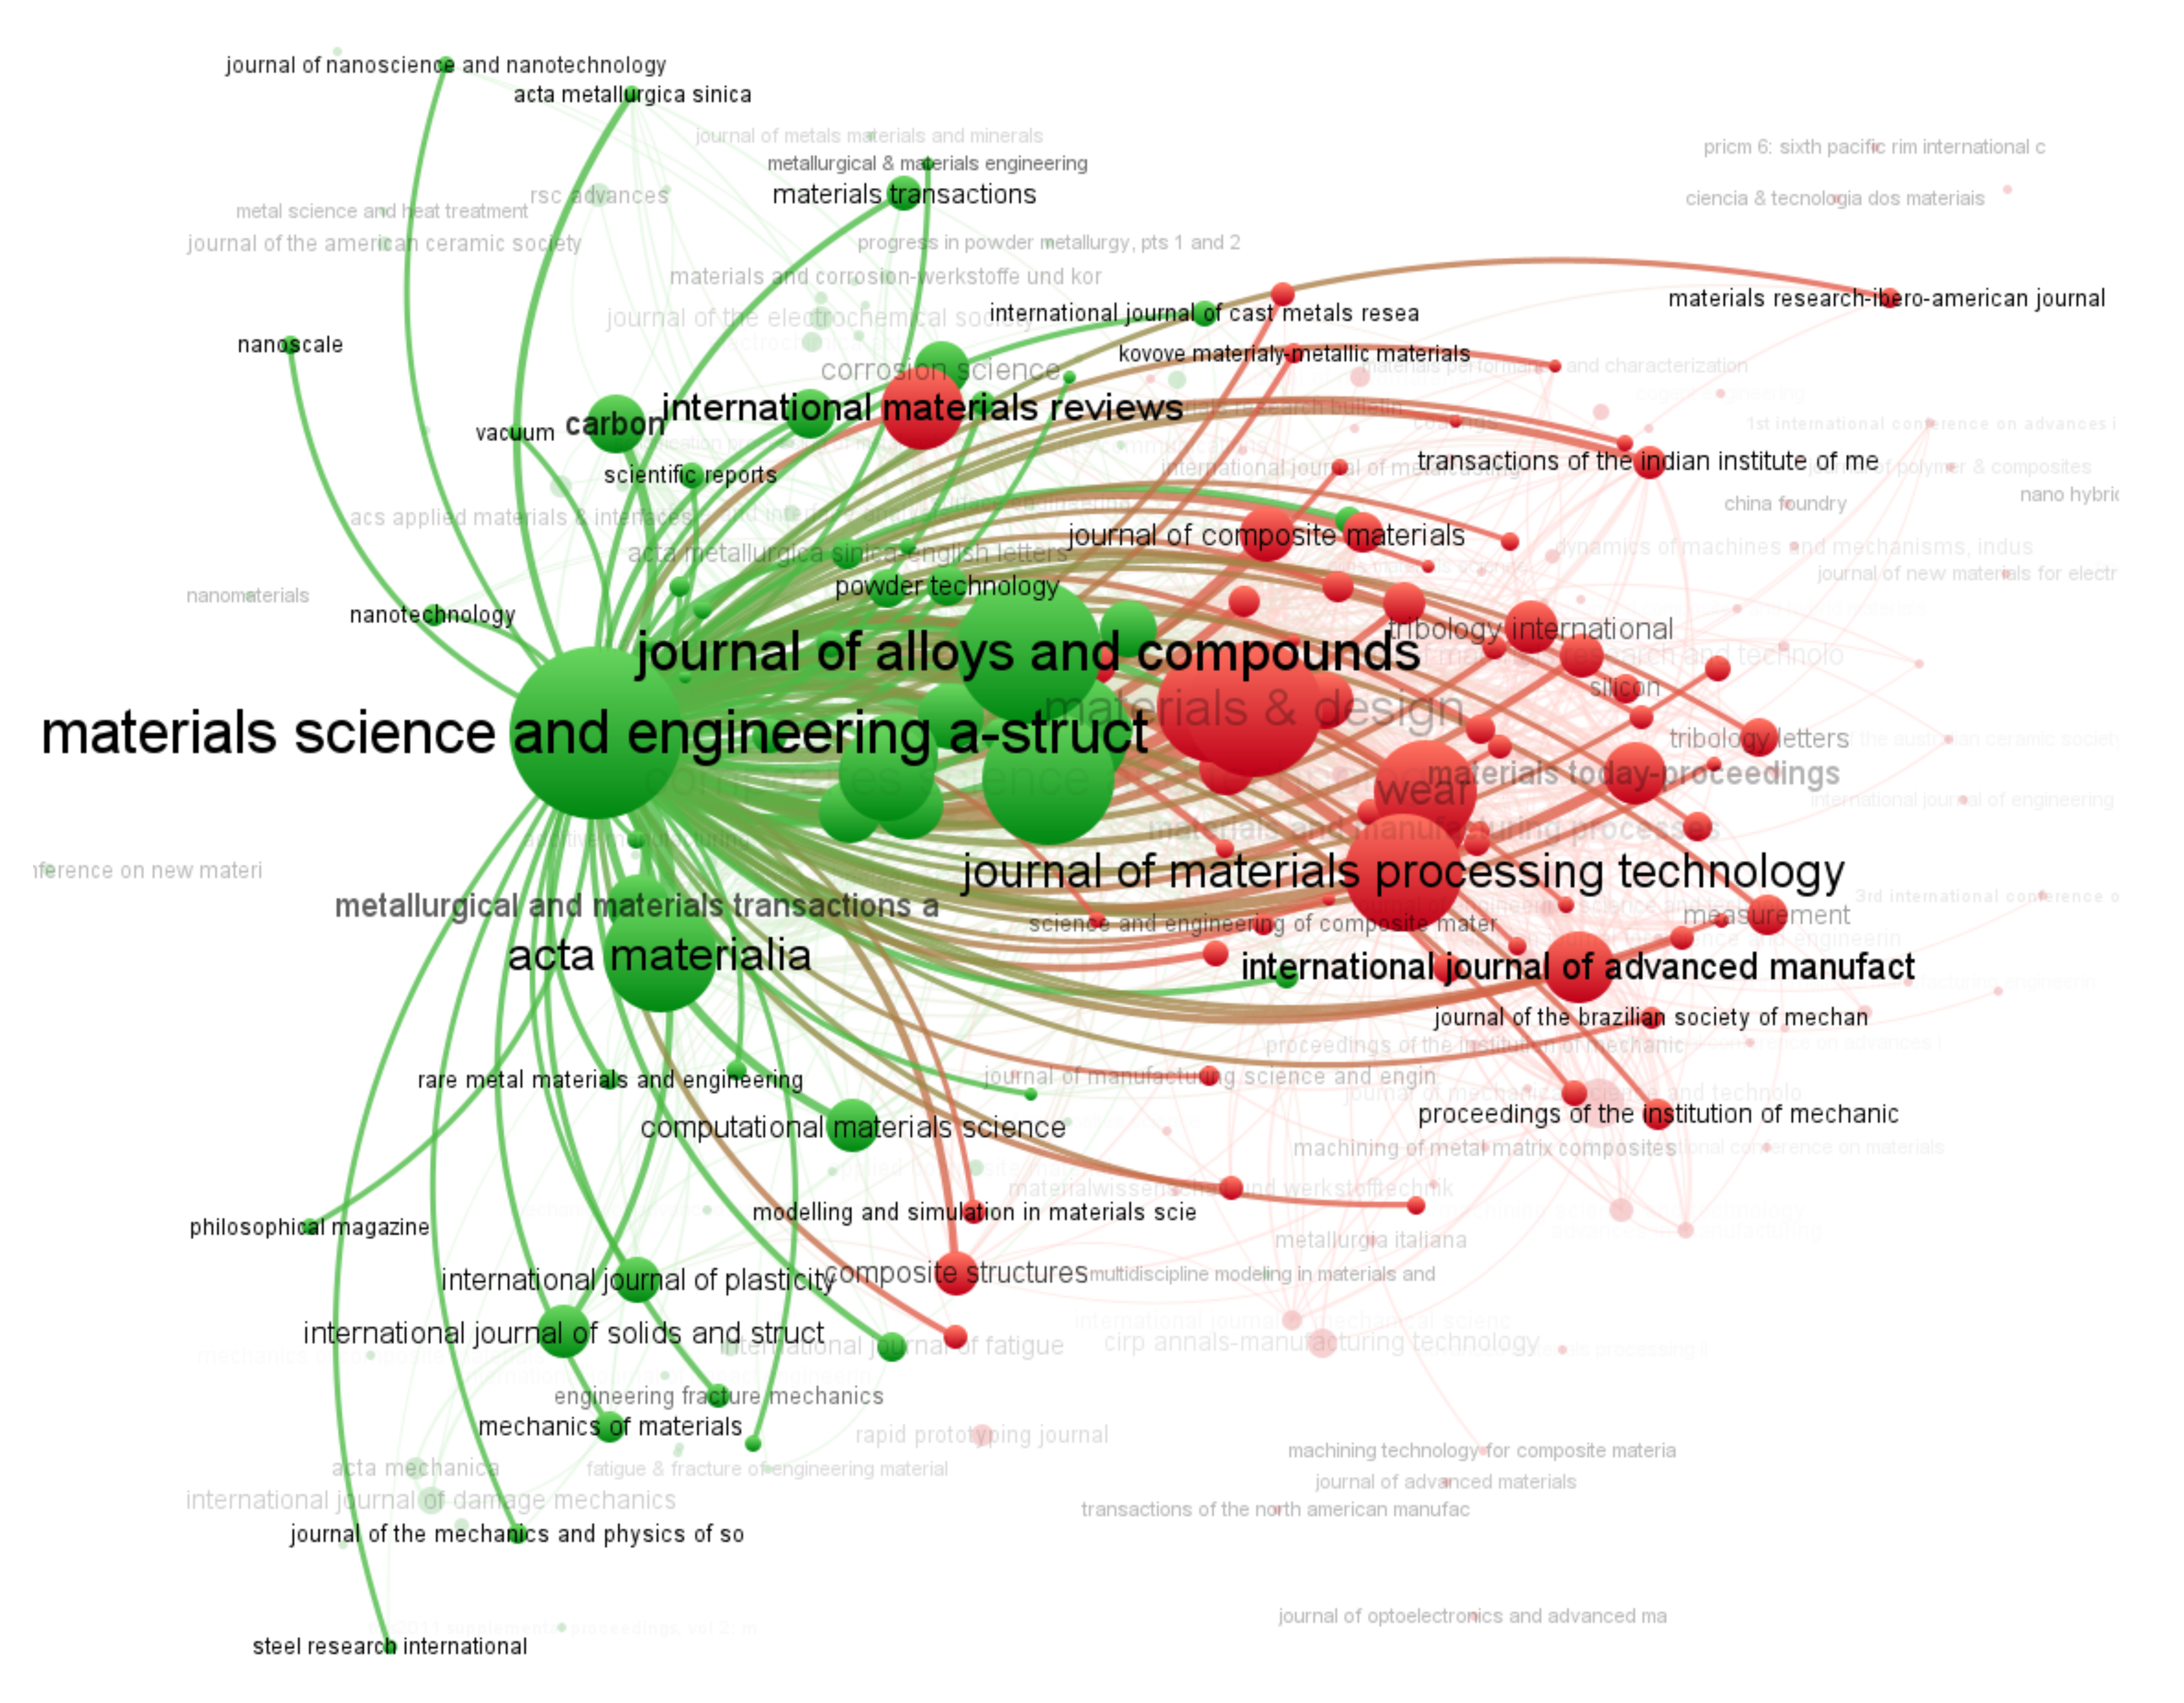
Figure 25.
The co-occurrence network graph of keywords.
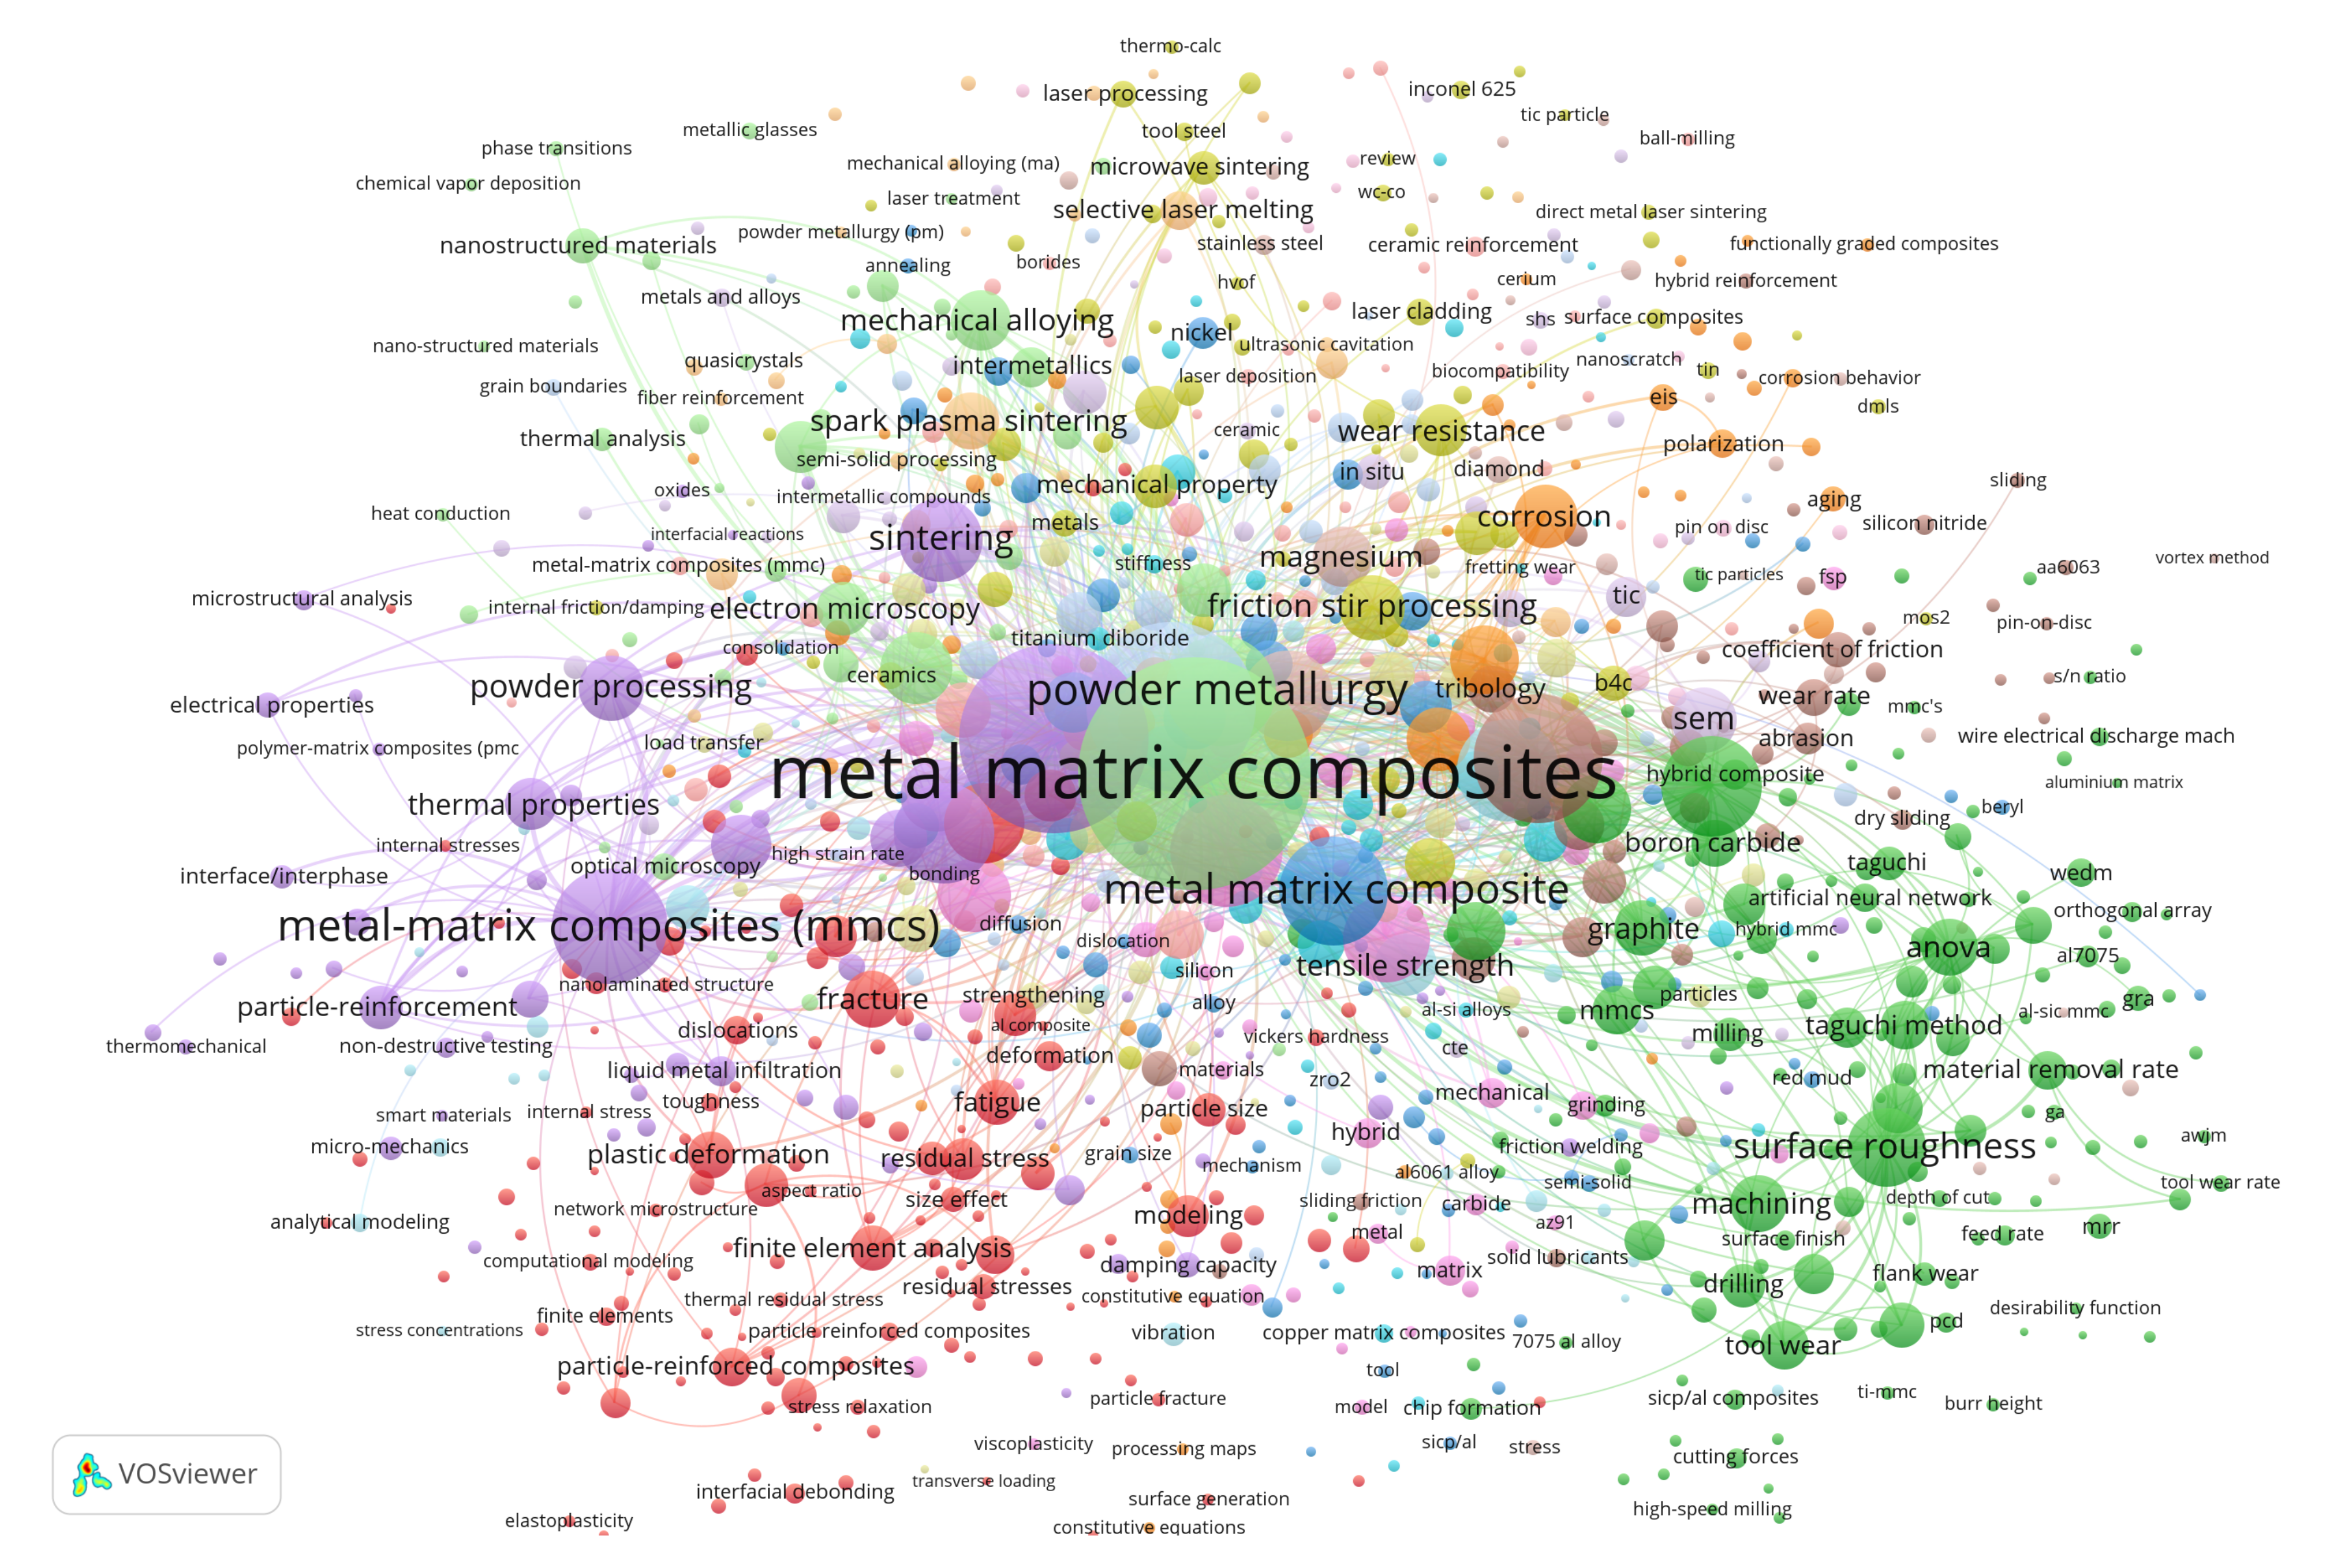
Figure 26.
The co-occurrence network graph of keyword: Metal Matrix Composites.
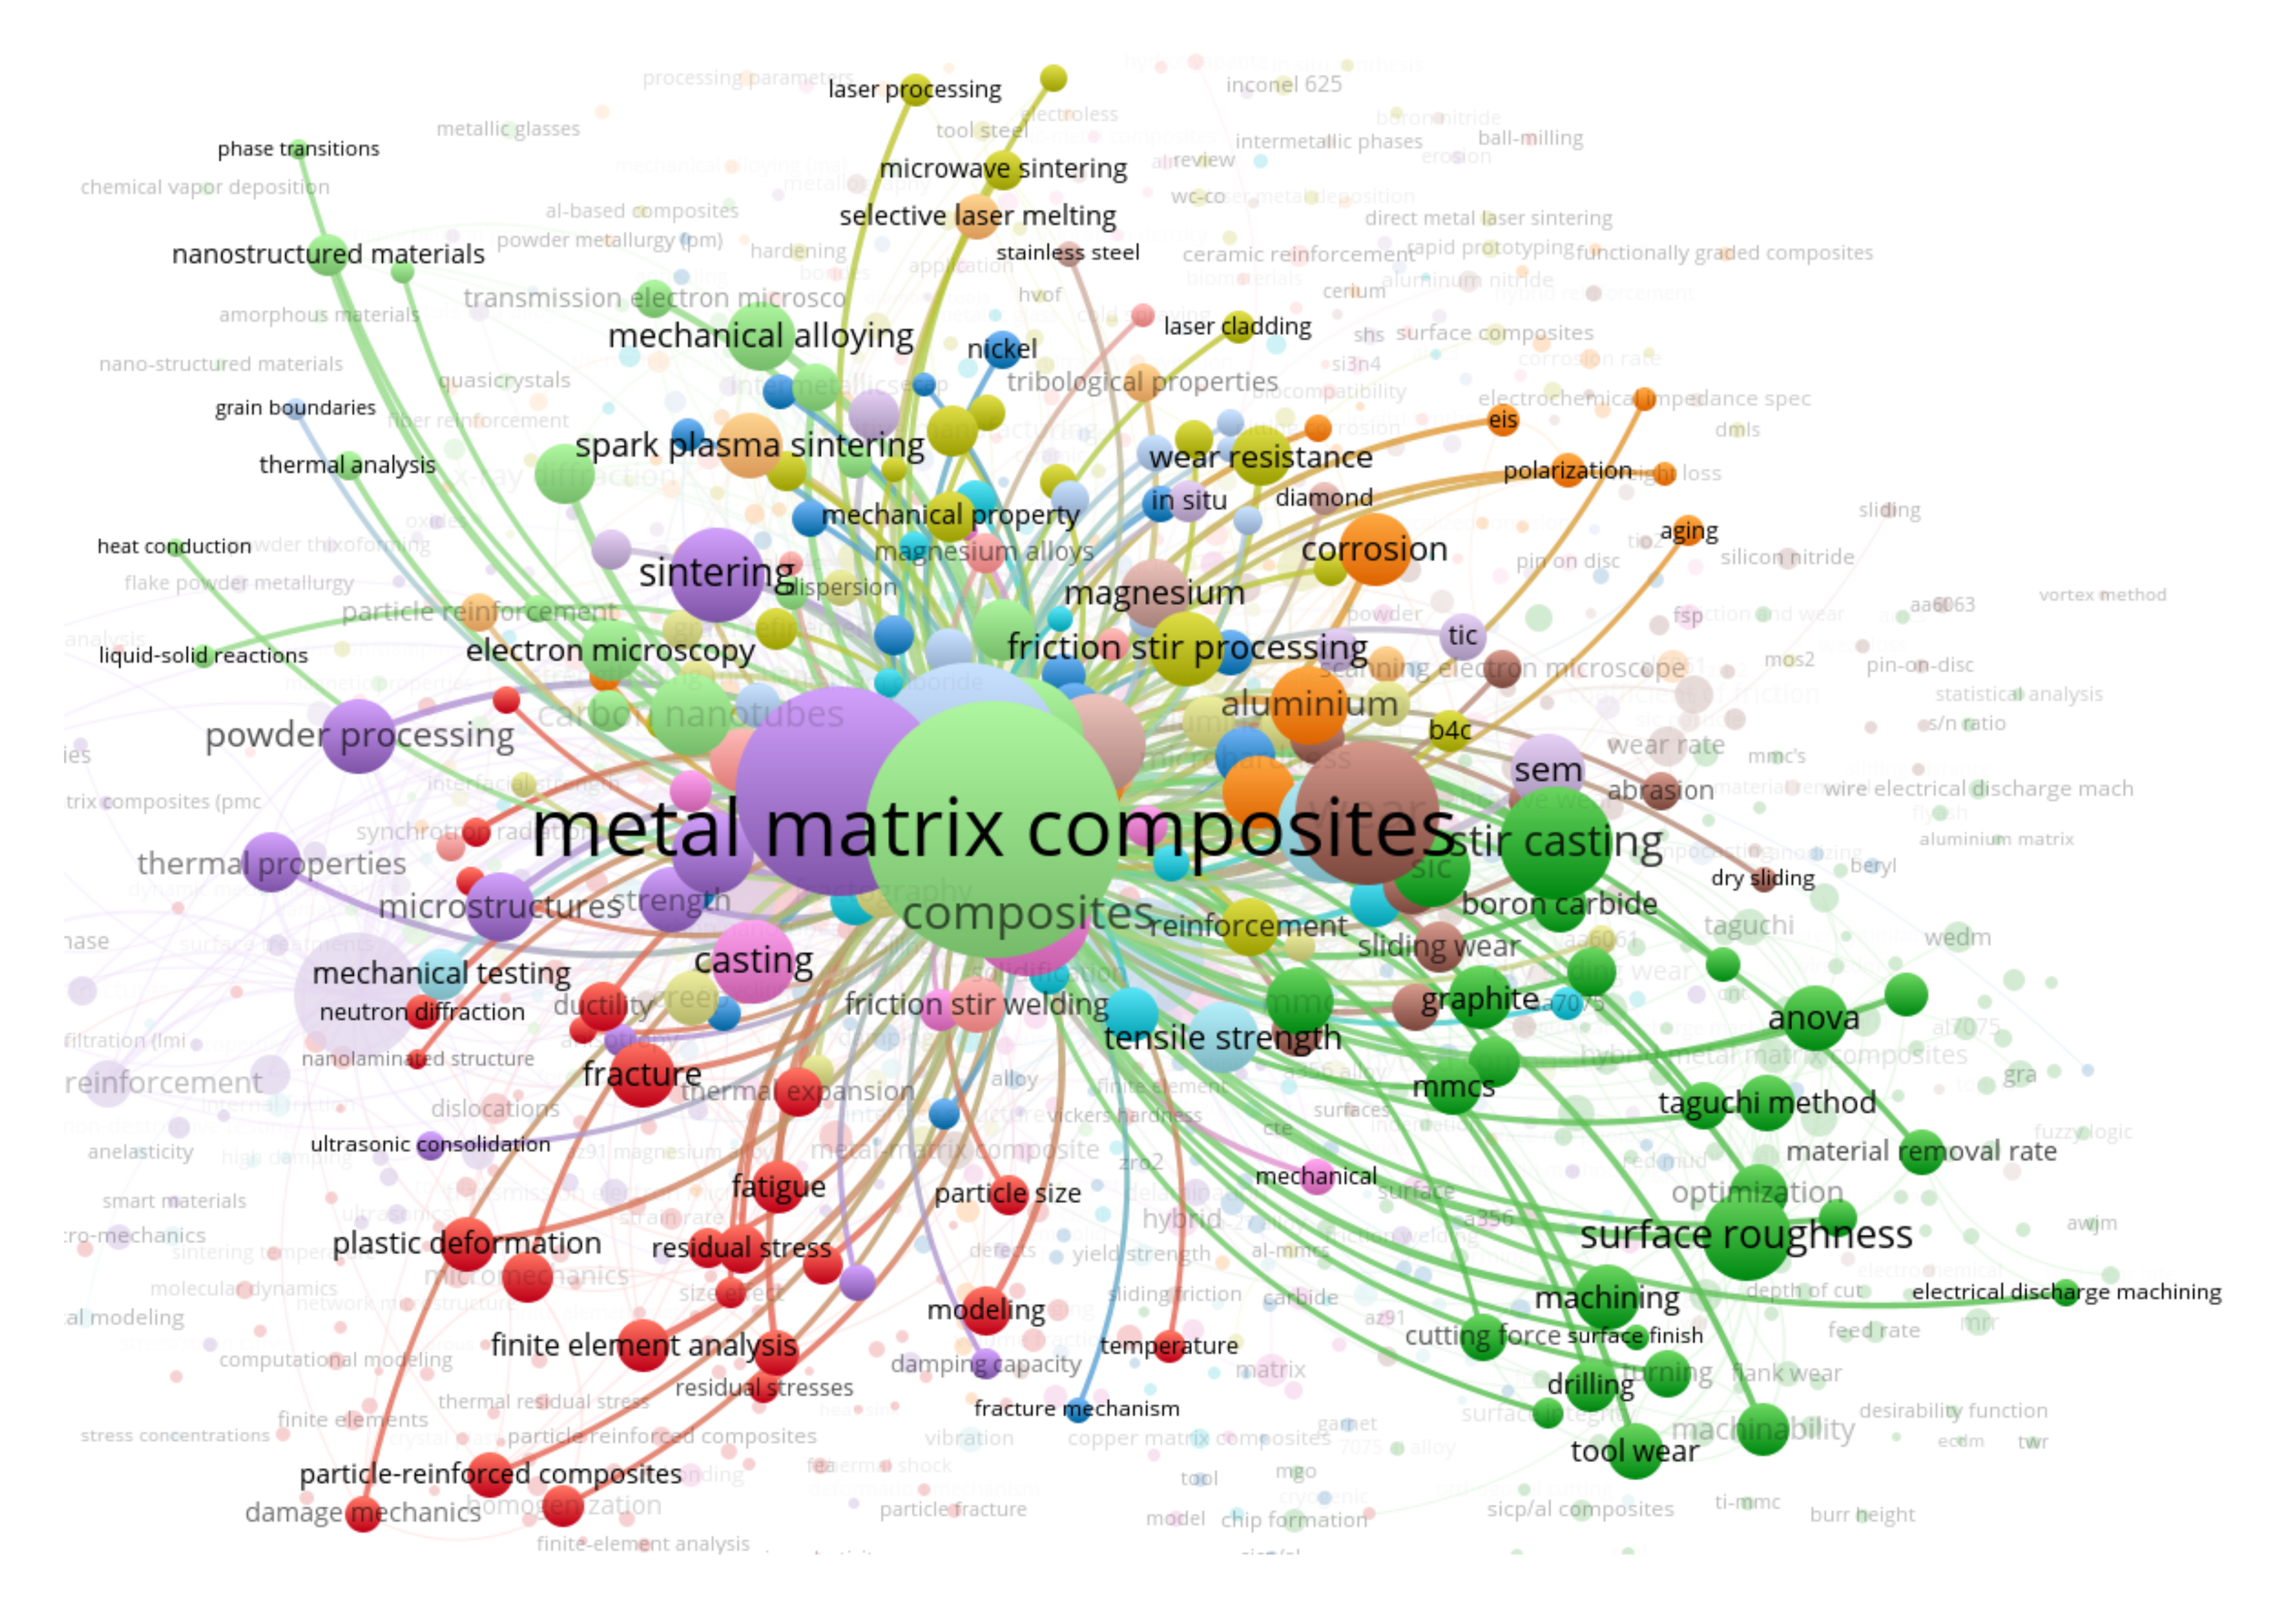
Figure 27.
The co-occurrence network graph of keyword: Mechanical Properties.
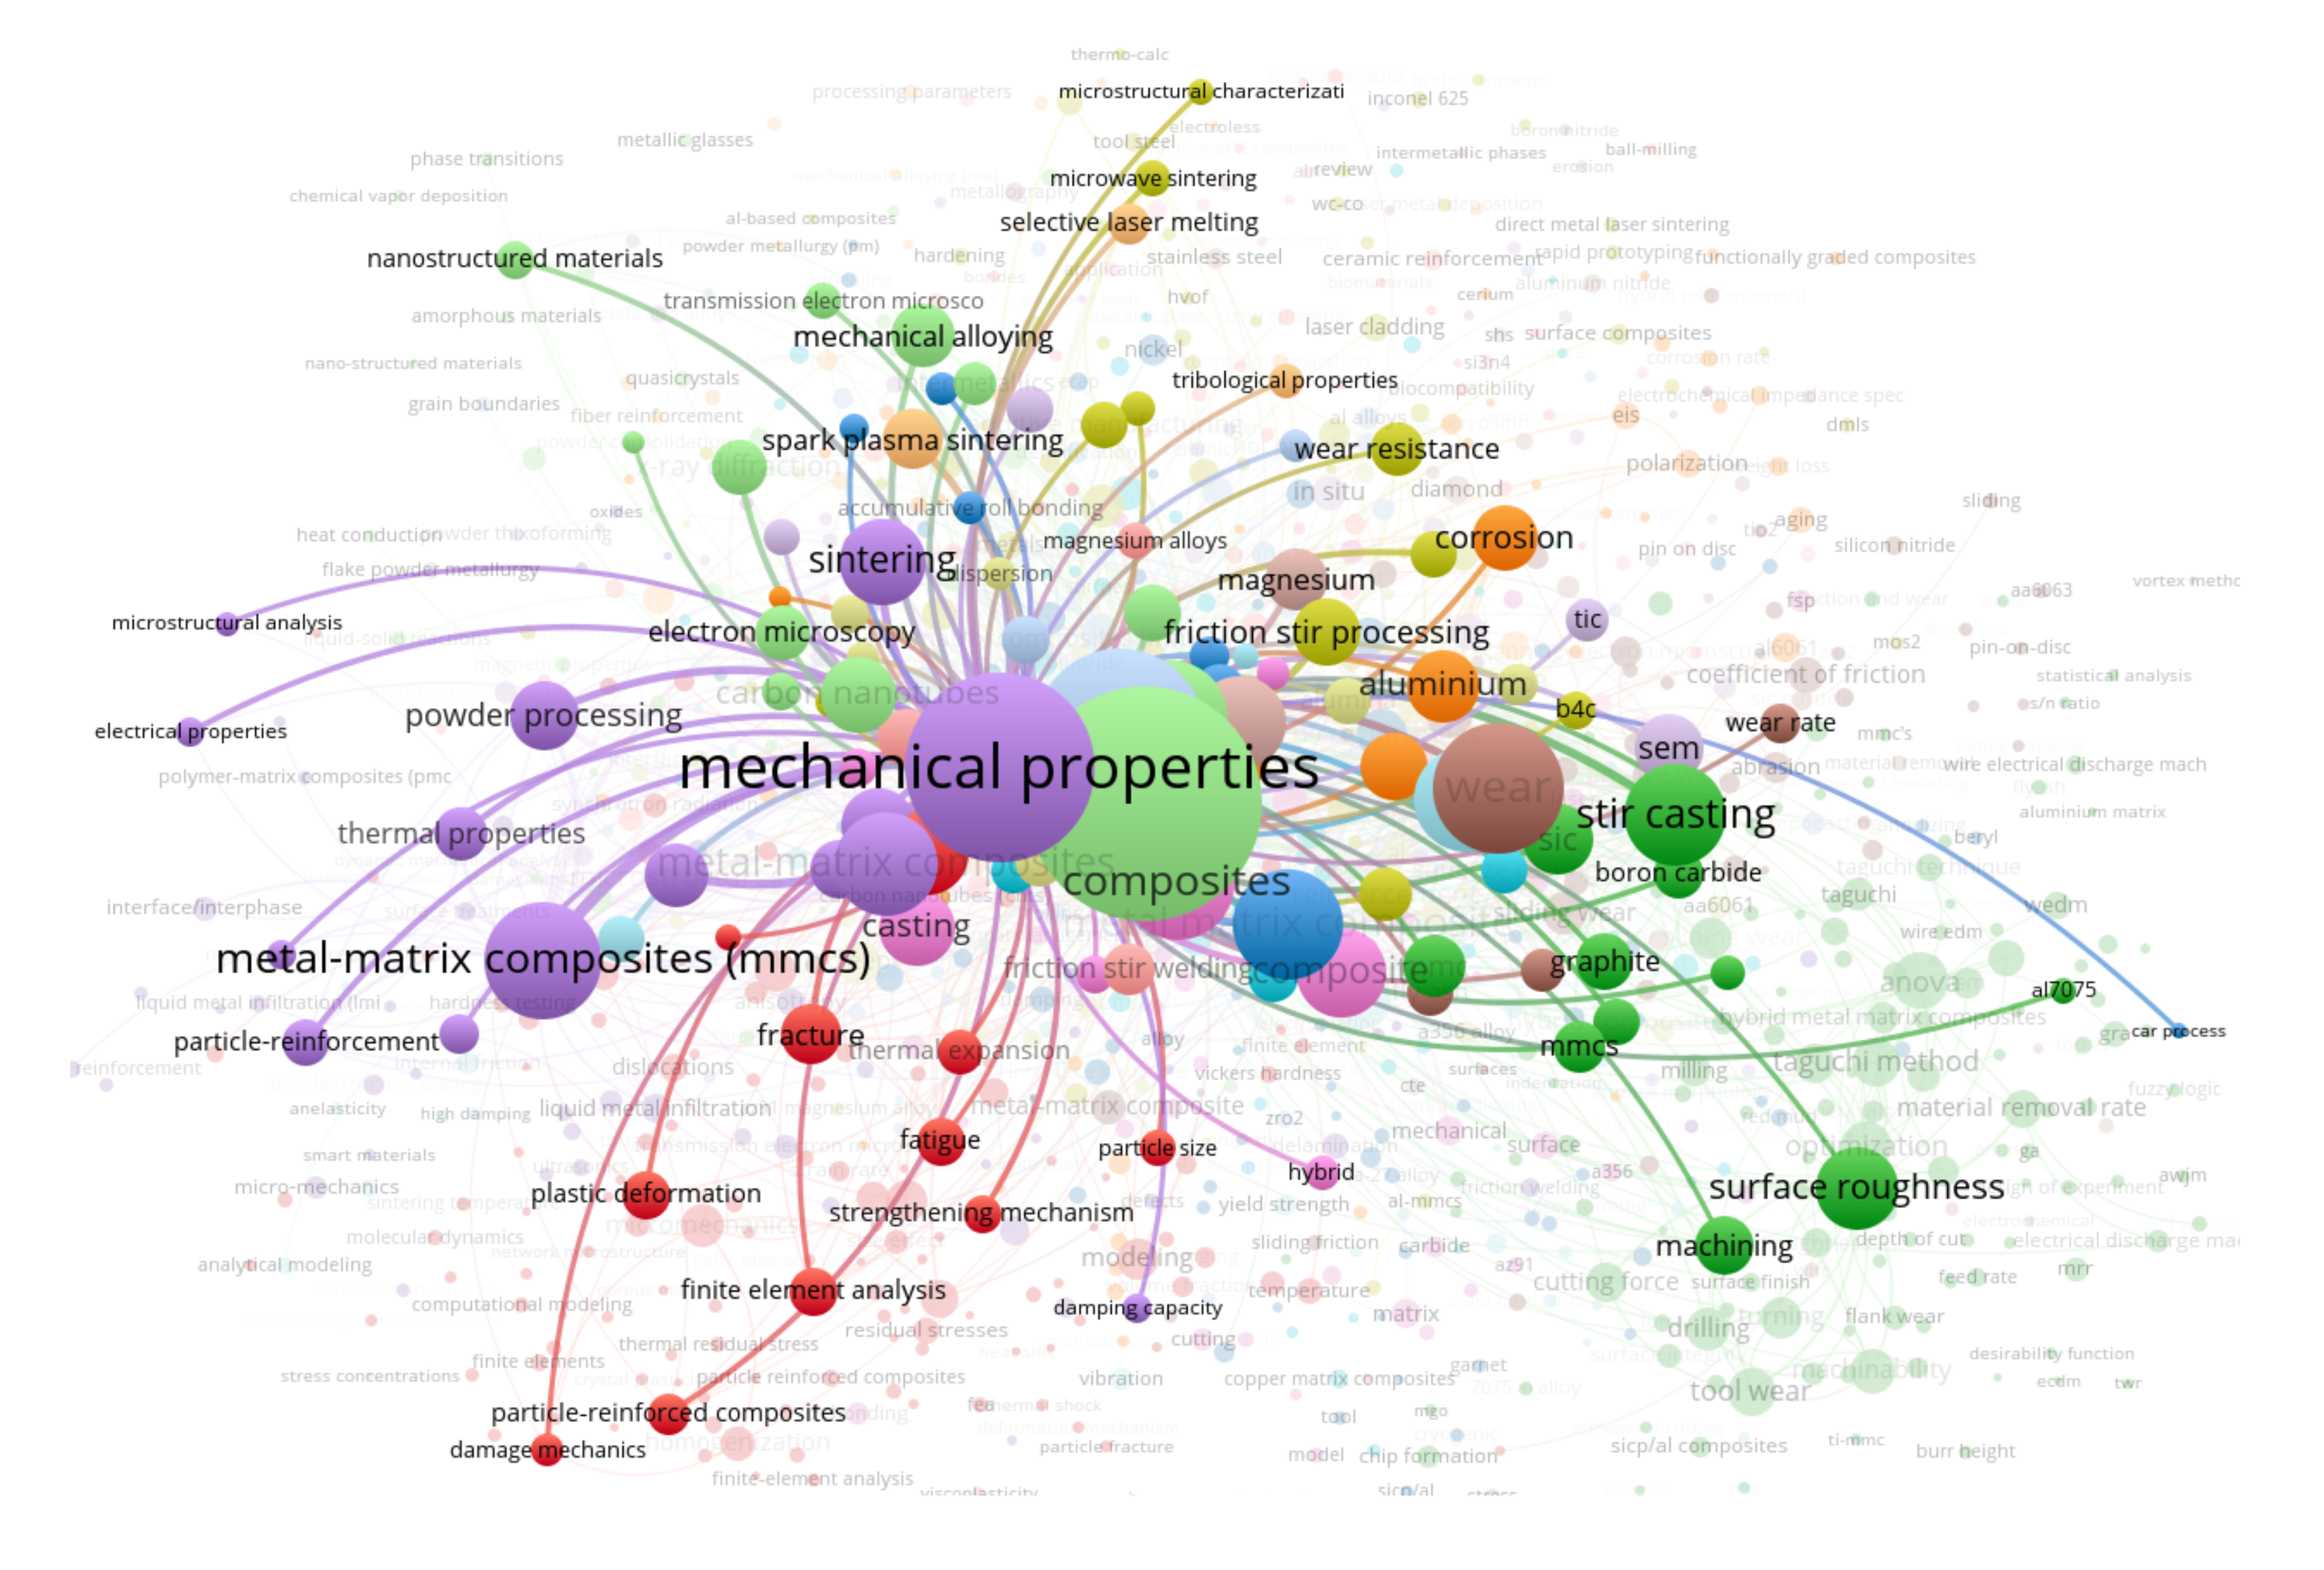
Figure 28.
The co-occurrence network graph of keyword: Microstructure.


Table 1.
The 10 productive authors.
| Rank | Author | Country | Record | % of 10,018 |
|---|---|---|---|---|
| 1 | Gupta, M. | Singapore | 140 | 1.40% |
| 2 | Zhang, Di | China | 97 | 0.97% |
| 3 | Wu, Gouhua | China | 86 | 0.86% |
| 4 | Li, Zhiqiang | China | 65 | 0.65% |
| 5 | Geng, L. | China | 64 | 0.64% |
| 6 | Ma, Z. Y. | China | 58 | 0.58% |
| 7 | Wang, H. W. | China | 57 | 0.57% |
| 8 | Liu, Ying | China | 55 | 0.55% |
| 9 | Xiao, B. L. | China | 51 | 0.51% |
| 10 | Guo, Qiang | China | 48 | 0.48% |
Table 2.
The top 10 researchers with maximum TLS values.
| Rank | Author | Country | P | Links | TLS |
|---|---|---|---|---|---|
| 1 | Zhang, D | China | 113 | 108 | 499 |
| 2 | Li, Z | China | 93 | 110 | 443 |
| 3 | Li, J | China | 117 | 184 | 421 |
| 4 | Liu, | China | 94 | 161 | 319 |
| 5 | Guo, Q | China | 50 | 57 | 317 |
| 6 | Wang, H | China | 90 | 112 | 300 |
| 7 | Fan, G | China | 46 | 48 | 288 |
| 8 | Wang, X | China | 80 | 133 | 286 |
| 9 | Zhang, Y | China | 85 | 133 | 276 |
| 10 | Li, Y | China | 85 | 149 | 273 |
Table 3.
The top 10 co-author linkages of Fan G.
| Sr. No. | Linked Author | Link Strength |
|---|---|---|
| 1 | Li, Z | 41 |
| 2 | Zhang, D | 39 |
| 3 | Guo, Q | 33 |
| 4 | Tan, Z | 28 |
| 5 | Xiong, Db | 26 |
| 6 | Su, Y | 22 |
| 7 | Ji, G | 11 |
| 8 | Xu, R | 10 |
| 9 | Zhang, J | 8 |
| 10 | Guo, C | 7 |
Table 4.
The top 10 co-author linkages of Wang X.
| Sr. No. | Linked Author | Link Strength |
|---|---|---|
| 1 | Zhang, H | 17 |
| 2 | Zhang, Y | 17 |
| 3 | Li, J | 14 |
| 4 | Wang, L | 8 |
| 5 | Kim, Mj | 7 |
| 6 | Wang, J | 7 |
| 7 | Che, Z | 6 |
| 8 | Wu, K | 5 |
| 9 | Zhang, X | 5 |
| 10 | Hu, X | 5 |
Table 5.
The top 13 organizations with the maximum TLS.
| Rank | Organization | Country | P | Links | TLS |
|---|---|---|---|---|---|
| 1 | Chinese Academy Science | China | 227 | 73 | 212 |
| 2 | Harbin Institute of Technology | China | 335 | 70 | 162 |
| 3 | Indian Institutes of Technology | India | 223 | 71 | 154 |
| 4 | Shanghai Jiao Tong University | China | 270 | 71 | 151 |
| 5 | National University of Singapore | Singapore | 160 | 47 | 102 |
| 6 | Islamic Azad University | Afghanistan | 108 | 36 | 97 |
| 7 | Anna University | India | 112 | 45 | 95 |
| 8 | National Institutes of Technology | India | 155 | 45 | 91 |
| 9 | Northwestern Polytechnic University | USA | 132 | 45 | 85 |
| 10 | University of Science and Technology Beijing | China | 118 | 39 | 72 |
| 11 | Leibniz Institute for Solid State and Materials Research | Germany | 33 | 25 | 68 |
| 12 | Nanjing University of Aeronautics and Astronautics (NUAA) | China | 78 | 22 | 63 |
| 13 | Osaka University | Japan | 51 | 21 | 61 |
Table 6.
The top 10 institutional collaboration links of Anna University.
| Sr. No. | Linked Organization | Country | Link Strength |
|---|---|---|---|
| 1 | Sri Sivasubramaniya Nadar College of Engineering | India | 10 |
| 2 | University College of Engineering Kancheepuram | India | 7 |
| 3 | University of the Witwatersrand | South Africa | 6 |
| 4 | K Ramakrishnan College of Engineering | India | 5 |
| 5 | Sri Sairam Institute of Technology | India | 5 |
| 6 | Sri Sairam Engineering College | India | 4 |
| 7 | Thiagarajar College of Engineering | India | 4 |
| 8 | Annamalai University | India | 3 |
| 9 | National Institutes of Technology | India | 3 |
| 10 | Sri Venkateswara College of Engineering (SVCE) | India | 3 |
Table 7.
The top 10 institutional collaboration links of the National Institutes of Technology.
| Sr. No. | Linked Organization | Country | Link Strength |
|---|---|---|---|
| 1 | Indian Institutes of Technology | India | 12 |
| 2 | Jadavpur University | India | 6 |
| 3 | Chendhuran College of Engineering and Technology | India | 5 |
| 4 | Amrita Vishwa Vidyapeetham University | India | 4 |
| 5 | Indian Institute of Science | India | 4 |
| 6 | National Metallurgical Laboratory | India | 4 |
| 7 | Visvesvaraya Technological University | India | 4 |
| 8 | National University of Singapore | Singapore | 3 |
| 9 | Amrita Vishwa Vidyapeetham University | India | 3 |
| 10 | Anna University | India | 3 |
Table 8.
The top 13 countries with the maximum TLS.
| Rank | Country | P | Links | TLS |
|---|---|---|---|---|
| 1 | Peoples Republic of China | 2475 | 42 | 681 |
| 2 | USA | 1104 | 47 | 537 |
| 3 | India | 2509 | 45 | 350 |
| 4 | Germany | 525 | 43 | 332 |
| 5 | England | 325 | 40 | 274 |
| 6 | France | 282 | 36 | 259 |
| 7 | Japan | 312 | 28 | 186 |
| 8 | Canada | 259 | 27 | 155 |
| 9 | Iran | 463 | 26 | 145 |
| 10 | South Korea | 372 | 25 | 143 |
| 11 | Australia | 172 | 23 | 142 |
| 12 | Spain | 245 | 26 | 130 |
| 13 | Egypt | 157 | 17 | 124 |
Table 9.
The top 10 international collaboration links of USA.
| Sr. No. | Linked Country | Link Strength |
|---|---|---|
| 1 | People Republic of China | 171 |
| 2 | India | 50 |
| 3 | South Korea | 26 |
| 4 | Japan | 24 |
| 5 | France | 23 |
| 6 | Egypt | 19 |
| 7 | Canada | 18 |
| 8 | Turkey | 16 |
| 9 | England | 15 |
| 10 | Germany | 15 |
Table 10.
The top 10 international collaboration links of India.
| Sr. No. | Linked Country | Link Strength |
|---|---|---|
| 1 | USA | 50 |
| 2 | England | 30 |
| 3 | Singapore | 28 |
| 4 | Germany | 25 |
| 5 | South Africa | 22 |
| 6 | Australia | 19 |
| 7 | Portugal | 16 |
| 8 | South Korea | 16 |
| 9 | People Republic of China | 13 |
| 10 | Oman | 9 |
Table 11.
The top 10 MMC articles with maximum citation links.
| Rank | Title of Article | Authors | Year | Journal | Citations | Links |
|---|---|---|---|---|---|---|
| 1 | Metal matrix composites—from science to technological significance [113] | D.B. Miracle | 2005 | Composites Science and Technology | 1006 | 333 |
| 2 | Carbon nanotube reinforced metal matrix composites—a review [105] | S. R. Bakshi, D. Lahiri and A. Agarwal | 2010 | International Materials Reviews | 879 | 212 |
| 3 | Recent progress in the development and properties of novel metal matrix nanocomposites reinforced with carbon nanotubes and graphene nanosheets [106] | S.C. Tjong | 2013 | Materials Science & Engineering R: Reports | 552 | 200 |
| 4 | Production and mechanical properties of Al2O3 particle-reinforced 2024 aluminium alloy composites [108] | M.Kok | 2005 | Journal of Materials Processing Technology | 407 | 130 |
| 5 | P/M aluminum matrix composites: An overview [109] | J.M. Torralba, C.E. da Costa and F. Velasco | 2003 | Journal of Materials Processing Technology | 458 | 130 |
| 6 | Mechanical behavior of particle reinforced metal matrix composites [110] | N. Chawla and Y.L. Shen | 2001 | Advanced engineering materials | 436 | 128 |
| 7 | Novel nanoparticle-reinforced metal matrix composites with enhanced mechanical properties [107] | S.C. Tjong | 2007 | Advanced engineering materials | 348 | 122 |
| 8 | Metal Matrix Composites [114] | A. Mortensen and J. Llorca | 2010 | Annual Review of Materials Research | 207 | 116 |
| 9 | Particle distribution in cast metal matrix composites—Part I [111] | J. Hashim, L. Looney and M.S.J. Hashmi | 2002 | Journal of Materials Processing Technology | 287 | 114 |
| 10 | Microstructure and interface characteristics of B4C, SiC and Al2O3 reinforced Al matrix composites: A comparative study [112] | K.M. Shorowordi, T. Laoui, A.S.M.A. Haseeb, J.P. Celis and L. Froyen | 2003 | Journal of Materials Processing Technology | 397 | 110 |
Table 12.
The top 13 researchers with the highest citation TLS values.
| Rank | Author | Country | P | Citations | Links | TLS |
|---|---|---|---|---|---|---|
| 1 | Zhang, D | China | 113 | 3278 | 777 | 7016 |
| 2 | Li, Z | China | 93 | 2617 | 733 | 5921 |
| 3 | Fan, G | China | 46 | 2168 | 581 | 4662 |
| 4 | Guo, Q | China | 50 | 1536 | 525 | 4230 |
| 5 | Li, J | China | 117 | 1903 | 815 | 3936 |
| 6 | Wang, x | China | 80 | 2088 | 740 | 3622 |
| 7 | Su, Y | China | 46 | 1244 | 567 | 3330 |
| 8 | Gupta, M | Singapore | 140 | 3546 | 738 | 3287 |
| 9 | Tan, Z | China | 34 | 1064 | 423 | 3233 |
| 10 | Ji, G | China | 40 | 927 | 459 | 3164 |
| 11 | Xiong, Db | China | 34 | 1028 | 427 | 3091 |
| 12 | Wu, G | China | 70 | 1185 | 591 | 2805 |
| 13 | chen, z | Australia | 50 | 1443 | 634 | 2804 |
Table 13.
The top 10 citation links of Zhang D.
| Sr. No. | Linked Author | Link Strength |
|---|---|---|
| 1 | Li, Z | 334 |
| 2 | Guo, Q | 283 |
| 3 | Fan, G | 259 |
| 4 | Xiong, Db | 209 |
| 5 | Su, Y | 207 |
| 6 | Tan, Z | 184 |
| 7 | Ji, G | 97 |
| 8 | Zhang, J | 93 |
| 9 | Zhao, L | 87 |
| 10 | Li, J | 70 |
Table 14.
The top 10 citation links of Gupta M.
| Sr. No. | Linked Author | Link Strength |
|---|---|---|
| 1 | Tun, Ks | 112 |
| 2 | Wong, Wle | 62 |
| 3 | Sankaranarayanan, S | 61 |
| 4 | Jayalakshmi, S | 60 |
| 5 | Habibi, Mk | 51 |
| 6 | Nguyen, Qb | 47 |
| 7 | Paramsothy, M | 41 |
| 8 | Shakoor, Ra | 34 |
| 9 | Perez, P | 31 |
| 10 | Adeva, P | 31 |
Table 15.
The top 13 organizations with the highest citation TLS values.
| Rank | Organization | Country | P | Citations | Links | TLS |
|---|---|---|---|---|---|---|
| 1 | Shanghai Jiao Tong University | China | 270 | 5323 | 544 | 4433 |
| 2 | Harbin Institute of Technology | China | 335 | 5659 | 565 | 3938 |
| 3 | Indian Institutes of Technology | India | 223 | 5109 | 592 | 3272 |
| 4 | Chinese Academy Science | China | 227 | 3925 | 498 | 3010 |
| 5 | National University of Singapore | Singapore | 160 | 4185 | 456 | 2277 |
| 6 | National Institutes of Technology | India | 155 | 2499 | 461 | 2187 |
| 7 | University of Science and Technology Beijing | China | 118 | 3199 | 341 | 1822 |
| 8 | Islamic Azad University | Afghanistan | 108 | 2249 | 433 | 1816 |
| 9 | Northwestern Polytechnic University | USA | 132 | 1780 | 395 | 1715 |
| 10 | Anna University | India | 112 | 2124 | 424 | 1602 |
| 11 | Osaka University | Japan | 51 | 2223 | 297 | 1584 |
| 12 | University of Tehran | Iran | 72 | 2389 | 403 | 1509 |
| 13 | University of Wisconsin-Madison | USA | 60 | 2524 | 417 | 1337 |
Table 16.
The top 10 citation links of the National Institutes of Technology.
| Sr. No. | Linked Organization | Country | Link Strength |
|---|---|---|---|
| 1 | Indian Institutes of Technology | India | 73 |
| 2 | Anna University | India | 49 |
| 3 | National University of Singapore | Singapore | 43 |
| 4 | Amrita Vishwa Vidyapeetham University | India | 42 |
| 5 | Council of Scientific and Industrial Research | India | 32 |
| 6 | Gazi University | Turkey | 30 |
| 7 | Jadavpur University | India | 30 |
| 8 | Harbin Institute of Technology | China | 29 |
| 9 | University of Tehran | Iran | 26 |
| 10 | Annamalai University | India | 23 |
Table 17.
The top 10 citation links of Anna University.
| Sr. No. | Linked Organization | Country | Link Strength |
|---|---|---|---|
| 1 | National Institutes of Technology | India | 49 |
| 2 | Indian Institutes of Technology | India | 36 |
| 3 | Harbin Institute of Technology | China | 29 |
| 4 | K Ramakrishnan College of Engineering | India | 20 |
| 5 | PSG College Of Technology | India | 20 |
| 6 | Sri Krishna College of Engineering and Technology | India | 19 |
| 7 | Annamalai University | India | 17 |
| 8 | University of Wisconsin-Madison | USA | 16 |
| 9 | Gazi University | Turkey | 15 |
| 10 | Kongu Engineering College | India | 15 |
Table 18.
The top 13 countries with the maximum citation TLS values.
| Rank | Country | P | Citations | Links | TLS |
|---|---|---|---|---|---|
| 1 | Peoples Republic of China | 2475 | 43,374 | 66 | 20,878 |
| 2 | India | 2509 | 34,715 | 66 | 17,501 |
| 3 | USA | 1104 | 33,038 | 66 | 13,112 |
| 4 | Iran | 463 | 10,830 | 63 | 5938 |
| 5 | Germany | 525 | 11,654 | 64 | 5042 |
| 6 | Turkey | 392 | 7784 | 62 | 4678 |
| 7 | England | 325 | 10,849 | 64 | 3799 |
| 8 | South Korea | 372 | 6264 | 62 | 3598 |
| 9 | Japan | 312 | 6452 | 64 | 3489 |
| 10 | France | 282 | 7011 | 61 | 3397 |
| 11 | Australia | 172 | 5240 | 64 | 3077 |
| 12 | Canada | 259 | 6846 | 59 | 2922 |
| 13 | Spain | 245 | 5763 | 61 | 2797 |
Table 19.
The top 10 citation links of Iran.
| Sr. No. | Linked Country | Link Strength |
|---|---|---|
| 1 | India | 1407 |
| 2 | Peoples Republic of China | 988 |
| 3 | USA | 568 |
| 4 | Turkey | 261 |
| 5 | South Korea | 184 |
| 6 | Australia | 160 |
| 7 | Germany | 153 |
| 8 | England | 150 |
| 9 | Egypt | 145 |
| 10 | Japan | 140 |
Table 20.
The top 13 sources with the maximum TLS values.
| Rank | Source | P | Citations | Links | TLS |
|---|---|---|---|---|---|
| 1 | Materials Science and Engineering: A-Structural Materials: Properties, Microstructure and Processing | 640 | 18,715 | 242 | 6634 |
| 2 | Journal of Alloys and Compounds | 468 | 12,992 | 213 | 4377 |
| 3 | Materials & Design | 273 | 11,299 | 229 | 4364 |
| 4 | Composites Science and Technology | 185 | 10,482 | 225 | 3109 |
| 5 | Composites Part A: Applied Science and Manufacturing | 200 | 8708 | 222 | 2987 |
| 6 | Journal of Materials Processing Technology | 157 | 8198 | 218 | 2895 |
| 7 | Composites Part B: Engineering | 200 | 7212 | 194 | 2254 |
| 8 | Materials Today: Proceedings | 435 | 2024 | 160 | 2155 |
| 9 | Acta Materialia | 131 | 7726 | 172 | 1983 |
| 10 | Wear | 129 | 6007 | 191 | 1883 |
| 11 | The International Journal of Advanced Manufacturing Technology | 133 | 2755 | 146 | 1575 |
| 12 | Scripta Materialia | 100 | 5105 | 161 | 1397 |
| 13 | Journal of Materials Science | 139 | 2667 | 158 | 1257 |
Table 21.
The top 10 citation links of sources: The International Journal of Advanced Manufacturing Technology.
Table 21.
The top 10 citation links of sources: The International Journal of Advanced Manufacturing Technology.
| Sr. No. | Linked Journal | Link Strengtp |
|---|---|---|
| 1 | Journal of Materials Processing Technology | 187 |
| 2 | International Journal of Machine Tools & manufacture | 111 |
| 3 | Materials and Manufacturing Processes | 87 |
| 4 | Wear | 67 |
| 5 | Materials & Design | 52 |
| 6 | Materials Science and Engineering a-structural Materials Properties | 50 |
| 7 | Materials Today-proceedings | 46 |
| 8 | Composites Science and Technology | 44 |
| 9 | Advances in Manufacturing | 41 |
| 10 | International Journal of Mechanical Sciences | 38 |
Table 22.
The top 10 citation links of source: Scripta Materialia.
| Sr. No. | Linked Journal | Link Strength |
|---|---|---|
| 1 | Materials Science and Engineering: A-Structural Materials: Properties, Microstructure and Processing | 172 |
| 2 | Journal of Alloys and Compounds | 138 |
| 3 | Materials & Design | 95 |
| 4 | Composites Part a-applied Science and Manufacturing | 80 |
| 5 | Acta Materialia | 67 |
| 6 | Composites Part b-engineering | 52 |
| 7 | Composites Science and Technology | 46 |
| 8 | Advanced Engineering Materials | 37 |
| 9 | Carbon | 34 |
| 10 | Journal of Materials Science | 33 |
Table 23.
The top 13 keywords with the maximum citation TLS values.
| Rank | Keyword | P | Links | TLS |
|---|---|---|---|---|
| 1 | Metal Matrix Composites | 2135 | 845 | 5566 |
| 2 | Mechanical Properties | 1255 | 599 | 3643 |
| 3 | Microstructure | 962 | 597 | 2922 |
| 4 | Wear | 511 | 429 | 1701 |
| 5 | Metal-Matrix Composites (mmcs) | 485 | 280 | 1383 |
| 6 | Composites | 437 | 425 | 1284 |
| 7 | Powder Metallurgy | 423 | 360 | 1272 |
| 8 | Metal Matrix Composite | 457 | 466 | 1222 |
| 9 | Hardness | 295 | 338 | 1081 |
| 10 | Metal-Matrix Composites | 403 | 374 | 1060 |
| 11 | Stir Casting | 328 | 309 | 1026 |
| 12 | Aluminum | 256 | 300 | 852 |
| 13 | Composite | 264 | 327 | 794 |
Table 24.
The top 15 keywords with the strongest citation bursts.
| Rank | Keywords | Year | Strength | Begin | End | 2001–2020 |
|---|---|---|---|---|---|---|
| 1 | Graphene | 2001 | 33.6453 | 2018 | 2020 |  |
| 2 | Fracture | 2001 | 24.5309 | 2001 | 2009 |  |
| 3 | Damage | 2001 | 24.1626 | 2001 | 2009 |  |
| 4 | Deformation | 2001 | 22.9149 | 2001 | 2008 |  |
| 5 | Strengthening Mechanism | 2001 | 20.45 | 2017 | 2020 |  |
| 6 | Creep | 2001 | 20.4049 | 2001 | 2010 |  |
| 7 | Stir Casting | 2001 | 19.9426 | 2018 | 2020 |  |
| 8 | Nanocomposite | 2001 | 16.9666 | 2016 | 2018 |  |
| 9 | Flow | 2001 | 16.3026 | 2001 | 2010 |  |
| 10 | Residual Stresses | 2001 | 15.6975 | 2001 | 2008 |  |
| 11 | Particulate Composite | 2001 | 15.6215 | 2001 | 2010 |  |
| 12 | Powder Processing | 2001 | 15.1708 | 2007 | 2016 |  |
| 13 | Metal Matrix Composites (mmc) | 2001 | 14.8633 | 2006 | 2011 |  |
| 14 | Pressureless Infiltration | 2001 | 14.2745 | 2006 | 2011 |  |
| 15 | B4C | 2001 | 13.6994 | 2018 | 2020 |  |
Table 25.
The top 15 references with the strongest citation bursts.
| Rank | References | Year | Strength | Begin | End | 2001–2020 |
|---|---|---|---|---|---|---|
| 1 | LLOYD DJ, 1994, INT MATER REV, V39, P1 [115] | 1994 | 72.1562 | 2001 | 2005 |  |
| 2 | IBRAHIM IA, 1991, J MATER SCI, V26, P1137 [116] | 1991 | 38.8436 | 2001 | 2005 |  |
| 3 | CHRISTMAN T, 1989, ACTA METALL MATER, V37, P3029 [118] | 1989 | 33.77 | 2001 | 2005 |  |
| 4 | Clyne TW, 1993, INTRO METAL MATRIX C, V0, P0 [119] | 1993 | 33.2064 | 2001 | 2005 |  |
| 5 | ESHELBY JD, 1957, PROC R SOC LON SER-A, V241, P376 [128] | 1957 | 32.0793 | 2001 | 2005 |  |
| 6 | BAO G, 1991, ACTA METALL MATER, V39, P1871 [121] | 1991 | 29.2619 | 2001 | 2005 |  |
| 7 | LLOYD DJ, 1991, ACTA METALL MATER, V39, P59 [122] | 1991 | 26.4452 | 2001 | 2005 |  |
| 8 | ARSENAULT RJ, 1986, MATER SCI ENG, V81, P175 [41] | 1986 | 26.4452 | 2001 | 2005 |  |
| 9 | MCDANELS DL, 1985, METALL TRANS A, V16, P1105 [125] | 1985 | 22.5029 | 2001 | 2005 |  |
| 10 | MORI T, 1973, ACTA METALL MATER, V21, P571 [126] | 1973 | 21.9398 | 2001 | 2005 |  |
| 11 | NARDONE VC, 1986, SCRIPTA METALL MATER, V20, P43 [120] | 1986 | 21.9398 | 2001 | 2005 |  |
| 12 | VOGELSANG M, 1986, METALL TRANS A, V17, P379 [124] | 1986 | 19.6878 | 2001 | 2005 |  |
| 13 | TJONG SC, 2000, MAT SCI ENG R, V29, P49 [127] | 2000 | 19.628 | 2002 | 2005 |  |
| 14 | BRECHET Y, 1991, ACTA METALL MATER, V39, P1781 [123] | 1991 | 18.7652 | 2001 | 2004 |  |
| 15 | ROHATGI P K, 1986, INTERNATIONAL METALS REVIEWS, V31, P115 [117] | 1986 | 17.999 | 2001 | 2005 |  |
Publisher’s Note: MDPI stays neutral with regard to jurisdictional claims in published maps and institutional affiliations. |
© 2021 by the authors. Licensee MDPI, Basel, Switzerland. This article is an open access article distributed under the terms and conditions of the Creative Commons Attribution (CC BY) license (https://creativecommons.org/licenses/by/4.0/).
Share and Cite
MDPI and ACS Style
Sekhar, R.; Sharma, D.; Shah, P. State of the Art in Metal Matrix Composites Research: A Bibliometric Analysis. Appl. Syst. Innov. 2021, 4, 86. https://doi.org/10.3390/asi4040086
AMA Style
Sekhar R, Sharma D, Shah P. State of the Art in Metal Matrix Composites Research: A Bibliometric Analysis. Applied System Innovation. 2021; 4(4):86. https://doi.org/10.3390/asi4040086
Chicago/Turabian StyleSekhar, Ravi, Deepak Sharma, and Pritesh Shah. 2021. "State of the Art in Metal Matrix Composites Research: A Bibliometric Analysis" Applied System Innovation 4, no. 4: 86. https://doi.org/10.3390/asi4040086