
Frequency Characteristics of High Strain Rate Compressions of Cf-MWCNTs/SiC Composites

1
State Key Laboratory of High-Performance Ceramics and Superfine Microstructure, Shanghai Institute of Ceramics, Chinese Academy of Sciences, Shanghai 200050, China
2
Department of Textile Engineering, Chemistry and Science, Wilson College of Textiles, North Carolina State University, Raleigh, NC 27606, USA
*
Author to whom correspondence should be addressed.
Ceramics 2023, 6(4), 1991-2007; https://doi.org/10.3390/ceramics6040122
Submission received: 11 August 2023
/
Revised: 21 September 2023
/
Accepted: 28 September 2023
/
Published: 5 October 2023
(This article belongs to the Special Issue Advances in Ceramics, 2nd Edition)
Abstract
:The incorporation of ductile reinforcements into ceramics helps restrain crack deflection, which can enhance ceramics’ toughness and overcome the matrix’s brittleness. In this paper, we produced a ceramic composite reinforced by carbon fibers coated by multi-wall carbon nanotubes (shortened by Cf-MWCNT/SiC composites) for enhanced impact resistance at a high strain rate that commonly occurs in composite materials used in astronautics, marine, and other engineering fields. The fabrication process involves growing multi-wall carbon nanotubes (MWCNTs) on a carbon fiber woven fabric (Cf) to create the fibril/fabric hybrid reinforcement. It is then impregnated by polymer solution (precursor of the ceramics), forming composites after the pyrolysis process, known as the liquid polymer infiltration and pyrolysis (PIP) technique. To assess the impact resistance of the Cf-MWCNT/SiC under high-strain rate compressions, the split Hopkinson pressure bar (SHPB) technique is employed. Since the failure behavior of the Cf-MWCNT/SiC composites in the absence of the ductile phase is not well understood, the study employs the Hilbert–Huang transform (HHT) to analyze the stress–time curves obtained from the SHPB experiments. By applying the HHT, we obtained the frequency–time spectrum and the marginal Hilbert spectrum of the stress signals. These analyses reveal the frequency characteristics of the Cf-MWCNT/SiC composite and provide insights into the relationship between transformed signal frequency and fracture behavior. By understanding the dynamic fracture behavior and frequency response of the Cf-MWCNT/SiC, it becomes possible to enhance its impact resistance and tailor its performance for specific protective requirements. Therefore, the findings of this study can guide the future design and optimization of Cf-MWCNT/SiC structures for various protective applications, such as body armor, civil structures, and protections for vehicles and aircraft.
1. Introduction
Fiber-reinforced ceramic matrix composites (FCMCs) are well-known for their exceptional mechanical toughness and enhanced reliability relative to their matrix, and they also have other unique features, including lightweight, high wear resistance, and excellent high-temperature resistance, etc., rendering them suitable for diverse protective applications. Nevertheless, when exposed to high-velocity impacts, FCMCs often fail due to severe fractures, resulting in substantial structural impairments. Consequently, an in-depth understanding of FCMCs’ fracture behavior under high-strain rate conditions is critical for improving their impact resistance through structural and compositional enhancements [1,2,3,4,5].
The integration of ductile reinforcements, such as fibrils [6], fibers [7], particles [8], or flakes [9], into ceramic matrices plays an important role in attaining both strength and toughness [10]. In instances where FCMCs are experiencing high-strain rate loading, the ceramic matrix tends to show spontaneous cracks or failures due to grain/interface defects surpassing its strength or strain thresholds. Incorporating ductile phases into ceramics permits multiple failure modes and stages [11,12,13,14,15,16], enhancing the matrix’s resistance to crack propagation. In the presence of cracks or failures within the ceramic matrix, these ductile phases act as bridging or deflecting agents, hindering crack propagation and preventing catastrophic failure [17]. The bridging or crack-deflection phenomenon is pivotal for enhancing FCMCs’ toughness while preserving their strength. However, the inclusion of ductile phases can introduce voids and defects into the matrix, often causing crack initiation [10]. These voids and defects can be reduced during the sintering process [18], but cannot be eliminated due to the intricate liquid–solid–air interplay in the liquid polymer infiltration and pyrolysis (PIP) procedure [19].
Past studies have reported on the recognizing constituent contributions of composites on the whole system’s mechanical properties, particularly for fiber assemblies [20]. Acoustic emission (AE) detection represents an advanced technique for monitoring fracture formation in composites [21,22]. AE detection involves capturing dynamic elastic sound waves generated by materials during loading, offering invaluable insights into the fracture progression. While AE technology is extensively employed in evaluating inorganic materials, its effectiveness heavily relies on sound signal quality and still faces technical challenges in signal recognition and result precision for organic materials used in composites [23]. Digital image analysis represents another useful tool for assessing post-damage morphologies in fractured composite materials [24]. Although many image analysis techniques have limitations in capturing dynamic fracture behavior associated with high-strain rate deformation, micro CTs with elevated frame rates provide real-time monitoring capabilities. However, their widespread utilization is hindered by high cost and accuracy limits. The absence of temporal-domain fracture evolution information becomes the bottleneck challenge in establishing direct relationships between dynamic fractures and the constitutive behavior of fiber-reinforced materials.
High strain rate stress versus time is a crucial mechanical indicator, depicting stress variations over time. Employing signal processing techniques to transform time-domain signals into the frequency domain facilitates a comprehensive understanding of FCMCs’ failure behaviors [25]. The Hilbert transform, a well-recognized signal processing, generates an analytical signal in the frequency domain based on the original time-domain signal [26]. Another data analysis methodology, the Hilbert–Huang Transform (HHT), introduced by Huang, merges Hilbert spectral analysis with empirical mode decomposition (EMD) [27]. This new approach has proven to be successful across diverse signal-processing domains [28]. However, due to lack of the fusion of two distinct disciplinaries, the application of HHT in fracture mechanics research has not been extensively explored, particularly within the realm of high strain rate fracture analysis of ceramics [29,30].
In this study, we developed a ceramic composite reinforced by carbon fibers coated by multi-wall carbon nanotubes (Cf-MWCNT/SiC composites). By synthesizing multi-wall carbon nanotubes (MWCNTs) on the surface of carbon fiber woven fabric (Cf), we developed a multi-scale reinforcement system. Following that, the fabric was used to reinforce SiC matrix material and eventually form Cf-MWCNT/SiC composites utilizing the liquid polymer infiltration and pyrolysis (PIP) technique. The MWCNTs can enhance interfaces between carbon fibers and the SiC matrix, improving the composite’s mechanical properties against high-velocity impacts. We used the split Hopkinson pressure bar (SHPB) to conduct high strain rate compression test both in the sample’s in-plane direction (parallel to the fabric surface) and the out-of-plane direction (through-thickness direction). The tested stress–strain results were processed into frequency spectra by HHT. We eventually established the correlation between the HHT results with the sample fracture and deformation. By gaining insights into the dynamic fracture behavior and frequency response of Cf-MWCNT/SiC, we can potentially improve its impact resistance and customize its performance to meet specific protection needs. Consequently, the outcomes of this research can serve as a valuable roadmap for the future development and optimization of Cf-MWCNT/SiC structures across diverse protective applications, including body armor, civil engineering structures, and safeguarding systems for vehicles and aircraft.
2. Materials and Methods
2.1. Cf-MWCNT/SiC Composites
The Cf-MWCNT/SiC composite in this work was fabricated in three steps; see Figure 1.
- Coating carbon woven fabrics with SiC precursor and then pyrolyzing it (Figure 1a,b).
- Synthesizing multiwall carbon nanotube forest on the surface of carbon woven fabrics (Figure 1c).
- The combination of fabric reinforcement with matrix using the PIP process (Figure 1d,e).
The plain weave carbon fabric, with weft or warp density of 7.6 yarns/cm and a basis weight of 1.8 g/cm3, was fabricated using non-twist Toray T700 carbon filament tows (Toray Industries Inc., Tokyo, Japan). The fabric was conditioned at a temperature of 24 °C and relative humidity of 50% for 24 h to reduce the residual stress. After that, the woven fabric sample was first coated with SiC precursor three times (see details in the author’s previous paper [31]), as shown in Figure 1b, and was then stacked into 10 layers. The sample thereafter was immersed into a catalyst solution (a mixture of iron nitrate and aluminum nitrate in ethanol) for 3 h at 85 °C in order to load catalysts on the surface of the SiC layer. In a horizontal quartz tube furnace, the carbon fabric was heated up to 700 °C and the carbon nanotubes were synthesized on the fabric surface by using a gas mixture of C2H2 and H2 in the furnace (Figure 1c). The flow rate of gas mixture is 250 sccm with a volume ratio of 1:4. The overall reaction duration is 60 min.
The phenolic resin (thermal-setting material) was used to impregnate the fabric stacks and then cured at 130 °C for 6 h (Figure 1d). As shown in Figure 1e, the hybrid composite was treated 10 times by the PIP using the polycarbosilane. Each treatment is 30 min at 900 °C. Figure 1f shows the SEM image of the Cf-MWCNT/SiC composites. It can be observed that the CNTs distribute evenly in the SiC matrix and the cross-sectional shape of the carbon fiber keeps integrity with very rare damage after severe treatments of the PIP process. A hierarchical hybrid fiber-reinforced SiC matrix composite was thus produced.
Then the composite was cut into specimens with 10 mm length, 10 mm width, and 5 mm thickness for a high strain rate compression test. The fiber volume fraction of the Cf-MWCNT/SiC composites was 33.72% calculated by a weight ratio of carbon fiber and specimen. The volume fraction of the CNTs is around 4% without considering a material loss in the synthesis process. The density is 1.92 g/cm3 and the porosity is 11.21%, which were determined using the Archimedes method.
2.2. Toughening Mechanism of Using MWCNTs Coated Carbon Fabric as Reinforcement
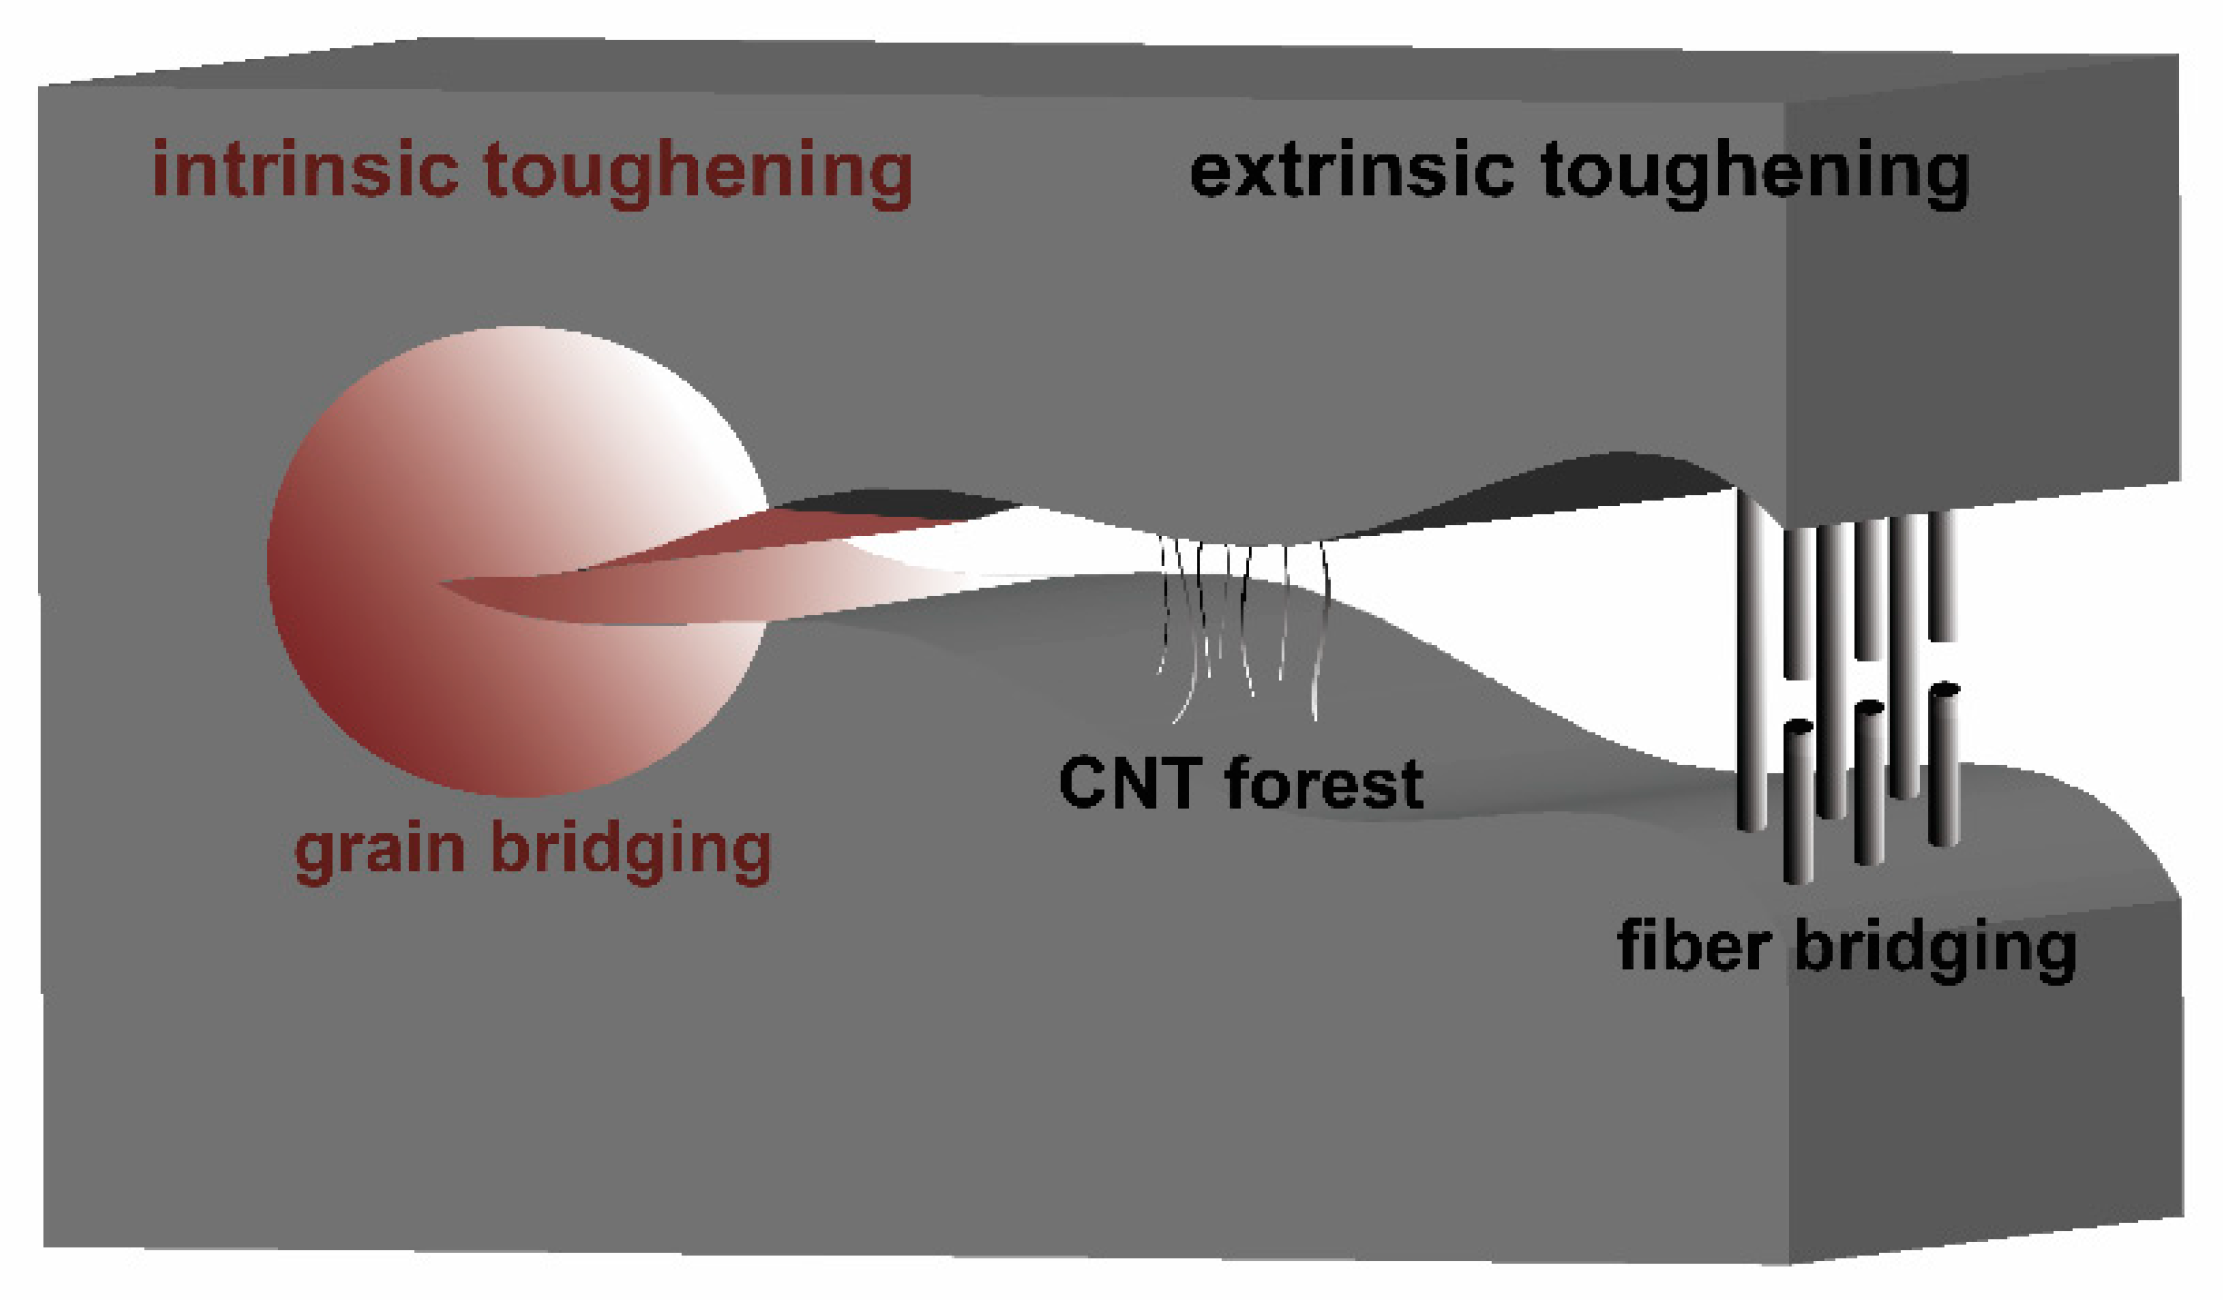
With the hierarchical reinforcement structure, the Cf-MWCNT/SiC composite has two types of toughening mechanisms, including intrinsic toughening and extrinsic toughening (see Figure 2). Intrinsic toughening is obtained from the nature of strong bonds among crystal lattices of the silicon carbide, while extrinsic toughening is originally from the crack-tip bridging by the CNT forest and carbon fibers. When a crack initiates and propagates, it will meet three barriers that resist the path growth, including carbon fibers in the fabric, CNT forest, and silicon carbide (SiC). Compared to the traditional FCMC, additional CNT forests can fill the gaps that are sized between the extrinsic toughening scale and the intrinsic toughening scale. In addition, the CNT forest can improve the interfacial property between carbon fiber and SiC matrix. In summary, the developed multiscale reinforcement can effectively prevent the sudden release of the cracking energy and increase the capacity to resist high strain rate impact. Thus, the toughening mechanisms count for different failure modes within the composites. Recognizing failure modes associated with different toughening mechanisms could help us to better understand the material’s responses to high strain rate impact, which can further facilitate the design of FCMC with enhanced high-speed impact resistance.
2.3. Methods
2.3.1. Characterizations of High Strain Rate and Quasi-Static Compressions Properties
The split Hopkinson pressure bar (SHPB) technique is a powerful tool for investigating the dynamic response of high-performance ceramic matrix composites. It enables direct measurement of their strength, stiffness, fracture behavior, and stiffness degradation under high strain rate loading conditions. It is designed based on the principle of one-dimensional wave propagation. Figure 3 shows the schematic illustration of the SHPB that consists of a striker bar, incident bar, and transmission bar made of cold roll steel. The striker bar is accelerated by high-pressure nitrogen gas and sequentially strikes the incident bar at the speed of , where the pulse is initiated at the interface between them. The gas pressure, bar length, and material property of striker determine the amplitude and velocity of initial flat-topped pulse that is monitored by the gage mounted in the middle of the incident bar. This pulse is separated into reflected pulse and a transmitted pulse that is at the interface between incident bar and the specimen. The transmitted pulse transfer within the specimen, and the pulse propagation are affected by specimen’s deformations and fractures. At the interface of specimen and transmission bar, the pulse has a second reflection/transmission separation. In the end, the transmitted pulse, containing the information on specimen fracture characteristics, transfers into the transmission bar and is collected by the gage II. Based on the working principle described here, SHPB can precisely detect the signal of deformation and the fracture of the materials.
The SHPB used in this research is a customized setup in the Dynamic Strength Laboratory for Textile Structure Composites at Donghua University, Shanghai, China. All bars in the system have the same diameter of 14.5 mm. Their yield strength, Young’s modulus, and Poisson’s ratio are 1800 MPa, 200 GPa, and 0.3, respectively. Each sample was tested three times at the same strain rate.
For Cf-MWCNT/SiC composites, the SHPB testing process must be well-controlled and monitored to ensure the testing accuracy. Cf-MWCNT/SiC composites are brittle, with a fracture strain of around 7% while under quasi-static compression [19]. Under a high strain rate impact, the stresses at two ends of specimen need to be in equilibrium to remain at a constant strain rate. Otherwise, the brittle ceramic specimen may fracture before the stress pulse gains equilibrium causing a great reduction in testing accuracy. Thus, there is an upper strain rate limit for the ceramic materials. Ravichandran et al. [32] reported an upper strain rate limit for ceramics in the range of 2500–3000 s−1. Miao [33] reported a limit that is three times larger relative to that reported by Ravichandran, and it was obtained by experimental measurements and a theoretical model. We chose a conservative strain rate range smaller than 2500 s−1 to ensure the reliability of the test results. In addition, Cf-MWCNT/SiC composites have a complex solid structure with interlacements and entanglements of fibers/fibrils, which need a stable flat-topped impact pulse to load strain rate. However, during the tests, narrow and sharp stress pulses often occur during propagation in bars, which normally cause a pulse oscillation and affect the output accuracy of transmitted pulse. To eliminate such problem, two layers of 70 g/m2 print paper were placed at the end of the incident bar where it is accelerated [34]. Following that, we can obtain ideal pulse signals.
A quasi-static compression was performed on a Material Testing System (MTS 810.23, MTS Inc., Huntsville, AL, USA). The speed of compressive crosshead is 1 mm/min and the strain rate corresponding to the speed approximates to 0.001 s−1. The average compression stress–strain curve of one sample was obtained from three specimens.
2.3.2. Typical SHPB Signals of Cf-MWCNT/SiC Composites
Figure 4 shows the typical voltage signals as a function of time, including input wave collected by gage I and output wave collected by gage II. The reflected pulse (in yellow) represents the surface deformation of the specimen that is in contact with the incident bar. It can be used to calculate the strain rate and strain of the specimen through the following Equations (1) and (2):
where is the wave speed of the incident bar, is the length of the specimen, is the strain of the incident bar measured by gage I, and is the duration of an incident pulse. The minus signs in Equations (1) and (2) make the value of strain positive since it is compression deformation.
The transmitted pulse (in blue) is the signal caused by specimen deformation where is contacted to the transmission bar. The strains measured by gage II are used to calculate the stress of the specimen through Equation (3):
where Eb and Ab are elastic Young’s modulus and cross-sectional area of transmission bar, respectively. AS is the contact area between specimen and transmission bar, and is the strain of the transmission bar measured by gage II.
The strain and stress calculated in Equations (2) and (3) were then used to plot the stress–strain curve for each specimen, which includes the information on fractures and deformation.
2.3.3. Hilbert–Huang Transform
The constitutive relation directly obtained in SHPB experiments can be used to identify high strain rate fracture behavior of Cf-MWCNT/SiC composites. By analyzing the frequency results obtained in Section 2.3.2 method, the relationship between the frequency distribution and the main fracture modes can be established. This frequency analysis can qualitatively identify the fractures. However, similar to other techniques, such as acoustic emission (AE) detection, fracture image analysis, and micro-CT, the resolution and capability of this method can be limited due to the signal overlapping. This can cause difficulties in distinguishing different fracture modes that show similar frequency characteristics. For example, frequencies originating from different types of cracks with the same weight/stiffness ratio may exhibit similar characteristics. Therefore, in this paper, a Hilbert–Huang transform was used to convert the stress–time signal into a frequency–time result, which is helpful for us to obtain a general understanding of the frequency distribution and its relationship with the main fracture modes.
Figure 5 shows the transformation processes. The ensemble empirical mode decomposition (EEMD) is a noise-assisted data analysis procedure and overcomes the mode-mixing problem of traditional empirical mode decomposition. It was used for breaking down the input data (Figure 5a) into various components, which can be described as intrinsic mode function (IMF) (Figure 5c).
The detailed procedure of EEMD [35] is described as follows:
- Produce a noise-added signal to the input data y(t) using Equation (4),where is Gaussian white noise.
- Decompose yi(t) into IMFs and one residue using Equation (5),where is residue.
- Repeat steps 1 and 2 with by using as new signal data.
- Take the average of all IMFs and prepare for the Hilbert transform.
After performing the Hilbert transform on each IMF component, the input data can be expressed as the real part of Equation (7),
Figure 5e shows the marginal spectrum showing frequency distribution of fracture modes. The marginal spectrum is defined as Equation (8),
where is the signal length of .
2.3.4. Fracture Identification
The relationship obtained through HHT analysis was used to identify the high strain rate fracture behavior of Cf-MWCNT/SiC composites. However, the frequency results may not provide fine-grained details of individual fracture modes. Also, the obtained results from the frequency analysis can be further processed with machine learning algorithms to train models for predicting the fiber-reinforced ceramic composites.
3. Results
3.1. Stress–Strain Curves of Cf-MWCNT/SiC Composites under High Strain Rate Impact
Figure 6 shows the stress–strain results of the Cf-MWCNT/SiC composites at different impact strain rates. The quasi-static result tested at 0.001 s−1 strain rate in out-of-plane direction (Figure 6b) shows the composites failed at ~8% strain with a sudden and catastrophic break, implying the main failure behavior is dominated by ceramic matrix. However, the quasi-static result tested in the in-plane direction (Figure 6a) shows a different response, in which the curve has two linear regions before reaching the peak stress, with a yield point at ~8% strain. In the first linear region, the initial modulus is related to the ceramic matrix’s elasticity, while we observed the surface deformation of the sample under the compression crosshead. When the sample was further compressed, fabric reinforcements sequentially bore the force layer by layer and transferred to the surrounding matrix, resulting in an increase in the stress.
For in-plane direction compression properties at high strain rates, results show that there are several hardening points along the compression process until the composites fail. This indicates fractures occurred along the fabric stack reinforcement in the through-thickness direction layer-by-layer. It is worth mentioning that ultimate strains of Cf-MWCNT/SiC composites tested at high strain rates are higher than 22%, which is significantly higher than that obtained in a quasi-static test (18%). Hence, it is concluded that Cf-MWCNT/SiC composites have a high in-plane direction strain rate sensitivity, characterized by incremental toughness as strain rate increases. In contrast, the out-of-plane compression properties tested at high strain rates show a similar brittle behavior as that observed in quasi-static test, where the composites all failed at ~8% strain. Despite this, the strengths in the out-of-plane direction also obviously increase with the strain rates, such as the high strain sensitivity found in the in-plane direction.
By comparing the impact strength tested at the same strain rate but in different directions, we found the out-of-plane direction has a higher strength relative to in-plane direction, although the out-of-plane shows less elasticity. Therefore, we can conclude the multi-layer woven fabric reinforcement imparts anisotropy to the ceramic materials due to the yarn alignment patterns existing in fabrics. The reinforcement effect and failure mechanisms become complex for Cf-MWCNT/SiC composites, which can be better understood with the help of signals converted by Hilbert–Huang Transform (HHT).
3.2. HHT: EEMD Decomposition
By applying the ensemble empirical mode decomposition (EEMD) analysis on the wave signals as a function of time, the intrinsic mode functions (IMFs) were obtained (see Figure 7). The frequency components (i.e., C1-C5 corresponding to different frequencies, and R is a residual component of the signal that cannot be modeled as an IMF) can be used to correlate with different deformations and fractures in the composites. The frequency amplitude corresponds inversely to the scale’s magnitude, while higher frequencies represent the small-scale fractures. Notably, the IMFs are able to differentiate fractures and deformations, which is critical for failure detection and prediction. One major limitation of IMFs is that they cannot quantitatively characterize deformations and fractures. The discussion on the correlation between IMFs and composites’ dynamic response to the high strain rate impact is included in the following Section 3.3 and Section 3.4.
3.3. HHT: Frequency–Time Spectrum
The frequency–time spectrums of the Cf-MWCNT/SiC composites under high strain rate impact are shown in Figure 8. The spectrum can be classified into three distinct frequency bands: high, medium, and low. High frequency (>50 MHz) represents microscale fractures, indicating the incipient cracks in SiC matrix, failures of MWCNTs, and micro-delamination between fiber and matrix. Medium frequency (30–50 MHz) represents the mesoscale fractures, where carbon fiber fractures, matrix cracks, and interfacial delamination occur. The low frequency (<30 MHz) represents macroscale fractures, including fabric failure and the yarn breaking.
Figure 8a–e shows the time-frequency spectrum of Cf-MWCNT/SiC composites impacted along the in-plane direction. The spectrum of quasi-static compression test (Figure 8a) has two distinct peaks at 3–6 s and 9–13 s, which indicates the offset of two bouts of fractures, which corresponds to the two yield points found in stress–strain results (see Figure 6a). The rest of part of the spectrum shows a flat line at lower frequency, indicating whole specimen deformation.
The spectrums of tests conducted at high strain rates are summarized in Figure 8b–e. It is observed that short high frequency bands exist through the whole impact testing time frame, which is different from the spectrum of quasi-static test. This suggests that micro-cracks and fractures occurred throughout the entire testing. The color gradient bar, shown on the right side of each figure (Figure 8), shows the signal power that is associated with the damage degree. The high power in in-plane direction (Figure 8a), which is related to the failure of composites system. While high signal powers are shown at the beginning of the spectrums for samples tested at high strain rates in the in-plane direction (Figure 8b–e), they indicate that the deformation happens at the beginning of compression.
Figure 8f–j show the spectrums of composites tested in the out-of-plane direction. In Figure 8f, a peak exists between 8 s to 12 s, when the failure occurred. Moreover, the frequency amplitudes of samples tested in out-of-plane at different strain rates are much lower relative to those tested in in-plane direction. It represents the fractures that occur when samples are impacted in out-of-plane direction and have a relatively larger deformation as compared to that tested in the in-plane direction. Also, the spectrum’s time spans of samples tested in the out-pf-plane direction (Figure 8g–j) are much longer than those of samples tested in the in-plane direction (Figure 8b–e). This is because the failure stresses of the out-of-plane direction are higher than the in-plane direction at the same strain rate level (check results in Figure 6).
3.4. HHT: Marginal Hilbert Spectrum
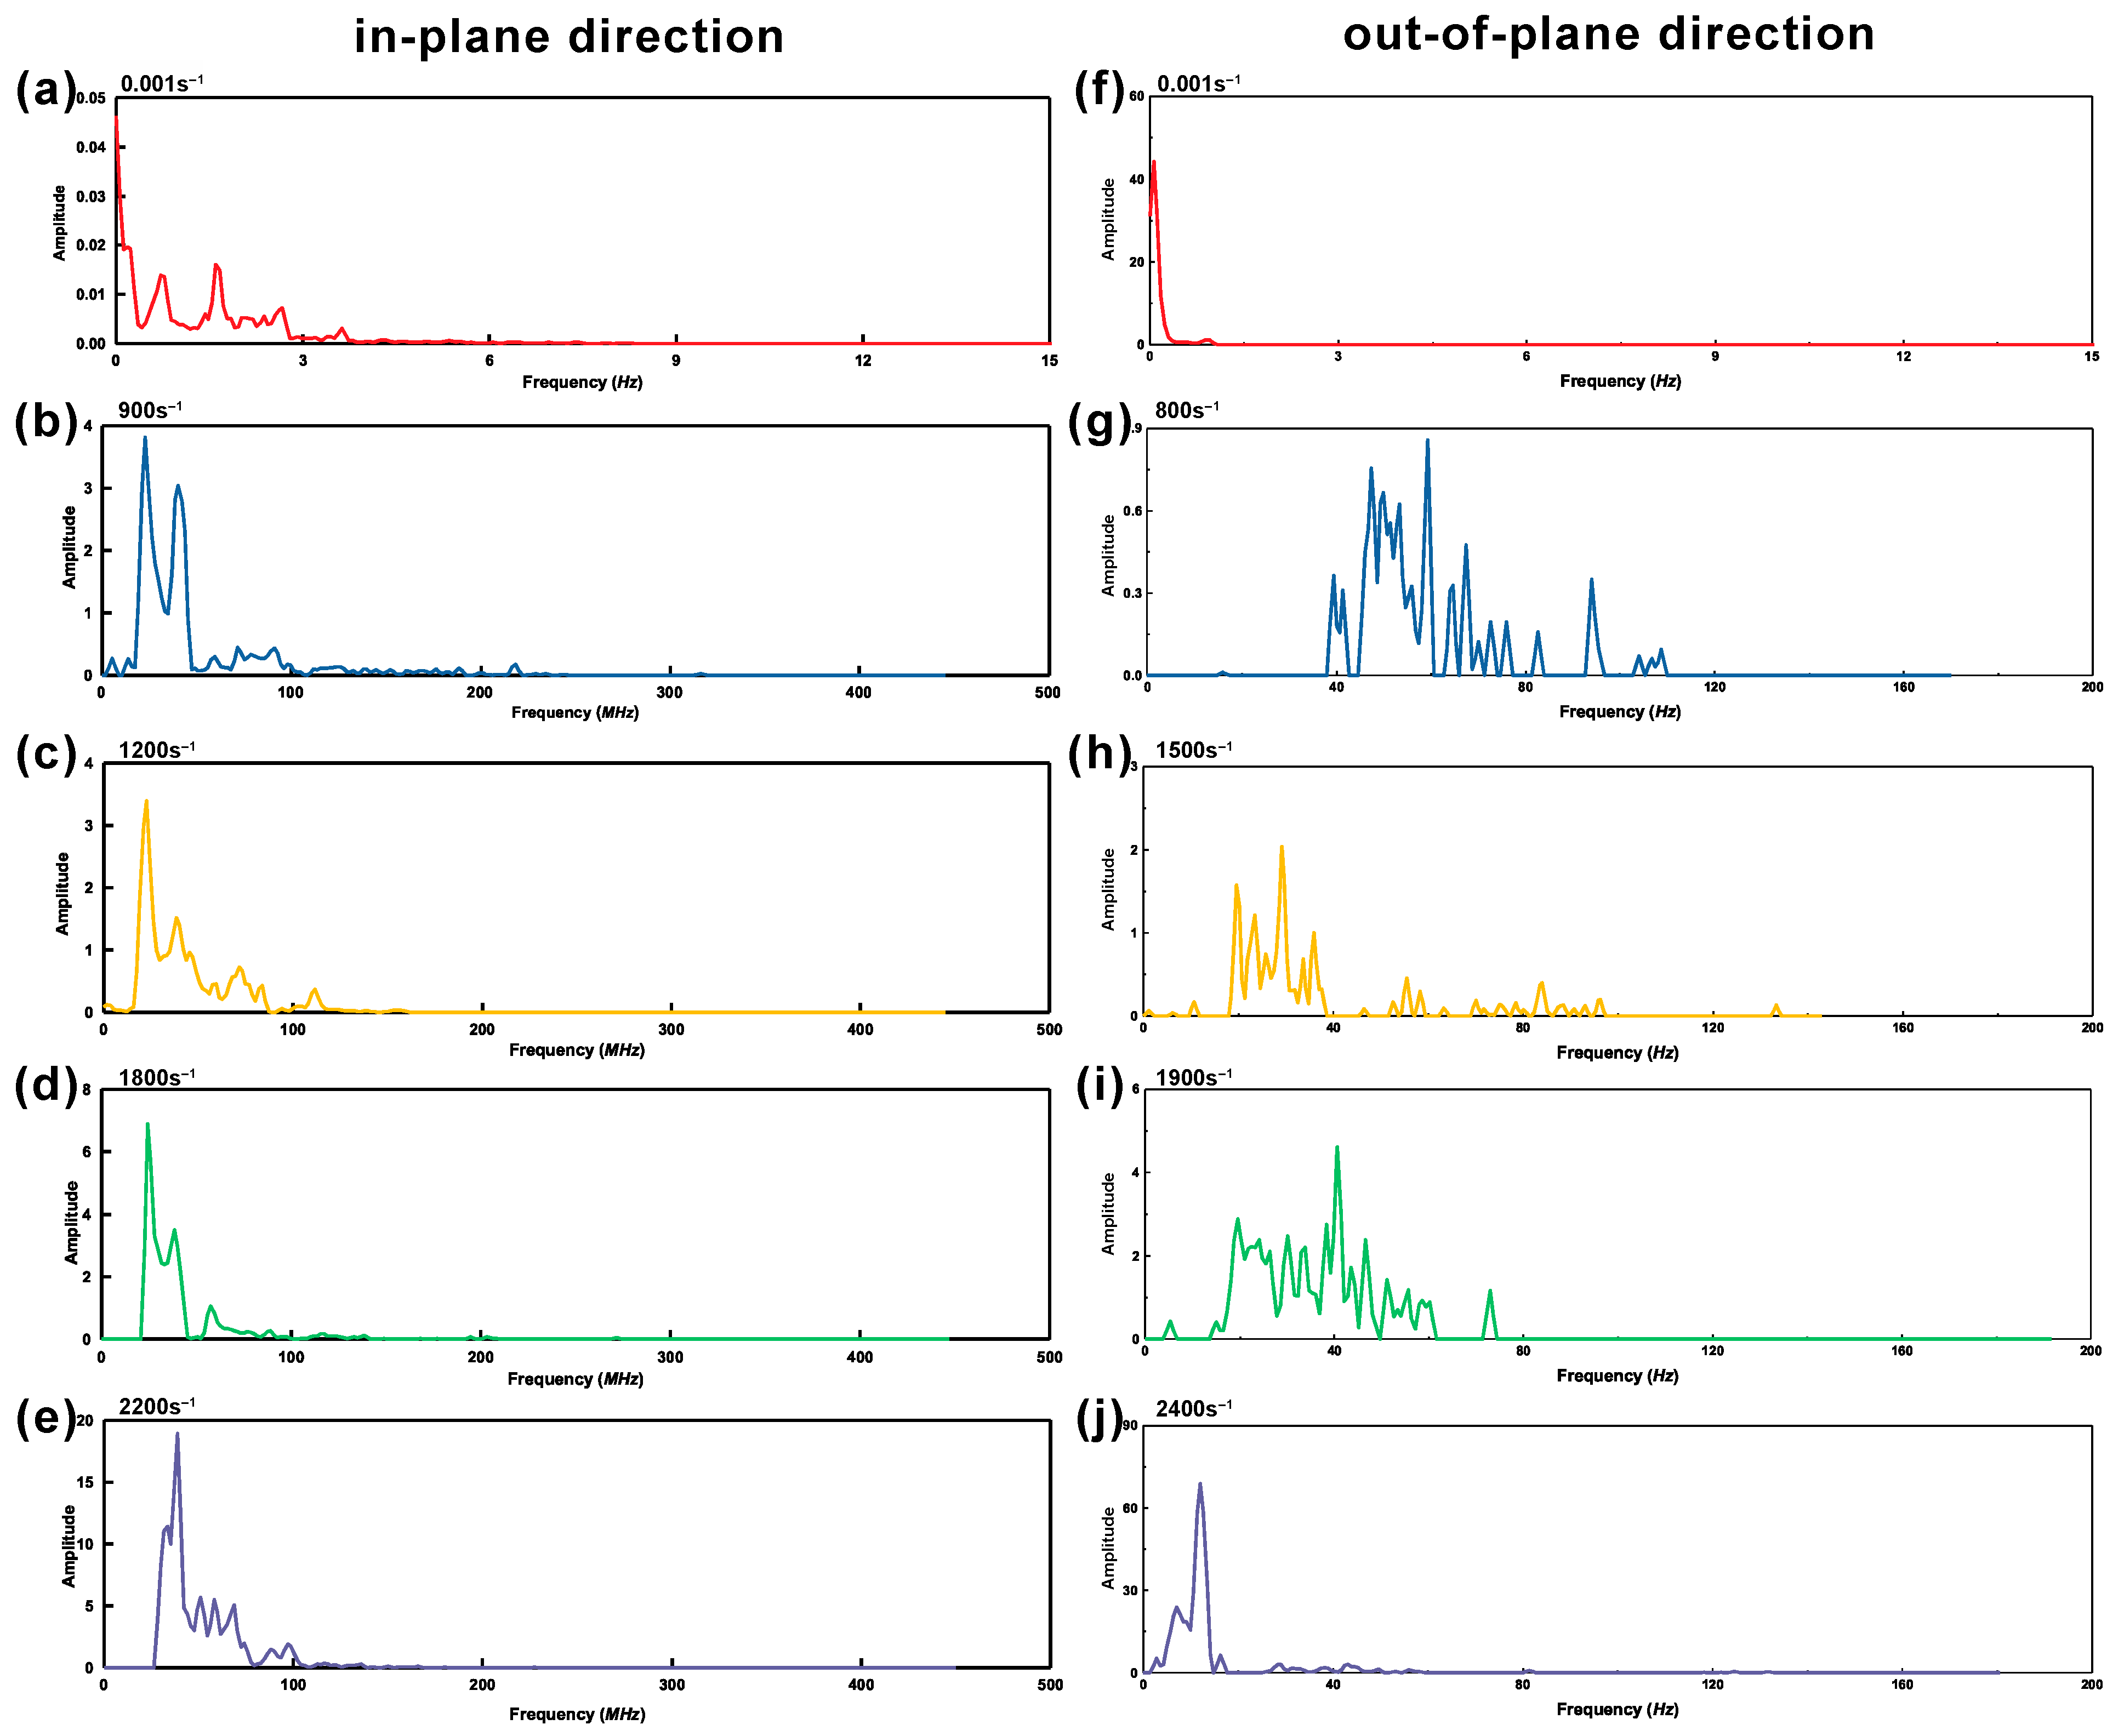
Figure 9 is the marginal Hilbert spectrum calculated from Equation (8), showing the total energy that each frequency value contributes. In this scenario, it shows the fractures of Cf-MWCNT/SiC composites in the frequency–domain.
In the in-plane direction, a quasi-static test shown in Figure 9a, the amplitude (Y-axia) has a fluctuation after the specimen failed at low frequency (0–0.5 Hz), whereas no such phenomenon was observed in the test along the out-plane direction (Figure 9f). It illustrates the compression failure of Cf-MWCNT/SiC composites is dominated by the crack of SiC matrix in the out-of-plane direction.
Marginal Hilbert spectrums of Cf-MWCNT/SiC composites tested at high impact strain rates are significantly different from those of quasi-static tests, see Figure 9b–e,g–j. The peaks indicating failures generally have their frequencies higher than 20 MHz, and the frequency amplitude increases with the strain rate. In spectrums tested in the in-plane direction, peaks are in a narrow frequency range, between 20 MHz to 40 MHz. In contrast, in spectrums of the out-of-plane direction tests, peaks are widely separated from 20 MHz to 100 MHz. Also, peaks shift from high to low frequency, which demonstrates the Cf-MWCNT/SiC composites in out-of-plane direction has a high sensitivity to strain rate and thus failed in different fracture modes at varied strain rate. However, this behavior was not observed in the in-plane direction.
3.5. Correlation between Sample Fractures and Frequency Analysis Results
In order to correlate the marginal Hilbert spectrum with fractures existing in samples, we characterized the fracture morphologies and mapped the amplitude of the spectrum (see Figure 10).
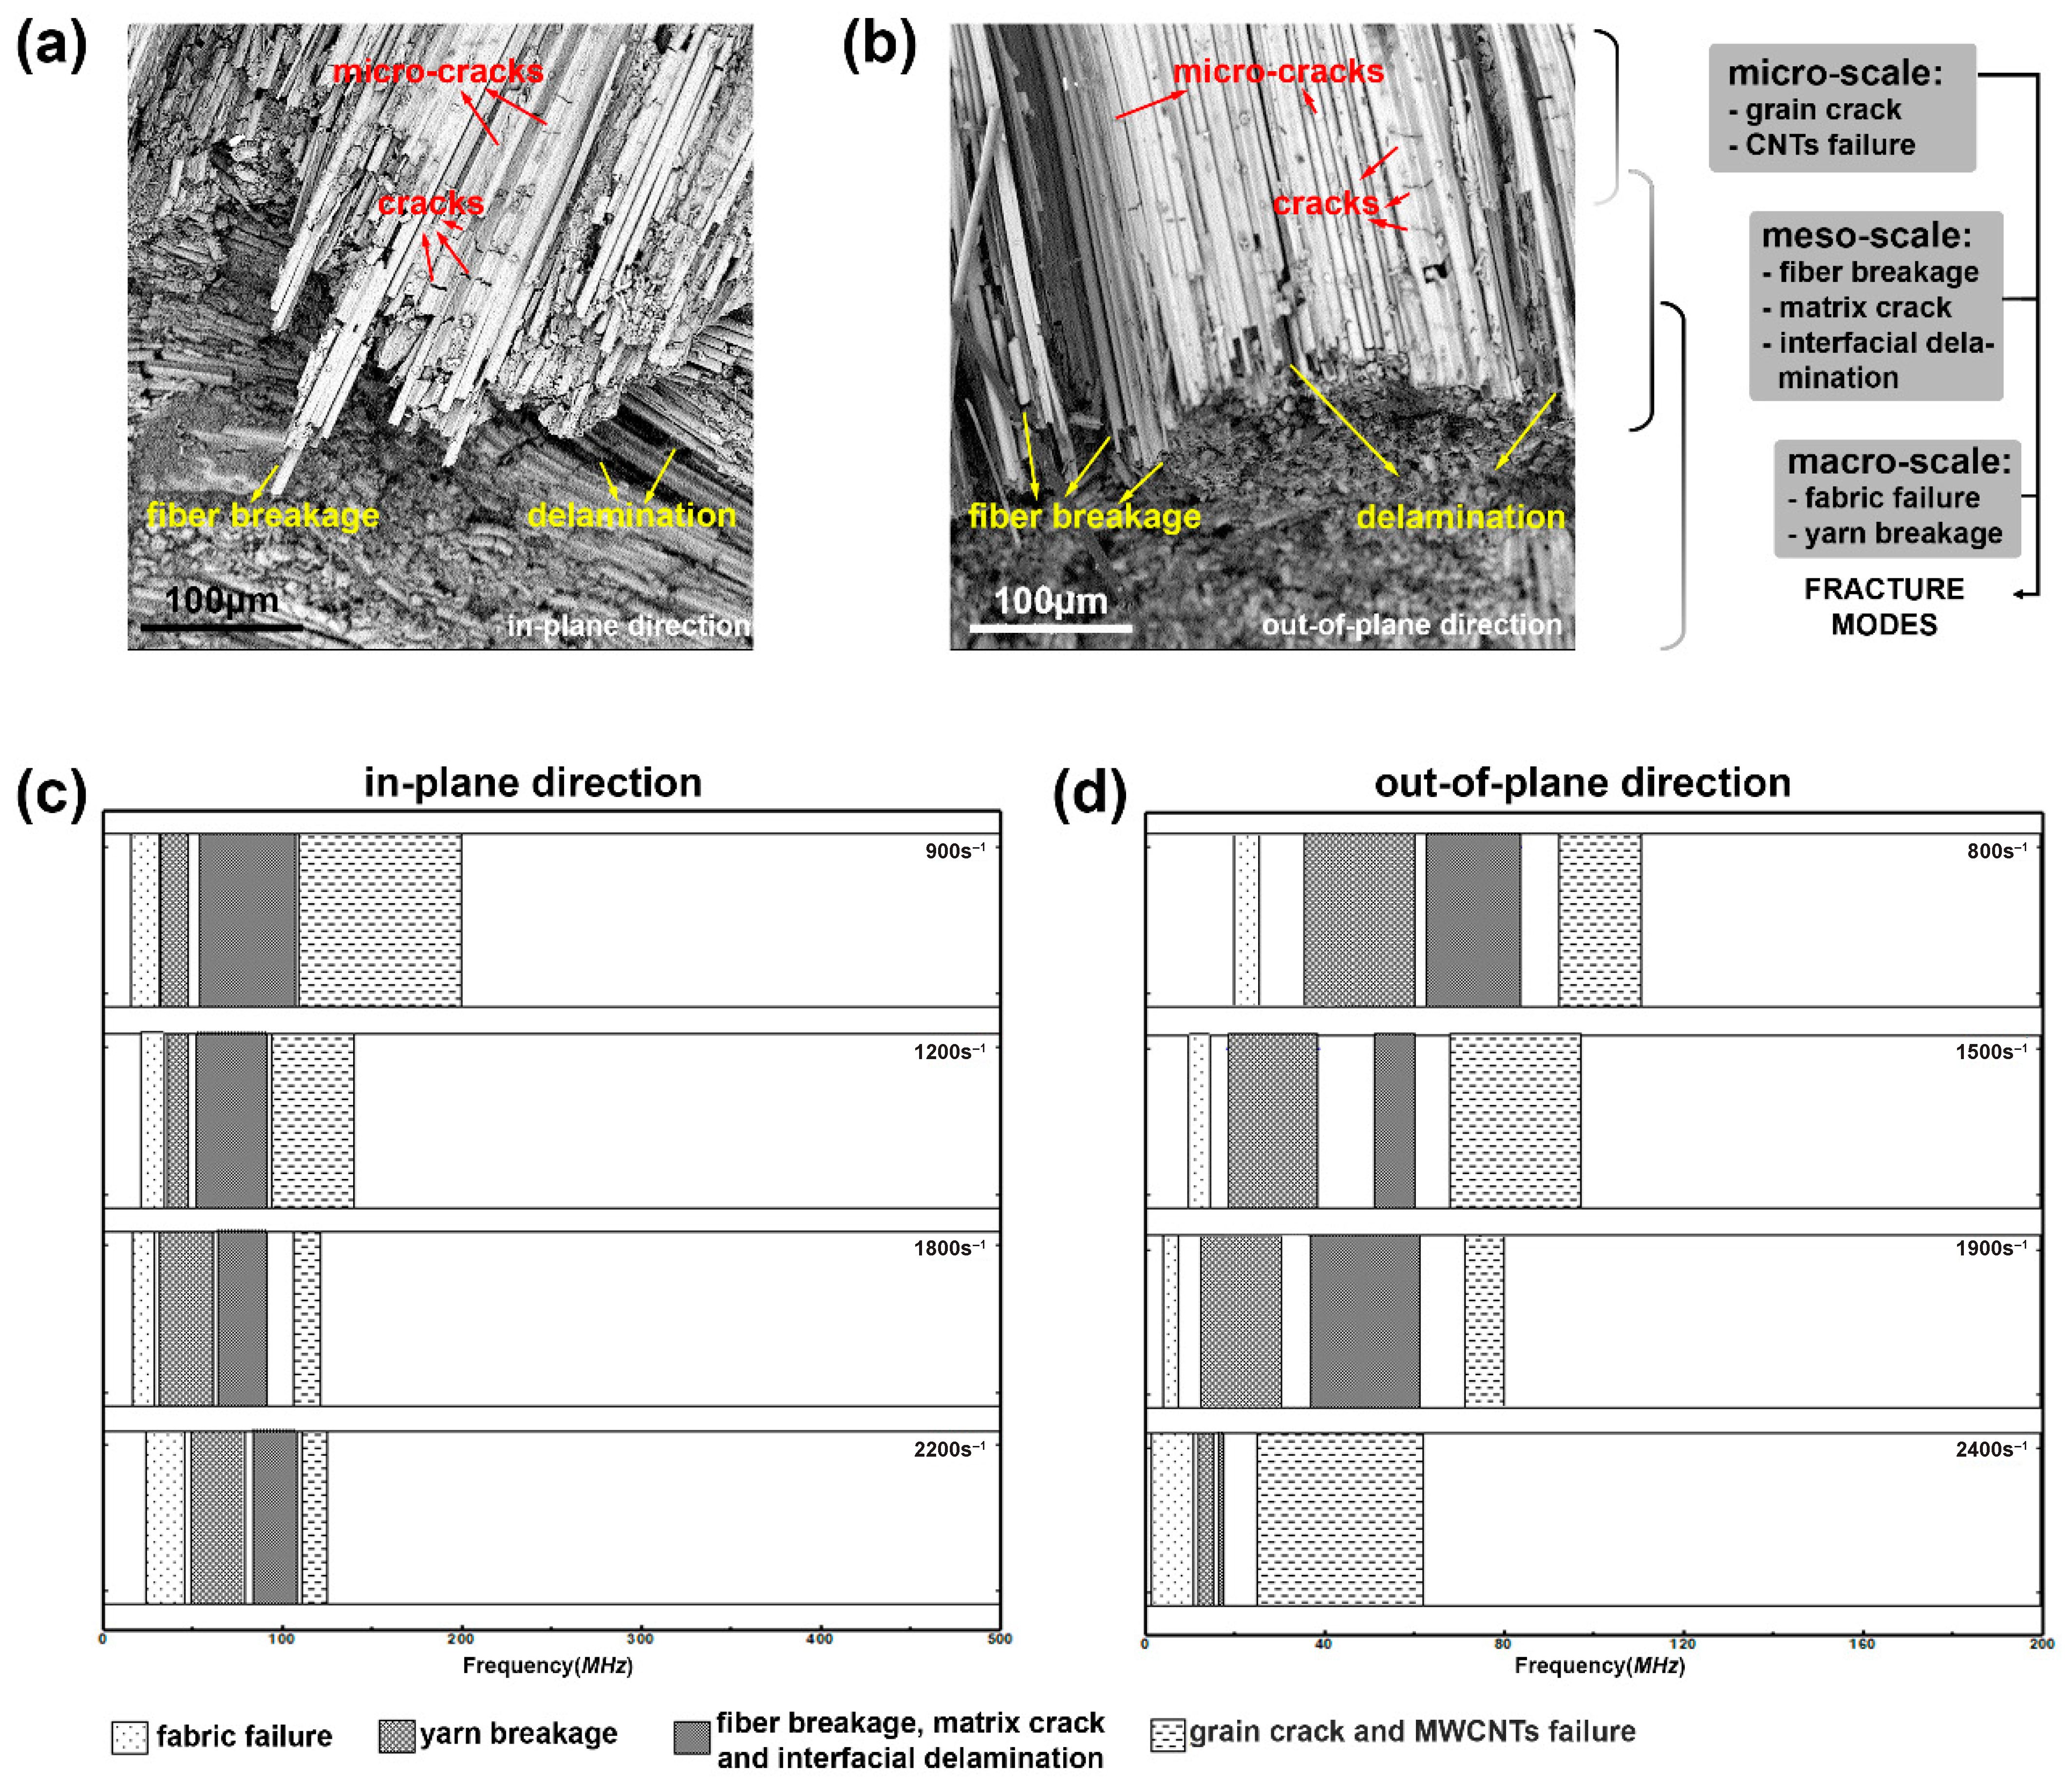
The compression force striking the Cf-MWCNT/SiC composite specimen in the in-plane direction caused the fibers to break into short pieces and the fabric stack to collapse, as shown in Figure 10a. In contrast, when sample was compressed in the out-of-plane direction, delamination occurred at interfaces between the fiber and the matrix, and carbon fiber bundles broke, forming a neat cutting edge. In this scenario, all individual filaments in the yarn length direction simultaneously resisted compression force. This results in a higher compressive stress in out-of-plane direction, which aligns well with the stress–strain results (Figure 6). In Figure 10a,b, fractures observed in composites can be categorized into three different scale levels. Small cracks and breakages of the mixture of SiC grain and MWCNTs are small-scale fractures (nm-um). Fiber breakages, matrix cracks, and interfacial delamination are at the mesoscale level (um-mm), which greatly affects the strength of the composites. In addition, fabric and yarn (fiber bundle) breakages are the largest damage among all scale levels, which are an extensive failure at the macroscale level (mm-m) and are initiated from small-scale fractures.
Fractures and deformations in each scale level have different responsive frequencies [36,37,38,39], which however are not constant for each strain rate. A detailed frequency distribution was obtained through a simplification of marginal Hilbert spectrum. Figure 10c,d shows the responsive frequency distributions for high strain rate compressions. The fractures observed from SEM images are divided into four failure modes, including fabric failure, yarn breakage, mesoscale fracture, and microscale damage. Different failure modes have specific frequency bands. For example, the frequency bands of fabric failure, yarn breakage, mesoscale fracture, and microscale damage in Figure 10c correspond to frequency bands 20–30 MHz, 30–50 MHz, 50–110 MHz, and 110–200 MHz, respectively. The correlation of frequency band and failure mode is a crucial tool for future improving high-speed resistant capacity through optimizing the multiscale structure of Cf-MWCNT/SiC composite. The possible approaches to enhance the mechanical response against high strain rate impact include increasing fiber volume fraction and optimizing the length and density of MWCNTs. Moreover, it is found while the strain rate increases, the frequency bands corresponding to different fracture modes become narrow in both the in-plane and out-of-plane directions.
4. Discussion
4.1. Influence of Strain Rate on Mechanical Response of Cf-MWCNT/SiC Composites
As the results described before, Cf-MWCNT/SiC composites have a high strain rate sensitivity. The impact strengths in the in-plane and out-of-plane direction obviously increase with the strain rates. For toughness or elasticity, it was found that the composites failed at a higher strain when the testing strain rate increased. In contrast, the out-of-plane compression properties tested at high strain rates show a similar failure strain as that observed in quasi-static test. The finding here is important for future engineering and applications of Cf-MWCNT/SiC composites, since the materials might be used at different strain conditions, and they need to be characterized at the desired strain level.
4.2. Anisotropic Mechanical Properties
Based on the fracture morphological analysis, it was observed that the fracture features are apparently different. Samples impacted along the in-plane direction show condensed damage morphology. The Cf-MWCNT/SiC sample impacted in the in-plane direction showed the fibers breaking into short pieces and the fabric stack collapsing. In contrast, when a sample was impacted in the out-of-plane direction, delamination between the fiber and the matrix occurred, and carbon fiber bundles broke forming a neat cutting edge.
This distinctive behavior stems from the structural arrangement of the fabric reinforcement, where fibers are aligned in an orthogonal pattern that highly determines the distribution of stresses and fracture mechanisms.
4.3. Correlation between Frequency–Time Analysis and Fractures
The work demonstrates the utilization of signal processing techniques (HHT) to convert the original impact results into frequency spectrum that can correlate with Cf-MWCNT/SiC composites fracture behavior (mechanism and scales). This method will serve as a useful tool to identify composite material’s dynamic fracture behavior, offering information related to the fraction evolution over time. In addition, this new frequency analysis method can help us to optimize the composites’ design and structure to improve their mechanical properties against potential force scenarios, e.g., high-speed impact. The parameters that can be tailored are in all scale levels of composites, such as fiber volume fractions, interface between reinforcement and matric, and size and arrangement of reinforcements.
It is important to highlight that the frequency classification presented in Figure 10 serves as a qualitative overview of the frequency distribution in response to varying strain rates. The presence of overlapping frequencies and post-fracture noise can potentially influence the interpretation of Figure 10. In forthcoming research, our focus will shift towards employing machine learning algorithms to conduct a comprehensive frequency spectrum analysis, which is expected to yield more insights into fracture classification.
5. Conclusions
In this study, we used multiscale reinforcement-MWCNTs coated carbon fabrics to toughen ceramic matrix. In addition, we characterized the mechanical response of the composites under high strain rate impact that tend to occur during those types of composites’ application in aerospace and armor devices. More importantly, this paper demonstrates a new approach to analyzing the original high speed impact results via HHT, converting the force-time-deformation signal into frequency spectrum that can identify the fracture size, mode, and evolution over time. We summarize the key findings of this study as follows:
- The Cf-MWCNT/SiC composites performed differently under the quasi-static and high-strain rate compression. The ultimate stress of the materials increases when testing strain rates increase.
- The Cf-MWCNT/SiC composites show anisotropic mechanical properties, which stem from the yarn arrangement in the woven fabrics. Therefore, the stress, toughness, and failure behavior are different between samples tested in the in-plane direction and out-of-plane direction.
- The testing results of Cf-MWCNT/SiC composites compressed at quasi-static and high strain rates can be converted into a frequency–time spectrum and marginal Hilbert spectrum via HHT. These spectrum results can effectively identify composite material’s dynamic fracture behavior, offering information related to the fraction evolution over time.
Author Contributions
Conceptualization, K.L.; methodology, K.L. and C.M.; software, K.L.; validation, K.L. and C.M.; formal analysis, K.L. and C.M.; investigation, K.L., X.F. and C.M.; resources, K.L., X.F. and J.L.; writing—original draft preparation, K.L.; writing—review and editing, K.L., X.F. and C.M.; visualization, K.L., X.F. and C.M.; supervision, K.L. and J.L.; project administration, K.L. and J.L.; funding acquisition, K.L. and J.L. All authors have read and agreed to the published version of the manuscript.
Funding
This research was funded by the National Natural Science Foundation of China (No. 11602281), and the Innovation Foundation of Shanghai Institute of Ceramics, Chinese Academy of Sciences (No. Y51ZC11).
Institutional Review Board Statement
Not applicable.
Informed Consent Statement
Not applicable.
Data Availability Statement
All data are available in the main text.
Acknowledgments
Authors of this paper gratefully thank the supports of Structural Ceramics Engineering Research Center of Shanghai Institute of Ceramics of Chinese Academy of Sciences, Shanghai, China and Dynamic Strength Laboratory for Textile Structure Composites of Donghua University, Shanghai, China. We also thank Wei Zhang at Donghua University and Jianbao Hu at Shanghai Institute of Ceramics for their assistances of sample preparation and testing.
Conflicts of Interest
The authors declare no conflict of interest.
References
- Ge, X.; Liu, X.; Hou, C.; Lu, H.; Tang, F.; Meng, X.; Xu, W.; Song, X. Distinguishing contributions of ceramic matrix and binder metal to the plasticity of nanocrystalline cermets. IUCrJ 2020, 7, 42–48. [Google Scholar] [CrossRef]
- Luan, K.; Gu, B. Energy absorption of three-dimensional angle-interlock woven composite under ballistic penetration based on a multi-scale finite element model. Int. J. Damage Mech. 2015, 24, 3–20. [Google Scholar] [CrossRef]
- Luan, K.; Sun, B.; Gu, B. Ballistic impact damages of 3-D angle-interlock woven composites based on high strain rate constitutive equation of fiber tows. Int. J. Impact Eng. 2013, 57, 145–158. [Google Scholar] [CrossRef]
- Ming, C.; Yang, T.; Luan, K.; Chen, L.; Wang, L.; Zeng, J.; Li, Y.; Zhang, W.; Chen, L.-Q. Microstructural effects on effective piezoelectric responses of textured PMN-PT ceramics. Acta Mater. 2018, 145, 62–70. [Google Scholar] [CrossRef]
- Sun, J.; Yu, S.; Wade-Zhu, J.; Chen, X.; Binner, J.; Bai, J. 3D printing of layered ceramic/carbon fiber composite with improved toughness. Addit. Manuf. 2022, 50, 102543. [Google Scholar] [CrossRef]
- Clegg, W.J. Controlling Cracks in Ceramics. Science 1999, 286, 1097–1099. [Google Scholar] [CrossRef]
- Tredway, W.K. Toughened Ceramics. Science 1998, 282, 1275. [Google Scholar] [CrossRef]
- Taya, M.; Hayashi, S.; Kobayashi, A.S.; Yoon, H.S. Toughening of a Particulate-Reinforced Ceramic-Matrix Composite by Thermal Residual Stress. J. Am. Ceram. Soc. 1990, 73, 1382–1391. [Google Scholar] [CrossRef]
- Song, Y.; Liu, D.; Hu, S.; Song, X.; Cao, J. Graphene nanoplatelets reinforced AgCuTi composite filler for brazing SiC ceramic. J. Eur. Ceram. Soc. 2019, 39, 696–704. [Google Scholar] [CrossRef]
- Ritchie, R.O. The conflicts between strength and toughness. Nat. Mater. 2011, 10, 817–822. [Google Scholar] [CrossRef]
- Cheng, T.; Wang, X.; Zhang, R.; Pei, Y.; Ai, S.; He, R.; Fang, D.; Yang, Y. Tensile properties of two-dimensional carbon fiber reinforced silicon carbide composites at temperatures up to 2300 °C. J. Eur. Ceram. Soc. 2020, 40, 630–635. [Google Scholar] [CrossRef]
- Giugliano, D.; Barbera, D.; Chen, H. Effect of fiber cross section geometry on cyclic plastic behavior of continuous fiber reinforced aluminum matrix composites. Eur. J. Mech.—A/Solids 2017, 61, 35–46. [Google Scholar] [CrossRef]
- Bekyarova, E.; Thostenson, E.T.; Yu, A.; Kim, H.; Gao, J.; Tang, J.; Hahn, H.T.; Chou, T.W.; Itkis, M.E.; Haddon, R.C. Multiscale Carbon Nanotube−Carbon Fiber Reinforcement for Advanced Epoxy Composites. Langmuir 2007, 23, 3970–3974. [Google Scholar] [CrossRef]
- Chou, T.-W.; Gao, L.; Thostenson, E.T.; Zhang, Z.; Byun, J.-H. An assessment of the science and technology of carbon nanotube-based fibers and composites. Compos. Sci. Technol. 2010, 70, 1–19. [Google Scholar] [CrossRef]
- Veedu, V.P.; Cao, A.; Li, X.; Ma, K.; Soldano, C.; Kar, S.; Ajayan, P.M.; Ghasemi-Nejhad, M.N. Multifunctional composites using reinforced laminae with carbon-nanotube forests. Nat. Mater. 2006, 5, 457–462. [Google Scholar] [CrossRef] [PubMed]
- Garcia, E.J.; Wardle, B.L.; John Hart, A. Joining prepreg composite interfaces with aligned carbon nanotubes. Compos. Part A: Appl. Sci. Manuf. 2008, 39, 1065–1070. [Google Scholar] [CrossRef]
- Kumar, R.S. Crack-growth resistance behavior of mode-I delamination in ceramic matrix composites. Acta Mater. 2017, 131, 511–522. [Google Scholar] [CrossRef]
- Papon, E.A.; Haque, A.; Mulani, S.B. Process optimization and stochastic modeling of void contents and mechanical properties in additively manufactured composites. Compos. Part B: Eng. 2019, 177, 107325. [Google Scholar] [CrossRef]
- Luan, K.; Liu, J.; Sun, B.; Zhang, W.; Hu, J.; Fang, X.; Ming, C.; Song, E. High strain rate compressive response of the Cf/SiC composite. Ceram. Int. 2019, 45, 6812–6818. [Google Scholar] [CrossRef]
- Gholizadeh, S. A review of non-destructive testing methods of composite materials. Procedia Struct. Integr. 2016, 1, 50–57. [Google Scholar] [CrossRef]
- Morscher, G.N.; Maxwell, R. Monitoring tensile fatigue crack growth and fiber failure around a notch in laminate SIC/SIC composites utilizing acoustic emission, electrical resistance, and digital image correlation. J. Eur. Ceram. Soc. 2019, 39, 229–239. [Google Scholar] [CrossRef]
- El Yagoubi, J.; Lamon, J.; Batsale, J.-C.; Le Flem, M. Experimental assessment of damage-thermal diffusivity relationship in unidirectional fibre-reinforced composite under axial tensile test. Acta Mater. 2019, 173, 302–312. [Google Scholar] [CrossRef]
- Sikorska, J.Z.; Mba, D. Challenges and obstacles in the application of acoustic emission to process machinery. Proc. Inst. Mech. Eng. Part E J. Process Mech. Eng. 2008, 222, 1–19. [Google Scholar] [CrossRef]
- Wu, Q.; Xu, W.; Zhang, L. Microstructure-based modelling of fracture of particulate reinforced metal matrix composites. Compos. Part B: Eng. 2019, 163, 384–392. [Google Scholar] [CrossRef]
- Dey, S.; Naskar, S.; Mukhopadhyay, T.; Gohs, U.; Spickenheuer, A.; Bittrich, L.; Sriramula, S.; Adhikari, S.; Heinrich, G. Uncertain natural frequency analysis of composite plates including effect of noise—A polynomial neural network approach. Compos. Struct. 2016, 143, 130–142. [Google Scholar] [CrossRef]
- Zhao, G.; Wang, B.; Wang, T.; Hao, W.; Luo, Y. Detection and monitoring of delamination in composite laminates using ultrasonic guided wave. Compos. Struct. 2019, 225, 111161. [Google Scholar] [CrossRef]
- Huang, N.E.; Wu, Z. A review on Hilbert-Huang transform: Method and its applications to geophysical studies. Rev. Geophys. 2008, 46, 2007RG000228RG2006. [Google Scholar] [CrossRef]
- Huang, N.E. Hilbert-Huang Transform and Its Applications; World Scientific: Singapore, 2014; Volume 16. [Google Scholar]
- Siracusano, G.; Lamonaca, F.; Tomasello, R.; Garescì, F.; Corte, A.L.; Carnì, D.L.; Carpentieri, M.; Grimaldi, D.; Finocchio, G. A framework for the damage evaluation of acoustic emission signals through Hilbert-Huang transform. Mech. Syst. Signal Process. 2016, 75, 109–122. [Google Scholar] [CrossRef]
- Merainani, B.; Benazzouz, D.; Rahmoune, C. Early detection of tooth crack damage in gearbox using empirical wavelet transform combined by Hilbert transform. J. Vib. Control. 2017, 23, 1623–1634. [Google Scholar] [CrossRef]
- Hu, J.; Dong, S.; Wu, B.; Zhang, X.; Zhou, H.; Wang, Z.; Kan, Y. Tailoring Carbon Fiber/Carbon Nanotubes Interface to Optimize Mechanical Properties of Cf-CNTs/SiC Composites. Int. J. Appl. Ceram. Technol. 2014, 11, 207–217. [Google Scholar] [CrossRef]
- Ravichandran, G.; Subhash, G. Critical Appraisal of Limiting Strain Rates for Compression Testing of Ceramics in a Split Hopkinson Pressure Bar. J. Am. Ceram. Soc. 1994, 77, 263–267. [Google Scholar] [CrossRef]
- Miao, Y.G. On loading ceramic-like materials using split Hopkinson pressure bar. Acta Mech. 2018, 229, 3437–3452. [Google Scholar] [CrossRef]
- Frew, D.J.; Forrestal, M.J.; Chen, W. Pulse shaping techniques for testing brittle materials with a split hopkinson pressure bar. Exp. Mech. 2002, 42, 93–106. [Google Scholar] [CrossRef]
- Wang, T.; Zhang, M.; Yu, Q.; Zhang, H. Comparing the applications of EMD and EEMD on time–frequency analysis of seismic signal. J. Appl. Geophys. 2012, 83, 29–34. [Google Scholar] [CrossRef]
- Zhang, J. Investigation of Relation between Fracture Scale and Acoustic Emission Time-Frequency Parameters in Rocks. Shock. Vib. 2018, 2018, 3057628. [Google Scholar] [CrossRef]
- de Groot, P.J.; Wijnen, P.A.M.; Janssen, R.B.F. Real-time frequency determination of acoustic emission for different fracture mechanisms in carbon/epoxy composites. Compos. Sci. Technol. 1995, 55, 405–412. [Google Scholar] [CrossRef]
- Du, K.; Li, X.; Tao, M.; Wang, S. Experimental study on acoustic emission (AE) characteristics and crack classification during rock fracture in several basic lab tests. Int. J. Rock Mech. Min. Sci. 2020, 133, 104411. [Google Scholar] [CrossRef]
- Hamdi, S.E.; Le Duff, A.; Simon, L.; Plantier, G.; Sourice, A.; Feuilloy, M. Acoustic emission pattern recognition approach based on Hilbert–Huang transform for structural health monitoring in polymer-composite materials. Appl. Acoust. 2013, 74, 746–757. [Google Scholar] [CrossRef]
Figure 1.
The structure and preparation of the Cf-MWCNT/SiC composites: (a) Woven fabric made of carbon yarns; (b) Pyrolytic SiC layer coated on the fabric; (c) Synthesizing MWCNTs on fabric surface; (d) Impregnate fabrics with phenolic resin; (e) PIP treatment; (f) SEM image of Cf-MWCNT/SiC composites at a micro-scale.
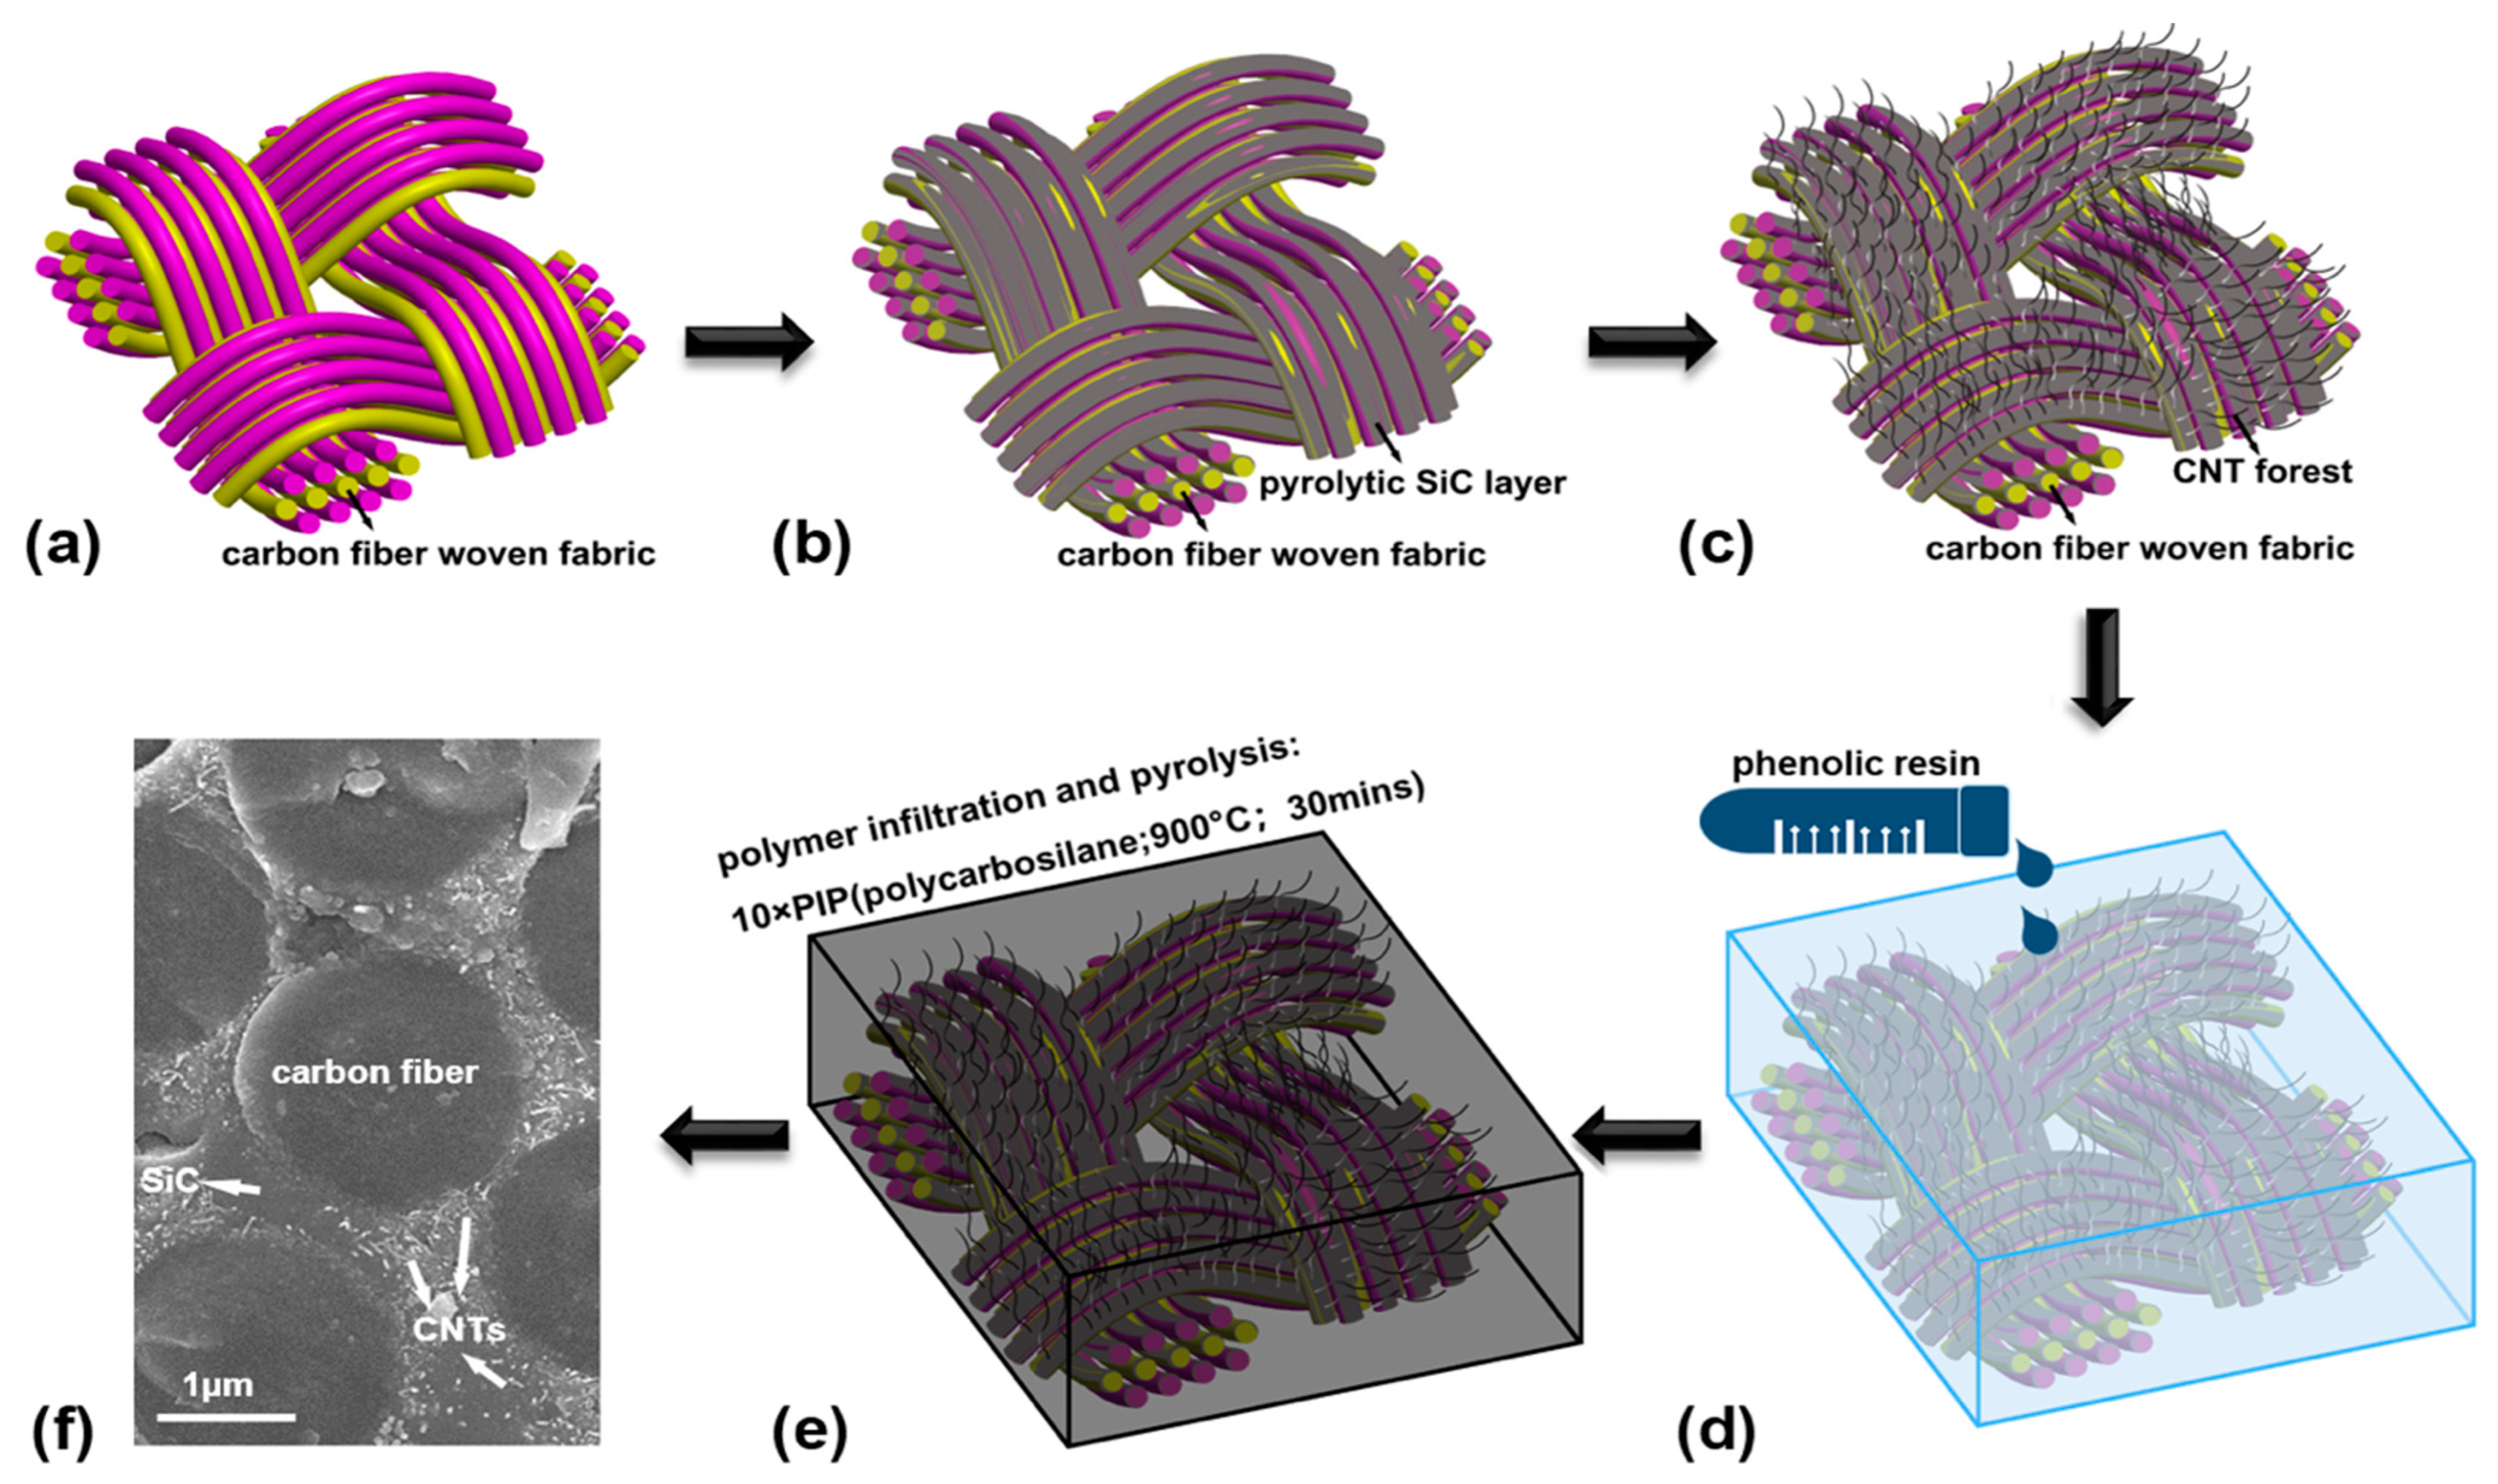
Figure 2.
Schematic illustration of strength and fracture behavior in terms of intrinsic (brown color text) versus extrinsic (black color text) toughening mechanisms.
Figure 2.
Schematic illustration of strength and fracture behavior in terms of intrinsic (brown color text) versus extrinsic (black color text) toughening mechanisms.

Figure 3.
Schematic illustration of the SHPB working principle.

Figure 4.
Typical input and output wave signals of Cf-MWCNT/SiC composites tested at the strain rate of 1500 s−1 in the out-of-plane direction.
Figure 4.
Typical input and output wave signals of Cf-MWCNT/SiC composites tested at the strain rate of 1500 s−1 in the out-of-plane direction.
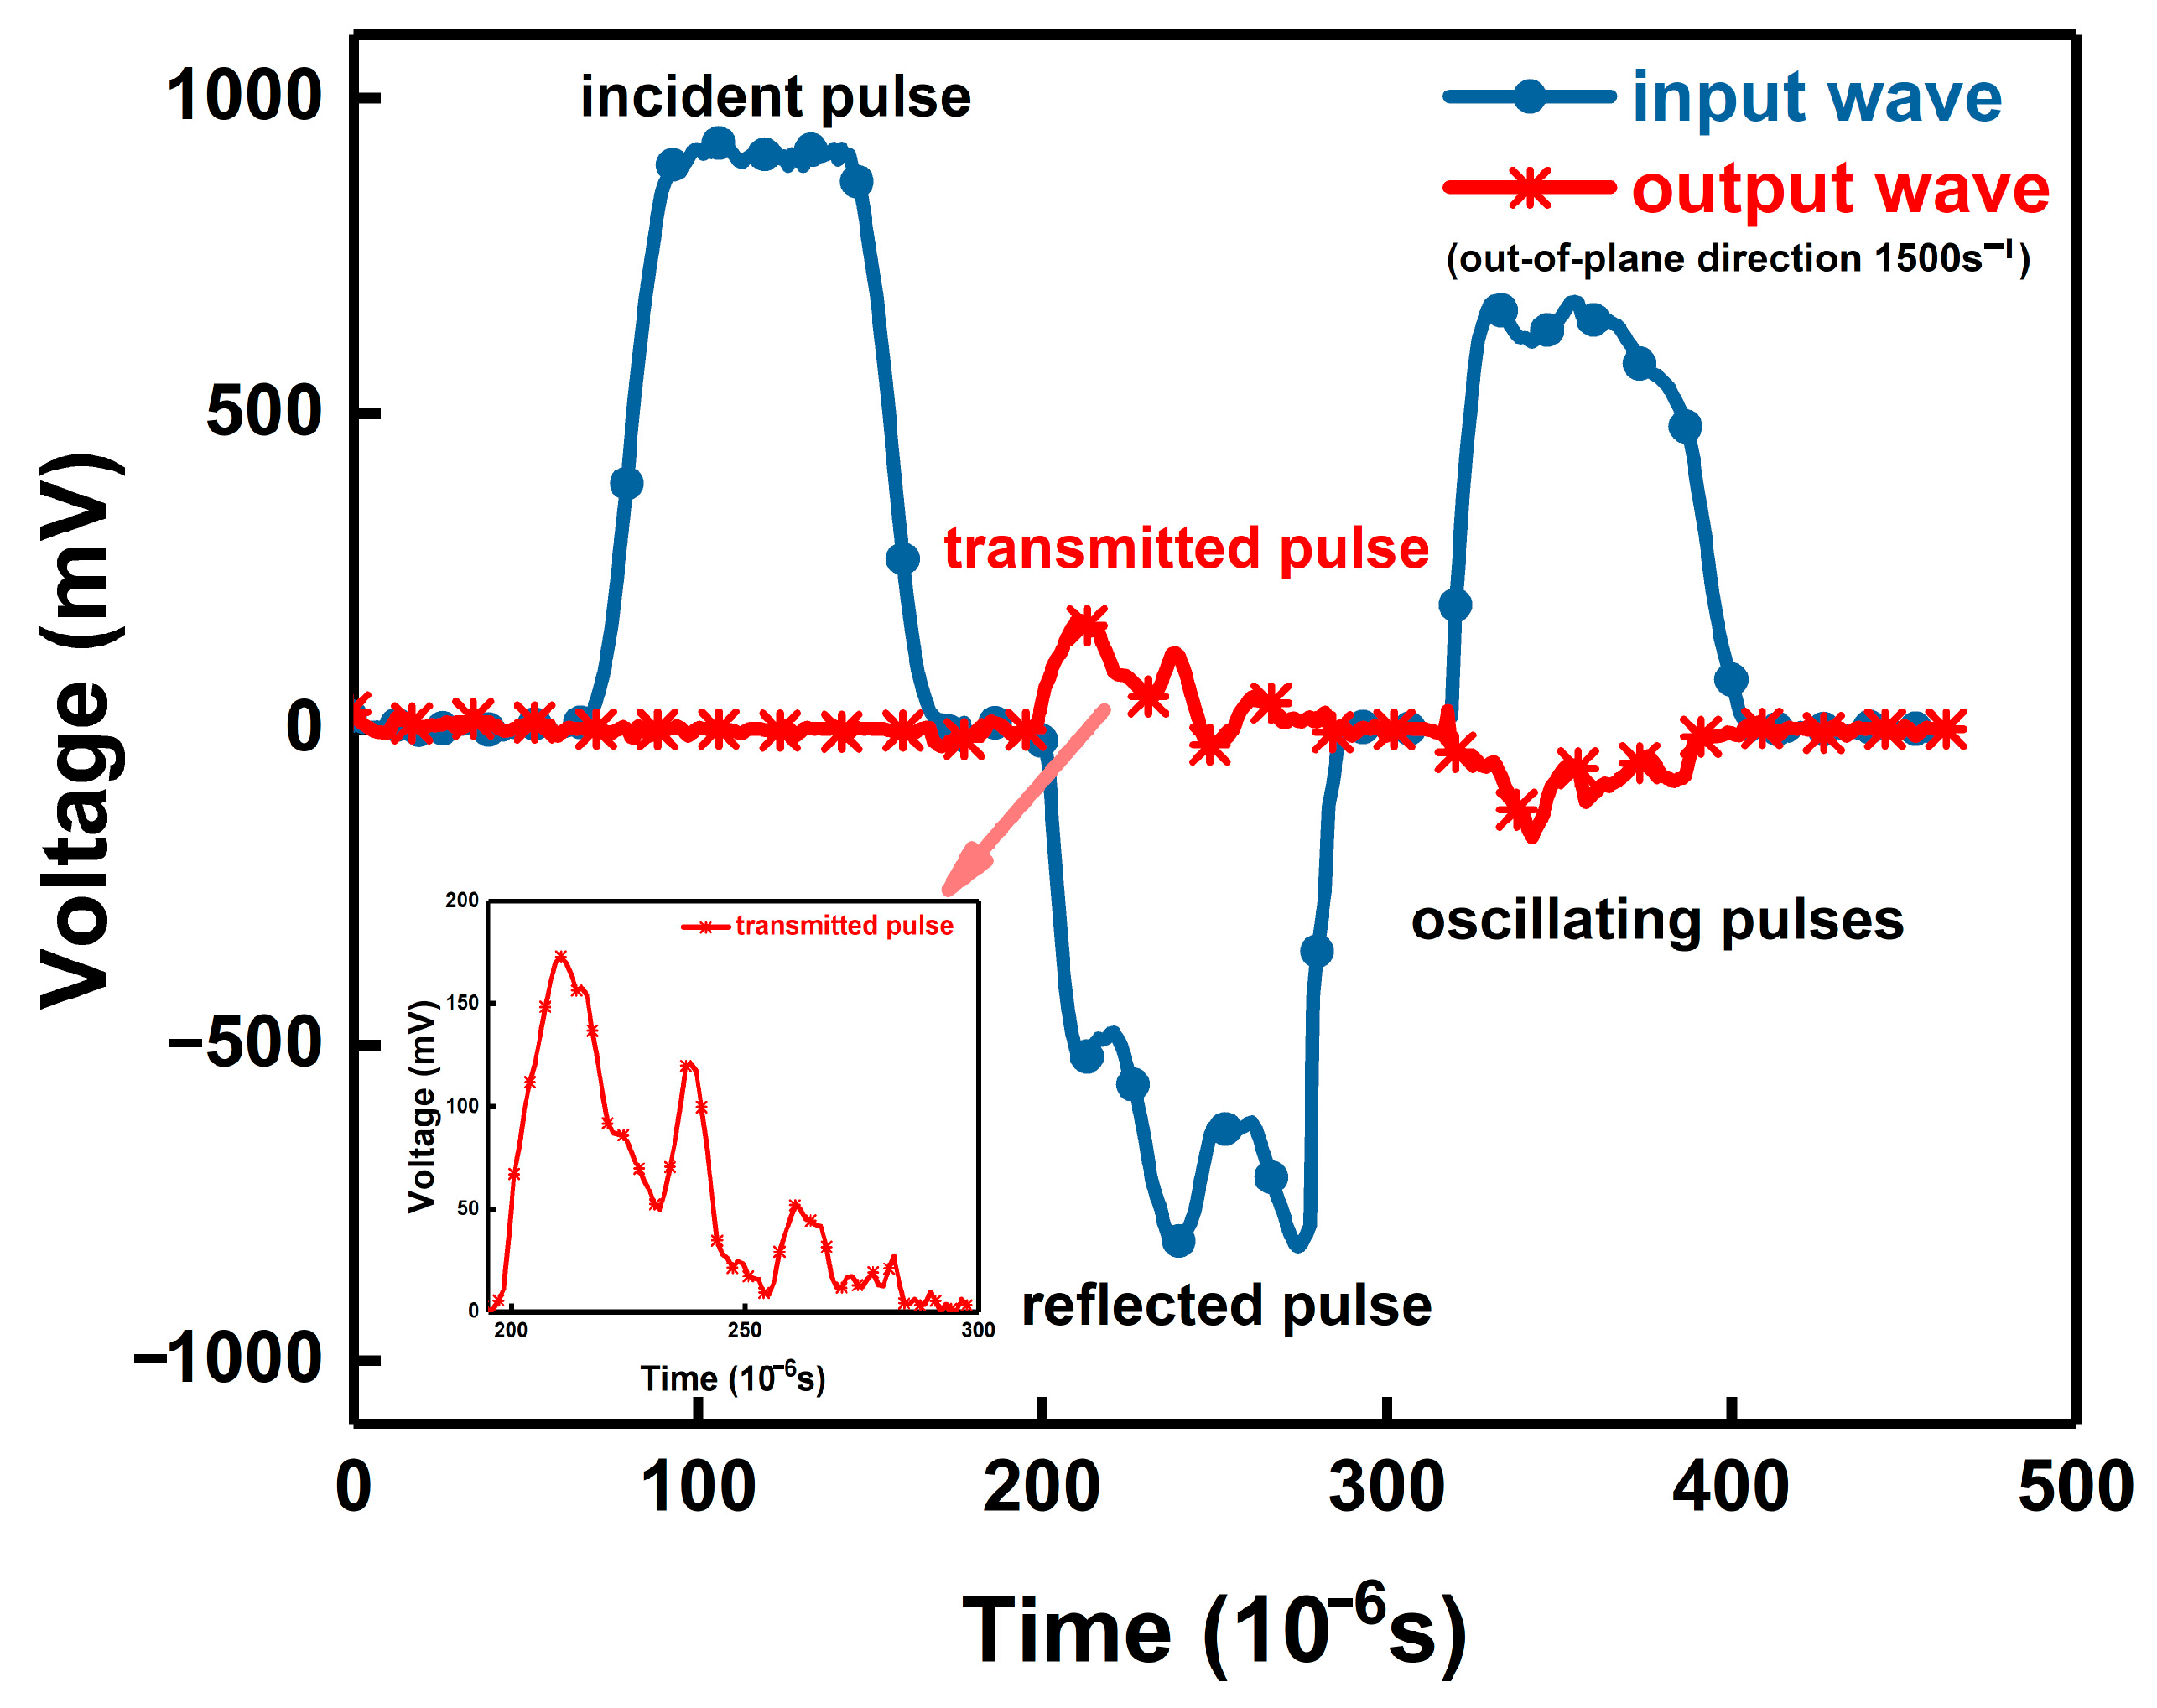
Figure 5.
Process of Hilbert–Huang transform †: (a) Original stress/voltage–time signal collected by the SHPB; (b) The ensemble empirical mode decomposition: breaking down the original signal with an envelope (brown dot lines) for obtaining a mean value (blue dot line) which stands for the intrinsic mode function at a certain frequency level; (c) IMFs (intrinsic mode functions); (d) Frequency–time spectrum; (e) Marginal spectrum integrated from Hilbert spectrum that shows frequency distribution of fracture modes. † Note: the curves in (a–c) are not real experimental data, which are only examples illustrating the procedure of data processing. Please find the experimental data in Section 3.2.

Figure 6.
Stress–strain curves of Cf-MWCNT/SiC composites tested at different impact strain rates in (a) in-plane direction; and (b) out-of-plane direction [19].
Figure 6.
Stress–strain curves of Cf-MWCNT/SiC composites tested at different impact strain rates in (a) in-plane direction; and (b) out-of-plane direction [19].
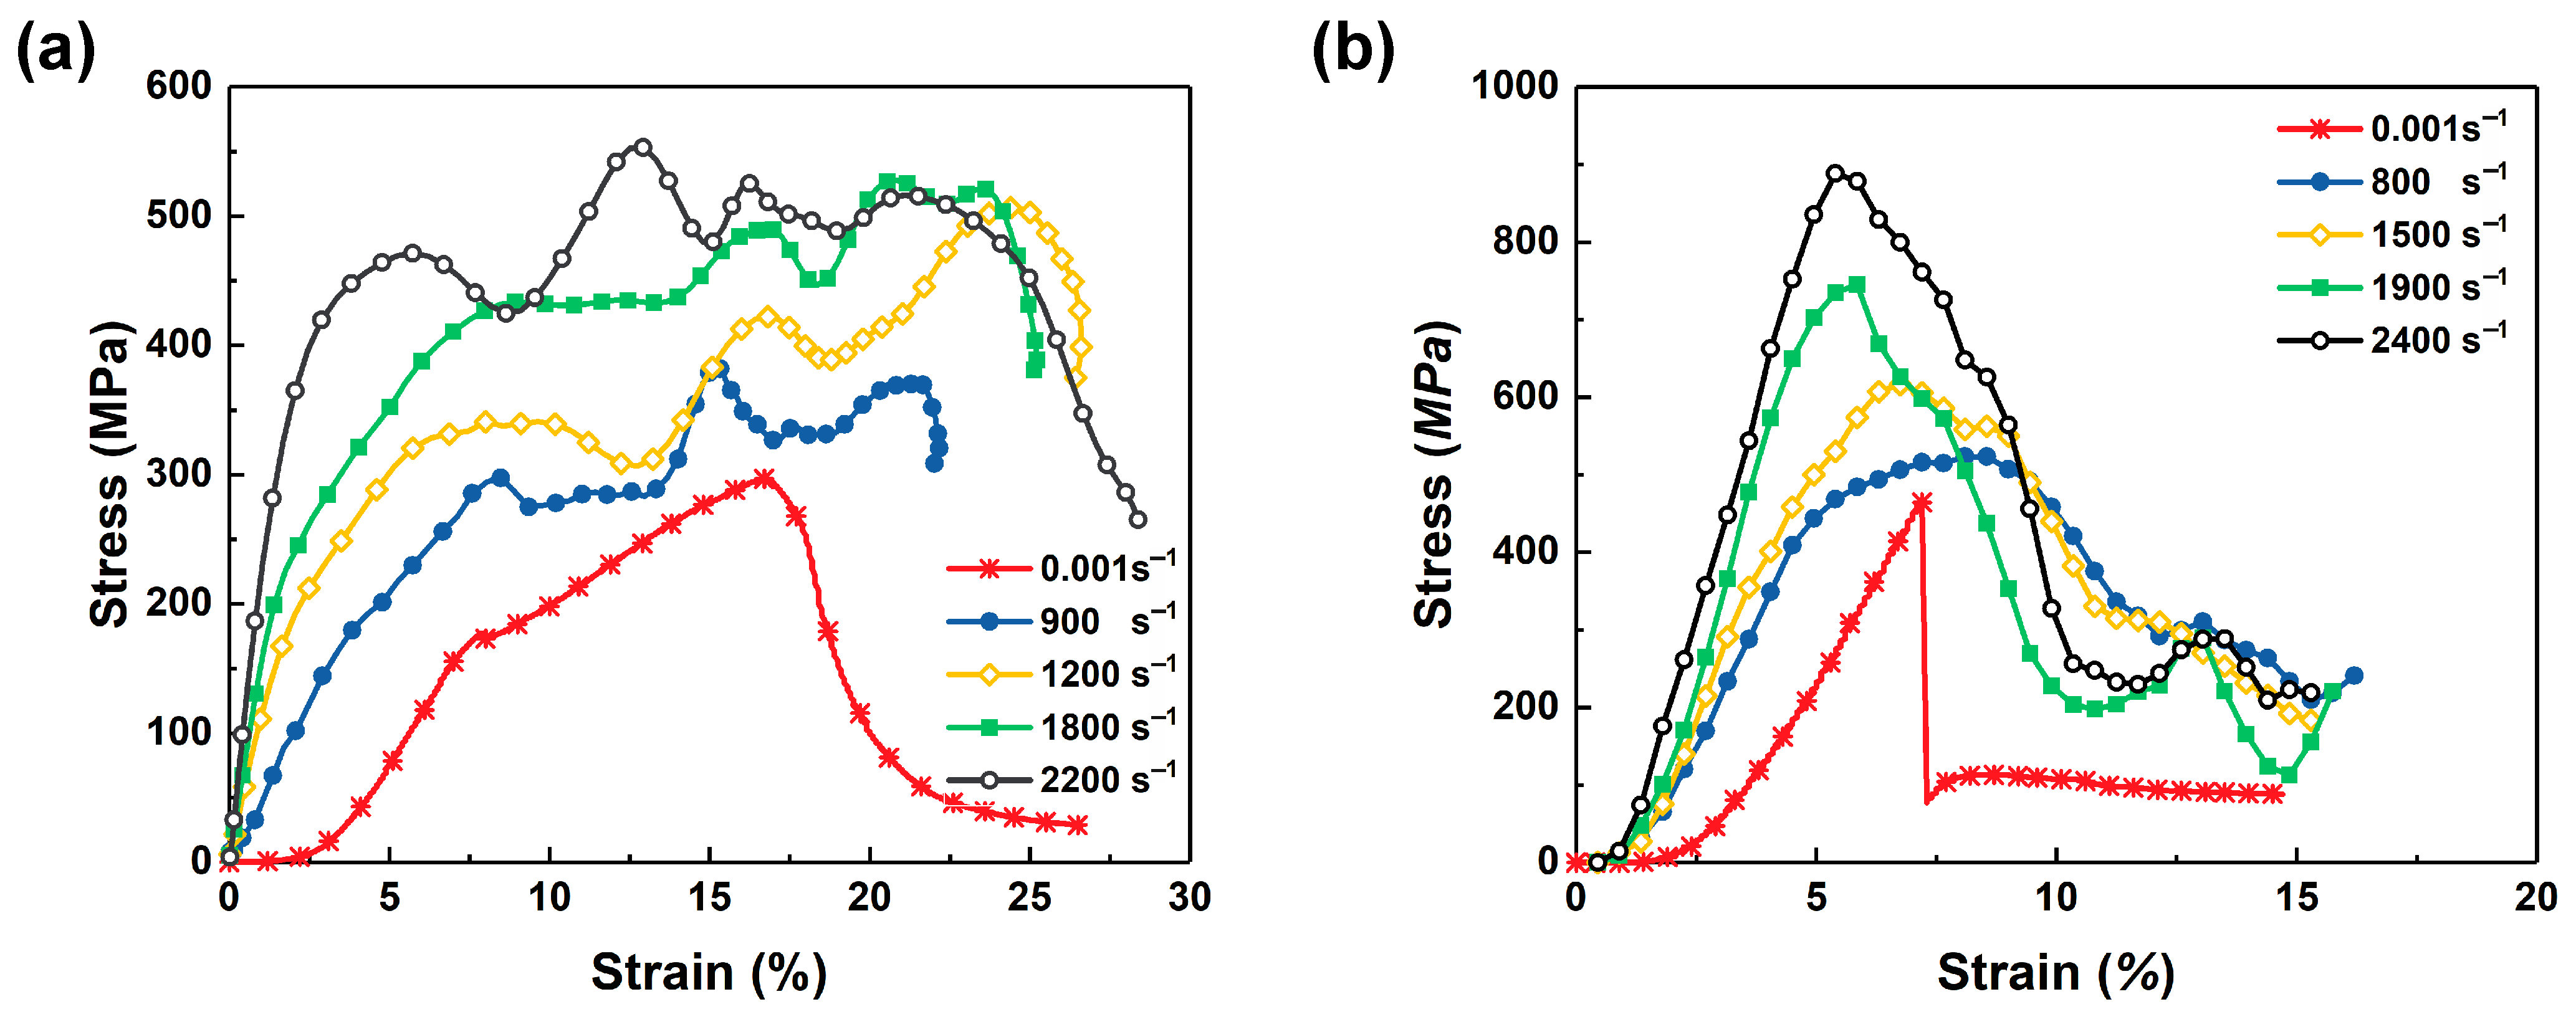
Figure 7.
IMFs of the Cf-MWCNT/SiC composites tested at different impact strain rates: (a–e) results in in-plane direction; (f–j) results in out-of-plane direction. The strain rate is labeled at the right bottom of each sub-figure.
Figure 7.
IMFs of the Cf-MWCNT/SiC composites tested at different impact strain rates: (a–e) results in in-plane direction; (f–j) results in out-of-plane direction. The strain rate is labeled at the right bottom of each sub-figure.
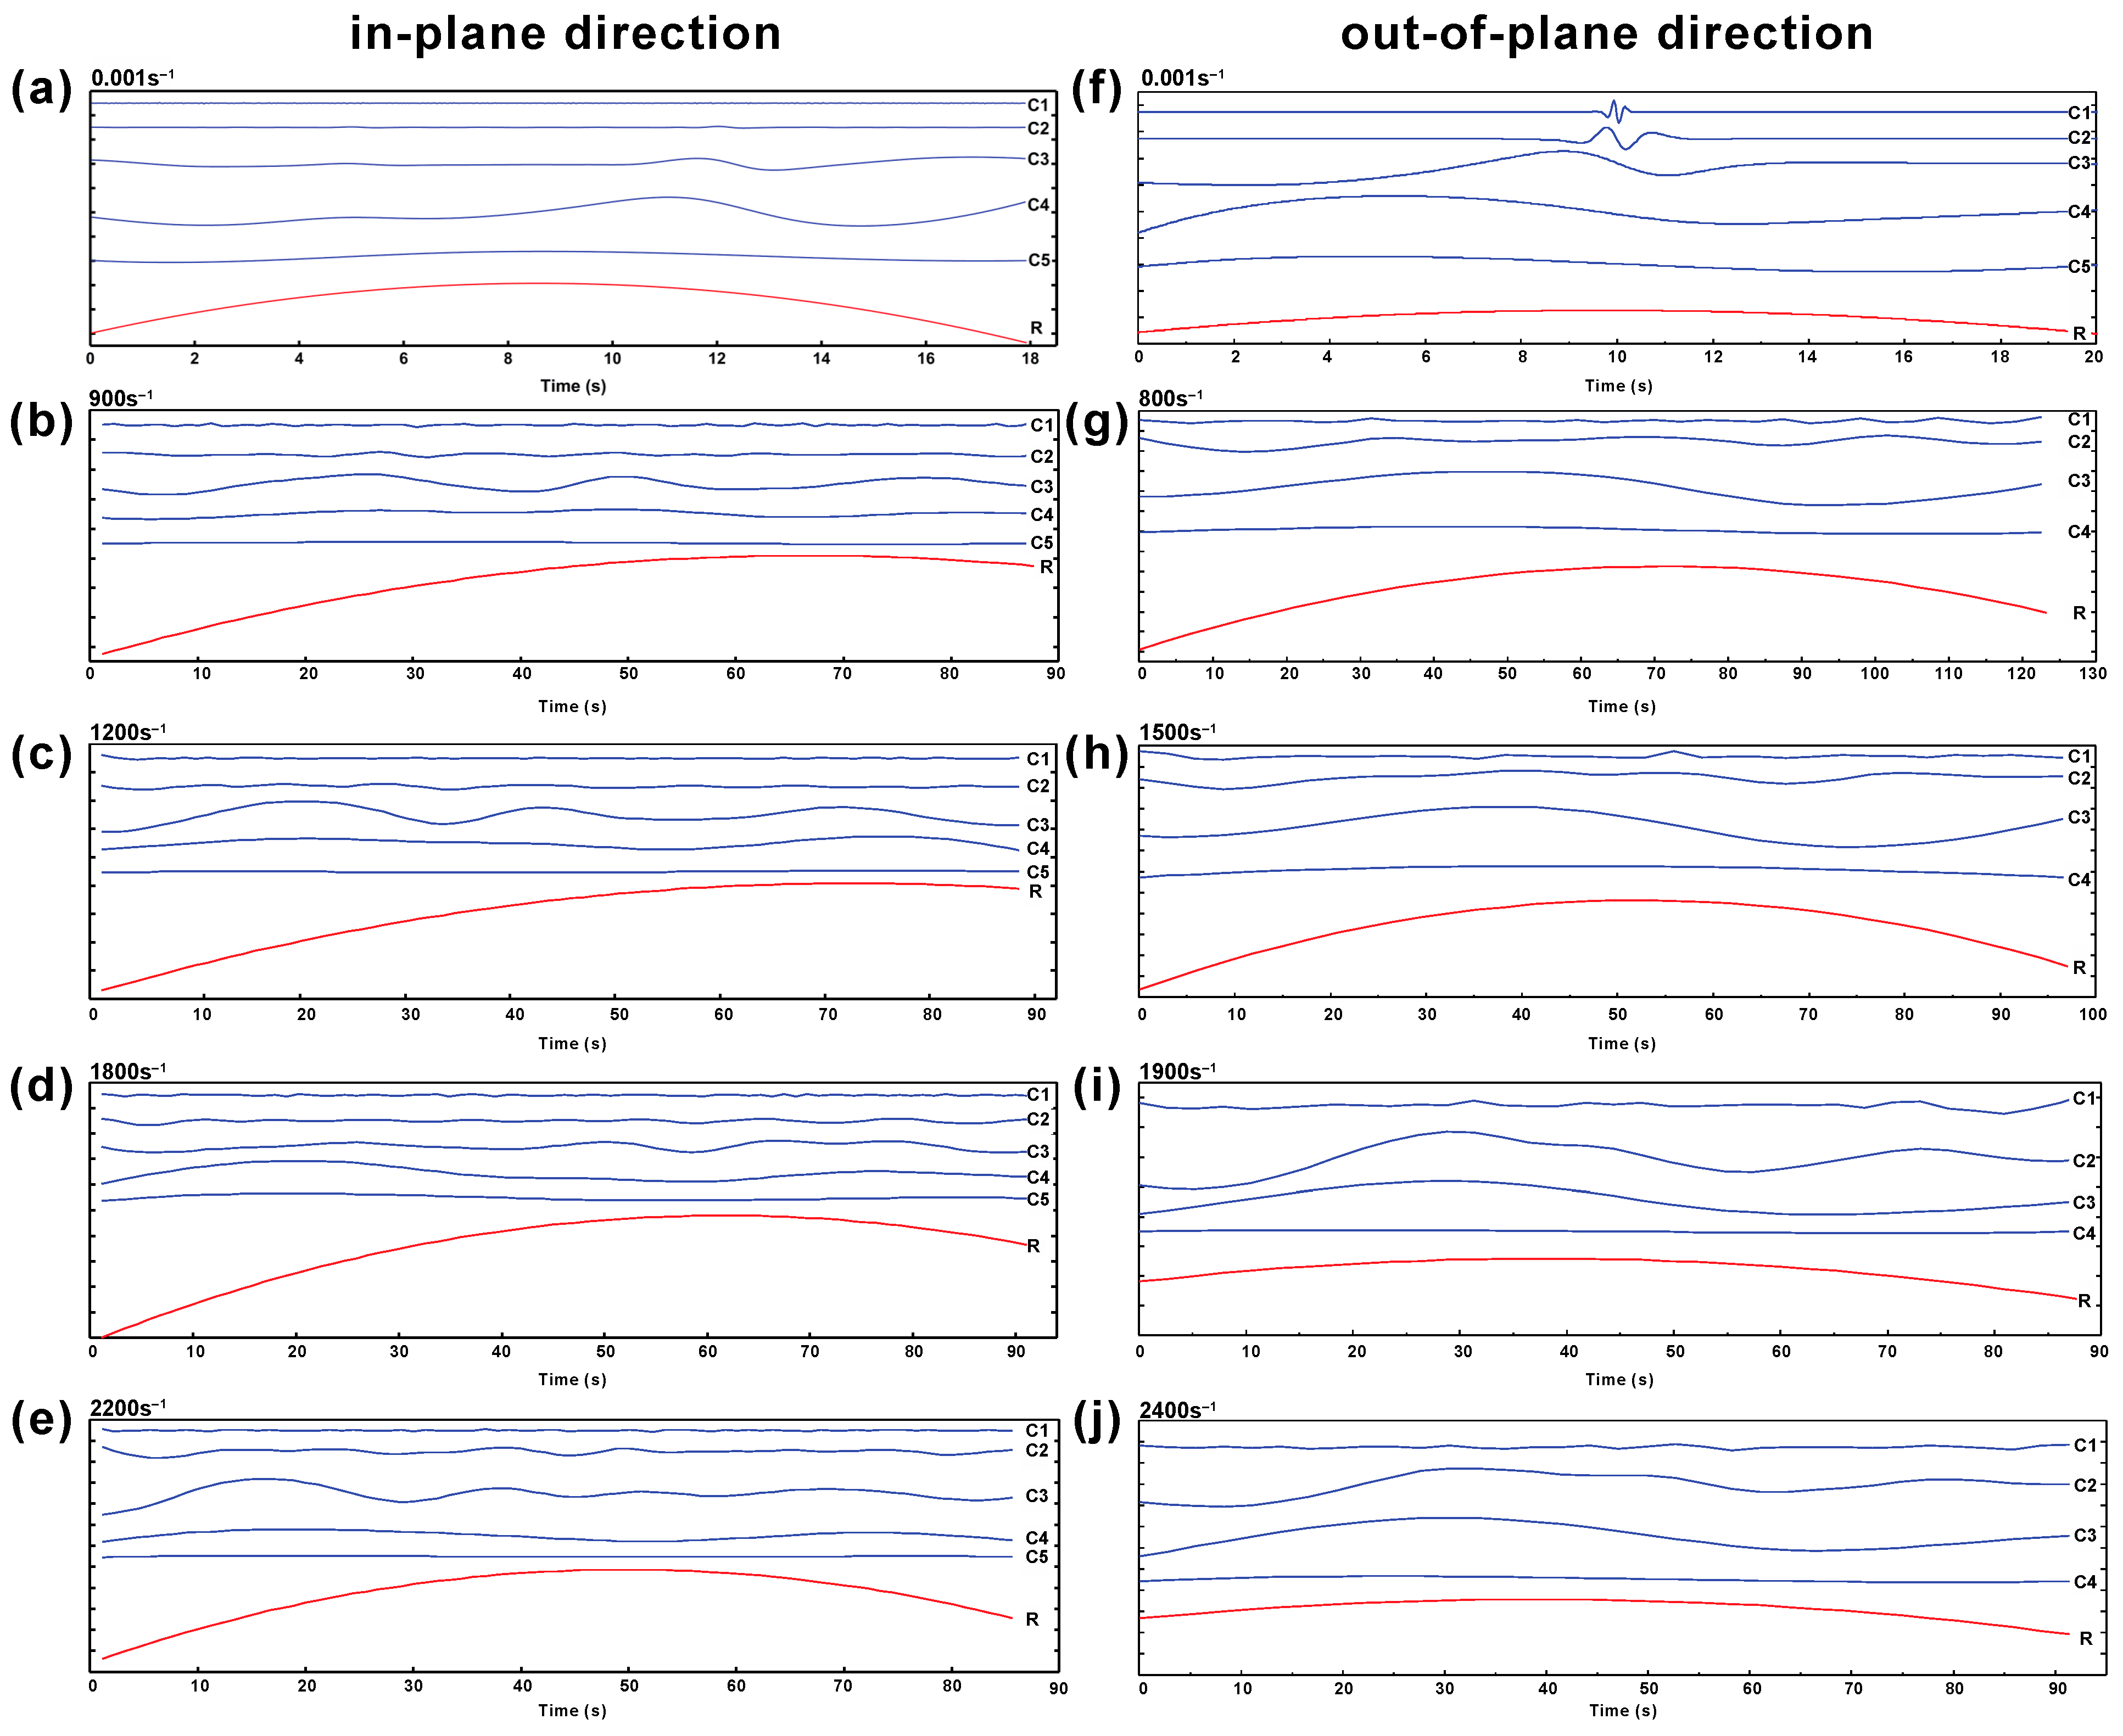
Figure 8.
Frequency–time spectrum of the Cf-MWCNT/SiC composites tested at different impact strain rates in (a–e) in-plane direction, and (f–j) out-of-plane direction.
Figure 8.
Frequency–time spectrum of the Cf-MWCNT/SiC composites tested at different impact strain rates in (a–e) in-plane direction, and (f–j) out-of-plane direction.
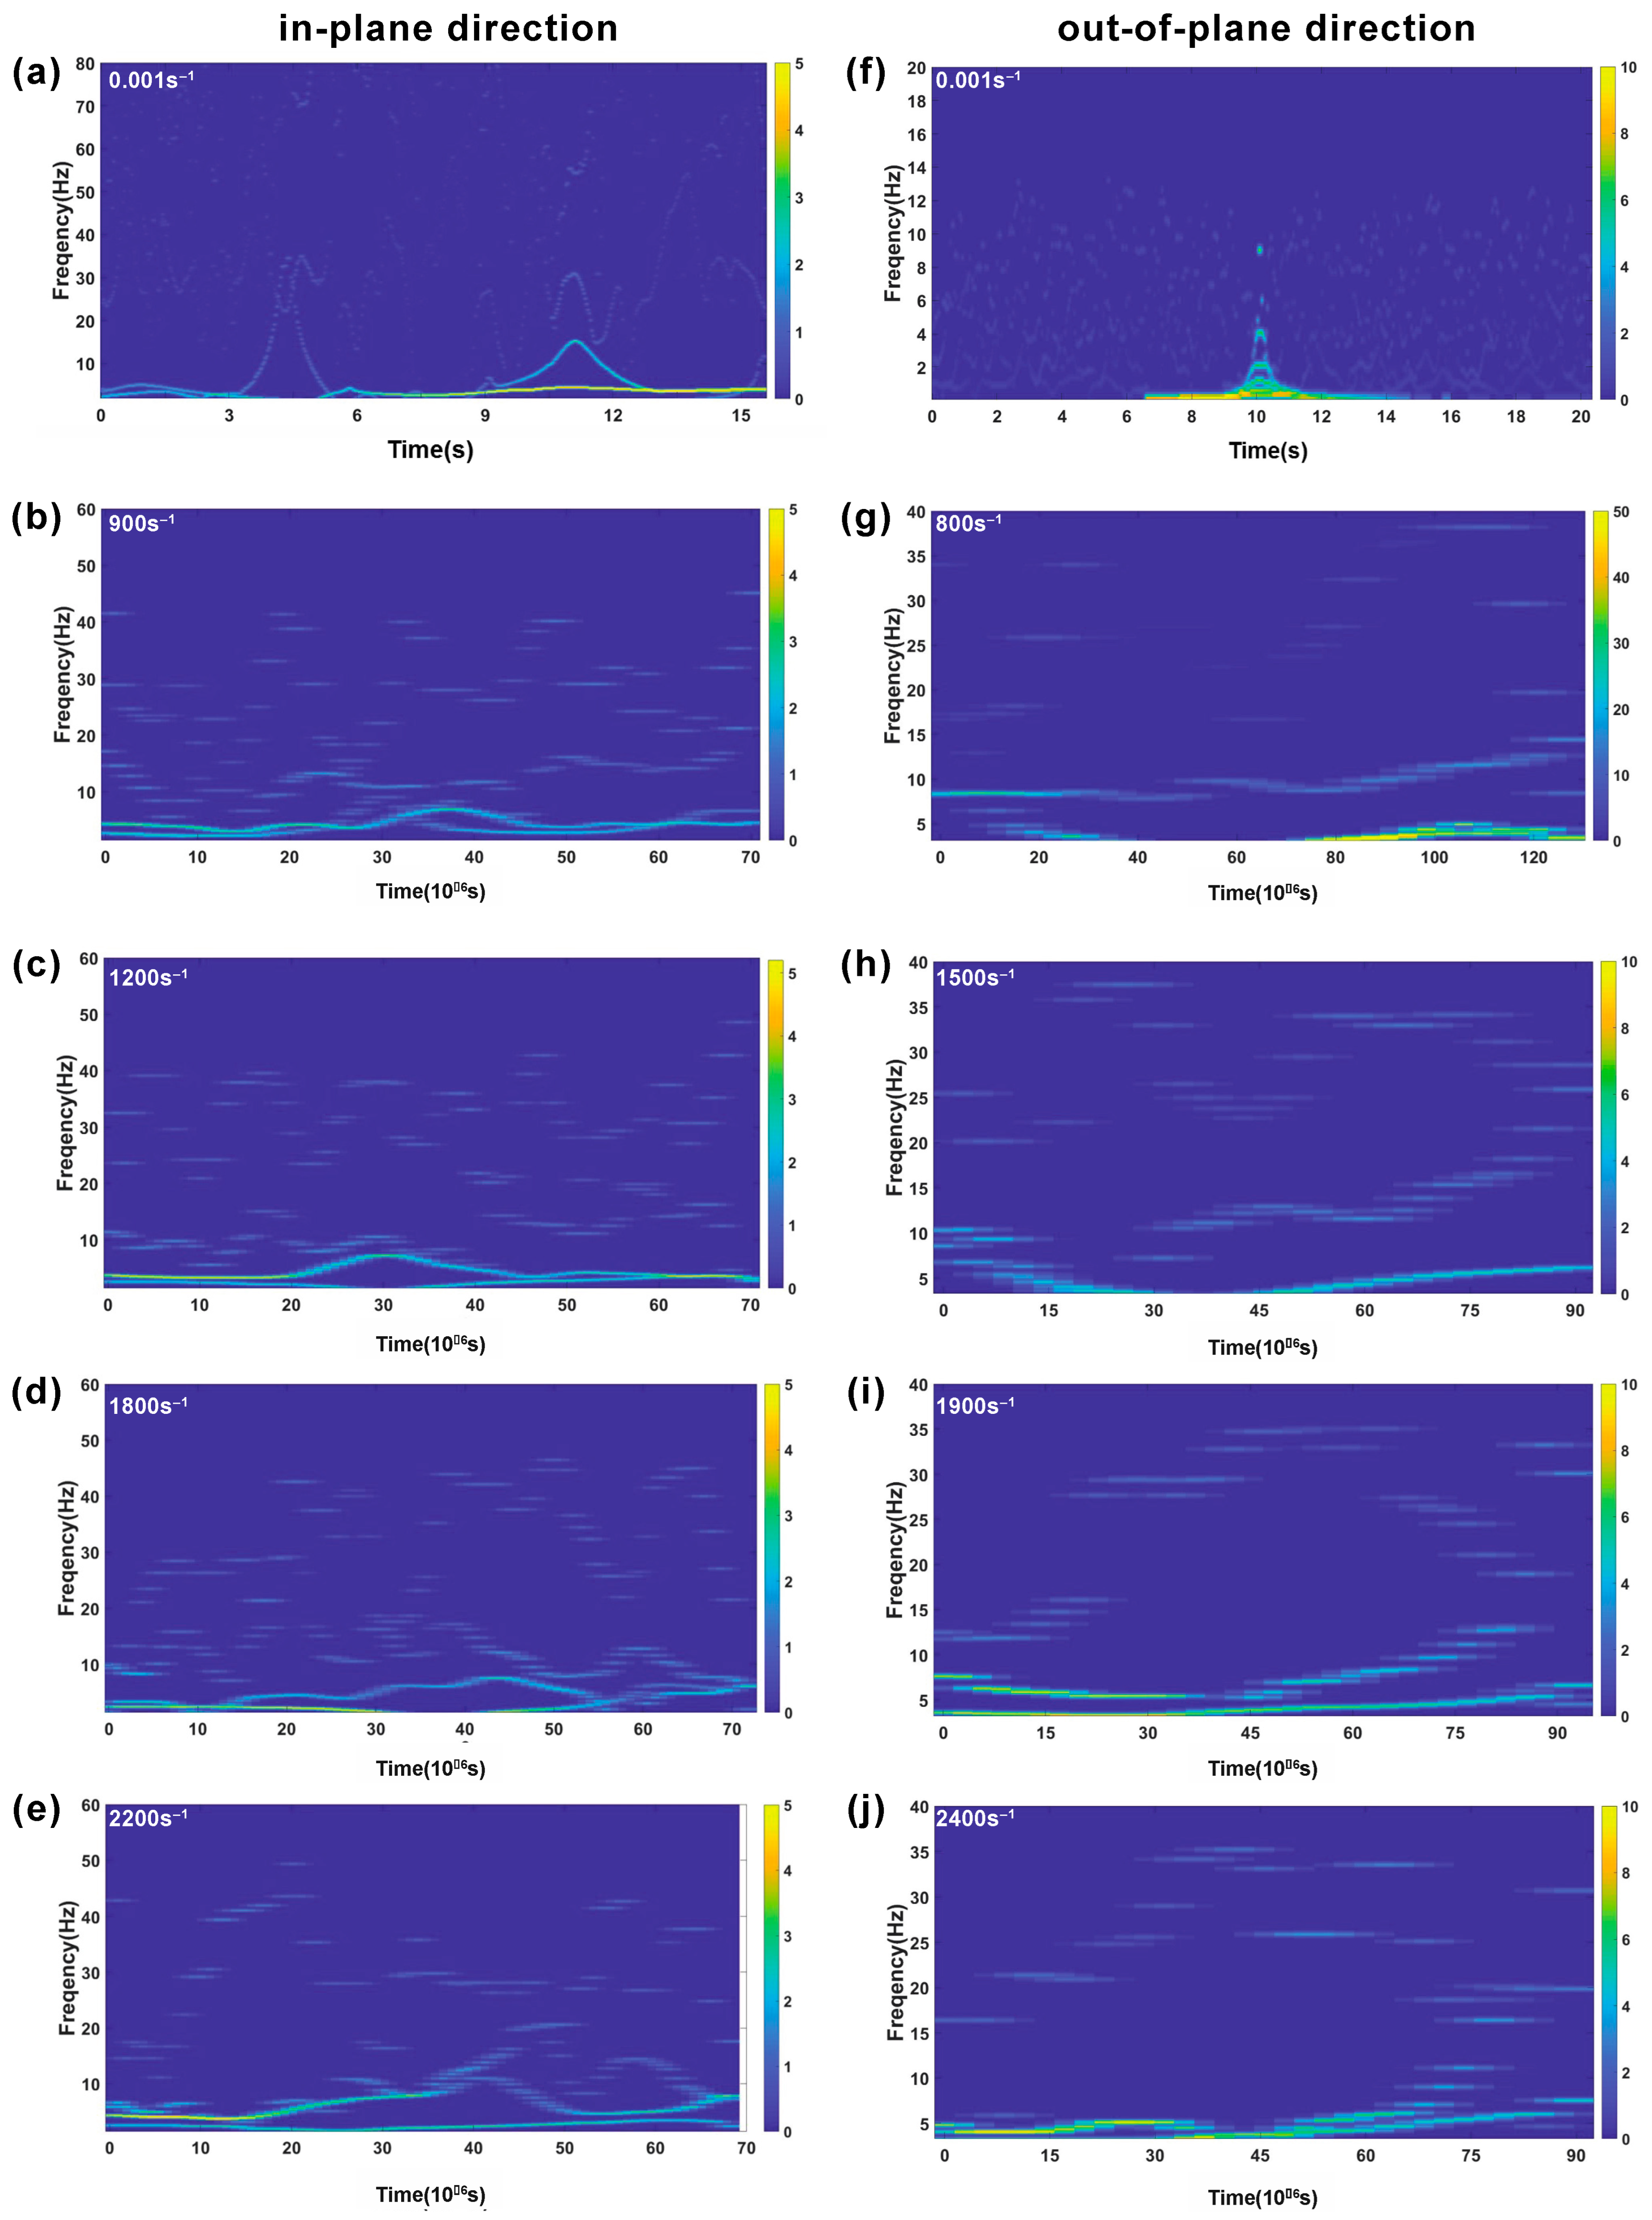
Figure 9.
Marginal Hilbert spectrum of Cf-MWCNT/SiC composites tested in (a–e) in-plane direction, and (b–j) out-of-plane direction.
Figure 9.
Marginal Hilbert spectrum of Cf-MWCNT/SiC composites tested in (a–e) in-plane direction, and (b–j) out-of-plane direction.

Figure 10.
Fracture morphology and mapped marginal Hilbert spectrum. (a) SEM image of fracture in sample tested at 1200 s−1 in an in-plane direction; (b) SEM image of fracture in the sample tested at 1500 s−1 in an out-of-plane direction; (c) frequency distribution in an in-plane direction; (d) frequency distribution in an out-of-plane direction.
Disclaimer/Publisher’s Note: The statements, opinions and data contained in all publications are solely those of the individual author(s) and contributor(s) and not of MDPI and/or the editor(s). MDPI and/or the editor(s) disclaim responsibility for any injury to people or property resulting from any ideas, methods, instructions or products referred to in the content. |
© 2023 by the authors. Licensee MDPI, Basel, Switzerland. This article is an open access article distributed under the terms and conditions of the Creative Commons Attribution (CC BY) license (https://creativecommons.org/licenses/by/4.0/).
Share and Cite
MDPI and ACS Style
Luan, K.; Ming, C.; Fang, X.; Liu, J. Frequency Characteristics of High Strain Rate Compressions of Cf-MWCNTs/SiC Composites. Ceramics 2023, 6, 1991-2007. https://doi.org/10.3390/ceramics6040122
AMA Style
Luan K, Ming C, Fang X, Liu J. Frequency Characteristics of High Strain Rate Compressions of Cf-MWCNTs/SiC Composites. Ceramics. 2023; 6(4):1991-2007. https://doi.org/10.3390/ceramics6040122
Chicago/Turabian StyleLuan, Kun, Chen Ming, Xiaomeng Fang, and Jianjun Liu. 2023. "Frequency Characteristics of High Strain Rate Compressions of Cf-MWCNTs/SiC Composites" Ceramics 6, no. 4: 1991-2007. https://doi.org/10.3390/ceramics6040122