Article

Fabrication and Characterization of Narrow-Wavelength Phosphors of Tb-Doped Yttrium-Silicon-Aluminum Oxynitride Using Spray Pyrolysis

1
Department of Materials Science and Engineering, National Taiwan University of Science and Technology, Taipei 10607, Taiwan
2
Research Center for Chemistry, National Research and Innovation Agency (BRIN), South Tangerang 15314, Indonesia
3
Graduate School of Technology, Industrial and Social Science, Tokushima University, Tokushima 700-8506, Japan
4
Department of Chemical Science and Technology, Graduate School of Advanced Technology and Science, Tokushima University, 2-1 Minami-Josanjima, Tokushima 770-8506, Japan
5
Department of Applied Chemistry, Graduate School of Science and Technology for Innovation, Tokushima University, 2-1 Minami-Josanjima, Tokushima 770-8506, Japan
*
Author to whom correspondence should be addressed.
Ceramics 2023, 6(4), 2307-2319; https://doi.org/10.3390/ceramics6040141
Submission received: 26 October 2023 / Revised: 21 November 2023 / Accepted: 1 December 2023 / Published: 3 December 2023
(This article belongs to the Special Issue Advances in Ceramics, 2nd Edition)

Abstract

:
Selective emission of green light phosphor powder Y4SiAlO8N as the host material and Tb3+ as the activator was successfully achieved using spray pyrolysis (SP). Samples synthesized with various calcination temperatures and precursor concentrations indicated that the most suitable parameter for the synthesized powder is the calcination of 0.05 M Y3.92SiAlO8N:0.08Tb3+ at a temperature of 1600 °C. The effect of the selected parameters was substantiated by the high purity of the Y3.92SiAlO8N:0.08Tb3+ phase, as confirmed by X-ray diffraction (XRD) analysis. The Scherrer equation was used to calculate grain size. In addition, scanning electron microscopy (SEM) and energy-dispersive X-ray spectrometry (EDS) confirmed the presence of micron-sized particles, which matched well with the theoretical chemical composition. The specific surface area of the phosphor powder was determined using the Brunauer–Emmett–Teller method. Finally, fluorescence spectrometry was used to determine the luminescence properties. The correlation between the crystallinity of the phosphor powder and narrowing emission is also discussed.

1. Introduction

White light-emitting diodes (WLEDs) have been extensively used for three decades in both residential and industrial lighting and typically employ yellow phosphor powder, cerium-doped yttrium aluminum garnet (Ce: YAG) paired with blue chip InGaN-based light-emitting diodes (LEDs) [1]. Compared to conventional incandescent light sources such as tungsten filament bulbs, WLED technology offers less energy consumption and a more environmentally friendly fabrication process [2]. WLED backlights are also used in liquid-crystal displays (LCDs) that are manufactured in their current form (i.e., single-chip blue mixed yellow phosphor or combined red, green, and blue phosphor multichips) and are widely used because of their high efficiency and low cost [3]. However, these WLEDs exhibit poor color rendering and are unsuitable, particularly for high-end backlight displays, owing to their broad emission wavelengths [4]. Single-chip WLED combining blue emission with yellow phosphor could not achieve a good color gamut and requires a minimum coverage of 90% according to the National Television Standard Committee (NTSC) [5]. In addition, the first generation of WLED backlights predominantly used the yellow emission phosphor (Ce: YAG), which produced a low luminous intensity and suffered from high thermal quenching problems, which need to be circumvented [6,7].
The color gamut of LCDs primarily depends on red, green, and blue (RGB) color filters through RGB emissions from the WLED passes. A large portion of these emissions is desired to achieve a better luminous intensity. Progressive advancements in green phosphor technology have shown promising results in improving color quality and efficiency [8]. Significant interest is shown toward green narrow-emitting phosphors owing to their wide recognition for expanding color gamut, enhancing color quality, and improving luminous efficiency [9]. Recently, LCDs have improved up to 30% of color gamut by applying a narrow band of full-width half-maxima (FWHM) of 55 nm green phosphor β-SiAlON:Eu2+ combined with broad-band of red phosphor CaAlSiN3:Eu [10]. Based on these findings, tremendous efforts have been made to produce narrowband and high-intensity green phosphors [11,12]. Green phosphors are crucial for achieving accurate color reproduction in displays, but have historically suffered from low efficiency and poor stability [13,14]. Tb3+ ion-activated phosphor powder is the commonly used green phosphor because it can emit green light in the visible light spectrum [15,16]. Hua et al. synthesized a novel green phosphor of Tb3+-doped Y4-xSiAlO8N:xTb3+, with excellent thermal stability, a maximum green emission peak at 543 nm, and a full width at half maximum (FWHM) of 45 nm [17]. This narrow band was much smaller than those reported in previous studies on Ba2LiSi7AlN12:Eu2+ (61 nm) [18] and Ba(Li2(Al2Si2)N6):Eu2+ (57 nm) [19]. The development of narrow green emissions based on a Tb3+-activated phosphor is a significant objective that requires attention.
Among phosphor materials, the oxynitridosilicates class matrix is superior to other materials owing to its good mechanical and chemical stability [20,21], high thermal quenching stability [17], prolonged luminescence half-life [12,22], and ability to adjust the wavelength [4,20]. Green phosphor materials are predominantly synthesized using various methods, including solid-state [17], sol-gel [23], and spray pyrolysis (SP) [24]. The conventional approach for solid-state reactions is simple, easy to implement, and has a wide range of chemical compatibilities [25]. However, it has certain limitations, such as a high heating temperature (≥1000 °C) and low chemical uniformity [17,25]. The sol–gel method could address these limitations, including a low reaction temperature (≤1000 °C), and it provides less energy consumption, less contamination, and high uniformity in particle distribution. However, it has the disadvantages of a long reaction time and high energy loss during calcination to remove the residue, which can hinder the enhancement of the luminescent properties of the phosphor particles [23,26]. The SP method has been used to circumvent these issues [24,27]. Compared with the aforementioned techniques, SP offers several advantages, including less contamination [24], compatibility with the continuous process [28], fast processing time (∼1 h) [27], and morphological flexibility [29,30]. Furthermore, several high-purity micron-sized phosphor materials of various morphology were successfully synthesized using this method. For example, submicron-sized pure Ba3Si6O12N2:Eu2+ phosphor powders were synthesized using SP, achieving FWHM of 63 nm. The nitrogen content, represented by δ, can be easily adjusted by varying the precursor ratio [31]. Spherical SrAl2O4:Eu2+/Dy3+ particles with a long average decay time of 370.47 s were synthesized via flame-SP at a sintering temperature of 1200 °C [32]. Yttrium borates and yttrium oxide series with unique hexagonal YBO3 and cubic oxide phases were prepared by SP, contributing to efficient luminescence and a prolonged decay time [29]. In addition, we successfully prepared solid, hollow, and porous Eu-doped gehlenite using SP [27] and demonstrated its superior photoluminescence (PL) properties [30]. Therefore, this study attempts to prepare a green phosphor with a narrow wavelength range by SP. This study focuses on the preparation and characterization of narrow-wavelength phosphors of Tb-doped yttrium-silicon-aluminum oxynitride. Phosphors were synthesized using SP under various calcination conditions, and their chemical compositions were confirmed using X-ray diffraction (XRD). The particle morphologies and specific surface areas of the Tb-doped yttrium-silicon-aluminum oxynitride powders were analyzed using scanning electron microscopy (SEM) and the Brunauer–Emmett–Teller (BET) method, respectively. Finally, the luminescence properties (excitation and emission) excited by UV light at room temperature were measured using a PL spectrometer. This finding highlights the importance of using SP to synthesize narrow green-emitting phosphors and the correlation between their physical and PL properties.

2. Materials and Methods

2.1. Fabrication of Y3.92SiAlO8N:0.08Tb3+ Phosphors Powders

Initially, for preparing yttrium silicon aluminum oxynitride powders, 3.75 g of yttrium (III) nitrate hexahydrate (Y(NO3)3.6H2O, 99.8%, Aldrich, USA) was mixed subsequently with 1.17 g of aluminum nitrate nonahydrate (Al(NO3)3.9H2O, 98%, Showa, Tokyo, Japan), 0.07 g terbium (III) nitrate hydrate (Tb(NO3)3. xH2O, 99.9%, Alfa Aesar, Ward Hill, MA, USA), and 0.52 g tetraethyl orthosilicate (TEOS, C8H20H4Si, 98%, Seedchem, Camberwell, Australia). These precursors were then added to 250 mL of deionized water and stirred for 1 h to obtain the 0.05 M Y3.92SiAlO8N:0.08Tb3+ precursor solution. The resulting precursor solution was added to an atomizer and converted into droplets. Subsequently, these droplets were carried out in a quartz tube and heated in a furnace (D110, Denying, New Taipei, Taiwan) with the three zones: preheating (250 °C), calcinating (500 °C), and cooling (300 °C). An electrostatic collection system was installed at the end of the furnace to obtain phosphor powders. Finally, the collected powder was assigned as a received powder and subjected to a muffle furnace (SJ-10208036-1, SJ, Taipei, Taiwan) for calcination at temperature set of (1300, 1400, 1500, 1600, or 1650 °C). The maximum calcination temperature was set at 1650 °C owing to the limitations of our equipment and to avoid melting of the YSiAlON phase [33]. A mixture of 5% H2 and 95% N2 was used as a reducing gas.

2.2. Characterization of Y3.92SiAlO8N:0.08Tb3+ Phosphors Powders

The phase compositions and related crystallite sizes of the Y3.92SiAlO8N:0.08Tb3+ phosphor powders were analyzed using XRD (D2 Phaser, Bruker, Bremen, Germany) with Ni-filtered Cu Kα radiation (λ = 1.5405 Å). The samples were scanned at 2θ range between 20° and 70°with a scan step of 0.05° and a speed of 5° min−1 to obtain their phase compositions, and the crystallite size of each powder was acquired from the three most intense peaks out of the diffraction peaks using Scherrer’s equation. Next, the surface morphologies of the Y3.92SiAlO8N:0.08Tb3+ phosphor powders were observed by field-emission SEM (FE-SEM) (JSM 6500F, JEOL, Tokyo, Japan). FE-SEM was performed under high vacuum with an energy of 10 kV and a working distance of 10 mm. For microstructural observations, the specimens were sputter-coated with platinum for 30 s at a current of 10 mA. In addition, owing to the agglomeration of the Y3.92SiAlO8N:0.08Tb3+ phosphor powders, the measurement of several micron-sized particles was more appropriate using an optical microscope (OM) (BX51M, Olympus, Japan). The specimen for OM was prepared using copper glue to attach phosphor powder, which can effectively avoid the impact of pores on the carbon glue in the analysis, and a layer of platinum was plated to increase the contrast of the sample. The particle size of the Y3.92SiAlO8N:0.08Tb3+ phosphor powders was obtained by measuring the diameters of randomly selected particles from the specimen observed at a magnification of 200× for more than 300 particles using Image J software (1.54d version). Furthermore, the chemical compositions of the Y3.92SiAlO8N:0.08Tb3+ phosphor powders were evaluated using energy-dispersive X-ray spectrometry (XEDS) in the SEM. The BET method was used to determine the specific surface area of Y3.92SiAlO8N:0.08Tb3+ phosphors powders using a surface area analyzer (Tristar, Micromimetics, Norcross, GA, USA). Before the measurements, each sample was degassed at the temperature of 150 °C for a duration of 3 h. The measurements itself was conducted at a temperature of −196 °C. Finally, a fluorescence spectrometer (FP-8500, JASCO, Tokyo, Japan) was used to investigate the photoexcitation and photoemission properties of the Y3.92SiAlO8N:0.08Tb3+ phosphors powders under the following conditions. The scan speed was adjusted to 100 nm/min in the range 200–700 nm. The wavelength of the excitation light was set at 251 nm to initiate the PL response, and the emission wavelength recorded at 543 nm was referred to as the green-light region. The slits width of the excitation and emission were fixed at 2.5 nm during the measurement.

3. Results

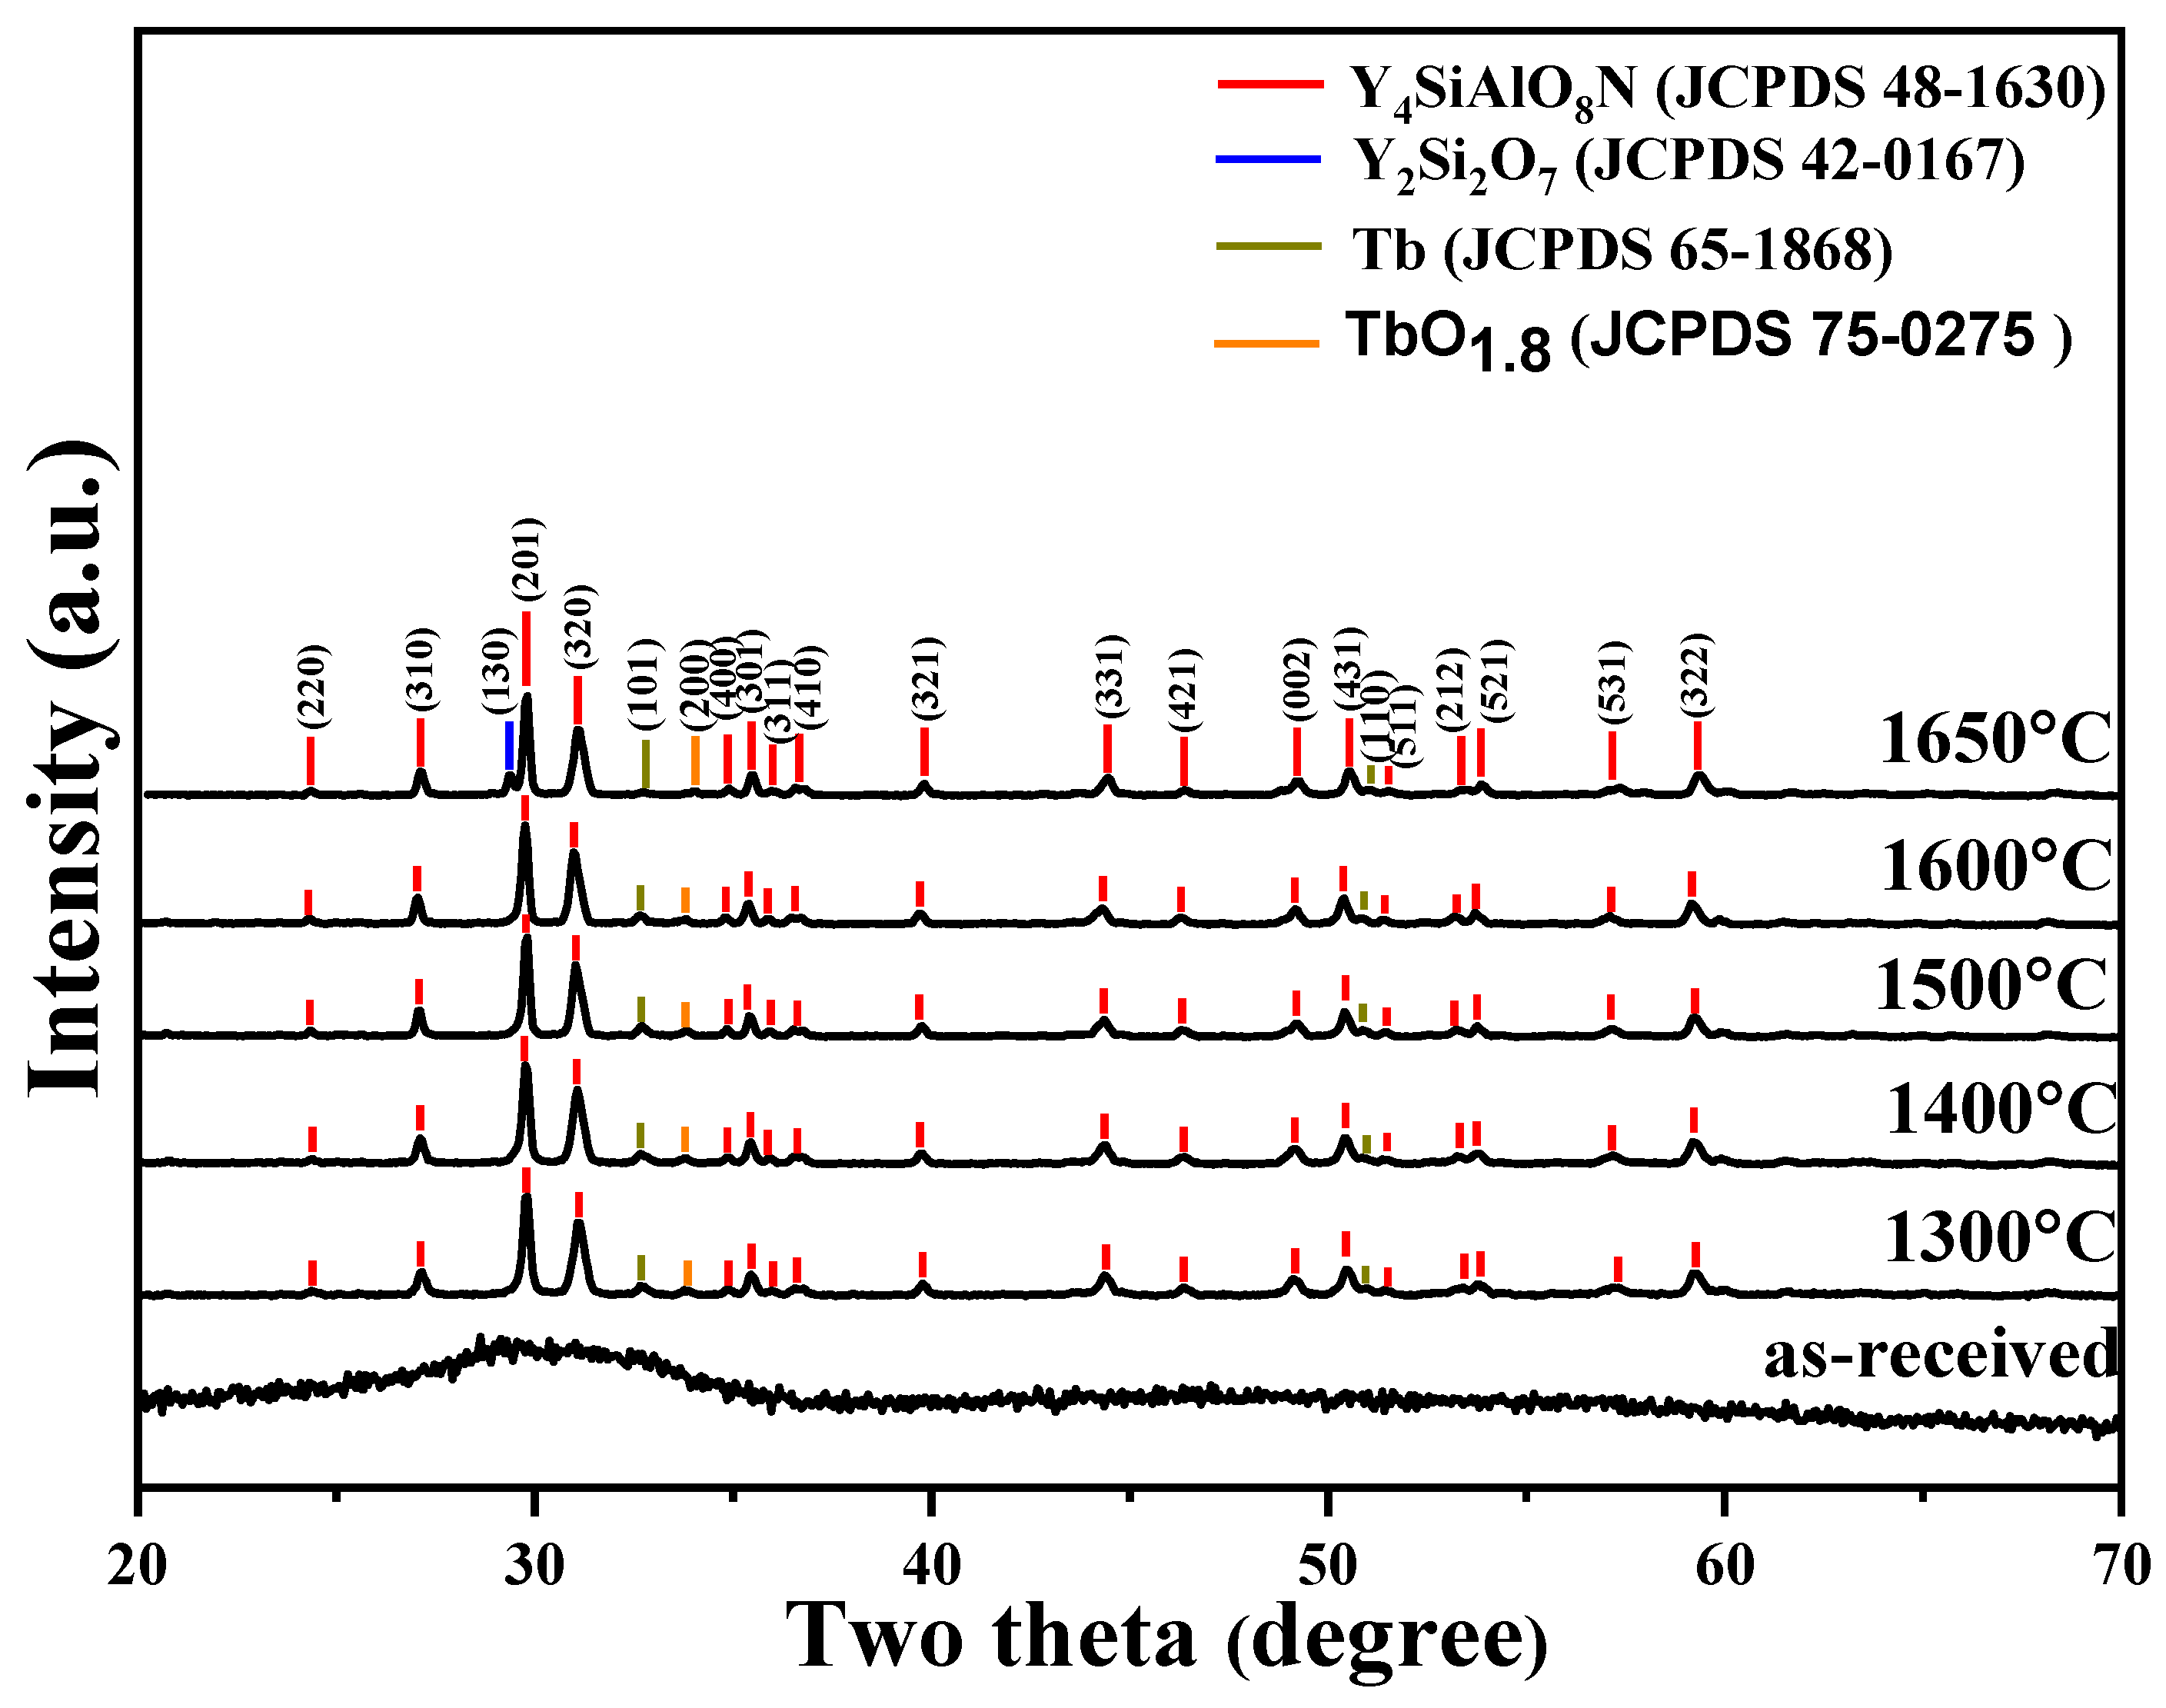
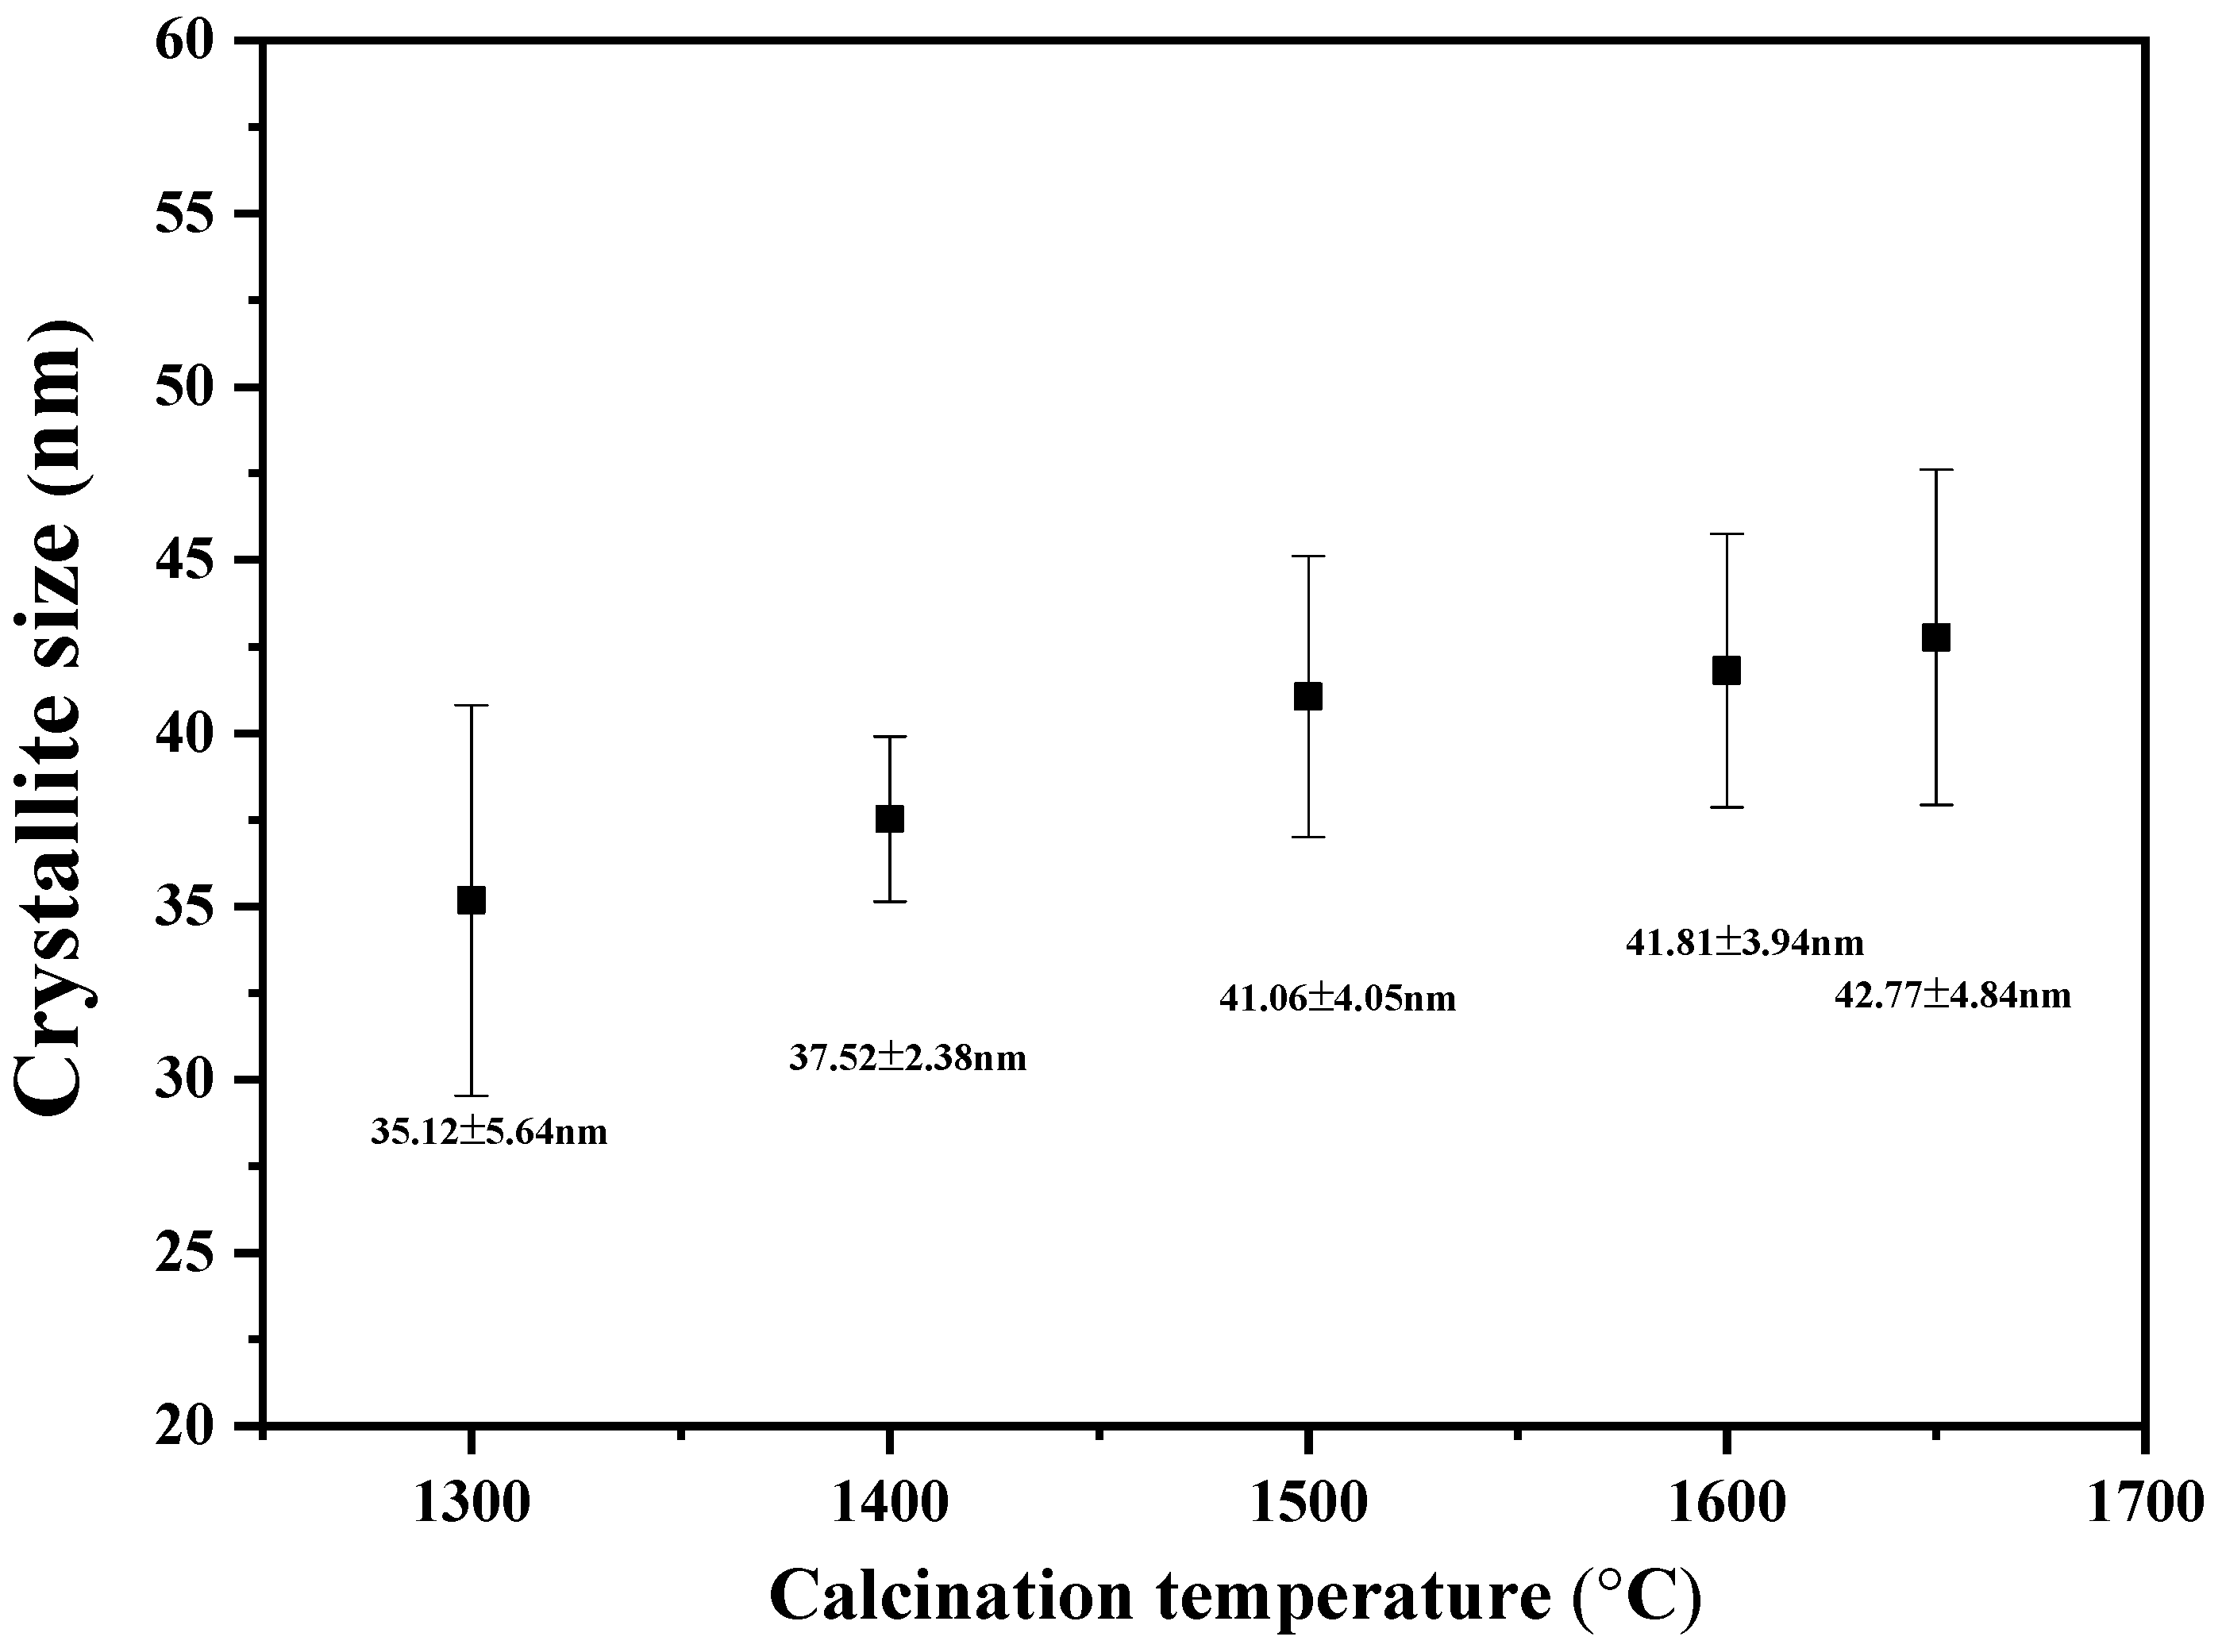
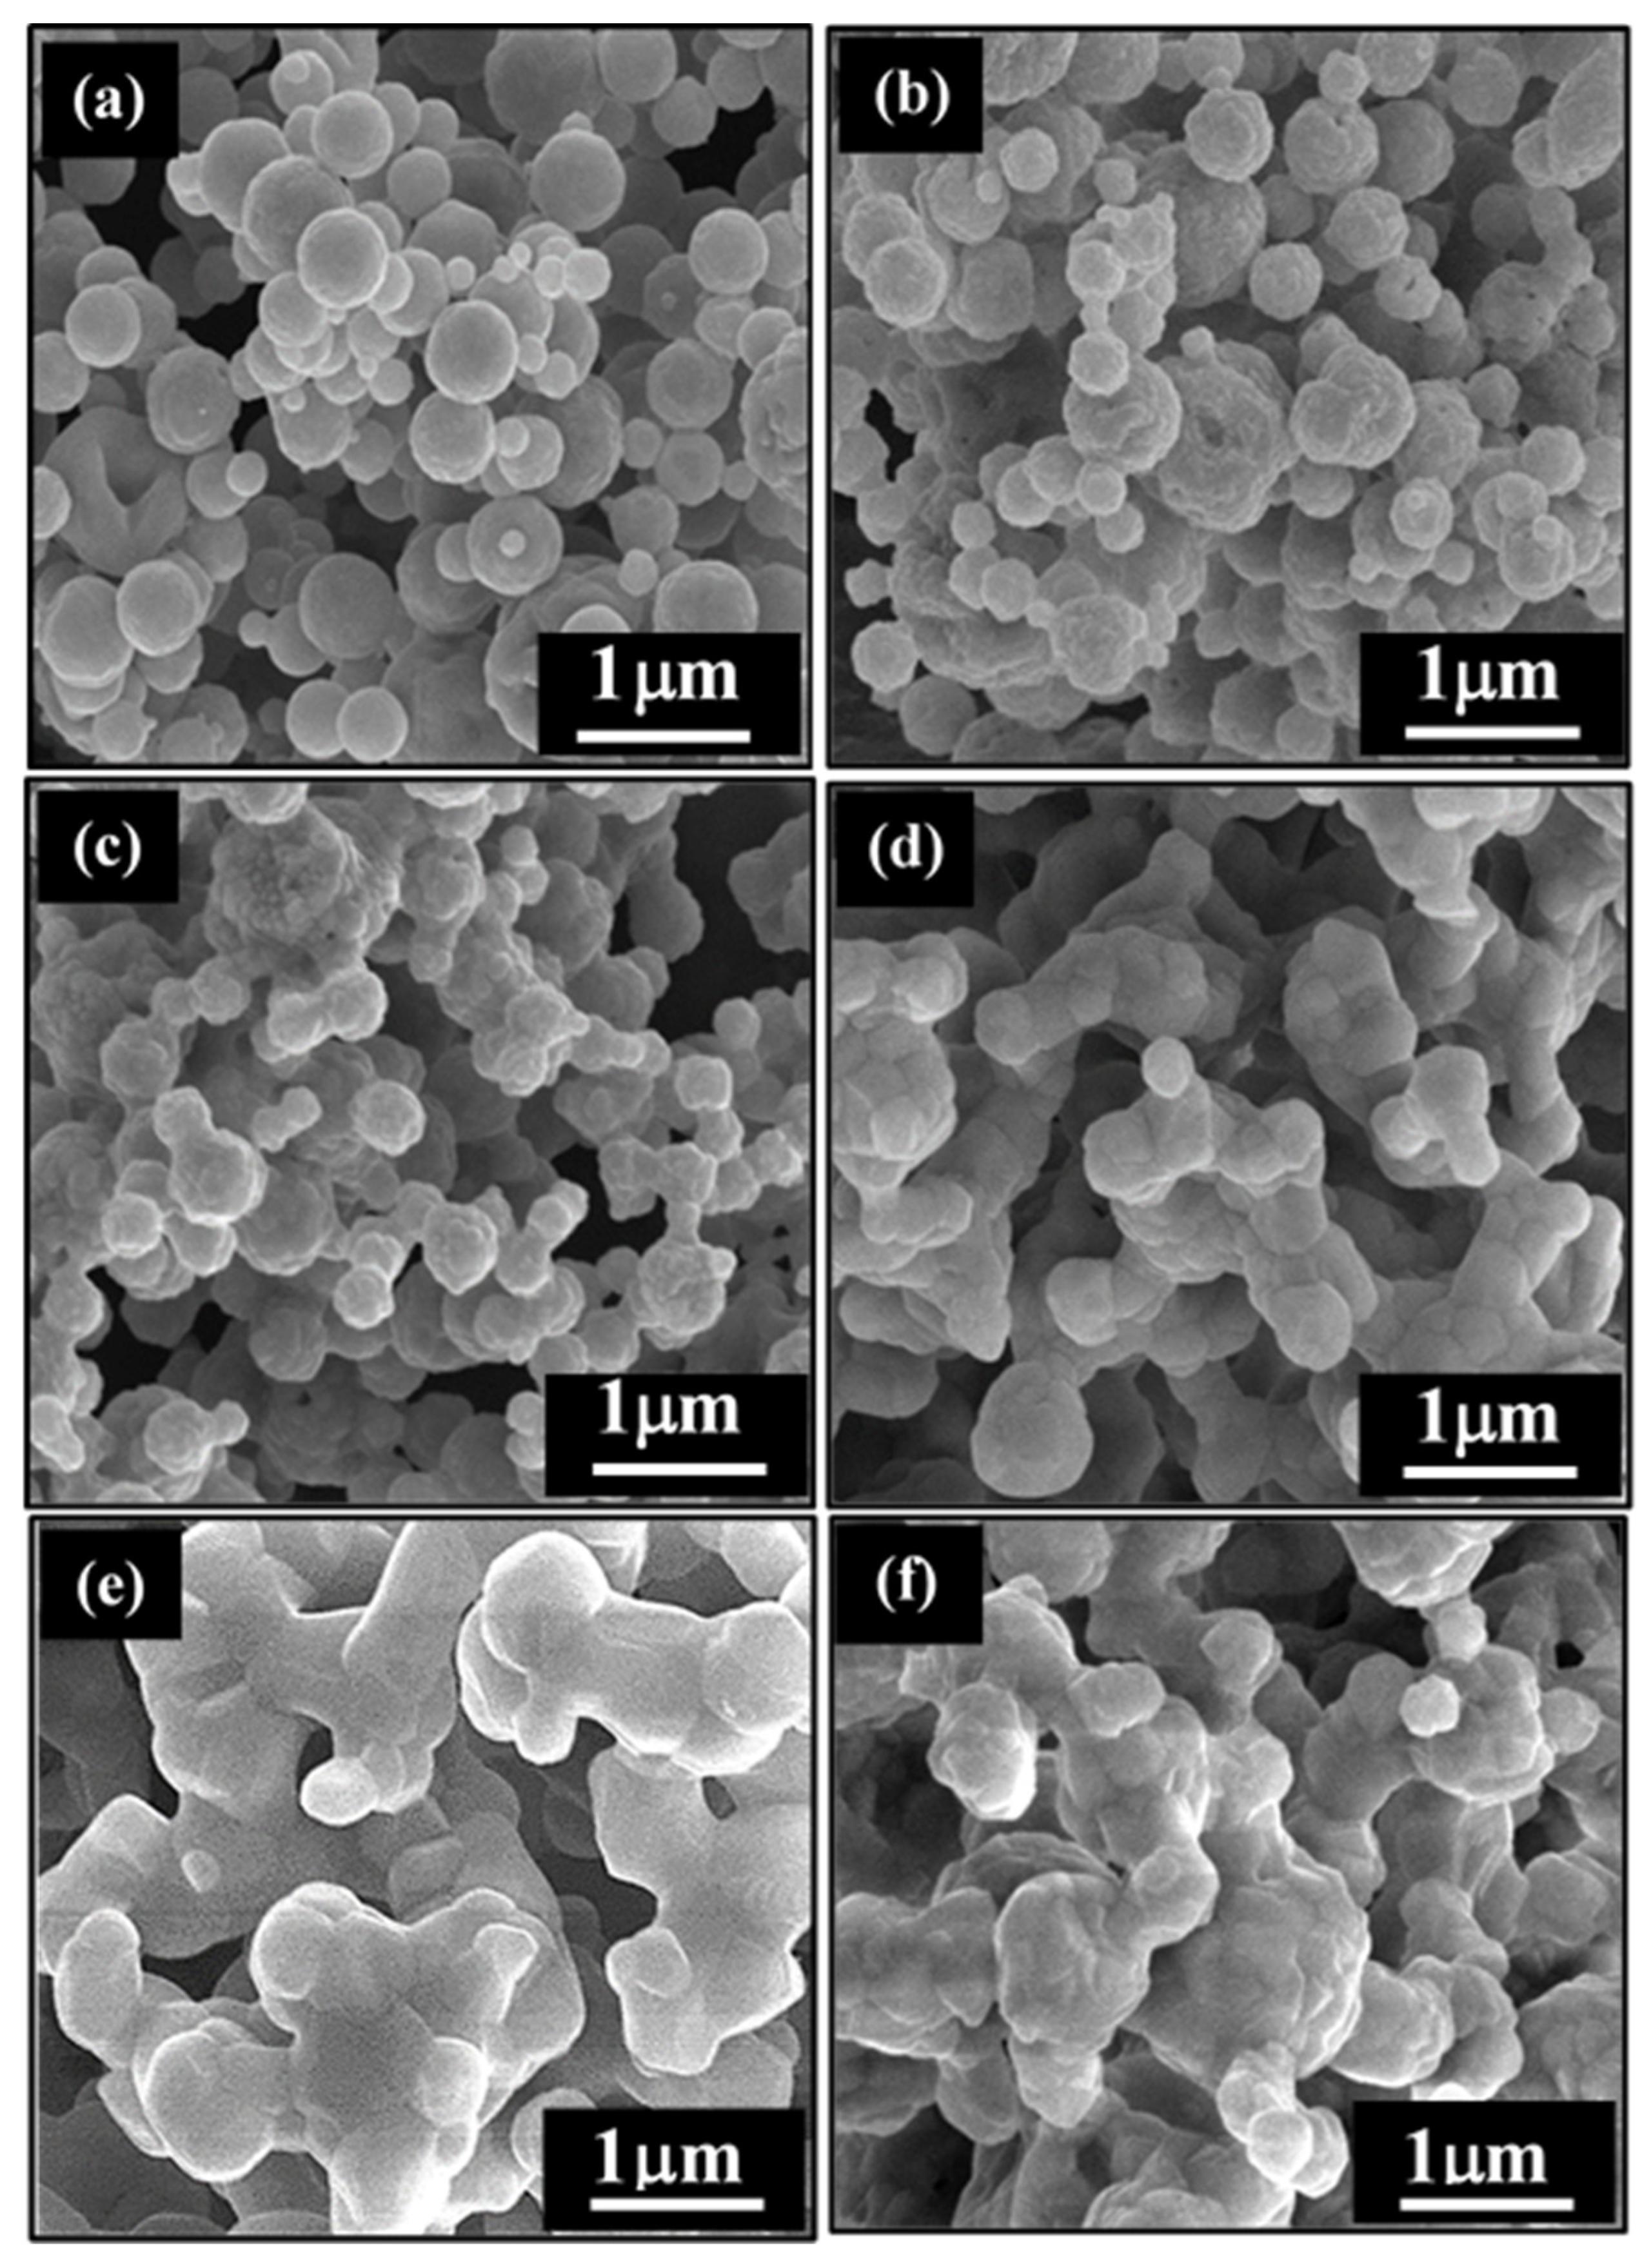
3.1. Phase Compositions and Morphology Analysis
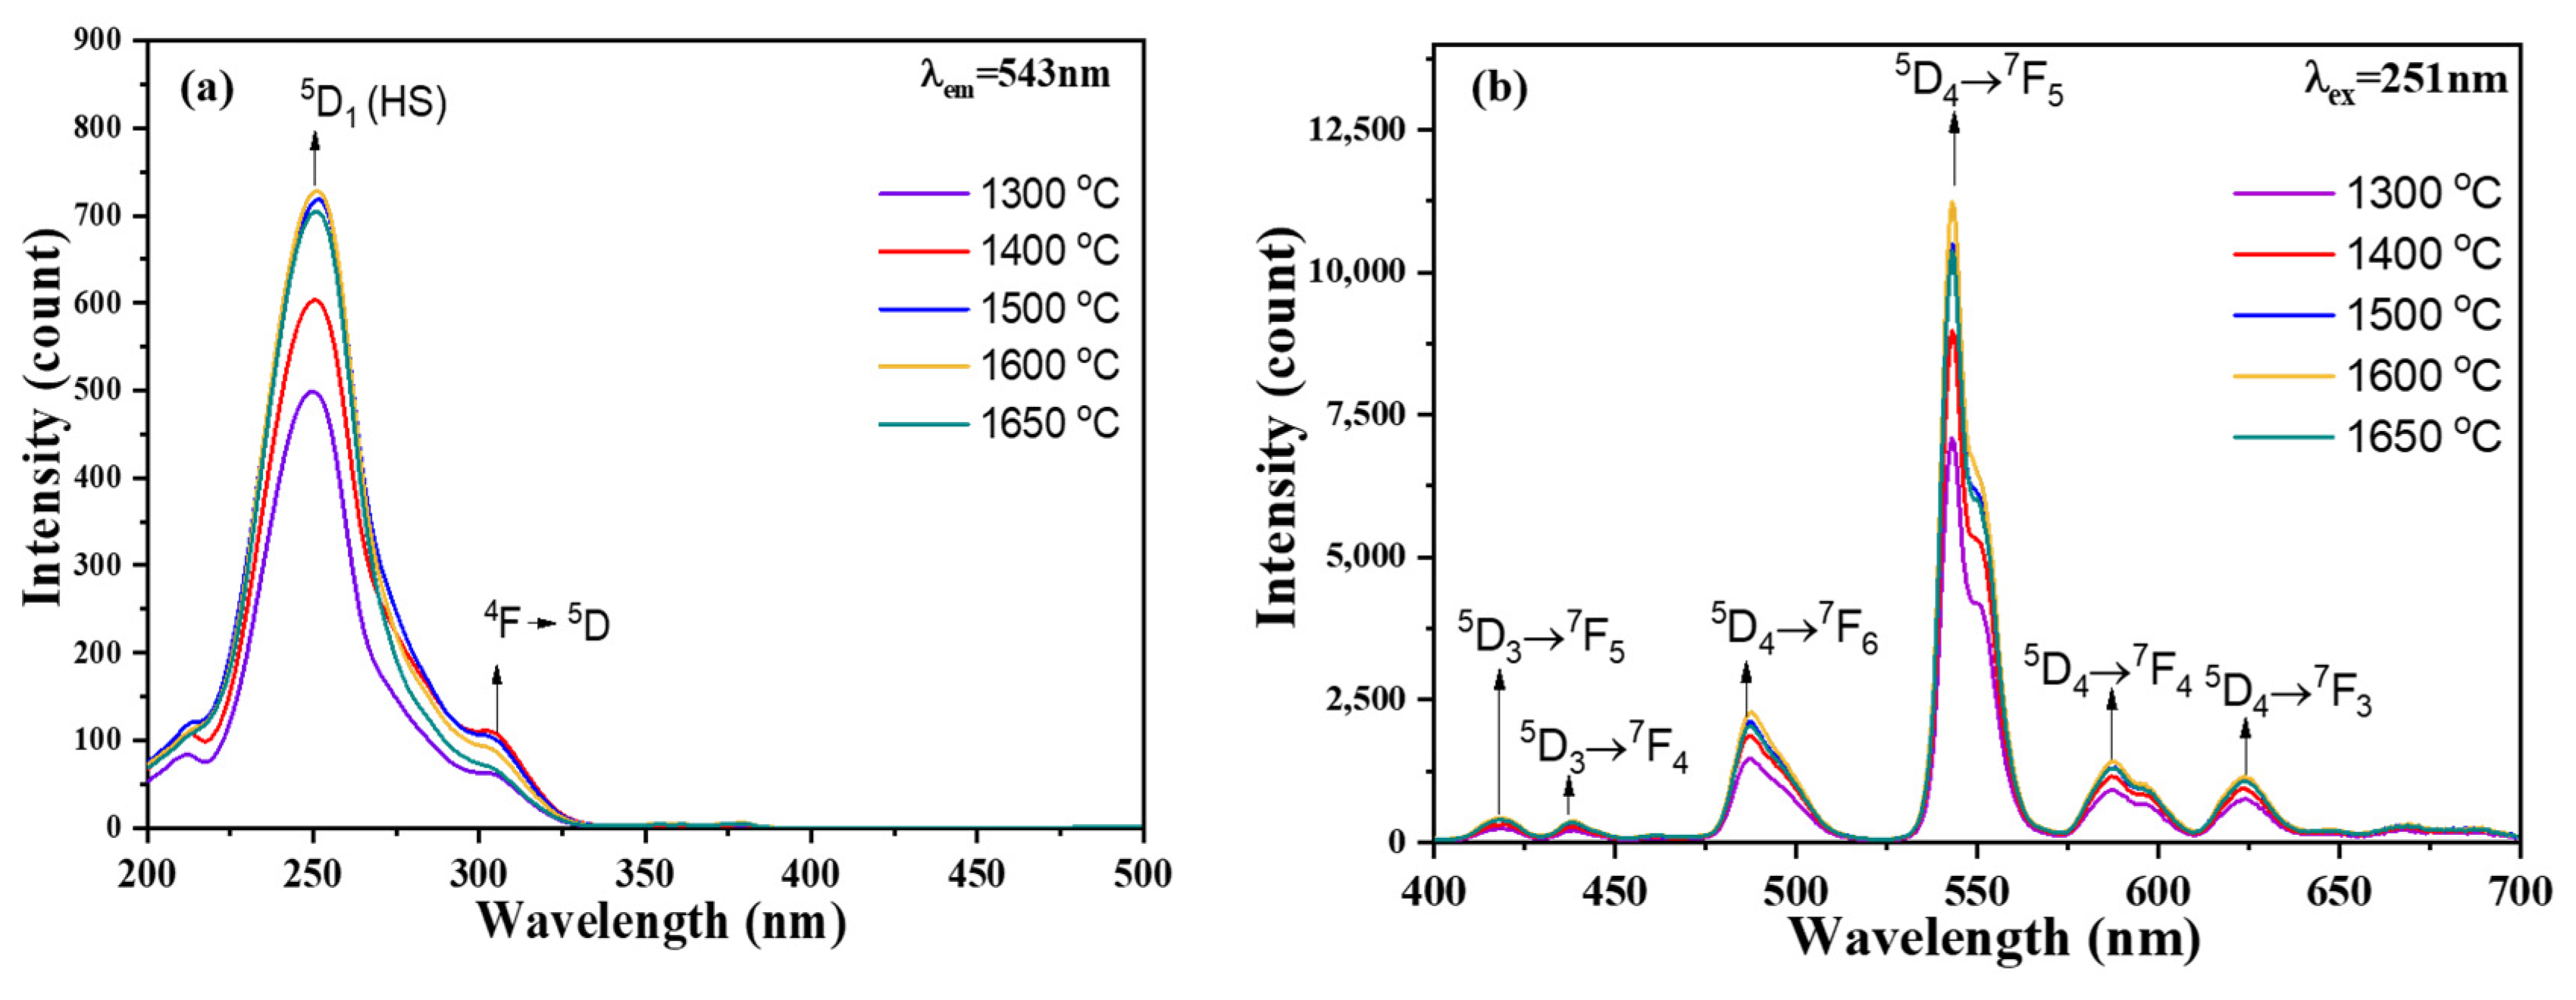
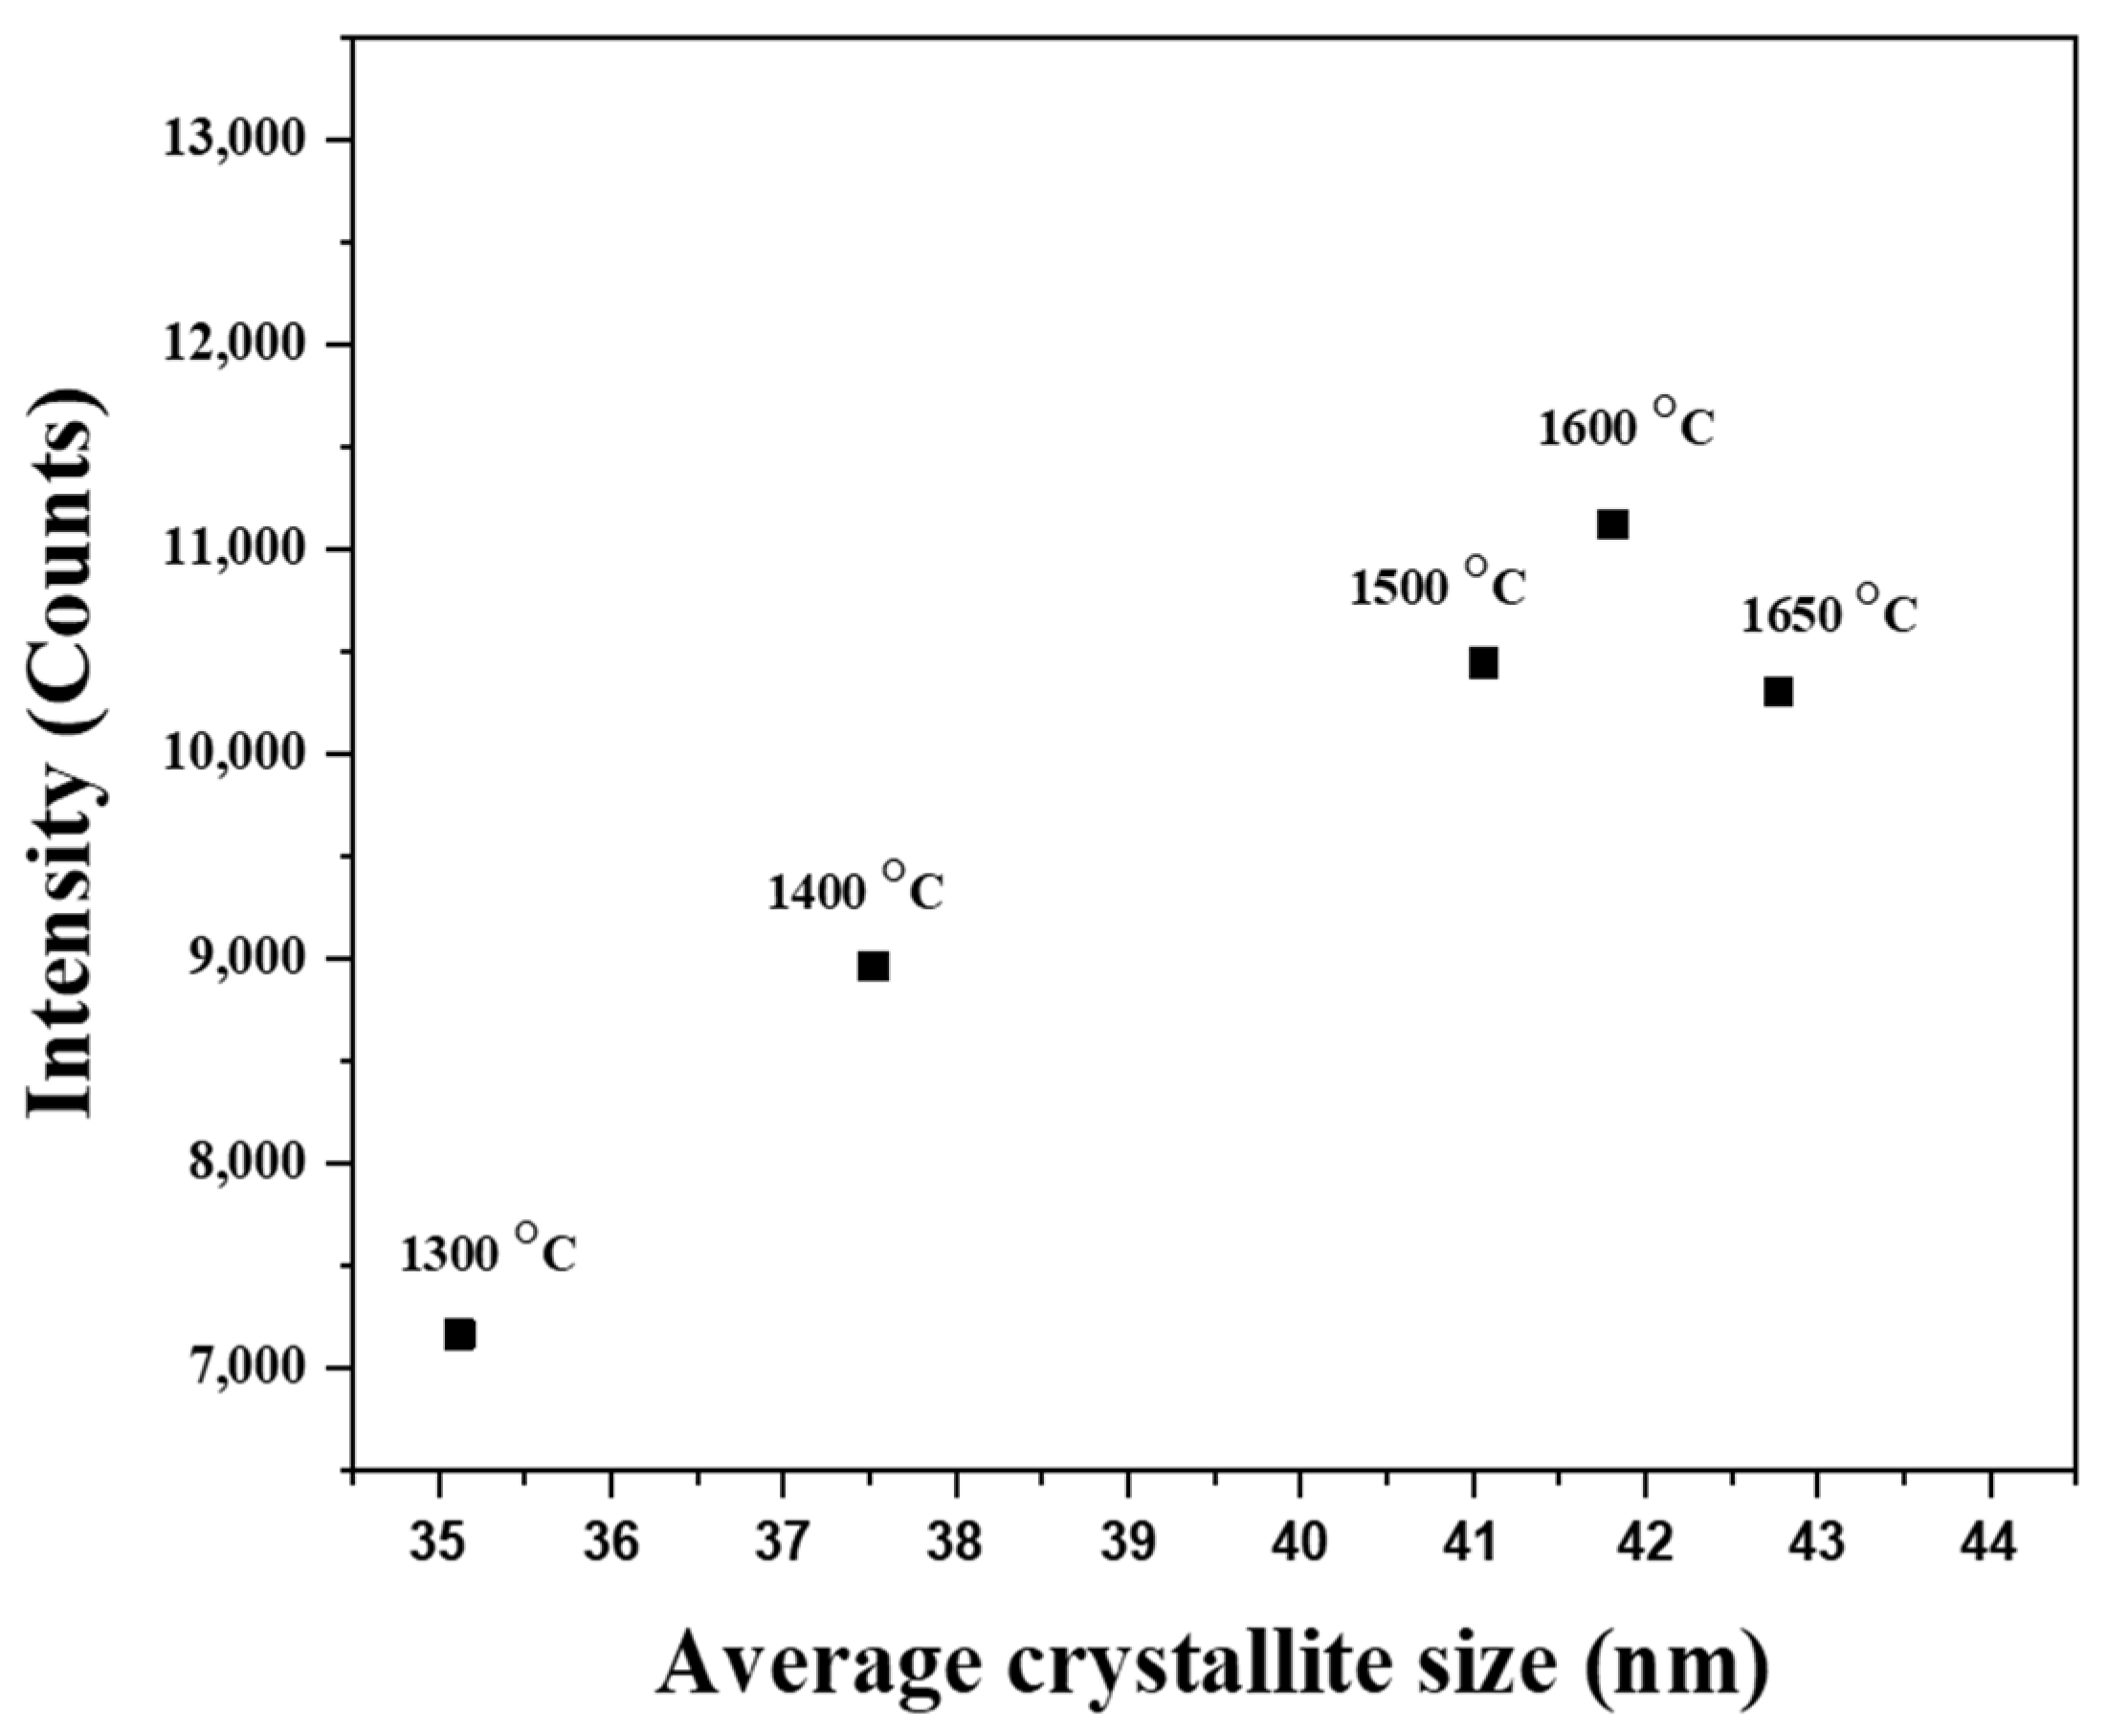
The phase compositions of the calcined Y3.92SiAlO8N:0.08Tb3+ phosphor powders were determined by XRD, as shown in Figure 1. The as-received sample showed a characteristic broad band at 2θ of 24°–36°, which revealed the amorphous structure of the as-received sample. As the calcination temperature increased to 1300 °C, the XRD pattern showed two predominant phases, which are indexed to the main matrix and activator phases. Figure 1 shows several high-intensity peaks at 2θ of 24.07°, 26.8°, 29.5°, 30.83°, 34.59°, 35.20°, 35.66°, 36.52°, 39.52°, 44.15°, 46.08°, 48.98°, 50.25°, 51.22°, 53.15°, 53.61°, 57.06°, and 59.09° corresponding to the (220), (310), (201), (320), (400), (301), (410), (311), (321), (331), (421), (002), (431), (511), (212), (521), (531), and (322) planes, respectively. These peaks are attributed to the main matrix phases of Y4SiAlO8N (JCPDS #48-1630). In addition, the XRD spectra indexing the activator phase showed two diffraction peaks at 2θ of 32.46° and 50.76° of Tb (JCPDS #65-1868) corresponding to the (101) and (110) planes, respectively. Along with it, very weak intensity peak at 2θ of 33.97° is indexed to TbO1.81 (JCPDS #75-0275), corresponding to the (200) plane. Furthermore, the XRD spectra exhibited similar peaks and phases even with the increase in calcination temperatures to 1400, 1500, and 1600 °C. In addition, at the highest calcination temperature of 1650 °C, besides the main matrix phase of the Y4SiAlO8N and Tb activator phases, the XRD spectra also showed a peak at 2θ = 29.05°, indexed to the minor matrix phase of yttrium disilicate (Y2Si2O7) (JCPDS #42-0167) corresponding to the (130) plane.
Furthermore, the average crystallite sizes and standard deviations (STDs) of the main of Y4SiAlO8N matrix phase were calculated using the FWHM values of the three high-intensity peaks corresponding to the (201), (320), and (310) planes, based on the Scherrer equation. The crystallite size of the Y3.92SiAlO8N:0.08Tb3+ phosphor powder gradually increased until the calcination temperature reached 1400 °C (Figure 2). Notably, at higher calcination temperatures of 1500, 1600, and 1650 °C, the crystallite size is in a similar order, but with an increased STD of the crystal size, which indicates a high dispersity of the grain size. The average crystallite sizes and STDs for the powders prepared at calcination temperatures of 1300, 1400, 1500, 1600, and 1650 °C are 35.12 ± 5.64, 37.52 ± 2.38, 41.06 ± 4.05, 41.81 ± 3.94, and 42.77 ± 4.84 nm, respectively. These indicate that the incorporation of dopant ions in the host matrix was successful using SP.
Figure 3 shows the SEM images of typical as-received Y3.92SiAlO8N:0.08Tb3+ and phosphor powders calcined at various temperatures. Two significant differences are observed in the particle morphology. Figure 3a shows that the as-received phosphor powder exhibited spherical particles with a slightly smooth surface, which is typical for samples prepared via SP [27,28]. As the calcination temperature increases to 1400 °C (Figure 3b,c), larger particles are observed, and the spherical surface becomes rough, which could be attributed to particle coalescence and agglomeration during the early stage of grain growth. Subsequently, at higher calcination temperatures of 1500 °C, further grain growth occurs as the spherical shape begins to deteriorate, and necking was observed on the particles [33]. Necking transforms the phosphor particles into aggregates, as shown in Figure 3c; it progressed further at higher calcination temperatures (1600–1650 °C), leading to particle coarsening and formation of larger aggregates, as illustrated in Figure 3e,f. In short, phosphor powder particles were successfully prepared by spray pyrolysis and have a spherical shape as shown in the as-received sample. Increasing the calcination temperatures caused the particle to grow into large aggregates.
Figure 4 shows the XEDS spectra of the Y3.92SiAlO8N:0.08Tb3+ powders calcined at 1300, 1400, 1500, 1600, and 1650 °C. The XEDS spectra showing the peaks of Tb-Ma, Al-Ka, Si-Ka N-Ka, Al-Ka, and Y-La suggest that all Tb-doped yttrium-silicon-aluminum phosphor powders contain the main compositions of Y, Si, Al, O, and Tb. In particular, the C-Ka peak was obtained from the carbon tape and not from the phosphor powder. Owing to the light element content, both O-Ka and N-Ka cannot be identified precisely and do not represent the real composition. Therefore, O-Ka and N-Ka were excluded from the compositional calculations.
In addition, as shown in Figure 4a, the statistical analysis of the chemical compositions of the Tb-doped yttrium-silicon-aluminum oxynitride phosphor powders yield 68.69 ± 1.59% Y, 15.23 ± 0.98% Si, 14.91 ± 1.64% Al, and 1.17 ± 0.3% Tb, for the as-received powder. Based on these data, the composition of the as-received phosphor powder was determined to be similar to the theoretical molar ratio of the precursor (Y:Si:Al:Tb = 3.92:1.00:1.00:0.08). Furthermore, as the calcination temperature increases from 1300 to 1650 °C, similar chemical compositions were identified, as shown in Figure 4b,e,f. The XEDS data were similar to the theoretical composition; therefore, the phosphor powders were successfully synthesized with no significant difference between the as-received and calcined phosphor powders.

3.2. PL Properties

Figure 5 shows the (a) PLE and (b) PL spectra of the Y3.92SiAlO8N:0.08Tb3+ phosphor powders. Figure 5a, shows an intense green emission at 543 nm; the PL spectra display a broad excitation in the range of 200–304 nm, composed of two broad excitation bands at approximately 251 and 304 nm. The first peak, centered at 251 nm, corresponds to the intrinsic 5d1 high spin-energy (HS) state of Tb3+ ions. The lowest excitation intensity of HS state of 5d1 was observed at the calcination temperature of 1300 °C, with phosphor powder intensity emitting only 500 counts. Furthermore, the excitation intensity gradually increased with an increase in the calcination temperature from 1400 to 1600 °C. The observed excitation intensities at 1400, 1500, and 1600 °C are 602, 704, and 734 counts. In addition, at the highest calcination temperature of 1650 °C, the excitation intensity decreases, emitting only 718 counts. Contrastingly, the excitation intensity of the 4f–5d spin-allowed transition was not directly affected by the increasing calcination temperature. The excitation intensities at calcination temperatures from 1300 to 1650 °C were 63, 113, 104, 92, and 70 counts, respectively.
Figure 5b shows the PL emission spectra of the Y3.92SiAlO8N:0.08Tb3+ phosphor powders at various temperatures. Upon excitation at 251 nm, the emission spectra of Y3.92SiAlO8N:0.08Tb3+ exhibited four intense emission peaks and two weak peaks in the green and red regions, which are attributed to the characteristic of 5D4/7FJ (J = 6, 5, 4, 3) of Tb3+ ions. These emission peaks were located at 488 (5D4/7F6), 543 (5D4/7F5), 585 (5D4/7F4), and 624 nm (5D4/7F3). In addition to the 5D4/7FJ (J = 6, 5, 4, 3) transitions, Figure 5b shows the splitting of 5D3/7FJ (J = 5, 4) transitions of Tb3+ ions, with emission peaks located at 418 (5D3/7F5) and 437 nm (5D3/7F4). Compared with the 5D4 level transitions, the intensity of 5D3 level transitions were much weaker.
The relationship between the crystallite size and PL is illustrated in Figure 6. The luminescence intensity was influenced by both the specific surface area and crystallite size [34]. Initially, the PL emission intensity is observed at the main peak at a wavelength of 543 nm (5D47F5), which indicates green emission. Accordingly, the PL intensity increased proportionally to the crystalline size at higher calcination temperatures of 1300–1600 °C. At the calcination temperature of 1300 °C, the phosphor powder had the lowest PL emission intensity, emitting only 7167 counts for a crystal size of approximately 35.12 ± 5.64 nm. As the temperature increased, the photoluminescence intensity gradually increased and eventually saturated at 1650 °C. The PL emission intensity increased proportionally with the increase in crystallite size for phosphor powders calcined at higher temperatures of 1400–1600 °C. The PL emission intensities that were correlated with the crystal size of 37.52 ± 2.38, 41.06 ± 4.05, and 41.81 ± 3.94 nm are 8964, 10,448, and 11,124 counts, respectively. However, at the calcination temperature of 1650 °C, the PL intensity decreased by only 10,307 counts, although the crystal size was the largest (42.77 ± 4.84 nm).

4. Discussion

The phase composition and surface morphologies of all Tb-doped yttrium-silicon-aluminum oxynitride powders at various calcination temperatures are discussed below. Initially, the XRD spectra confirmed the crystal structures consist of several phases, i.e., Y4SiAlO8N, Tb, and Y2Si2O7, which indicates that incorporation of dopant ion into the host matrix have been successfully synthesized using spray pyrolysis. As shown in Figure 1, the diffraction peaks of the crystal structure are attributed to the main of Y4SiAlO8N matrix and Tb activator phases only for the powders calcined at 1300–1600 °C, whereas those with calcination temperature of 1650 °C exhibited a secondary phase of Y2Si2O7. The presence of these three phases indicates that a higher temperature is required for the phosphor particles to provide a sufficient driving force for atoms to diffuse and migrate into a suitable lattice. The crystalline phases did not change significantly in the temperature range of 1400–1600 °C. The arrangement of atoms in the lattice causes the crystalline nature of the material; consequently, subjecting phosphor crystals to high temperatures increases their size. However, as the calcination temperature continued to increase to 1650 °C, a Y2Si2O7 peak appeared, indicating the formation of the secondary phase of the oxynitride host matrix. Y2Si2O7 is a typical dendritic glass phase formed during crystallization of the YSiAlON ceramic at a very high temperature (>1200 °C) [35]. Lindell and Thompson also observed that the melting temperature of the Y-Si-Al-O-N system exceeds that of SiO2 at 1700 °C [36]. Consequently, this secondary phase of the matrix reduces the intensity of the Y4SiAlO8N matrix at a calcination temperature of 1650 °C. In addition, to distinguish the degree of dispersion of the grain sizes in the different samples, the percentage coefficient of variation, which is the ratio of the percentage of the STD to the average crystal size (Dave), was calculated as a dimensionless quantity, using the following equation [37,38]:
Coefficient   of   variation   C . V . = STD D ave × 100 %
The calculated coefficients of variation were obtained at 16.06%, 6.34%, 9.86%, 9.42%, and 11.32%. This indicates the effect of calcination on the enhancement of grain growth, leading to improved crystallinity of the Y3.92SiAlO8N:0.08Tb3+ material. At a calcination temperature of 1650 °C, the increase dispersion of the grain size indicated the formation of an impure phase, which led to the growth of large crystals. Therefore, the optimum calcination temperature is 1600 °C, at which the phase-oxynitride phosphor of Y4SiAlO8N is obtained without a secondary phase. Furthermore, the optical microscope (OM) images (Figure S1) and respective particle size distribution histograms (Figure S2) support this hypothesis. As illustrated in Figure S1a, the as-received phosphor powder exhibits good dispersion with only a few small aggregates. In addition, as shown in Figure S1b, at a calcination temperature of 1300 °C, the number of small aggregates increases and begins to form larger aggregates, indicating agglomeration. Furthermore, large aggregates are predominant for samples with calcination temperatures of 1400, 1500, 1600, and 1650 °C, as shown in Figure S1c–f, respectively. The presence of large aggregates at higher calcination temperatures (1400–1650 °C) indicates that the degree of agglomeration is more severe at high temperatures. As shown in Figure S2, the size of the particles increased in direct proportion to the increase in the calcination temperature. The average particle sizes and standard deviations of the as-received Y3.92SiAlO8N:0.08Tb3+ and calcined phosphor powders at temperatures of 1300, 1400, 1500, 1600, or 1650 °C were measured from approximately 300 particles. The average particle size and their standard deviations were 11.85 ± 9.25, 12.88 ± 9.19, 14.11 ± 9.03, 14.74 ± 9.53, 15.501 ± 9.10, and 22.55 ± 14.10 µm for the as-received and calcined powders at temperatures of 1300, 1400, 1500, 1600, and 1650 °C, respectively.
Several factors that can enhance PL, such as chemical composition, specific surface area, and crystallite size, have been recognized [22,34]. In this report, we initially focused on examining the influence of chemical composition. As shown in Figure 4a–f, the XEDS results indicate that all Y3.92SiAlO8N:0.08Tb3 phosphor powders have similar chemical compositions, with negligible differences. In Figure 5a, it is shown that all calcined Y3.92SiAlO8N:0.08Tb3+ powders beside the first centered peaks consist of the second peak centered at 304 nm, which corresponds to the intra-transition band from the 4f–5d level of Tb3+ ion in the particle [39,40]. The excitation spectra indicated that all the excitation peaks showed either the 4f–5d spin-allowed transition or 5D1 HS state of Tb3+ [41]. Thus, the phosphor powder can facilitate facile energy transfer and enhance the emission between Tb3+ ions and the Y4SiAlO8N host [17]. Notably, the effect of composition on the PL properties was disregarded in this analysis. Furthermore, the BET data indicate that the specific surface area gradually increased with increasing calcination temperatures from 1300 to 1400 °C (37.75 to 42.32 m2 g−1). As shown in Figure S3, the as-received phosphor powder exhibited a specific surface area of approximately 35.63 m2·g−1. In addition, it exhibited similar specific surface areas of approximately 42.27 and 42.56 m2·g−1 at higher calcination temperatures of 1500 °C and 1600 °C, respectively. As the calcination temperature increased to 1650 °C, the specific surface area of the phosphor powder minimally increased to 46.31 m2·g−1. The increase in the specific surface area was not linear with increasing calcination temperature. In brief, no direct correlation was observed between the specific surface area and PL properties. This can be explained by the fact that after calcination at 1650 °C, Y3.92SiAlO8N:0.08Tb3+ phosphor powder has a high C.V. value, which indicates a high dispersion of the grain size. The wide dispersion of the grain size leads to crystal defect formation, which can decrease the luminescence intensity owing to the nonradiative recombination effect [42].
In addition, the calculated FWHM values of the emission intensities gradually decreased as the calcination temperature increased from 1300 to 1600 °C. The FWHM values of the emission intensities of the samples calcined at 1300–1600 °C are approximately 14.58, 14.50, 14.47, and 14.35 nm, respectively. However, a further increase in the calcination temperature to 1650 °C resulted in a subsequent increase in the FWHM value to 14.40 nm, indicating a quenching effect. Furthermore, at this temperature, the XRD pattern showed peaks corresponding to the Y2Si2O7. As reported by Dobrovolsky et al., the inhomogeneous composition of the matrix due to crystal phase transformation could also lead to a PL quenching effect [43]. Therefore, we conclude that the PL emission intensity is significantly affected by the crystallite size.

5. Conclusions

Tb-doped yttrium-silicon-aluminum oxynitride phosphors (Y3.92SiAlO8N:0.08Tb3+) were synthesized using the SP. The effect of the calcination temperature on the physical properties—crystalline structure, particle morphology, and chemical composition—was investigated. The crystalline structure (phase and size) effectively influenced the PL emission intensity. XRD analysis revealed that the activated Tb ion was successfully doped into the main phase of the host matrix Y4SiAlO8N, until the calcination temperature of 1600 °C caused a narrow green emission. At higher temperatures, the defects induced by the grain size and the inhomogeneous phase of the second matrix, Y2Si2O7, reduced the emission intensity. Thus, SP can potentially be used to fabricate green phosphor powders with narrow selective wavelengths.

Supplementary Materials

The following supporting information can be downloaded at: https://www.mdpi.com/article/10.3390/ceramics6040141/s1, Figure S1: OM images of (a) as-received powder and the Y3.92SiAlO8N:0.08Tb3+ powders calcined at the temperatures of (b) 1300, (c) 1400, (d) 1500, (e) 1600, and (f) 1650 °C.; Figure S2: Particle size distributions of (a) as-received powder and the Y3.92SiAlO8N:0.08Tb3+ powders calcined at the temperatures of (b) 1300, (c) 1400, (d) 1500, (e) 1600, and (f) 1650 °C.; Figure S3: Correlation between specific surface area as a function of calcination temperature.; Table S1: The phase distribution of Y3.92SiAlO8N:0.08Tb3+ phosphor powders calcined at different temperatures.

Author Contributions

Conceptualization, M.O., T.M. and S.-J.S.; data curation, Y.-H.H.; writing—original draft preparation, B.B.A.; writing—review and editing, B.B.A. and S.-J.S.; supervision, T.M. and S.-J.S.; funding acquisition, M.O. and S.-J.S. All authors have read and agreed to the published version of the manuscript.

Funding

The authors acknowledge the financial support from Tokushima University and the National Taiwan University of Science and Technology, Taiwan (Grant Numbers TU-NTUST-110-06 and TU-TaiwanTech-2022-2).

Institutional Review Board Statement

Not applicable.

Informed Consent Statement

Not applicable.

Data Availability Statement

The data are included in the main text and/or the supporting information.

Conflicts of Interest

The authors declare no conflict of interest.

References

  1. Nair, G.B.; Dhoble, S.J. 1—Introduction to luminescence. In The Fundamentals and Applications of Light-Emitting Diodes; Nair, G.B., Dhoble, S.J., Eds.; Woodhead Publishing: Sawston, UK, 2021; pp. 3–33. [Google Scholar]
  2. Satpute, N.S.; Dhoble, S.J. Chapter 14—Role of rare-earth ions for energy-saving LED lighting devices. In Energy Materials; Dhoble, S.J., Kalyani, N.T., Vengadaesvaran, B., Kariem Arof, A., Eds.; Elsevier: Amsterdam, The Netherlands, 2021; pp. 407–444. [Google Scholar]
  3. Cho, J.; Park, J.H.; Kim, J.K.; Schubert, E.F. White light-emitting diodes: History, progress, and future. Laser Photonics Rev. 2017, 11, 1600147. [Google Scholar] [CrossRef]
  4. Li, Y.; Ding, J.; Wu, Q.; Long, Q.; Wang, X.; Wang, Y. Blue to green emission and energy transfer between Ce3+ ions in Ca15Si20O10N30. J. Mater. Chem. C 2015, 3, 8949–8955. [Google Scholar] [CrossRef]
  5. Ito, Y.; Hori, T.; Kusunoki, T.; Nomura, H.; Kondo, H. A phosphor sheet and a backlight system providing wider color gamut for LCDs. J. Soc. Inf. Disp. 2014, 22, 419–428. [Google Scholar] [CrossRef]
  6. Bachmann, V.; Ronda, C.R.; Meijerink, A. Temperature Quenching of Yellow Ce3+ Luminescence in YAG:Ce. Chem. Mater. 2009, 21, 2077–2084. [Google Scholar] [CrossRef]
  7. Tran, N.T.; You, J.P.; Shi, F.G. Effect of Phosphor Particle Size on Luminous Efficacy of Phosphor-Converted White LED. J. Light. Technol. 2009, 27, 5145–5150. [Google Scholar] [CrossRef]
  8. Xia, Z.; Liu, Q. Progress in discovery and structural design of color conversion phosphors for LEDs. Prog. Mater. Sci. 2016, 84, 59–117. [Google Scholar] [CrossRef]
  9. Pust, P.; Schmidt, P.J.; Schnick, W. A revolution in lighting. Nat. Mater. 2015, 14, 454–458. [Google Scholar] [CrossRef]
  10. Xie, R.-J.; Hirosaki, N.; Takeda, T. Wide Color Gamut Backlight for Liquid Crystal Displays Using Three-Band Phosphor-Converted White Light-Emitting Diodes. Appl. Phys. Express 2009, 2, 022401. [Google Scholar] [CrossRef]
  11. Fang, M.-H.; Leaño, J.L., Jr.; Liu, R.-S. Control of Narrow-Band Emission in Phosphor Materials for Application in Light-Emitting Diodes. ACS Energy Lett. 2018, 3, 2573–2586. [Google Scholar] [CrossRef]
  12. Li, S.; Xie, R.-J.; Takeda, T.; Hirosaki, N. Critical Review—Narrow-Band Nitride Phosphors for Wide Color-Gamut White LED Backlighting. ECS J. Solid State Sci. Technol. 2018, 7, R3064. [Google Scholar] [CrossRef]
  13. Kim, Y.H.; Arunkumar, P.; Kim, B.Y.; Unithrattil, S.; Kim, E.; Moon, S.-H.; Hyun, J.Y.; Kim, K.H.; Lee, D.; Lee, J.-S.; et al. A zero-thermal-quenching phosphor. Nat. Mater. 2017, 16, 543–550. [Google Scholar] [CrossRef]
  14. Rao, R.P. Tb3 +  Activated Green Phosphors for Plasma Display Panel Applications. J. Electrochem. Soc. 2003, 150, H165. [Google Scholar] [CrossRef]
  15. Li, Y.; Yin, Y.; Wang, T.; Wu, J.; Zhang, J.; Yu, S.; Zhang, M.; Zhao, L.; Wang, W. Ultra-bright green-emitting phosphors with an internal quantum efficiency of over 90% for high-quality WLEDs. Dalton Trans. 2021, 50, 4159–4166. [Google Scholar] [CrossRef] [PubMed]
  16. Xu, Y.; Zhang, L.; Yin, S.; Wu, X.; You, H. Highly efficient green-emitting phosphors with high color rendering for WLEDs. J. Alloys Compd. 2022, 911, 165149. [Google Scholar] [CrossRef]
  17. Hua, Y.; Zhang, D.; Ma, H.; Deng, D.; Xu, S. Synthesis, luminescence properties and electronic structure of Tb3+-doped Y4−xSiAlO8N:xTb3+—A novel green phosphor with high thermal stability for white LEDs. RSC Adv. 2016, 6, 113249–113259. [Google Scholar] [CrossRef]
  18. Takeda, T.; Hirosaki, N.; Funahshi, S.; Xie, R.-J. Narrow-Band Green-Emitting Phosphor Ba2LiSi7AlN12:Eu2+ with High Thermal Stability Discovered by a Single Particle Diagnosis Approach. Chem. Mater. 2015, 27, 5892–5898. [Google Scholar] [CrossRef]
  19. Strobel, P.; Schmiechen, S.; Siegert, M.; Tücks, A.; Schmidt, P.J.; Schnick, W. Narrow-Band Green Emitting Nitridolithoalumosilicate Ba[Li2(Al2Si2)N6]: Eu2+ with Framework Topology whj for LED/LCD-Backlighting Applications. Chem. Mater. 2015, 27, 6109–6115. [Google Scholar] [CrossRef]
  20. Yoshimura, K.; Fukunaga, H.; Izumi, M.; Masuda, M.; Uemura, T.; Takahashi, K.; Xie, R.-J.; Hirosaki, N. White LEDs using the sharp β-sialon: Eu phosphor and Mn-doped red phosphor for wide-color gamut display applications. J. Soc. Inf. Disp. 2016, 24, 449–453. [Google Scholar] [CrossRef]
  21. Larker, R. Reaction Sintering and Properties of Silicon Oxynitride Densified by Hot Isostatic Pressing. J. Am. Ceram. Soc. 1992, 75, 62–66. [Google Scholar] [CrossRef]
  22. Hua, Y.; Li, X.; Zhang, D.; Ma, H.; Deng, D.; Xu, S. The crystal structure and luminescence properties of novel Ce3+ and Ce3+, Sm3+-activated Y4SiAlO8N phosphors for near-UV white LEDs. New J. Chem. 2016, 40, 5458–5466. [Google Scholar] [CrossRef]
  23. Segawa, H.; Yoshimizu, H.; Hirosaki, N.; Inoue, S. Fabrication of silica glass containing yellow oxynitride phosphor by the sol–gel process. Sci. Technol. Adv. Mater. 2011, 12, 034407. [Google Scholar] [CrossRef]
  24. Osip, H.; Czosnek, C.; Janik, J.F.; Marchewka, J.; Sitarz, M. Amorphous Silicon Oxynitride-Based Powders Produced by Spray Pyrolysis from Liquid Organosilicon Compounds. Materials 2021, 14, 386. [Google Scholar] [CrossRef] [PubMed]
  25. Liddell, K.; Mandal, H.; Thompson, D.P. X-ray data for new Y-Si-Al-O-N glass ceramics. J. Eur. Ceram. Soc. 1997, 17, 781–787. [Google Scholar] [CrossRef]
  26. Brinker, C.J.; Haaland, D.M. Oxynitride Glass Formation from Gels. J. Am. Ceram. Soc. 1983, 66, 758–765. [Google Scholar] [CrossRef]
  27. Shih, S.-J.; Lin, Y.-C.; Lin, S.-H.; Veteška, P.; Galusek, D.; Tuan, W.-H. Preparation and characterization of Eu-doped gehlenite glassy particles using spray pyrolysis. Ceram. Int. 2016, 42, 11324–11329. [Google Scholar] [CrossRef]
  28. Messing, G.L.; Zhang, S.-C.; Jayanthi, G.V. Ceramic Powder Synthesis by Spray Pyrolysis. J. Am. Ceram. Soc. 1993, 76, 2707–2726. [Google Scholar] [CrossRef]
  29. Joffin, N.; Caillier, B.; Garcia, A.; Guillot, P.; Galy, J.; Fernandes, A.; Mauricot, R.; Dexpert-Ghys, J. Phosphor powders elaborated by spray-pyrolysis: Characterizations and possible applications. Opt. Mater. 2006, 28, 597–601. [Google Scholar] [CrossRef]
  30. Shih, S.-J.; Lin, Y.-C.; Lin, S.-H.; Yu, C.-Y. Correlation of morphology and photoluminescence properties of gehlenite: Eu glassy phosphors. Int. J. Appl. Ceram. Technol. 2017, 14, 56–62. [Google Scholar] [CrossRef]
  31. Min, B.H.; Jung, K.Y. Synthesis and luminescence characteristics of fine-sized Ba3Si6O12N2:Eu green phosphor through spray pyrolysis using TEOS/Si3N4 mixed precursors. RSC Adv. 2017, 7, 44759–44765. [Google Scholar] [CrossRef]
  32. Gültekin, S.; Yıldırım, S.; Yılmaz, O.; Keskin, İ.Ç.; Katı, M.İ.; Çelik, E. Structural and optical properties of SrAl2O4: Eu2+/Dy3+ phosphors synthesized by flame spray pyrolysis technique. J. Lumin. 2019, 206, 59–69. [Google Scholar] [CrossRef]
  33. Mazlan, M.R.; Jamadon, N.H.; Rajabi, A.; Sulong, A.B.; Mohamed, I.F.; Yusof, F.; Jamal, N.A. Necking mechanism under various sintering process parameters—A review. J. Mater. Res. Technol. 2023, 23, 2189–2201. [Google Scholar] [CrossRef]
  34. Jung, K.Y.; Lee, C.H.; Kang, Y.C. Effect of surface area and crystallite size on luminescent intensity of Y2O3:Eu phosphor prepared by spray pyrolysis. Mater. Lett. 2005, 59, 2451–2456. [Google Scholar] [CrossRef]
  35. Dinger, T.R.; Rai, R.S.; Thomas, G. Crystallization Behavior of a Glass in the Y2O3-SiO2-AlN System. J. Am. Ceram. Soc. 1988, 71, 236–244. [Google Scholar] [CrossRef]
  36. Liddell, K.; Thompson, D.P. Heat treatment of wollastonite-type Y–Si–Al–O–N glasses. J. Mater. Sci. 1997, 32, 887–892. [Google Scholar] [CrossRef]
  37. Salkind, N.J. Encyclopedia of Research Design; SAGE Publications: Thousand Oaks, CA, USA, 2010. [Google Scholar]
  38. Spiridonova, T.I.; Tverdokhlebov, S.I.; Anissimov, Y.G. Investigation of the Size Distribution for Diffusion-Controlled Drug Release From Drug Delivery Systems of Various Geometries. J. Pharm. Sci. 2019, 108, 2690–2697. [Google Scholar] [CrossRef]
  39. Back, M.; Massari, A.; Boffelli, M.; Gonella, F.; Riello, P.; Cristofori, D.; Riccò, R.; Enrichi, F. Optical investigation of Tb3+-doped Y2O3 nanocrystals prepared by Pechini-type sol–gel process. J. Nanopart. Res. 2012, 14, 792. [Google Scholar] [CrossRef]
  40. Meng, Q.; Chen, B.; Xu, W.; Yang, Y.; Zhao, X.; Di, W.; Lu, S.; Wang, X.; Sun, J.; Cheng, L.; et al. Size-dependent excitation spectra and energy transfer in Tb3+-doped Y2O3 nanocrystalline. J. Appl. Phys. 2007, 102. [Google Scholar] [CrossRef]
  41. Park, K.; Kim, H.; Hakeem, D.A. Photoluminescence properties of Eu3+-and Tb3+-doped YAlO3 phosphors for white LED applications. Ceram. Int. 2016, 42, 10526–10530. [Google Scholar] [CrossRef]
  42. Schubert, E.F. Light-Emitting Diodes, 4th ed.; E. Fred Schubert: New York, NY, USA, 2023; pp. 4–14. [Google Scholar]
  43. Dobrovolsky, A.; Merdasa, A.; Unger, E.L.; Yartsev, A.; Scheblykin, I.G. Defect-induced local variation of crystal phase transition temperature in metal-halide perovskites. Nat. Commun. 2017, 8, 34. [Google Scholar] [CrossRef]
Figure 1. XRD patterns of as-received powder and the Y3.92SiAlO8N:0.08Tb3+ powders calcined at the temperatures of 1300, 1400, 1500, 1600, and 1650 °C.
Ceramics 06 00141 g001
Figure 2. Crystallite sizes of as-received powder and the Y3.92SiAlO8N:0.08Tb3+ powders calcined at the temperatures of 1300, 1400, 1500, 1600, and 1650 °C.
Ceramics 06 00141 g002
Figure 3. SEM images of (a) as-received powder and the Y3.92SiAlO8N:0.08Tb3+ powders calcined at the temperatures of (b) 1300, (c) 1400, (d) 1500, (e) 1600, and (f) 1650 °C.
Ceramics 06 00141 g003
Figure 4. EDS spectra of (a) as-received powder and the Y3.92SiAlO8N:0.08Tb3+ powders calcined at the temperatures of (b) 1300, (c) 1400, (d) 1500, (e) 1600, and (f) 1650 °C.
Ceramics 06 00141 g004
Figure 5. (a) Excitation (λem = 543 nm) and (b) emission spectra (λex = 251 nm) of Y3.92SiAlO8N:0.08Tb3+ phosphor powders calcined at the temperatures of 1300, 1400, 1500, 1600, and 1650 °C.
Ceramics 06 00141 g005
Figure 6. Correlation between photoluminescence intensity (5D47F5) and crystalline size for Y3.92SiAlO8N:0.08Tb3+ powders.
Ceramics 06 00141 g006
Disclaimer/Publisher’s Note: The statements, opinions and data contained in all publications are solely those of the individual author(s) and contributor(s) and not of MDPI and/or the editor(s). MDPI and/or the editor(s) disclaim responsibility for any injury to people or property resulting from any ideas, methods, instructions or products referred to in the content.

