
Inorganic Green Pigments Based on LaSr2AlO5

1
Department of Chemistry and Biotechnology, Faculty of Engineering, and Center for Research on Green Sustainable Chemistry, Tottori University, 4-101, Koyama-cho Minami, Tottori 680-8552, Japan
2
Field of Advanced Ceramics, Department of Life Science and Applied Chemistry, Nagoya Institute of Technology, Gokiso, Showa, Nagoya 466-8555, Japan
*
Author to whom correspondence should be addressed.
Ceramics 2023, 6(4), 2269-2281; https://doi.org/10.3390/ceramics6040138
Submission received: 29 September 2023
/
Revised: 25 October 2023
/
Accepted: 10 November 2023
/
Published: 22 November 2023
(This article belongs to the Special Issue Advances in Ceramics, 2nd Edition)
Abstract
:La1.03Sr1.97Al0.97M0.03O5 (M = Fe, Co, Ni, and Cu) samples were synthesized using a citrate sol–gel method to develop a novel environmentally friendly inorganic green pigment. Among them, the Co-doped sample exhibited a vivid yellow, but not green. Then, (La0.94Ca0.06)Sr2(Al0.97Mn0.03)O5 was synthesized and characterized with respect to the crystal structure, optical properties, and color. The sample was obtained in a single-phase form and the lattice volume was smaller than that of the (La0.94Ca0.06)Sr2AlO5 sample, indicating that Mn ions in the lattice of the sample were pentavalent. The sample exhibited optical absorption at a wavelength below 400 nm and around 650 nm. These absorptions were attributed to the ligand, the metal charge transfer (LMCT), and d-d transitions of Mn5+. Because the green light corresponding to 500 to 560 nm was reflected strongly, the synthesized sample exhibited a bright green color. (La0.94Ca0.06)Sr2(Al0.97Mn0.03)O5 showed high brightness (L* = 50.1) and greenness (a* = −20.8), and these values were as high as those of the conventional green pigments such as chromium oxide and cobalt green. Therefore, the (La0.94Ca0.06)Sr2(Al0.97Mn0.03)O5 pigment is a potential candidate for a novel environmentally friendly inorganic green pigment.
1. Introduction
Inorganic pigments are widely used as coloring materials for ceramics, glasses, plastics, and glazes because they have good thermal stabilities and resistances to climatic conditions. Among various colors, a greenish color makes us feel reposed, healed and relaxed; therefore, it has been used for a variety of applications. A characteristic of green is that it brings peaceful images of woods and forests. In addition, green signifies safety on traffic signs and public guideboards, and such feelings are widely accepted by people [1]. Thus, green is also used for information boards in evacuation centers and an emergency exits, etc. Moreover, because green is an intermediate color on the hue circle, it is used in various situations for harmonization with other colors.
Currently, chromium oxide (Cr2O3), chromium green, cobalt green (CoO·nZnO), and so on are used as commercially available inorganic green pigments. For Cr2O3, studies have been conducted to improve its optical reflectance properties by mixing it with TiO2, Al2O3, and V2O5 [2], or by substituting other metal ions at the Cr3+ site, as in Cr2−xAlxO3 [3]. Sangeetha et al. found that Cr2O3 added with rare earth elements improved the greenness of the reflectance without decreasing the greenness [4]. Cr3+ is not a harmful ion but Cr2O3 has been synthesized by reducing the Na2Cr2O7 or pyrolysis of CrO3, which contains Cr6+ [5]. Chromium green is composed of iron blue (Fe4[Fe(CN)6]3) and chrome yellow (PbCrO4) and is used in paints because of its high hiding power. However, chrome yellow contains Pb and Cr6+. Cr6+ is identified as a carcinogen by the International Agency for Research on Cancer (IARC), and so is well known as a highly toxic element. At the same time, Pb is identified as possible carcinogenesis. On the other hand, the safety of CoO in cobalt green has also been questioned due to the concern about adverse effects on the human body. The use of these pigments has been restricted because they contain harmful elements (e.g., Cd, Pb, and Cr) and CoO, which has deleterious effect on the human body and the environment. Therefore, there is a strong desire to develop environmentally friendly inorganic green pigments to replace harmful inorganic pigments.
Based on this background, in order to develop novel environmentally friendly inorganic green pigments, we took note of pentavalent manganese (Mn5+) ions as a coloring source. Mn ions are not only harmless but also inexpensive and exhibit various valences to be utilized in multiple applications. Mn5+ absorbs light with a wavelength of 400 nm or less based on ligand-to-metal charge transfer (LMCT) transition and d-d transition (3A2 → 3T1 (3P)) [6,7]. Visible light around 650 nm is also absorbed by d-d transition attributed to 3A2 → 3T1 (3F), and therefore, green coloration can be expected by using Mn5+. Although Mn5+ ions tend to be generally unstable, they can be stable in the following situation: Mn ions are substituted in tetrahedral sites as well as a host compound, which is comprised of larger ionic radius elements such as alkali earth metal (Sr and Ba) and smaller ionic radius elements such as P and Al [6]. Actually, various Mn5+-containing compounds have been reported [7,8,9,10,11,12] such as turquoise color pigments based on apatite-type Ba5Mn3−xMxO12Cl (M = V, P) [13] and Ba3(MO4)2:Mn5+ (M = V, P) phosphors [14].
We focused on LaSr2AlO5 as a host material because it contains only low toxicity elements. LaSr2AlO5 adopts a tetragonal structure (space group: I4/mcm) [15]. This complex oxide is stacked alternately with an 8-coordinated La3+/Sr2+ layer, a 10-coordinatd Sr2+ layer, and a 4-coordinated Al3+ layer through O2-. A number of papers have also reported the use of LaSr2AlO5 as a base material for photocatalysts and phosphors [15,16,17,18,19,20]. There are many compounds in which La3+ is replaced by other elements, but few in which the Al3+ is replaced.
In this study, therefore, La1.03Sr1.97Al0.97M0.03O5 (M = Fe, Co, Ni, and Cu) samples, whose Al3+ site was substituted by various transition metal elements, had their color properties characterized. Among them, the Co-doped sample exhibited a vivid yellow, but not green. Thus, La1−2xCa2xSr2Al1−xMnxO5 (x = 0 and 0.03) samples were synthesized to obtain a new environmentally friendly green pigment. The Al3+ site in the LaSr2AlO5 host was partially substituted by Mn5+ ions. At the same time, the La3+ site was replaced by Ca2+ for charge compensation. The color properties of the samples were evaluated and compared with commercially available inorganic green pigments.
2. Materials and Methods
2.1. Synthesis
The LaSr2(Al0.97Fe0.03)O5, La1.03Sr1.97(Al0.97M0.03)O5 (M: Ni and Cu), and La1+xSr2−x(Al1−xCox)O5 (x = 0, 0.03, 0.05 and 0.10) samples were synthesized using a citrate sol–gel method. La(NO3)3·6H2O (FUJIFILM Wako Pure Chemical Industries Ltd., Osaka, Japan, 99.9%), Sr(NO3)2 (FUJIFILM Wako Pure Chemical Industries Ltd., 98.0%), Al(NO3)3·9H2O (FUJIFILM Wako Pure Chemical Industries Ltd., 99.9%), Fe(NO3)3·9H2O (FUJIFILM Wako Pure Chemical Industries Ltd., 99.9%), Co(NO3)2·6H2O (FUJIFILM Wako Pure Chemical Industries Ltd., 99.5%), Cu(NO3)2·3H2O (FUJIFILM Wako Pure Chemical Industries Ltd., 99.9%), and Ni(NO3)2·6H2O (Kishida Chemical Co. Ltd., Osaka, Japan, 98.0%) were weighed so as to obtain the objective compositions and were dissolved in deionized water to adjust the La, Sr, and (Al + M) concentrations to 0.2 mol L−1. After the solution was stirred homogeneously, citric acid (FUJIFILM Wako Pure Chemical Industries Ltd., 98.0%) was added as a chelating agent to complex the cations into the solution in the mole ratio 2:1 with regard to the total cations (La, Sr, Al, and M). The mixed solution was stirred at 80 °C until a gel was obtained. Then, the gel was heated in an oven at 120 °C for 24 h and completely dried at 350 °C on a mantle heater. The dried gel was calcined in an alumina crucible at 500 °C for 8 h in air. After the calcination, the sample was heated again in an alumina boat at 1400 °C for 9 h in air. Before characterization, the sample was ground in an agate mortar with agate pestle.
(La1−2xCa2x)Sr2(Al1−xMnx)O5 (x = 0 and 0.03) samples were prepared by the same procedure described above. The starting materials, La(NO3)3·6H2O, Ca(NO3)2·4H2O (FUJIFILM Wako Pure Chemical Industries Ltd., 98.5%), Sr(NO3)2, Al(NO3)3·9H2O, and (CH3COO)2Mn·4H2O (FUJIFILM Wako Pure Chemical Industries Ltd., 99.9%), were weighed stoichiometrically.
2.2. Characterization
X-ray powder diffraction (XRD) was conducted using an X-ray diffractometer (Rigaku Corporation, Tokyo, Japan Ultima IV) to identify the crystal phase and structure. The XRD patterns were taken with Cu-Kα radiation operating with a tube voltage of 40 kV and a tube current of 40 mA. The data were collected by scanning over the 2θ range of 20–80°. The sampling width was 0.02° and the scan speed was 6° min−1. The lattice volumes were calculated from the XRD peak angles refined by α-Al2O3 as a standard and using the CellCalc Ver. 2.20 software. The Rietveld refinement of the resulting XRD patterns was performed by the RIETAN-FP software (version 3.12) package to determine the precise crystal structure [21]. From the Rietveld refinement, the following final R-factors were obtained: Rwp (R-weighed pattern), Rp (R-pattern), Re (R-expected), S (goodness-of-fit indicator), and RF (R-structure factor). The optical reflectance spectra of the as-prepared samples were recorded on an ultraviolet-visible (UV-Vis) spectrometer (JASCO Corporation, Tokyo, Japan, V-770 with an integrating sphere attachment) using a standard white plate as a reference. The step width was 1 nm and the scan rate was 1000 nm min−1. The color properties of the powder samples were evaluated in terms of the Commission Internationale de l’Éclairage (CIE) L*a*b*Ch° system using a colorimeter (Konica-Minolta, INC., Tokyo, Japan, CR-400). A standard C illuminant was used for the colorimetric measurements. The L* parameter indicates the brightness or darkness in a neutral grayscale. The a* values represent the red–green axes, and the b* value yellow–blue axes. The chroma parameter (C) means the color saturation and is calculated with the formula, C = [(a*)2 + (b*)2]1/2. The hue angle (h°) ranges from 0 to 360° and is calculated with the formula h° = tan−1(b*/a*). The standard deviations of all values for the L*a*b*Ch° color coordinate data were less than 0.1.
3. Results and Discussion
3.1. La1+xSr2−x(Al1−xMx)O5 (M: Fe, Co, Ni, and Cu)
3.1.1. X-ray Powder Diffraction (XRD)
Figure 1 shows the XRD patterns of the LaSr2AlO5, LaSr2(Al0.97Fe0.03)O5, and La1.03Sr1.97(Al0.97M0.03)O5 (M: Co, Ni, and Cu) samples. In the sample containing Fe, the objective LaSr2AlO5 phase was obtained in a single-phase form. On the other hand, in the samples containing Co, Ni, and Cu, the target LaSr2AlO5 phase was obtained as the main phase, but a few peaks of SrLaAlO4 and SrLaNiO4 were observed as impurities, resulting in a mixed phase.
3.1.2. Ultraviolet-Visible (UV-Vis) Reflectance Spectra
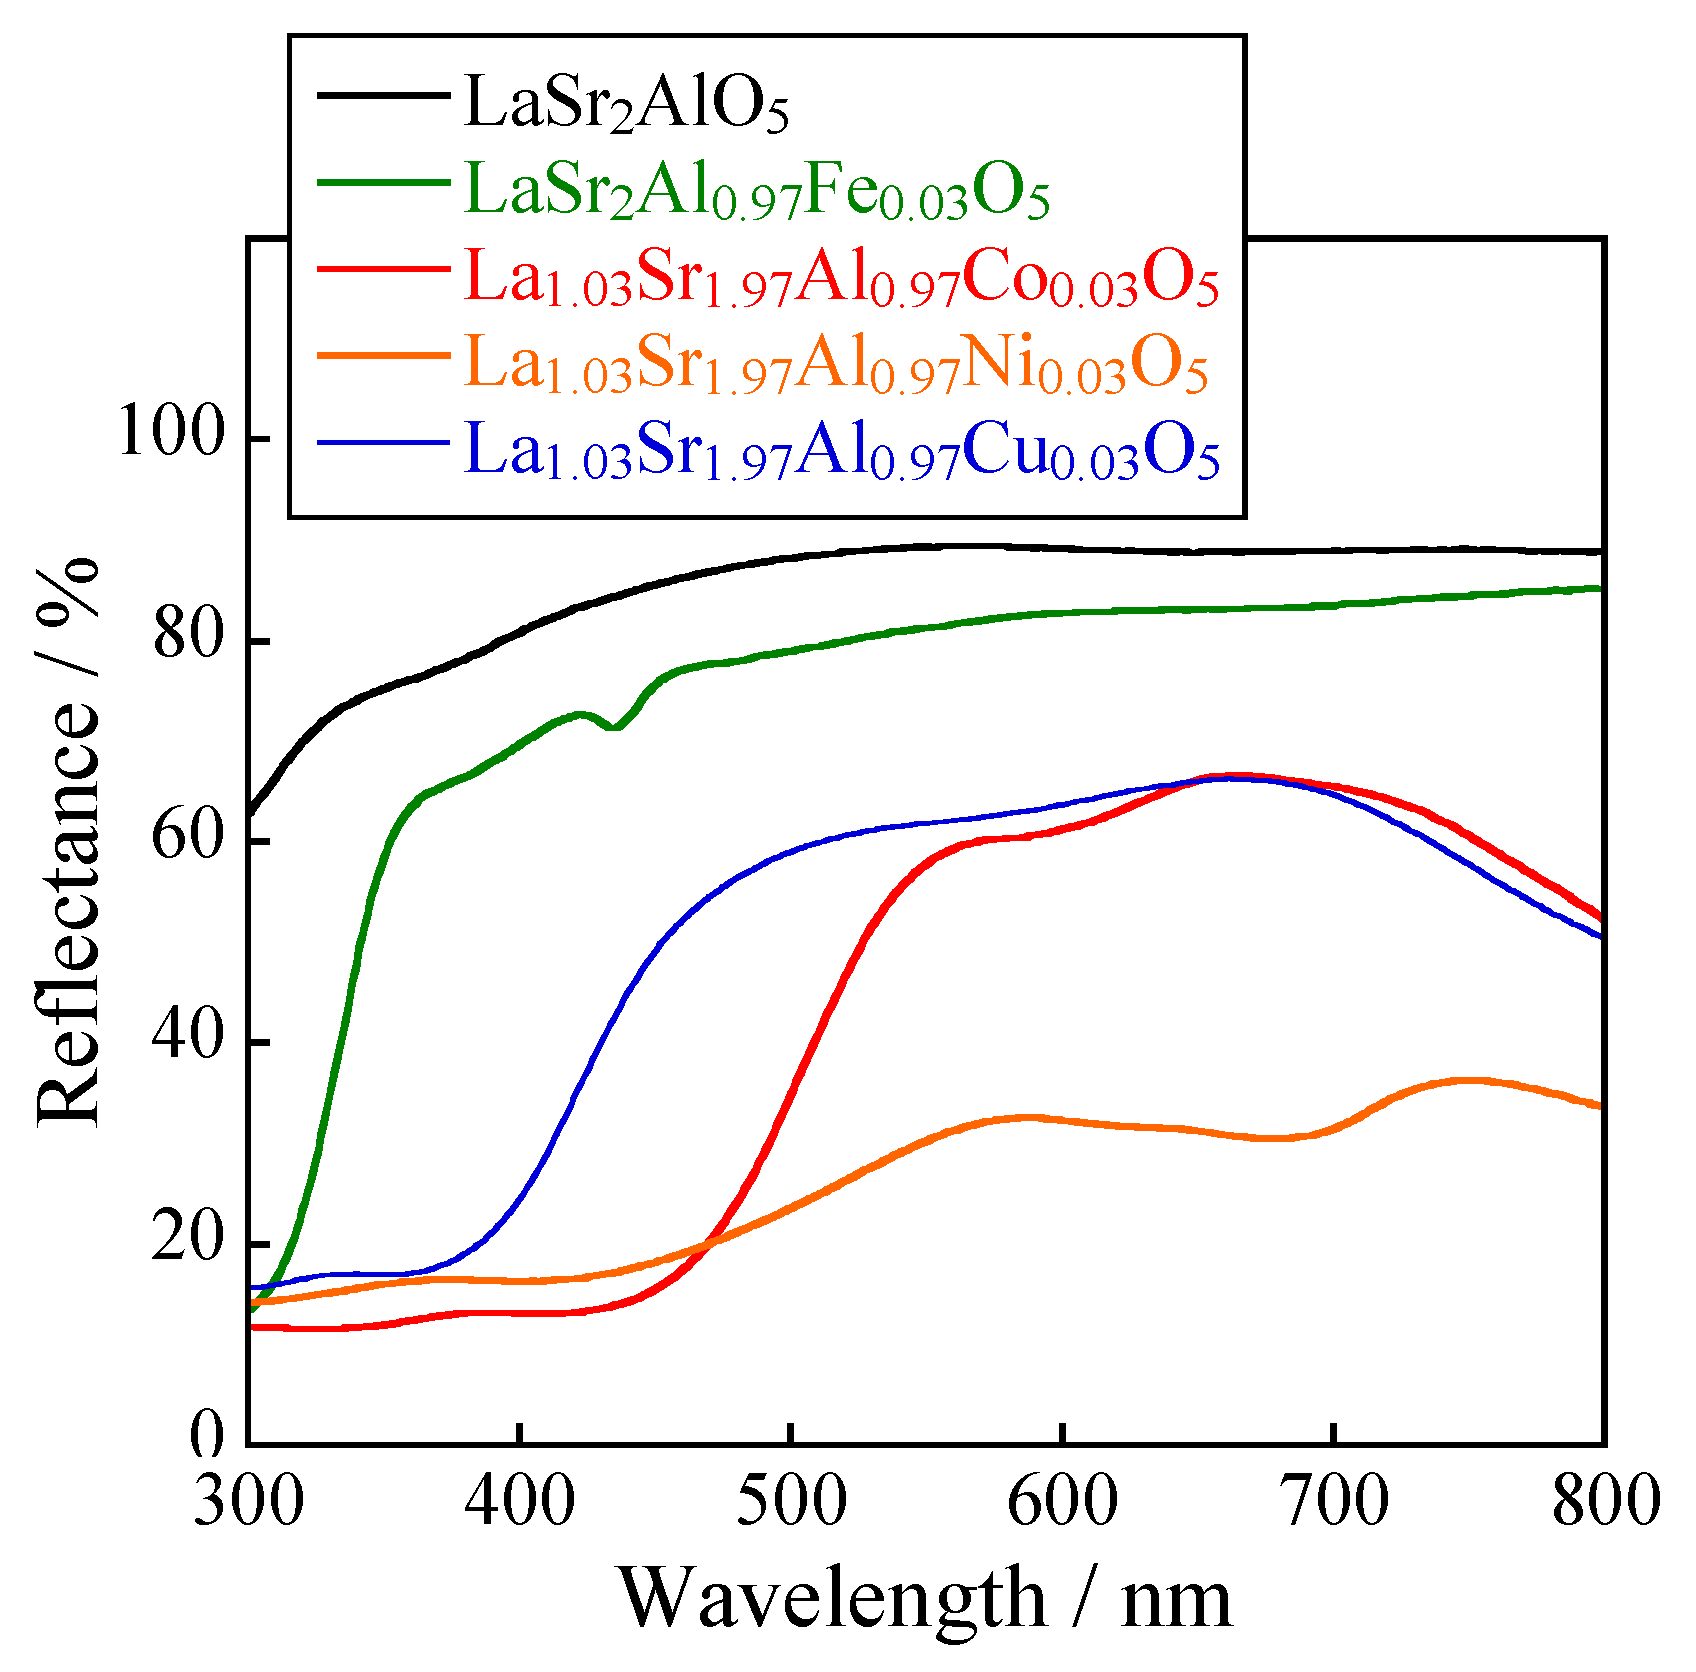
The UV-Vis reflectance spectra of LaSr2AlO5, LaSr2(Al0.97Fe0.03)O5 and La1.03Sr1.97(Al0.97M0.03)O5 (M: Co, Ni, and Cu) are depicted in Figure 2. In the case of M = Fe, weak optical absorption due to the d-d transition of Fe3+ [22] was observed in the visible region around 420 nm. When M was Ni, the sample absorbed visible light around 650 nm because of the d-d transition of Ni2+ [23]. The sample with Cu absorbed visible light less than 400 nm and longer than 700 nm. These absorptions were attributed to the charge transfer between O2p-Cu3d orbitals and the d-d transition of Cu2+ [24]. In the sample with Co, visible light less than 450 nm was absorbed, which was based on the charge transfer transition between O2p-Co3d orbitals and the d-d transition of Co2+ [25,26]. In general, the energy gap of the d-d transition of Co2+ at the tetrahedral site corresponds to green–red light from 530 to 630 nm. In this study, the Al3+ site (ionic radius: 0.039 nm, 4-coordination [27]) was substituted with Co2+ (ionic radius: 0.058 nm, 4-coordination [27]), resulting in a stronger crystal field surrounding Co2+ and the absorption of higher energy light around 450 nm, corresponding to the blue light region.
3.1.3. Color Property
The L*a*b*Ch° color coordinate data of the LaSr2AlO5, LaSr2(Al0.97Fe0.03)O5, and La1.03Sr1.97(Al0.97M0.03)O5 (M: Co, Ni, and Cu) powder samples are summarized in Table 1. The sample photographs are also shown in Figure 3. The LaSr2AlO5 sample reflected the entire visible light region and was white. For M = Fe3+ and Cu2+, the visible light region was almost completely reflected due to the weak d-d transition, and the samples were almost white. The sample with Ni2+ was a dingy green. This is due to the impurity phase of SrLaNiO4, which reduces the reflectance of visible light. In the case of Co2+ doping, a bright yellow color was obtained. In general, Co2+ ions exhibit a vivid blue color in tetrahedral coordination, as in cobalt blue (CoAl2O4) [28,29]. In the Co-doped sample in this study, Co2+ is also in a 4-coodinated environment. Despite this, interestingly, the sample exhibited a yellow color. This is a rare case.
To investigate the composition dependence of the yellow-colored Co-doped samples, La1+xSr2−x(Al1−xCox)O5 (x = 0.03, 0.05, and 0.10) samples were synthesized. X-ray powder diffraction measurements showed that the samples with x = 0.05 and 0.10 were mixed phases, as was the sample with x = 0.03, but the target LaSr2AlO5 phase was obtained as the main phase. The Co2+ content dependence on the lattice volume of the samples is summarized in Table 2. Since the ionic radius of Co2+ (0.090 nm, 8-coordination [27]) is smaller than that of Sr2+ (0.126 nm, 8-coordination [27])/La3+ (0.116 nm, 8-coordination [27]), the lattice volume should shrink when the 8-coordination Sr(1)/La sites in the host material are replaced with Co2+. However, the lattice volume of the sample increased with Co2+ content up to x = 0.05. As noted above, this indicates that the Al3+ sites in the host lattice were partially replaced by larger Co2+ ions. Therefore, the chromophore in this sample is considered to be a 4-coordinated Co2+ ion.
Table 3 summarizes the L*a*b*Ch° color coordinate data for La1+xSr2−x(Al1−xCox)O5 (x = 0, 0.03, 0.05, and 0.10). The sample photographs are also shown in Figure 4. All samples exhibited a yellow color but become slightly darker with increasing Co2+ concentration.
Unfortunately, the LaSr2(Al0.97Fe0.03)O5 and La1.03Sr1.97(Al0.97M0.03)O5 (M: Co, Ni, and Cu) samples did not exhibit a green color, so we synthesized (La1−2xCa2x)Sr2(Al1−xMnx)O5 (x = 0, 0.03) and characterized it in the next section.
3.2. (La1−2xCa2x)Sr2(Al1−xMnx)O5 (x = 0 and 0.03)
3.2.1. X-ray Powder Diffraction (XRD)
Figure 5 shows the XRD patterns of the (La1−2xCa2x)Sr2(Al1−xMnx)O5 (x = 0 and 0.03) and (La0.94Ca0.06)Sr2AlO4.97 samples. All samples were obtained in a single-phase form. The lattice volume of each sample was calculated from the XRD peak angles and is summarized in Table 4. The lattice volume decreased in the order of undoped > Ca2+-doped > Ca2+-Mn5+ co-doped. In (La0.94Ca0.06)Sr2AlO4.97, some of the La3+ (ionic radius: 0.116 nm, 8-coordination [27]) ions in LaSr2AlO5 were replaced by smaller Ca2+ ions (ionic radius: 0.112 nm, 8-coordination [27]), which resulted in the lattice volume contraction. In the sample co-doped with Ca2+ and Mn5+, the lattice volume was further decreased. The ionic radii of the 4-coordinated Mn2+ and Mn4+ are 0.039 and 0.066 nm, respectively [27], and those are equal to or larger than Al3+ (ionic radius: 0.039 nm, 4-coordination [27]), so the lattice volume in Table 4 should be the same or increase when Mn2+ or Mn4+ is dissolved in the Al3+ site, but it actually decreased. Accordingly, the decrease in lattice volume was not only because La3+ was substituted with Ca2+, but also because some of the Al3+ ions in the host material were replaced by smaller Mn5+ ions (ionic radius: 0.033 nm, 4-coordination [27]), although the substitution by Mn6+ is also in accordance with this result.
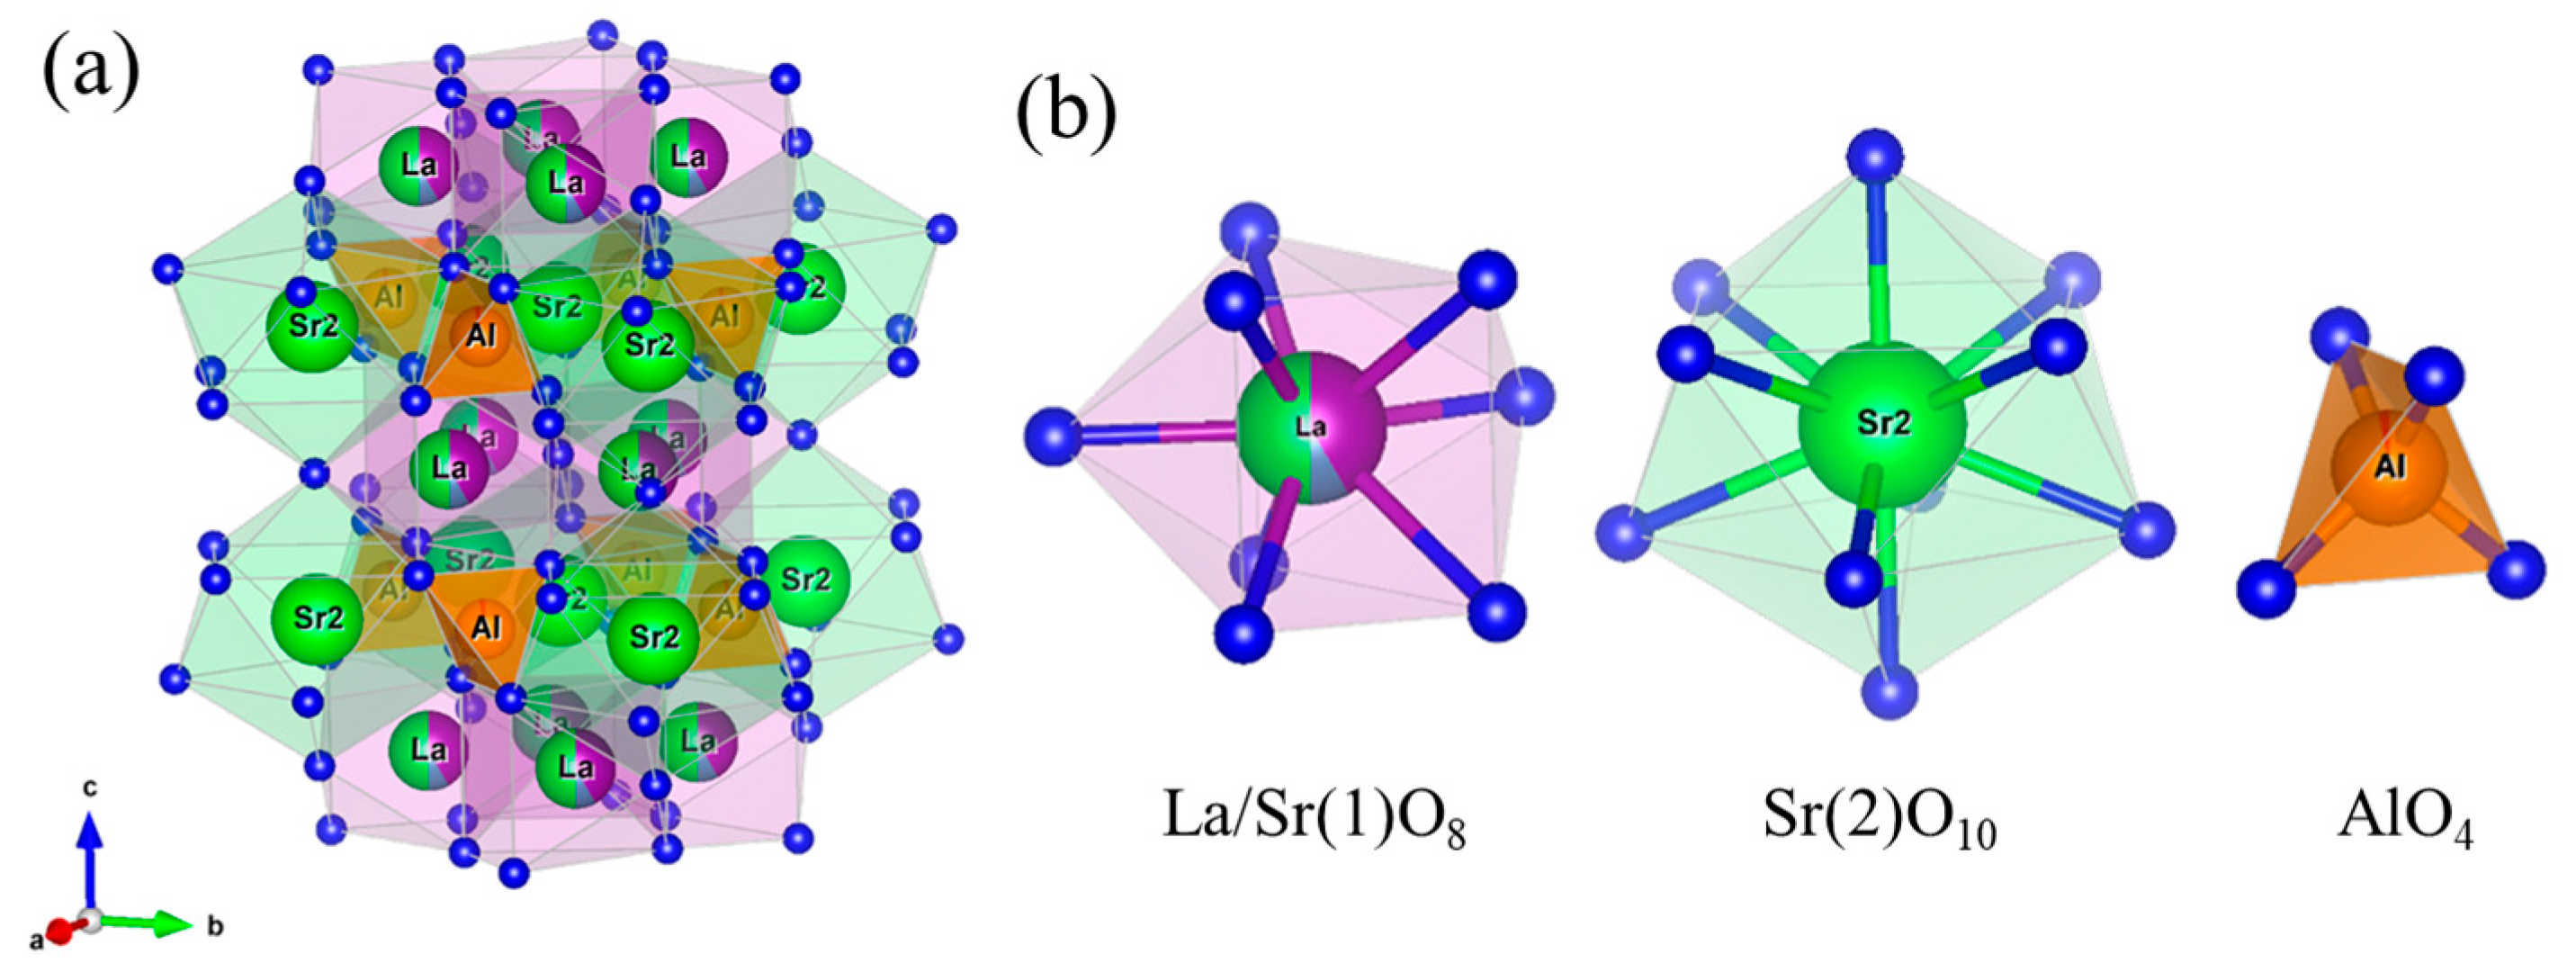
The Rietveld analysis of the XRD patterns of LaSr2AlO5, (La0.94Ca0.06)Sr2AlO4.97, and (La0.94Ca0.06)Sr2(Al0.97Mn0.03)O5 was performed to determine the average La–O, Sr–O, and Al–O bond length. The Rietveld refinement profiles of the samples are shown in Figure 6. The detailed crystallographic data are summarized in Table 5. The refined structural parameters of the samples are tabulated in Table 6. The crystallographic parameters of LaSr2AlO5 reported by W. B. Im et al. [15] were employed as the initial structure for fitting. The refined crystal structure of (La0.94Ca0.06)Sr2(Al0.97Mn0.03)O5 illustrated by the VESTA program [30] is shown in Figure 7, where the Ca2+ and Mn5+ cations in (La0.94Ca0.06)Sr2(Al0.97Mn0.03)O5 were located at octahedral and tetrahedral sites, respectively. The average bond lengths of La−O, Sr(2)−O, and Al−O for the LaSr2AlO5, (La0.94Ca0.06)Sr2AlO4.97, and (La0.94Ca0.06)Sr2(Al0.97Mn0.03)O5 samples are summarized in Table 7. In the case of (La0.94Ca0.06)Sr2AlO4.97, the average Al−O bond length was longer than in LaSr2AlO5. This is because some of the La3+ (ionic radius: 0.116 nm, 8-coordination [27]) sites in LaSr2AlO5 were replaced by smaller Ca2+ ions (ionic radius: 0.112 nm, 8-coordination [27]), resulting in a shorter average La−O bond length. On the other hand, the average Al−O bond length of the (La0.94Ca0.06)Sr2(Al0.97Mn0.03)O5 sample was shorter than that of the (La0.94Ca0.06)Sr2AlO4.97 sample. This is considered to be because some of the Al3+ ions (ionic radius: 0.039 nm, 4-coordination [27]) in (La0.94Ca0.06)Sr2AlO4.97 were replaced by smaller Mn5+ (ionic radius: 0.033 nm, 4-coordination [27]) ions, resulting in shorter average Al−O bond length. Consequently, Mn ions are present as Mn5+ in the lattice of the (La0.94Ca0.06)Sr2(Al0.97Mn0.03)O5 sample.
3.2.2. Ultraviolet-Visible (UV-Vis) Reflectance Spectra
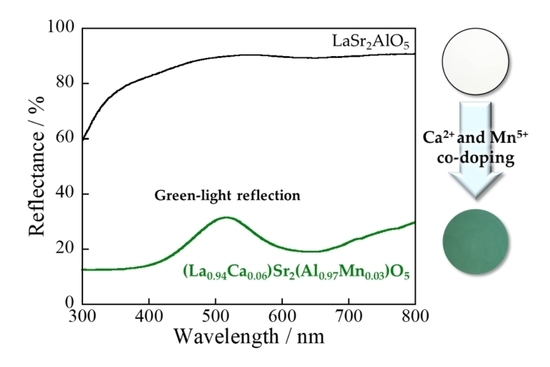
Figure 8 shows the UV-Vis reflectance spectra of the LaSr2AlO5, (La0.94Ca0.06)Sr2AlO4.97, and (La0.94Ca0.06)Sr2(Al0.97Mn0.03)O5 samples. The results confirm the presence of Mn5+ ions in the co-doped sample. The samples without Mn5+ reflected totally visible light to exhibit a white color. On the other hand, the Mn5+-doped sample strongly absorbed the light at wavelengths below 400 nm and around 650 nm. The former absorption was assigned to the combination of LMCT transition and the d-d transition attributed to the 3A2 to 3T1 (3P) transition of Mn5+ [6,7]. The latter was attributed to the d-d transition corresponding to the 3A2 to 3T1 (3F) transition of Mn5+ [6,7]. As a result, the (La0.94Ca0.06)Sr2(Al0.97Mn0.03)O5 sample only reflected light around 520 nm corresponding to green light, and showed a green color. If Mn ions are hexavalent, optical absorption based on Mn6+ ions appears at wavelengths below 450 nm and around 550 nm, due to the LMCT transition as well as the 2E1 to 2T1 transition of Mn6+ [6]. In that case, the sample should show an indigo color, not green. These crystallographic and optical reflectance properties support the fact that Mn ions are present not as Mn6+ but Mn5+ in the sample.
3.2.3. Color Properties
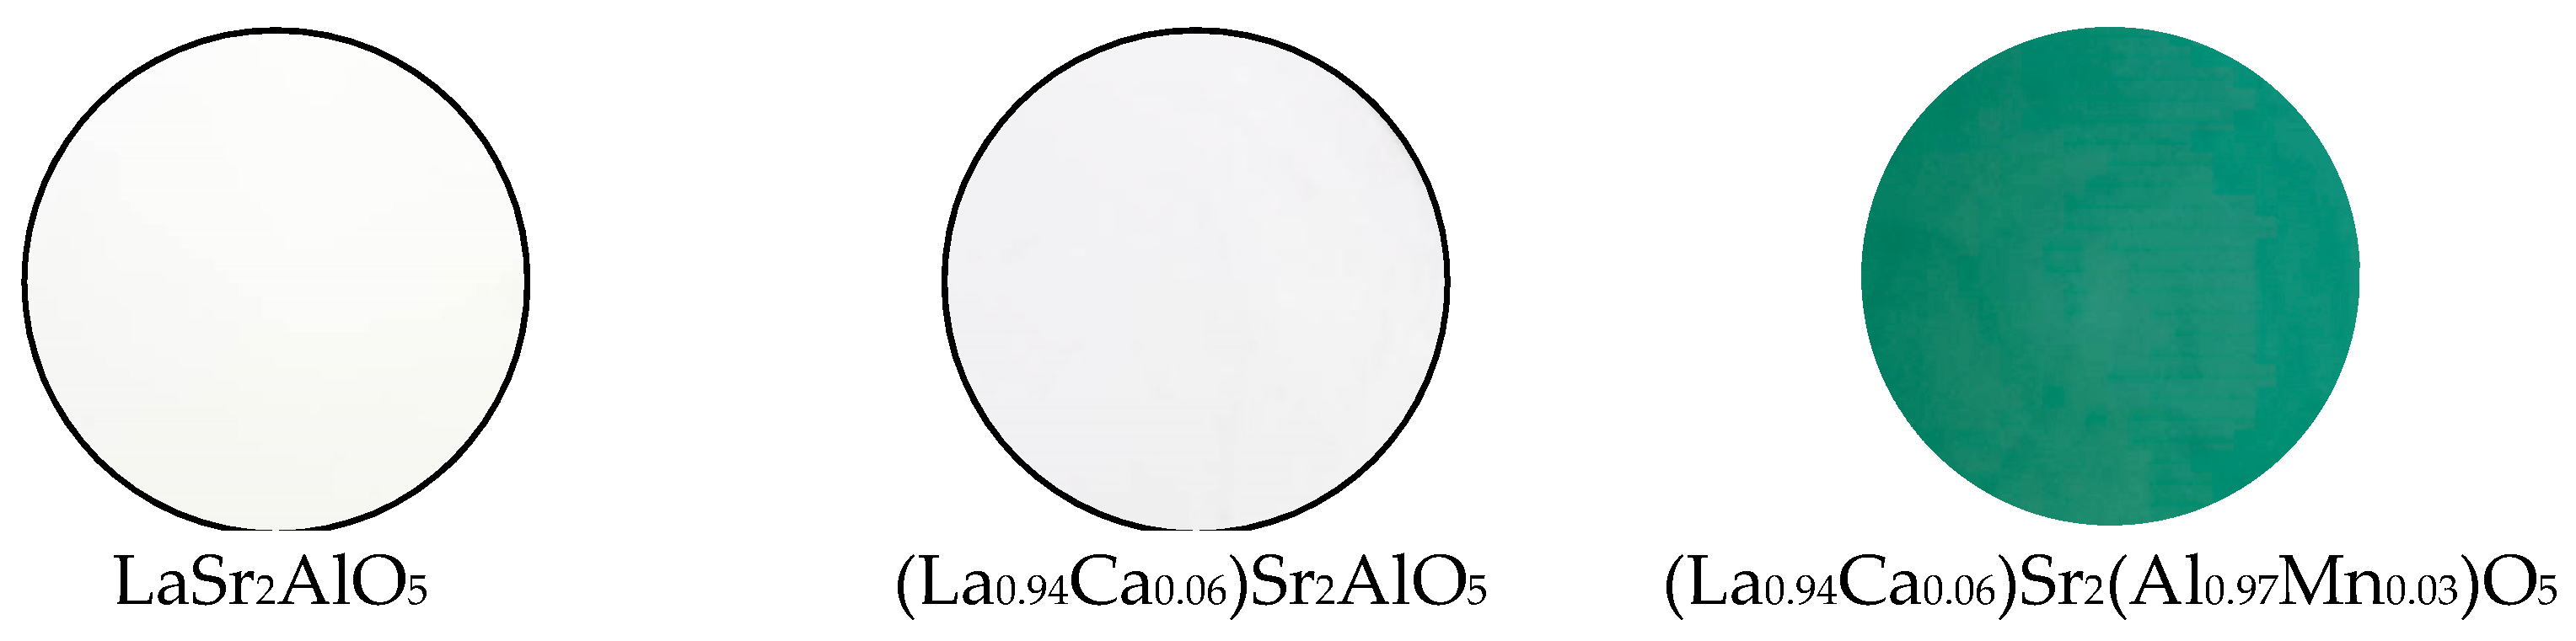
The L*a*b*Ch° color coordinate data for the LaSr2AlO5, (La0.94Ca0.06)Sr2AlO4.97, and (La0.94Ca0.06)Sr2(Al0.97Mn0.03)O5 pigments are summarized in Table 8. The photographs are also displayed in Figure 9. As discussed for the UV-Vis reflectance spectra in Figure 8, the samples without Mn5+ exhibited a white color due to the total reflection of visible light. For the (La0.94Ca0.06)Sr2(Al0.97Mn0.03)O5 pigment, a bright green color with a high L* value (50.1) and a negatively high a* value (−20.8) was achieved because the sample intensely reflected green light around 500~560 nm.
3.2.4. Comparison with Commercially Available Pigments
The color parameters of the (La0.94Ca0.06)Sr2(Al0.97Mn0.03)O5 sample were compared with those of the commercial green pigments such as chromium green (Cr2O3) and cobalt green deep and pale (CoO·ZnO), as listed in Table 9. Their photographs are also shown in Figure 10. The absolute value of a* of the (La0.94Ca0.06)Sr2(Al0.97Mn0.03)O5 pigment was as high as those of the commercial pigments. The b* of the synthesized pigment was positive and low, so its hue angle (h°) was 160°, close to 180°, which means the purest green color. Chromium oxide had negative high a* and positive high b* values, giving it a yellowish green color. Although the h° of cobalt green deep was the most ideal, its brightness (L*) was lower than those of the other pigments, giving it a dark green color. Cobalt green pale had a higher absolute value of a* but a negative b* value, giving it a bluish green color. These results indicate that the color property of the (La0.94Ca0.06)Sr2(Al0.97Mn0.03)O5 pigment is well balanced for an environmentally friendly inorganic green pigment.
4. Conclusions
The (La0.94Ca0.06)Sr2(Al0.97Mn0.03)O5 sample was synthesized as an environmentally friendly inorganic green pigment. The sample was obtained in a single-phase form and the lattice volume was reduced compared with those of LaSr2AlO5 and (La0.94Ca0.06)Sr2AlO4.97. These results indicate that a solid solution was successfully obtained, and Mn ions are present in the lattice as Mn5+. The (La0.94Ca0.06)Sr2(Al0.97Mn0.03)O5 sample exhibited optical absorption in visible light at wavelengths below 400 nm and around 650 nm due to the LMCT and d-d transitions of Mn5+. Therefore, this sample strongly reflected green light between 500 and 560 nm, and showed a bright green color. (La0.94Ca0.06)Sr2(Al0.97Mn0.03)O5 exhibited negatively high a* (−20.8) and h° (160), which were comparable to those of the conventional green pigments containing toxic elements. In conclusion, (La0.94Ca0.06)Sr2(Al0.97Mn0.03)O5 could be a novel environmentally friendly inorganic green pigment.
Author Contributions
The following are the author contributions to this study: conceptualization, R.O. and T.M.; methodology, K.Y., R.O. and T.M.; validation, K.Y., R.O. and T.M.; investigation, K.Y., A.T., S.F. and R.O.; data curation, K.Y, A.T., S.F., R.O. and T.M.; writing—original draft preparation, K.Y.; writing—review and editing, T.M.; supervision, T.M.; funding acquisition, T.M. All authors have read and agreed to the published version of the manuscript.
Funding
This research was funded by JSPS KAKENHI, grant numbers JP22K04698 and JP20H02439.
Institutional Review Board Statement
Not applicable.
Informed Consent Statement
Not applicable.
Data Availability Statement
Data are contained within the article.
Conflicts of Interest
The authors declare no conflict of interest.
References
- Valdez, P.; Mehrabian, A. Effects of Color on Emotions. J. Exp. Psychol.-Gen. 1994, 123, 394–409. [Google Scholar] [CrossRef]
- Thongkanluang, T.; Kittiauchawal, T.; Limsuwan, P. Preparation and Characterization of Cr2O3–TiO2–Al2O3–V2O5 Green Pigment. Ceram. Int. 2011, 37, 543–548. [Google Scholar] [CrossRef]
- Muñoz, R.; Masó, N.; Julián, B.; Márquez, F.; Beltrán, H.; Escribano, P.; Cordoncillo, E. Environmental Study of Cr2O3–Al2O3 Green Ceramic Pigment Synthesis. J. Eur. Ceram. Soc. 2004, 24, 2087–2094. [Google Scholar] [CrossRef]
- Sangeetha, S.; Basha, R.; Sreeram, K.J.; Sangilimuthu, S.N.; Unni Nair, B. Functional Pigments from Chromium(III) Oxide Nanoparticles. Dyes Pigment. 2012, 94, 548–552. [Google Scholar] [CrossRef]
- Zhang, Y.; Li, Z.-H.; Qi, T.; Zheng, S.-L.; Li, H.-Q.; Xu, H.-B. Green Manufacturing Process of Chromium Compounds. Environ. Prog. 2005, 24, 44–50. [Google Scholar] [CrossRef]
- Cao, R.; Qiu, J.; Yu, X.; Sun, X. Spectroscopic Investigation on BaSO4: (Mn6+, Mn5+) Crystal. ECS J. Solid State Sci. Technol. 2013, 2, R237–R240. [Google Scholar] [CrossRef]
- Dardenne, K.; Vivien, D.; Huguenin, D. Color of Mn(V)-Substituted Apatites A10((B, Mn)O4)6F2, A=Ba, Sr, Ca; B=P, V.J. Solid State Chem. 1999, 146, 464–472. [Google Scholar] [CrossRef]
- Han, Y.; Ye, X.; Zhu, H.; Li, Y.; Kuang, X. New Oxygen-Deficient Cationic-Ordered Perovskites Containing Turquoise-Coloring Mn5+O4 Tetrahedral Layers. J. Solid State Chem. 2017, 247, 20–23. [Google Scholar] [CrossRef]
- Gschwend, P.M.; Niedbalka, D.; Gerken, L.R.H.; Herrmann, I.K.; Pratsinis, S.E. Simultaneous Nanothermometry and Deep-Tissue Imaging. Adv. Sci. 2020, 7, 2000370. [Google Scholar] [CrossRef]
- Zheng, W.-C.; Wu, X.-X.; Fan, Y.-J. Studies of EPR Parameters for Mn5+-Doped Li3PO4 and Li3VO4 Crystals. Spectrochim. Acta A 2007, 66, 102–105. [Google Scholar]
- Laha, S.; Tamilarasan, S.; Natarajan, S.; Gopalakrishnan, J. Stabilization of a Tetrahedral (Mn5+O4) Chromophore in Ternary Barium Oxides as a Strategy toward Development of New Turquoise/Green-Colored Pigments. Inorg. Chem. 2016, 55, 3508–3514. [Google Scholar] [CrossRef]
- Herren, M.; Riedener, T.; Güdel, H.U.; Albrecht, C.; Kaschuba, U.; Reinen, D. Near-Infrared Luminescence of Manganate(V)-Doped Phosphates and Vanadates. J. Lumin. 1992, 53, 452–456. [Google Scholar] [CrossRef]
- Medina, E.A.; Li, J.; Stalick, J.K.; Subramanian, M.A. Intense Turquoise Colors of Apatite-Type Compounds with Mn5+ in Tetrahedral Coordination. Solid State Sci. 2016, 52, 97–105. [Google Scholar] [CrossRef]
- Zhang, X.; Li, Y.; Hu, Z.; Chen, Z.; Qiu, J. A General Strategy for Controllable Synthesis of Ba3(MO4)2:Mn5+ (M = V, P) Nanoparticles. RSC Adv. 2017, 7, 10564–10569. [Google Scholar] [CrossRef]
- Im, W.B.; Fellows, N.N.; DenBaars, S.P.; Seshadri, R.; Kim, Y.-I. LaSr2AlO5, a Versatile Host Compound for Ce3+-Based Yellow Phosphors: Structural Tuning of Optical Properties and Use in Solid-State White Lighting. Chem. Mater. 2009, 21, 2957–2966. [Google Scholar] [CrossRef]
- Unithrattil, S.; Kim, H.J.; Im, W.B. Phase Formation and Luminescence Properties of Ternary Solid-Solution among Tetragonal Systems. J. Alloys Compd. 2019, 798, 635–643. [Google Scholar] [CrossRef]
- García, C.R.; Oliva, J.; Díaz-Torres, L.A. Photocatalytic Activity of LaSr2AlO5:Eu Ceramic Powders. Photochem. Photobiol. 2015, 91, 505–509. [Google Scholar] [CrossRef]
- Rodríguez-García, C.E.; Perea-López, N.; Raymond, O.; Hirata, G.A. Photoluminescence Properties of Eu-Doped LaSr2AlO5. Sci. Adv. Mater. 2012, 4, 563–567. [Google Scholar] [CrossRef]
- Gu, X.; Fu, R.; Jiang, W.; Zhang, P.; Tang, Y.; Coşgun, A. Photoluminescence Properties of an Orange-Red LaSr2AlO5:Sm3+ Phosphor Prepared by the Pechini-Type Sol-Gel Process. J. Rare Earths 2015, 33, 954–960. [Google Scholar] [CrossRef]
- Oliva, J.; García, C.R.; Díaz Torres, L.A.; Camacho, C.; Guzman-Rocha, M.; Romero, M.T.; Hirata, G.A. Effect of the Er3+ Co-Dopant on the Green Upconversion Emission of LaSr2AlO5:Yb3+ Phosphors. J. Electron. Mater. 2018, 47, 6567–6574. [Google Scholar] [CrossRef]
- Izumi, F.; Momma, K. Three-Dimensional Visualization in Powder Diffraction. Solid State Phenom. 2007, 130, 15–20. [Google Scholar] [CrossRef]
- Zhao, M.; Han, A.; Ye, M.; Wu, T. Preparation and Characterization of Fe3+ Doped Y2Ce2O7 Pigments with High near-Infrared Reflectance. Sol. Energy 2013, 97, 350–355. [Google Scholar] [CrossRef]
- Thieme, C.; Rüssel, C. Temperature Resistant Red and Purple Ceramic Pigments Based on the Solid Solution Series BaZn2-xNixSi2O7 and BaMg2−xNi2−xSi2O7. Dyes Pigment. 2014, 111, 75–80. [Google Scholar] [CrossRef]
- Saraswathy, D.; Prabhakar Rao, P.; Raj, A.K.V.; Ajuthara, T.R. Enhanced Pigmentary Properties of Rare Earth Germanates of the Type La2CuGe2O8 through CuO6 Octahedron Distortion. Dyes Pigment. 2017, 142, 472–480. [Google Scholar] [CrossRef]
- Meseguer, S.; Tena, M.A.; Gargori, C.; Galindo, R.; Badenes, J.A.; Llusar, M.; Monrós, G. Development of Blue Ceramic Dyes from Cobalt Phosphates. Ceram. Int. 2008, 34, 1431–1438. [Google Scholar] [CrossRef]
- Kuleshov, N.V.; Mikhailov, V.P.; Scherbitsky, V.G.; Prokoshin, P.V.; Yumashev, K.V. Absorption and Luminescence of Tetrahedral Co2+ Ion in MgAl2O4. J. Lumin. 1993, 55, 265–269. [Google Scholar] [CrossRef]
- Shannon, R.D. Revised Effective Ionic Radii and Systematic Studies of Interatomic Distances in Halides and Chalcogenides. Acta Cryst. 1976, 32, 751–767. [Google Scholar] [CrossRef]
- Llusar, M.; Forés, A.; Badenes, J.A.; Calbo, J.; Tena, M.A.; Monrós, G. Colour Analysis of Some Cobalt-Based Blue Pigments. J. Eur. Ceram. Soc. 2001, 21, 1121–1130. [Google Scholar] [CrossRef]
- Gaudon, M.; Robertson, L.C.; Lataste, E.; Duttine, M.; Ménétrier, M.; Demourgues, A. Cobalt and Nickel Aluminate Spinels: Blue and Cyan Pigments. Ceram. Int. 2014, 40, 5201–5207. [Google Scholar] [CrossRef]
- Momma, K.; Izumi, F. VESTA 3 for Three-Dimensional Visualization of Crystal, Volumetric and Morphology Data. J. Appl. Crystallogr. 2011, 44, 1272–1276. [Google Scholar] [CrossRef]
Figure 1.
XRD patterns of the LaSr2AlO5, LaSr2(Al0.97Fe0.03)O5, and La1.03Sr1.97(Al0.97M0.03)O5 (M: Co, Ni, and Cu) samples. The standard data of LaSr2AlO5 is based on the literature reported by Im, W.B et al. (2009) [15].
Figure 1.
XRD patterns of the LaSr2AlO5, LaSr2(Al0.97Fe0.03)O5, and La1.03Sr1.97(Al0.97M0.03)O5 (M: Co, Ni, and Cu) samples. The standard data of LaSr2AlO5 is based on the literature reported by Im, W.B et al. (2009) [15].

Figure 2.
UV-Vis reflectance spectra for the LaSr2AlO5, LaSr2(Al0.97Fe0.03)O5, and La1.03Sr1.97(Al0.97M0.03)O5 (M: Co, Ni, and Cu) samples.
Figure 2.
UV-Vis reflectance spectra for the LaSr2AlO5, LaSr2(Al0.97Fe0.03)O5, and La1.03Sr1.97(Al0.97M0.03)O5 (M: Co, Ni, and Cu) samples.

Figure 3.
Photographs of the LaSr2AlO5, LaSr2(Al0.97Fe0.03)O5, and La1.03Sr1.97(Al0.97M0.03)O5 (M: Co, Ni, and Cu) samples.
Figure 3.
Photographs of the LaSr2AlO5, LaSr2(Al0.97Fe0.03)O5, and La1.03Sr1.97(Al0.97M0.03)O5 (M: Co, Ni, and Cu) samples.

Figure 4.
Photographs of the La1+xSr2−x(Al1−xCox)O5 (x = 0, 0.03, 0.05, and 0.10) samples.

Figure 5.
XRD patterns of the (La1−2xCa2x)Sr2(Al1−xMnx)O5 (x = 0 and 0.03) and (La0.94Ca0.06)Sr2AlO4.97 samples. The standard data of LaSr2AlO5 is based on the literature reported by Im, W.B et al. (2009) [15].
Figure 5.
XRD patterns of the (La1−2xCa2x)Sr2(Al1−xMnx)O5 (x = 0 and 0.03) and (La0.94Ca0.06)Sr2AlO4.97 samples. The standard data of LaSr2AlO5 is based on the literature reported by Im, W.B et al. (2009) [15].

Figure 6.
Rietveld refinement profiles of the XRD patterns for the (a) LaSr2AlO5, (b) (La0.94Ca0.06)Sr2AlO4.97, and (c) (La0.94Ca0.06)Sr2(Al0.97Mn0.03)O5 samples. The black cross symbols and the solid red lines represent the observed and calculated intensities, respectively. The difference profiles between the observed and calculated patterns are depicted as a blue line at the bottom. The green vertical bars show the Bragg reflection peaks.

Figure 7.
(a) Crystal structure obtained via the Rietveld analysis for (La0.94Ca0.06)Sr2(Al0.97Mn0.03)O5. (b) The octahedral coordination environment of La/Sr(1)O8, the decahedral coordination environment of Sr(2)O10, and the tetrahedral coordination environment of AlO4.
Figure 7.
(a) Crystal structure obtained via the Rietveld analysis for (La0.94Ca0.06)Sr2(Al0.97Mn0.03)O5. (b) The octahedral coordination environment of La/Sr(1)O8, the decahedral coordination environment of Sr(2)O10, and the tetrahedral coordination environment of AlO4.

Figure 8.
UV-Vis reflectance spectra for the LaSr2AlO5, (La0.94Ca0.06)Sr2AlO4.97, and (La0.94Ca0.06)Sr2(Al0.97Mn0.03)O5 samples.
Figure 8.
UV-Vis reflectance spectra for the LaSr2AlO5, (La0.94Ca0.06)Sr2AlO4.97, and (La0.94Ca0.06)Sr2(Al0.97Mn0.03)O5 samples.

Figure 9.
Photographs of the pellets of LaSr2AlO5, (La0.94Ca0.06)Sr2AlO4.97, and (La0.94Ca0.06)Sr2(Al0.97Mn0.03)O5 powders.
Figure 9.
Photographs of the pellets of LaSr2AlO5, (La0.94Ca0.06)Sr2AlO4.97, and (La0.94Ca0.06)Sr2(Al0.97Mn0.03)O5 powders.

Figure 10.
Photographs of the pellets of (La0.94Ca0.06)Sr2(Al0.97Mn0.03)O5, chromium oxide, cobalt green deep, and cobalt green pale powders.
Figure 10.
Photographs of the pellets of (La0.94Ca0.06)Sr2(Al0.97Mn0.03)O5, chromium oxide, cobalt green deep, and cobalt green pale powders.


Table 1.
Color coordinates for the LaSr2AlO5, LaSr2(Al0.97Fe0.03)O5, and La1.03Sr1.97(Al0.97M0.03)O5 (M: Co, Ni, and Cu) samples.
Table 1.
Color coordinates for the LaSr2AlO5, LaSr2(Al0.97Fe0.03)O5, and La1.03Sr1.97(Al0.97M0.03)O5 (M: Co, Ni, and Cu) samples.
| Samples | L* | a* | b* | C | h° |
|---|---|---|---|---|---|
| LaSr2AlO5 | 96.7 | −0.69 | +2.84 | 2.92 | − |
| LaSr2Al0.97Fe0.03O5 | 93.2 | −0.24 | +5.75 | 5.76 | 92.4 |
| La1.03Sr1.97Al0.97Co0.03O5 | 76.9 | −4.36 | +62.2 | 62.4 | 94.0 |
| La1.03Sr1.97Al0.97Ni0.03O5 | 55.6 | −1.83 | +25.7 | 25.8 | 94.1 |
| La1.03Sr1.97Al0.97Cu0.03O5 | 82.1 | −2.45 | +14.5 | 14.7 | 99.6 |
Table 2.
Lattice volumes of the La1+xSr2−x(Al1−xCox)O5 (0 ≤ x ≤ 0.10) samples. The numbers in parentheses are the estimated standard deviations.
Table 2.
Lattice volumes of the La1+xSr2−x(Al1−xCox)O5 (0 ≤ x ≤ 0.10) samples. The numbers in parentheses are the estimated standard deviations.
| x | Lattice Volume/nm3 |
|---|---|
| 0 | 0.52431(6) |
| 0.03 | 0.52486(4) |
| 0.05 | 0.52538(4) |
| 0.10 | 0.52541(6) |
Table 3.
Color coordinate data for the La1+xSr2−x(Al1−xCox)O5 (x = 0, 0.03, 0.05, and 0.10) samples.
Table 3.
Color coordinate data for the La1+xSr2−x(Al1−xCox)O5 (x = 0, 0.03, 0.05, and 0.10) samples.
| x | L* | a* | b* | C | h° |
|---|---|---|---|---|---|
| 0 | 96.7 | −0.69 | +2.84 | 2.92 | − |
| 0.03 | 76.9 | −4.36 | +62.2 | 62.4 | 94.0 |
| 0.05 | 75.8 | −4.52 | +67.2 | 67.4 | 93.8 |
| 0.10 | 62.2 | −1.78 | +58.7 | 58.7 | 91.7 |
Table 4.
Lattice volume of the LaSr2AlO5, (La0.94Ca0.06)Sr2AlO4.97, and (La0.94Ca0.06)Sr2(Al0.97Mn0.03)O5 samples. The numbers in parentheses are the estimated standard deviations.
Table 4.
Lattice volume of the LaSr2AlO5, (La0.94Ca0.06)Sr2AlO4.97, and (La0.94Ca0.06)Sr2(Al0.97Mn0.03)O5 samples. The numbers in parentheses are the estimated standard deviations.
| Samples | Lattice Volume/nm3 |
|---|---|
| LaSr2AlO5 | 0.52475(2) |
| (La0.94Ca0.06)Sr2AlO4.97 | 0.52394(4) |
| (La0.94Ca0.06)Sr2(Al0.97Mn0.03)O5 | 0.52380(4) |
Table 5.
Crystallographic data for the LaSr2AlO5, (La0.94Ca0.06)Sr2AlO4.97, and (La0.94Ca0.06)Sr2(Al0.97Mn0.03)O5 samples refined via the Rietveld analysis. The numbers in parentheses are the estimated standard deviations.
Table 5.
Crystallographic data for the LaSr2AlO5, (La0.94Ca0.06)Sr2AlO4.97, and (La0.94Ca0.06)Sr2(Al0.97Mn0.03)O5 samples refined via the Rietveld analysis. The numbers in parentheses are the estimated standard deviations.
| Samples | LaSr2AlO5 | (La0.94Ca0.06)Sr2AlO4.97 | (La0.94Ca0.06)Sr2 (Al0.97Mn0.03)O5 |
|---|---|---|---|
| Crystal system | Tetragonal | Tetragonal | Tetragonal |
| a/nm | 0.688766(5) | 0.688455(5) | 0.688338(7) |
| b/nm | − | − | − |
| c/nm | 1.105570(10) | 1.105399(11) | 1.105249(14) |
| V/nm3 | 0.524481(7) | 0.523926(8) | 0.523677(10) |
| Rwp | 4.391 | 4.684 | 3.647 |
| Rp | 2.943 | 3.122 | 2.372 |
| Re | 2.663 | 2.637 | 2.537 |
| S | 1.649 | 1.776 | 1.437 |
| RF | 2.403 | 2.556 | 2.465 |
Table 6.
Atomic coordinates and isotropic displacement factors (Biso) for the LaSr2AlO5, (La0.94Ca0.06)Sr2AlO4.97, and (La0.94Ca0.06)Sr2(Al0.97Mn0.03)O5 samples refined via the Rietveld analysis. The numbers in parentheses are the estimated standard deviations.
Table 6.
Atomic coordinates and isotropic displacement factors (Biso) for the LaSr2AlO5, (La0.94Ca0.06)Sr2AlO4.97, and (La0.94Ca0.06)Sr2(Al0.97Mn0.03)O5 samples refined via the Rietveld analysis. The numbers in parentheses are the estimated standard deviations.
| Atom | Site | Occupancy | x | y | z | 100 × Biso/nm2 |
|---|---|---|---|---|---|---|
| LaSr2AlO5 | ||||||
| La | 8h | 0.5 | 0.31923(9) | =x(La) + 1/2 | 0 | 0.48(2) |
| Sr1 | 8h | 0.5 | =x(La) | =y(La) | 0 | =Biso(La) |
| Sr2 | 4a | 1 | 0 | 0 | 1/4 | 0.37(3) |
| Al | 4b | 1 | 1/2 | 0 | 1/4 | 0.39(9) |
| O1 | 4c | 1 | 0 | 0 | 0 | 3.7(3) |
| O2 | 16l | 1 | 0.1352(5) | =x(O2) + 1/2 | 0.1510(3) | 0.97(10) |
| (La0.94Ca0.06)Sr2AlO4.97 a | ||||||
| La | 8h | 0.438(3) | 0.3199(1) | =x(La) + 1/2 | 0 | – |
| Ca | 8h | 0.062 b | =x(La) | =y(La) | 0 | – |
| Sr1 | 8h | 0.5 | =x(La) | =y(La) | 0 | – |
| Sr2 | 4a | 1 | 0 | 0 | 1/4 | – |
| Al | 4b | 1 | 1/2 | 0 | 1/4 | – |
| O1 | 4c | 0.893(14) | 0 | 0 | 0 | – |
| O2 | 16l | 1 | 0.1343(5) | =x(O2) + 1/2 | 0.1488(3) | – |
| (La0.94Ca0.06)Sr2(Al0.97Mn0.03)O5 a | ||||||
| La | 8h | 0.414(3) | 0.3195(1) | 0.8195 | 0 | – |
| Ca | 8h | 0.086 b | =x(La) | =y(La) | 0 | – |
| Sr1 | 8h | 0.5 | =x(La) | =y(La) | 0 | – |
| Sr2 | 4a | 1 | 0 | 0 | 1/4 | – |
| Al | 4b | 0.973(10) | 1/2 | 0 | 1/4 | – |
| Mn | 4b | 0.027 c | 1/2 | 0 | 1/4 | – |
| O1 | 4c | 1 | 0 | 0 | 0 | – |
| O2 | 16l | 1 | 0.1344(5) | =x(O2) + 1/2 | 0.1495(3) | – |
a The isotropic displacement parameters (Biso) for the (La0.94Ca0.06)Sr2AlO4.97 and (La0.94Ca0.06)Sr2(Al0.97Mn0.03)O5 samples were fixed with LaSr2AlO5. b (Ca, g) = 0.5 − (La, g). c (Mn, g) = 1.0 − (Al, g).
Table 7.
Average bond length of La−O, Sr(2)−O, and Al−O for the (La0.94Ca0.06)Sr2(Al0.97Mn0.03)O5 sample refined via the Rietveld analysis.
Table 7.
Average bond length of La−O, Sr(2)−O, and Al−O for the (La0.94Ca0.06)Sr2(Al0.97Mn0.03)O5 sample refined via the Rietveld analysis.
| Samples | LaSr2AlO5 | (La0.94Ca0.06)Sr2AlO4.97 | (La0.94Ca0.06)Sr2 (Al0.97Mn0.03)O5 |
|---|---|---|---|
| La−O/nm | 0.2625 | 0.2611 | 0.2615 |
| Sr(2)−O/nm | 0.3585 | 0.3597 | 0.3593 |
| Al−O/nm | 0.1712 | 0.1721 | 0.1716 |
Table 8.
Color coordinate data for the LaSr2AlO5, (La0.94Ca0.06)Sr2AlO4.97, and (La0.94Ca0.06)Sr2(Al0.97Mn0.03)O5 pigments.
Table 8.
Color coordinate data for the LaSr2AlO5, (La0.94Ca0.06)Sr2AlO4.97, and (La0.94Ca0.06)Sr2(Al0.97Mn0.03)O5 pigments.
| Sample | L* | a* | b* | C | h° |
|---|---|---|---|---|---|
| LaSr2AlO5 | 96.2 | −0.732 | +1.89 | 2.03 | 111 |
| (La0.94Ca0.06)Sr2AlO4.97 | 95.5 | −0.854 | +3.27 | 3.38 | 104 |
| (La0.94Ca0.06)Sr2(Al0.97Mn0.03)O5 | 50.1 | −20.8 | +7.65 | 22.2 | 160 |
Table 9.
Color coordinate data for the (La0.94Ca0.06)Sr2(Al0.97Mn0.03)O5 sample and the commercially available green pigments.
Table 9.
Color coordinate data for the (La0.94Ca0.06)Sr2(Al0.97Mn0.03)O5 sample and the commercially available green pigments.
| Sample | L* | a* | b* | C | h° |
|---|---|---|---|---|---|
| (La0.94Ca0.06)Sr2(Al0.97Mn0.03)O5 | 50.1 | −20.8 | +7.65 | 22.2 | 160 |
| Chromium oxide | 50.2 | −20.5 | +18.2 | 27.4 | 138 |
| Cobalt green deep | 33.3 | −19.9 | +3.88 | 20.3 | 169 |
| Cobalt green pale | 52.3 | −24.4 | −5.53 | 25.0 | 193 |
Disclaimer/Publisher’s Note: The statements, opinions and data contained in all publications are solely those of the individual author(s) and contributor(s) and not of MDPI and/or the editor(s). MDPI and/or the editor(s) disclaim responsibility for any injury to people or property resulting from any ideas, methods, instructions or products referred to in the content. |
© 2023 by the authors. Licensee MDPI, Basel, Switzerland. This article is an open access article distributed under the terms and conditions of the Creative Commons Attribution (CC BY) license (https://creativecommons.org/licenses/by/4.0/).
Share and Cite
MDPI and ACS Style
Yamaguchi, K.; Takemura, A.; Furumoto, S.; Oka, R.; Masui, T. Inorganic Green Pigments Based on LaSr2AlO5. Ceramics 2023, 6, 2269-2281. https://doi.org/10.3390/ceramics6040138
AMA Style
Yamaguchi K, Takemura A, Furumoto S, Oka R, Masui T. Inorganic Green Pigments Based on LaSr2AlO5. Ceramics. 2023; 6(4):2269-2281. https://doi.org/10.3390/ceramics6040138
Chicago/Turabian StyleYamaguchi, Kazuki, Akari Takemura, Saki Furumoto, Ryohei Oka, and Toshiyuki Masui. 2023. "Inorganic Green Pigments Based on LaSr2AlO5" Ceramics 6, no. 4: 2269-2281. https://doi.org/10.3390/ceramics6040138