
Analysis of the Luminescent Emission during Flash Sintering of 8YSZ and 20SDC Ceramics

Center of Science and Technology of Materials, Energy and Nuclear Research Institute, Sao Paulo 05508-000, Brazil
*
Author to whom correspondence should be addressed.
†
Current address: Institute of Physics, University of S. Paulo, São Carlos 13566-590, Brazil.
Ceramics 2024, 7(1), 329-341; https://doi.org/10.3390/ceramics7010021
Submission received: 22 January 2024
/
Revised: 19 February 2024
/
Accepted: 23 February 2024
/
Published: 25 February 2024
(This article belongs to the Special Issue Advances in Ceramics, 2nd Edition)
Abstract
:Light-emission data were collected before, during, and after the occurrence of the flash event in pressureless electric-field-assisted (flash) sintering experiments on ZrO2: 8 mol% Y2O3 (8YSZ) and CeO2: 20 mol% Sm2O3 (20SDC) ceramic green pellets to analyze the luminescent emission from the samples. The experiments were performed at 800 °C with an applied electric field of 100 V·cm−1 at 1 kHz, limiting the electric current to 1 A. Luminescence data were obtained in the 200–1200 nm (ultraviolet–visible–near-infrared) range. The deconvolution of the optical spectra allowed for the identification of emission bands in the visible range due exclusively to the samples. The wavelength maxima of the emission bands in 8YSZ were found to be different from those in 20SDC. It is suggested that these bands might originate from the interaction of the electric current, resulting from the application of the electric field, with the depleted species located at the space-charge region at the grain boundaries of these ceramics. The main results represent a contribution to help to clarify the mechanisms responsible for the fast densification with inhibition of grain growth in electroceramics.
1. Introduction
Flash sintering, a pressureless electric-field-assisted sintering method, consists in applying an electric field to a green ceramic piece, either a cylindrical or a dogbone-shaped ceramic pellet, usually at a temperature well below those applied in conventional sintering. The pellet shrinkage occurs in short times (usually in seconds) [1,2], and grain growth is inhibited. This technique has been extensively applied to several electroceramics: ZrO2: x mol% Y2O3 (x = 3, 8), CeO2: 20 mol% RE2O3 (RE: rare-earth; Gd, Sm), BaCe0.9(Y, RE)0.1O3-δ (RE = Gd, Sm, Yb) solid electrolytes [3,4,5,6,7,8,9,10,11,12,13,14,15,16,17,18,19,20,21,22], BaTiO3, ZnO, SnO2, and CaCu3Ti4O3 semiconductors [23,24,25,26,27,28,29,30,31,32], and Al2O3, TiO2, SiC, and Y2O3 insulators [33,34,35,36,37,38,39,40]. The flash sintering experiments with all of these electroceramics showed linear shrinkage of dogbone-shaped or cylindrical ceramic pellets at temperatures depending mainly on the electrical behavior, the electrical field, and the limiting electrical current. The majority of these studies showed the possibility of sintering ceramics at temperatures lower and in times shorter than those required in conventional sintering, by applying electric fields. The electric fields produced electric currents through the ceramics, with consequent Joule heating [1,2], in addition to the furnace heating. Moreover, the pressureless electric-field-assisted sintering method produced dense specimens and inhibited grain growth, allowing for obtaining ceramic pieces with improved mechanical properties. Luminescent emission, reported as occurring during the flash event in ceramic compounds, was studied in detail in Al2O3, with photoluminescence investigation of DC electric-field flash-sintered corundum showing the formation of F-centers [31]; research on ZrO2: x mol% Y2O3 (x = 3, 8) and SnO2 showed that the luminescence emission did not depend on the electrical properties of these ceramics, but apparently on gaseous discharges that might occur at the interparticle region of the ceramic samples [39,40]. In addition to the detection of luminescence emitted from flash-sintered ceramics, photoluminescence has also been detected in ZrO2: 3 mol% Y2O3 upon excitation with UV light during the application of an electric field [41].
One of the main difficulties in analyzing that emission in these experiments is the separation of the luminescence from the sample and those from the furnace resistances and ceramic lining. Moreover, the luminescent emission of the sample might be caused by two sources of heat: the furnace, and the Joule heating produced by the electric current through the sample, derived from the applied electric voltage. Luminescence spectra have already been collected in ZrO2: 3 mol% Y2O3 during flash sintering experiments in a sample positioned inside a furnace, using a synchrotron light to evaluate the crystallographic phases, suggesting that the intense luminescence is due to electron–hole pair formation with recombination, and that the emission is not solely black-body radiation [42,43]. The so-called stage III of flash sintering experiments, with a sudden increase in the electrical conductivity and shrinkage in a few seconds, could be sustained by keeping an electric current through the specimen, which emits luminescence with several peaks in the UV–VIS region, ascribed to different energy levels of holes and electrons (“luminescence is likely related to the generation of electron-hole pairs”) [42]. But determining the main mechanism(s) responsible for the luminescence remains an open question [44]. Luminescent emission occurring during flash sintering of corundum was ascribed to thermal bleaching of F-like color centers (electrons trapped at oxygen vacancies) due to the flow of an electric current under the application of the electric field for promoting the flash event. In this case, the luminescence experiments revealed that the flash conditions promoted the formation of F-centers [31]. Recently, it was proposed that the visible luminescence occurring during flash sintering experiments in ZrO2: 3 mol% Y2O3 can be explained only by black-body (thermal) radiation resulting from Joule heating, rather than electroluminescence, and by “the influence of the experimental system”, namely, artifacts [45]. After measurements of luminescent emission in two electroceramics—a solid electrolyte (ZrO2: 8 mol% Y2O3) and a semiconductor (SnO2)—in flash sintering experiments, it was proposed that gaseous discharges at the interparticle regions of the ceramic pellets could be the origin of the luminescence during the flash event [39]. In this case, the optical spectra should be similar, irrespective of the ceramic compound and its electrical behavior. A brief review of the proposed mechanisms for the photoemission that occurs during the flash event suggested that the main cause is electron injection; the electron current would act at the grain boundary interfaces [44].
Flash sintering experiments yield the following main physical outputs during the flash event: an abrupt shrinkage; high percolation of electric current through the specimen, requiring a power supply able to limit the electric current; and luminescent emission, detectable by optical spectrometers operating in the UV–VIS–NIR region. After the flash event, the specimen is dense, with inhibition of grain growth when compared with conventional sintering.
Here, we present the results of experiments performed to detect the spectral distribution of the luminescent emissions (luminescence signal intensity as a function of wavelength) that occurred during flash sintering of two paradigmatic solid electrolytes: ZrO2: 8 mol% Y2O3 and CeO2: 20 mol% Sm2O3. The main purpose was to shed light on the physical origin of the luminescent emissions observed during pressureless electric-field-assisted sintering.
2. Materials and Methods
2.1. Samples
For the flash sintering experiments, green cylindrical ceramic pellets with a diameter and thickness of 5 mm each were prepared by cold pressing for 60 s under 30 MPa (Skay Máquinas Hidráulicas, S. Paulo, Brazil), followed by isostatic pressing under 50 MPa (National Forge Company, Irvine, CA, USA) of the following two compositions: ZrO2: 8 mol% Y2O3 (8YSZ, tape cast-grade powder, 6–9 m2·g−1, 0.5–6 µm average grain size, 1–2 wt.% HfO2, 0–3 wt.% Al2O3, Fuel Cell Materials, Lewis Center, OH, USA), and CeO2: 20 mol% Sm2O3 (SDC20-TC, agglomerated ceramic powders with specific surface area > 100 m2 g−1 and 5–10 nm primary crystallite size, Fuel Cell Materials, Lewis Center, OH, USA). The 8YSZ samples, embedded in the original powder inside a covered alumina boat, were also conventionally sintered in a resistive furnace (Zircar Hot Spot 100, Florida, NY, USA) at 1650 °C for 4 h, for comparison purposes.
2.2. X-ray Diffraction
X-ray diffraction data were collected at room temperature with a D8-Advance X-ray diffractometer (Bruker-AXS, Karlsruhe, Germany) with a θ-θ Bragg–Brentano configuration, 40 kV–40 mA Ni-filtered Cu-kα radiation in the 20°–90° 2θ range, 0.05° step size, and 5 s per step. The data were analyzed with EVA® v1 software for peak searching and Cu-kα2 stripping. Crystallographic analysis was carried out with the PDF-2 Database Sets (ICDD, Newton Square, PA, USA).
2.3. Scanning Electron Microscopy
Scanning electron microscopy images of backscattered electrons were obtained from the raw surfaces (no polishing or etching) of flash-sintered ceramic pellets using an Inspect F50 FEG Scanning Electron Microscope (FEI, Brno, Czech Republic) with a 5 kV beam bias and 3.5 spot size. Electron-dispersion X-ray spectroscopy analyses (EDS) were carried out with the Octane Elect Plus EDAX system (Pleasanton, CA, USA).
2.4. Electrochemical Impedance Spectroscopy
Impedance spectroscopy measurements were conducted using a 4192A Hewlett Packard LF impedance analyzer (Yokogawa-Hewlett Packard, Tokyo, Japan) connected to a series 360 Hewlett Packard Controller. The collection and deconvolution of the [−Z″(ω) × Z′(ω)] impedance diagrams were carried out with a special software platform [46]. Z″(ω) and Z′(ω) represent the imaginary and the real components of the impedance, respectively, and ω = 2πf (f denotes the frequency of the applied AC voltage). The ceramic pellets, with parallel surfaces painted with silver paste and cured at 400 °C/15 min, were spring-loaded between platinum disks inside a custom-made sample chamber, which was inserted into a programmable furnace. The sample chamber, made of Inconel-600 and alumina, allowed for positioning three samples for collecting data at the room temperature—1100 °C. The measurements were performed in the 5 Hz–13 MHz frequency range, with 20 data points per decade and a 200 mV input signal. The temperature profile for the measurements was as follows: 10 °C·min−1 heating rate, 360–500 °C temperature range; 50 min was the time programmed for stabilizing the temperature.
2.5. Luminescence
For the detection of luminescence, each ceramic pellet was positioned inside a custom-made sample chamber, consisting of alumina tubes and platinum electrodes and connectors, the cylindrical ceramic sample being spring-loaded between platinum disks, which were connected to a power supply. The sample chamber was inserted in a vertical split-tube furnace, with a hole drilled in the furnace wall to allow for positioning the sensing tip of an optical fiber (HTX extreme high-temperature probe, Avantes BV, Apeldoorn, the Netherlands) close to the ceramic pellet.
Figure 1 shows a sketch of the components of the experimental arrangement for detecting luminescence during the application of an electric field.
Optical signals were collected in the 200–1200 nm range with a PC-controlled optical spectrometer (AvaSpec-ULS2048, Avantes BV, The Netherlands). The components of the experimental arrangement were as follows: (1) a programmable split vertical furnace (Fortelab, S. Carlos, SP, Brazil), (2) an alumina sample chamber with a spring-loaded alumina sample holder, (3) a type-K chromel–alumel thermocouple with its sensing tip located close to the ceramic sample, (4) a digital linear gauge (Mitutoyo Digimatic Indicator, Japan) on top of a 5 mm diameter alumina tube, in contact with the sample top electrode for collecting shrinkage data (ΔL), (5) a commercial programmable power supply (Pacific Power Source 118-ACX, Irvine, CA, USA) connected with platinum leads to platinum disks positioned on both parallel surfaces of the ceramic pellet, (6) an optical spectrometer for detecting the luminescence spectrum (I × λ) with the AvaSoft 8.14 software, and (7) a 34972A Agilent LXI Data Acquisition/Data Logger switch unit (Keysight, Santa Rosa, NM, USA) for monitoring the sample temperature, applied AC voltage, and electric current through the ceramic pellet. The experiment consisted of setting the furnace to heat at 10 °C·min−1 up to 800 °C, applying 100 V·cm−1 at that temperature up to the occurrence of the abrupt pellet shrinkage (flash event), and turning off the furnace when the shrinkage stopped. Luminescent emissions were collected from the start of the heating (before flash; see Figure 6), during shrinkage in the flash event (during flash), and during the cooling down of the sample with the electric voltage turned off (after flash). For the analysis of F-center luminescence, a Sr-doped single KBr crystal was irradiated in a 60Co γ-cell for 30 h, yielding to the ceramic pieces’ accumulated dose of 388 Gy as a reference. The 8YSZ ceramic samples were also exposed to γ-rays, looking for the production of F-centers (one or two electrons trapped at oxygen vacancies [31]).
3. Results and Discussion
3.1. X-ray Diffraction
Figure 2 shows the results of the X-ray diffraction analyses of flash-sintered 8YSZ and 20SDC ceramic pellets in the 20°–90° 2θ range, with the indexed Miller indices.
The X-ray diffraction patterns collected at the surfaces of the 8YSZ and 20SDC ceramic pellets were indicative of a cubic fluorite structure, according to the JCPDS 01-070-4436 and JCPDS 75-0158 files, respectively. No secondary phases were detected, evidencing that the Joule heating due to the electric current during the flash sintering experiments did not promote changes in the original crystallographic structure.
3.2. Scanning Electron Microscopy
The scanning electron microscopy images, with the corresponding electron-dispersion X-ray spectroscopy analysis (EDS) of 8YSZ and 20SDC flash-sintered ceramic samples, are shown in Figure 3.
The SEM images show that the surfaces were apparently dense, with average grain sizes in the submicron range. The EDS analyses, as expected, show zirconium and yttrium at the 8YSZ surface, and cerium and samarium at the 20SDC surface, the main cations of each composition. The detected elemental intensities in the 8YSZ compound were 90.5 wt.% Zr, 7.4 wt.% Y and 2.1 wt.% Hf (impurity); for the 20SDC compound, they were 79.6 wt.% Ce and 20.4 wt.% Sm. Both sets of values were in agreement with the nominal 8YSZ and SDC compositions.
3.3. Electrochemical Impedance Spectroscopy
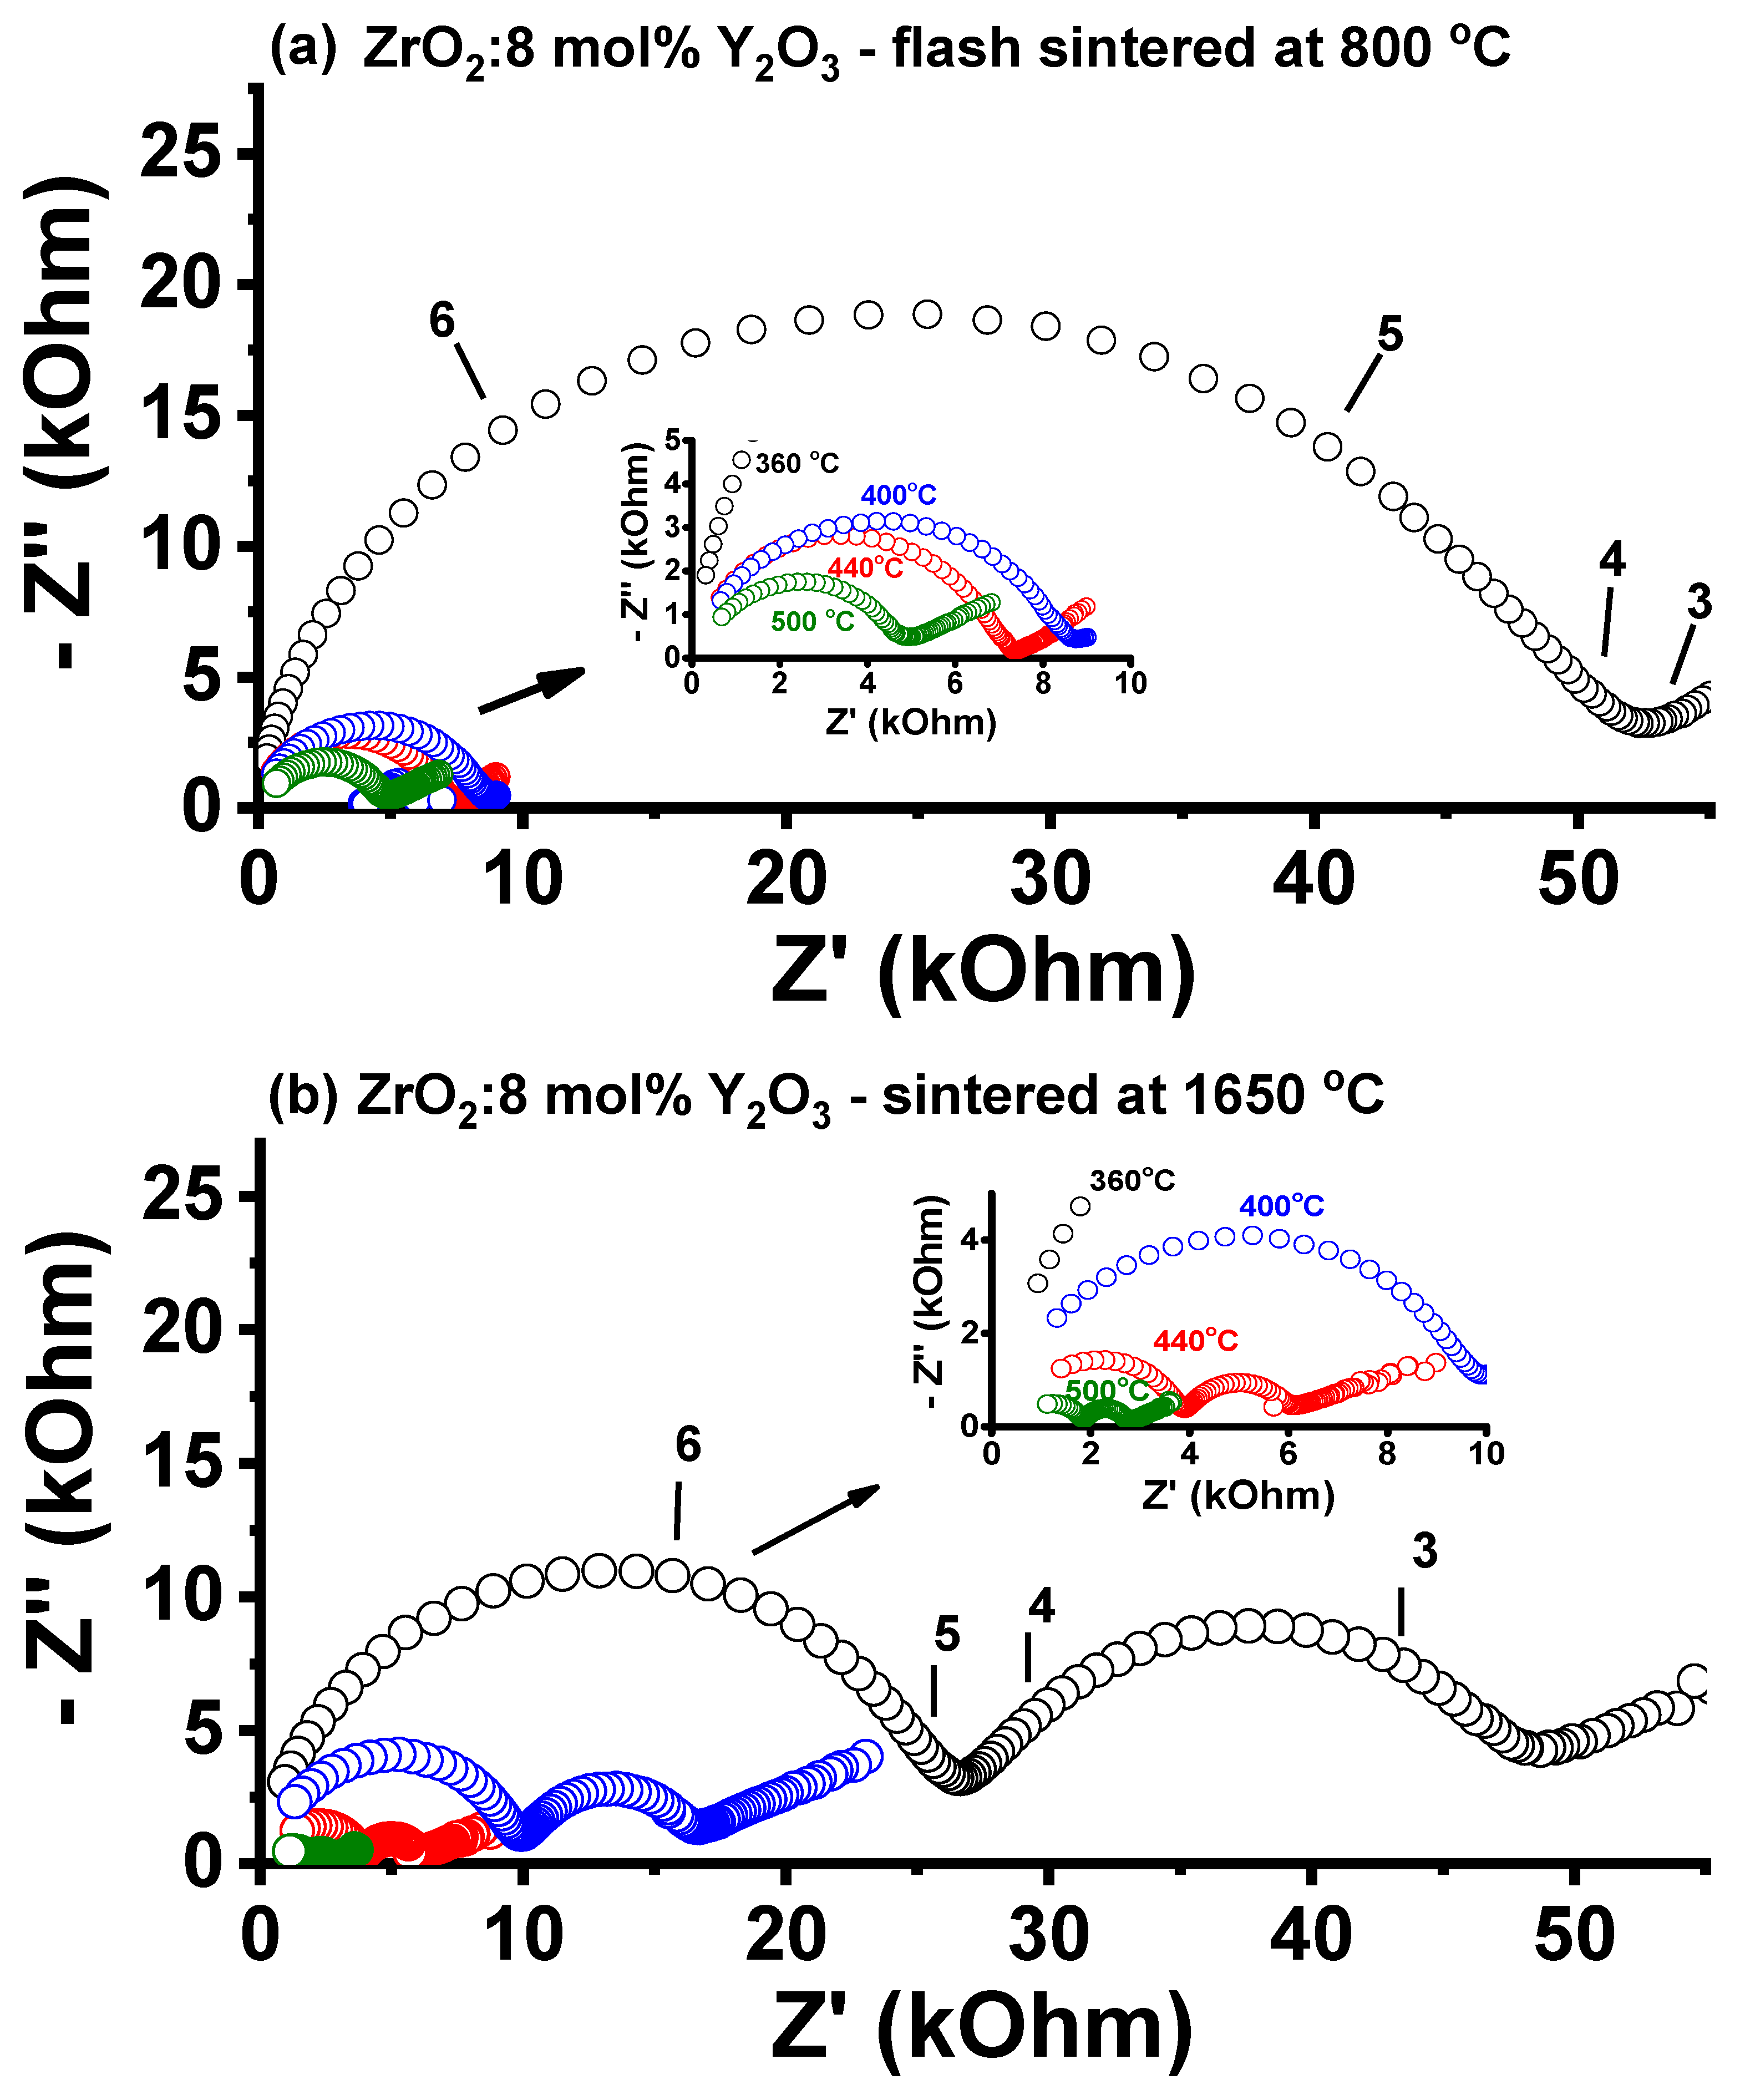
The impedance spectroscopy diagrams in the 5 Hz–13 MHz frequency range at temperatures in the 360–500 °C range, for ZrO2: 8 mol% Y2O3 (8YSZ) ceramic specimens flash-sintered at 800 °C and conventionally sintered at 1650 °C, are shown in Figure 4a,b, respectively.
The [−Z″(ω) × Z′(ω)] impedance diagram of the flash-sintered ceramic pellet is composed of a semicircle in the high-frequency region (104–107 Hz) and a spike in the low-frequency region (<104 Hz), while the conventionally sintered pellet presents two semicircles in the whole frequency range. These two semicircles are due to the electrical resistivity of the bulk (high frequency) and to the interfaces—mainly grain boundaries [47]. The nonoccurrence of the low-frequency semicircle in the impedance diagram of the flash-sintered ceramic pellet has already been explained, as a consequence of the Joule heating at the intergranular region of the sample, due to the flow of an electric current during the application of the electric voltage (flash event) [47,48]. Joule heating has already been reported to increase the bulk conductivity, probably by increasing the oxygen ion concentration by thermally diffusing yttrium ions from the space-charge region to the bulk [48]. The electrical resistance of the 8YSZ and 20SDC ceramic samples, evaluated at the intersection of the Z′-axis with the semicircle in the low-frequency region of the impedance diagram, decreased with increasing temperature, as expected. This decrease followed the Arrhenius equation, the logarithm of the electrical resistivity decreasing linearly with the reciprocal of the absolute temperature [48].
3.4. Luminescence
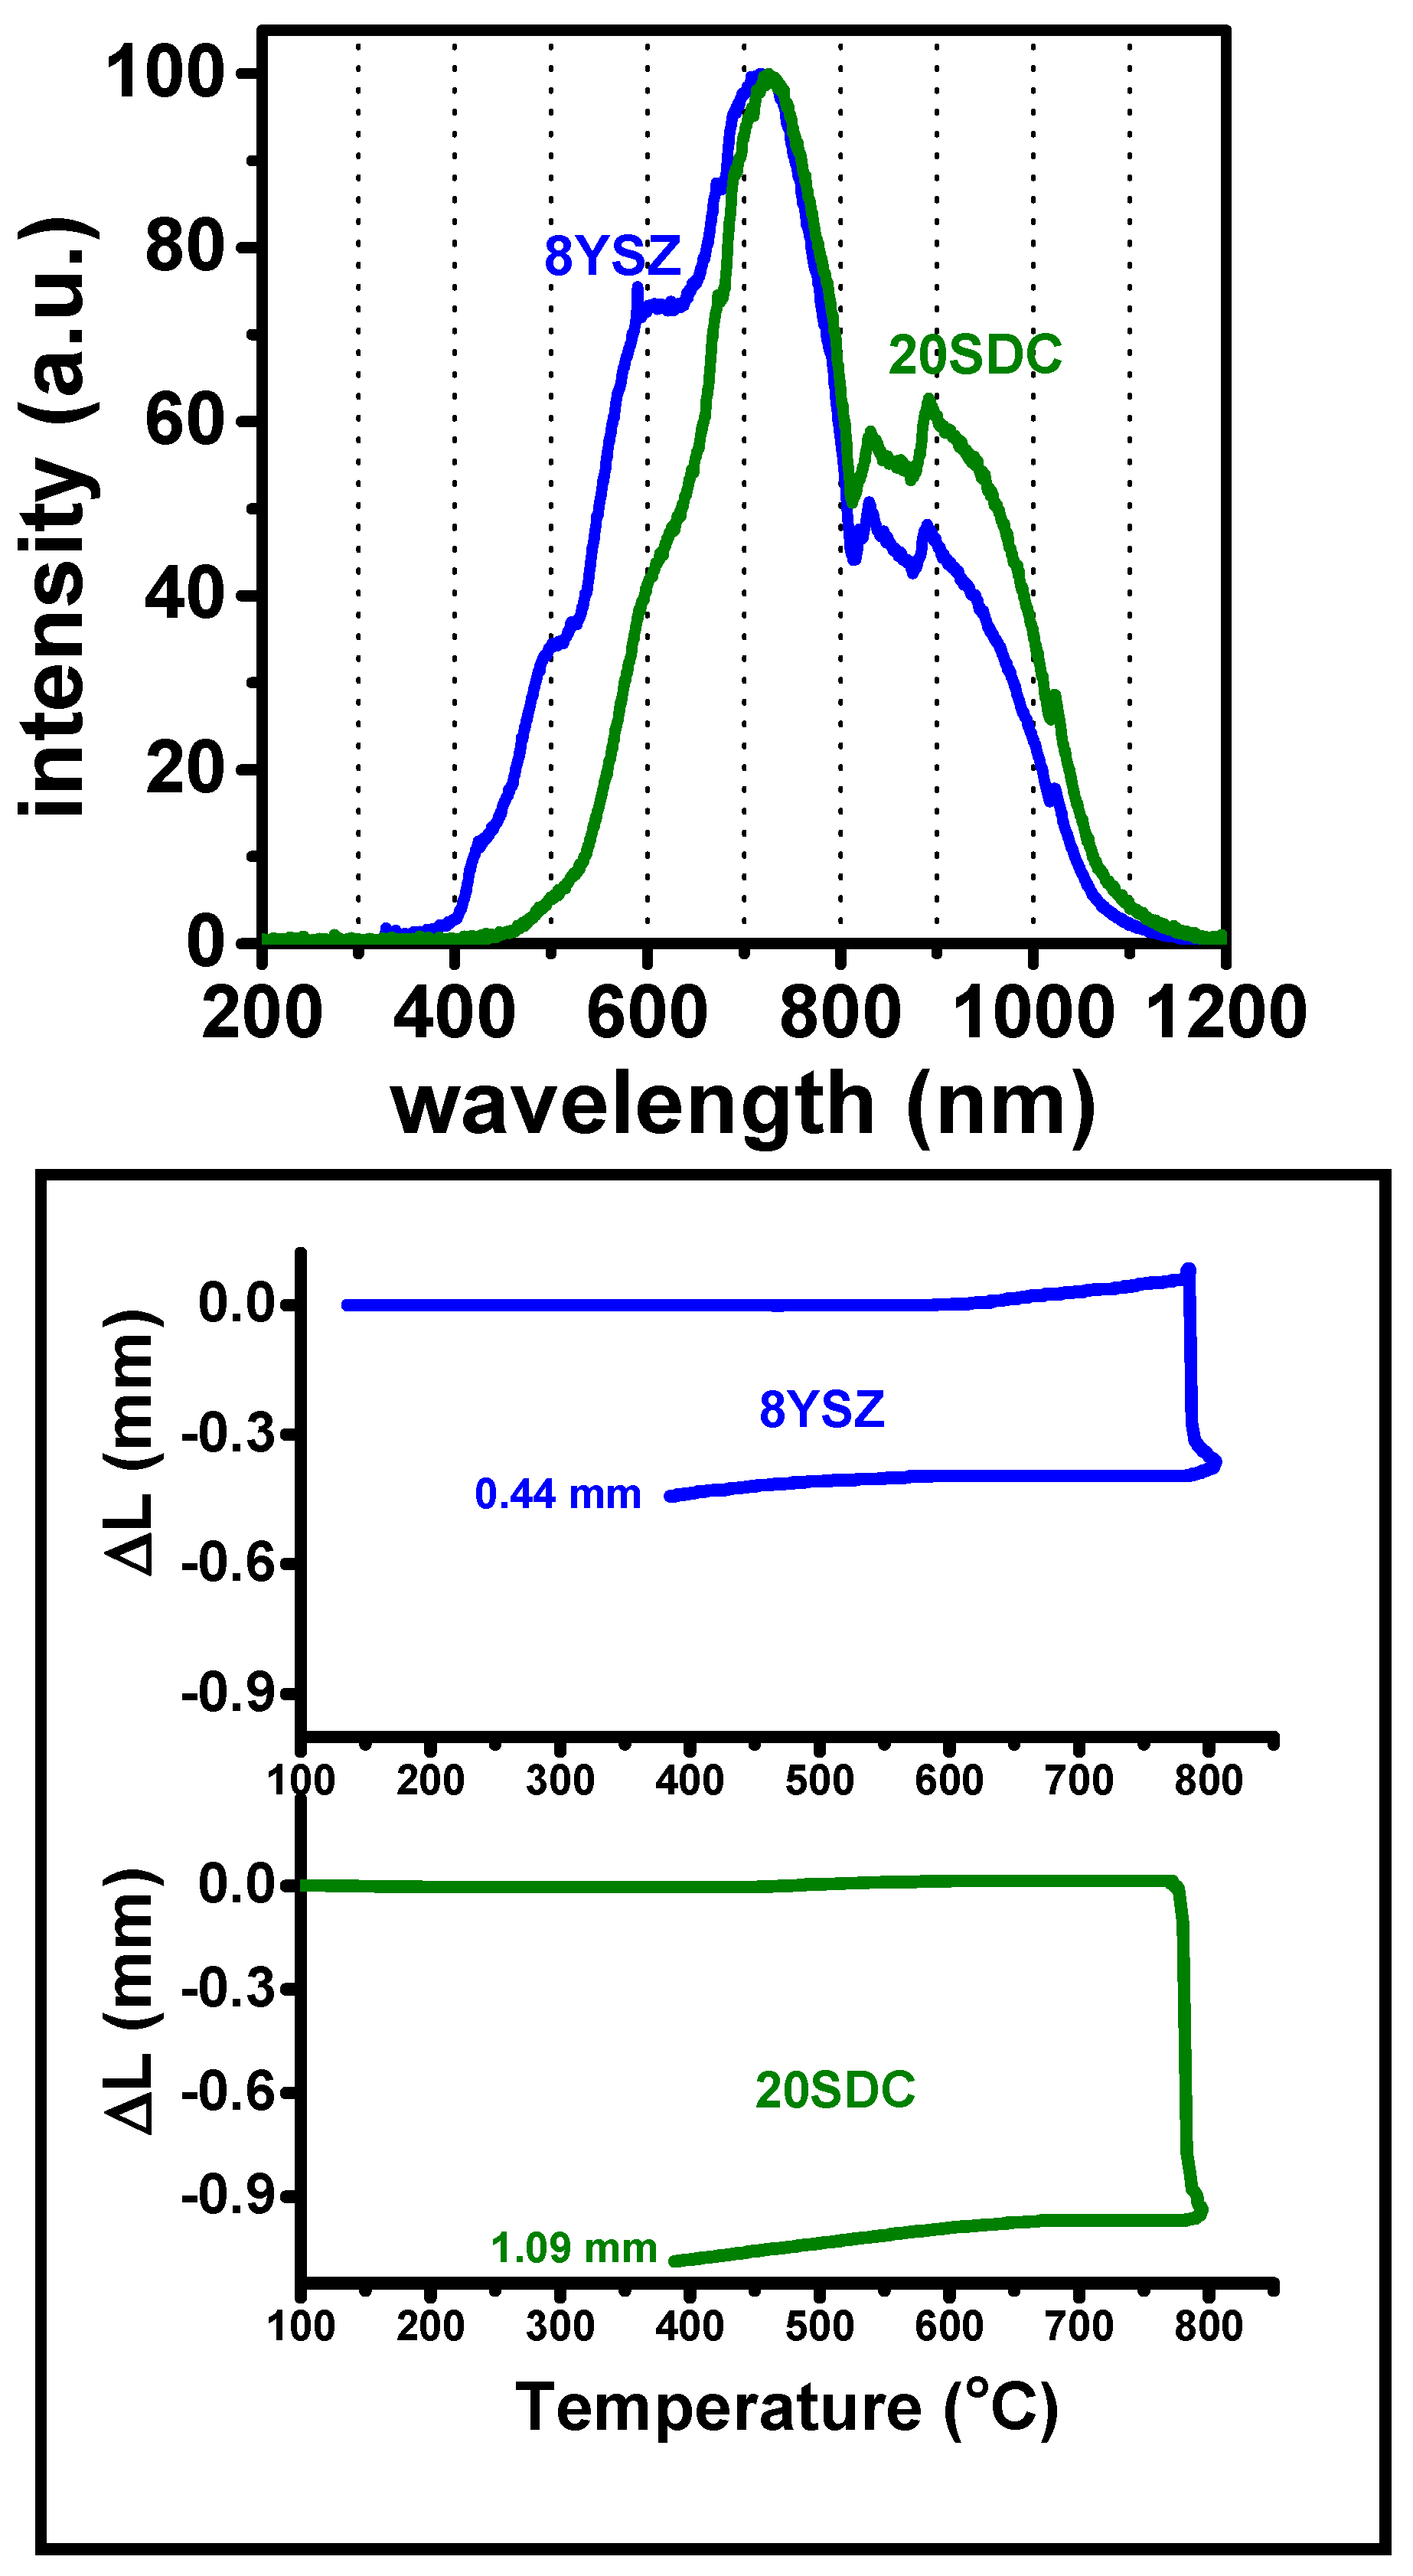
Figure 5 shows luminescence spectra collected in the 200–1200 nm range during the flash event on ZrO2: 8 mol% Y2O3 and CeO2: 20 mol% Sm2O3, under the application of 100 V·cm−1 at 800 °C, limiting the maximum electric current to 1 A to avoid thermal runaway, i.e., a huge increase in the sample temperature, which could even disrupt it [49,50,51,52]. The linear variation in the sample thickness, measured from room temperature to 800 °C at the same time as the detection of the luminescent emission, is also shown.
The two optical spectra look similar, with intense luminescent emission with maxima in the 600–900 nm range. Similar results, ascribed to furnace + sample light emissions upon heating, have already been reported [42,43]. At wavelengths lower than that of the peak intensity maximum (~700 nm), the relative intensity was higher for 8YSZ than for 20SDC; the opposite happened at wavelengths higher than 700 nm. The explanation for this might be associated with the emission in the visible range of the corresponding depleted chemical species (yttrium and samarium). The dopant content of yttrium oxide in zirconium oxide is 8 mol%, and that of samarium oxide in cerium oxide is 20 mol%, meaning that the samarium oxide population in ceria’s surface charge region is apparently larger than that of yttrium oxide in zirconia’s surface charge region. Luminescence emission data were then collected at 800 °C before, during, and after the occurrence of the flash event under the application of an AC electric field to the two ceramics. The dilatometric curves of the two ceramic specimens, recorded during the flash sintering experiments, are shown at the bottom of Figure 5. The flash event was clearly detected, with the 8YSZ and 20SDC ceramics reaching 0.44 mm and 1.09 mm shrinkage values, respectively. Further experiments are required to explain the different values, probably due to the electronic contribution attained by the doped ceria samples at high temperatures.
Figure 6 shows the luminescent emission spectra of ZrO2: 8 mol% Y2O3 and CeO2: 20 mol% Sm2O3. The data collection started when the ceramic samples, one at a time, were subjected to 100 V·cm−1 after reaching 800 °C, with the furnace heated at a rate of 10 °C/min. The light-emission data were collected before (top figure), during (center figure), and after (bottom figure) the surge of the sharp shrinkage of the samples with the concurrent luminescent emission. The emission bands arising from the deconvolution of these spectra, using the Fityk software [53] and assuming a Gaussian shape, are shown as well.
All of the spectra showed wide overlapped bands in the ~570–1100 nm range. The deconvolution of the spectra, assuming Gaussian bands, revealed two high-amplitude main bands. The spectra measured before and after the flash sintering event were essentially similar. Significant changes were detected in the spectra measured during the flash event, with the appearance of new emission bands (green in Figure 6) with apparently different maxima, depending on the flash-sintered composition (8YSZ or 20SDC).
Table 1 shows the evaluated wavelengths at the maximum amplitude of each deconvoluted Gaussian band presented in Figure 6. In addition to the bands observed before and after the flash sintering event, additional bands (in bold type) were detected, apparently due to the flash event. These extra bands represent a unique fingerprint of the luminescent emission that occurred during the flash event. The wavelengths at the maximum amplitude of those extra bands were evaluated as 517 nm/690 nm and 500 nm/680 nm for 20SDC and 8YSZ, respectively. The values of the wavelength at maximum amplitude for 20SDC and 8YSZ were close, due to their similar bandgap values as ionic conductors. The small-amplitude Gaussian bands may be neglected because they are result of the mathematical fitting. Different sets of values could be expected to be detected in each of the two solid electrolytes, if we consider that the depleted species at the space-charge region are different in each of the two ceramics: yttrium oxide and samarium oxide in 8YSZ and 20SDC, respectively. So far, the suggestions for explaining this luminescent emission are (i) recombination of electron–hole pairs [40,42], (ii) glow due to plasma emission [43], or (iii) thermal bleaching of F-type color centers (one or two electron(s) trapped at the oxygen vacancy) [31]. The absorption maximum of the F-center band of ZrO2 is 2.5 eV [54], which corresponds to 496 nm [λ (μm) = 1.2398/E(eV)], a value close to our result in Table 1. Moreover, the origin of the luminescent emission occurring in ZrO2 was attributed to F-type centers.
Looking for evidence of the possibility that the origin of the luminescent emission during the flash event could have been due to F-color centers produced by the electric field [31], experiments were conducted on green 8YSZ samples with radioactively produced F-centers. To check the ability of our experimental arrangement to detect F-centers’ optical emission upon thermal bleaching, preliminary experiments were conducted on single KBr:Sr2+ crystals exposed to 388 Gy of 60Co gamma rays. After exposure to radiation, the single crystal, with a dominant characteristic blue color, was positioned inside the sample chamber, heated up to 300 °C, and the luminescence resulting from thermal annealing of the F-centers and the furnace resistances and lining was measured. The best fit of the spectra from the data collected in the 500–800 nm range evidenced an optical band centered at 615 nm, typical of F-center emission in Sr-doped single KBr crystals [55]. The same experimental procedure carried out with single KBr:Sr2+ crystals was repeated with 8YSZ ceramic pellets gamma-irradiated with 388 Gy in the 60Co gamma cell positioned in the sample chamber. A broad optical band, built up during continuous thermal bleaching of the radioactively produced defects, was detected, centered at approximately 700 nm, which does not correspond to the known luminescence emission band of F-centers in yttria-stabilized zirconia [56]. Even though this experimental result is not conclusive (due to the difficulty in collecting luminescence emission from polycrystalline samples [57,58] in comparison with single crystals, with the occurrence of intergranular light scattering and absorption), it shows no evidence of F-center emission upon heating of the 8YSZ sample.
4. Summary
The application of a 100 V·cm−1 AC electric field to ZrO2: 8 mol% Y2O3 (8YSZ) and CeO2: 20 mol% Sm2O3 (20SDC) ceramic green pellets upon heating to 800 °C promoted the occurrence of the flash event, namely, a sharp decrease in thickness with a concurrent luminescent emission caused mainly by Joule heating at the specimen’s interface, providing heating additional to the furnace heating. The optical spectra of the luminescent emissions detected before, during, and after the occurrence of the flash event upon application of AC electric fields to 8YSZ and 20SDC allowed us to detect two prominent luminescent emission bands, in addition to the emission bands due to the furnace resistances, apparently due solely to the ceramic samples: 500/680 nm and 517/690 nm at their maximum amplitudes for 8YSZ and 20SDC, respectively. These additional bands might be the luminescence as a result of the interaction of chemical species that are depleted at the intergranular regions (Y2O3 and Sm2O3, respectively) with the electric current derived from Joule heating, which is known to occur during the flash event. Another possibility, however, is luminescent emission from electron–hole recombination, again due to Joule heating, because these two ionic conductors have different band-to-band configurations. We did not find any evidence that the luminescence during the flash event in stabilized zirconia is a consequence of F-center thermal bleaching. Even though additional experiments are still necessary to explain the mechanism responsible for the extra luminescent emission bands, we tentatively assumed that they were due to the interaction of the percolating electric current with chemical species located at the interfaces of the polycrystalline ceramics.
Author Contributions
R.M.: conceptualization, methodology, data collection, writing—original draft preparation, writing—review and editing, supervision; J.C.C.A.D.: data collection, writing; E.N.S.M.: writing—review and editing. All authors have read and agreed to the published version of the manuscript.
Funding
This work was supported by CNEN, CDMF-CEPID (FAPESP Proc. 2013/07296-2), FAPESP 2020/05250-9, and CNPq (Procs. 402966/2021-0, 305557/2022-0, 306894/2023-8).
Data Availability Statement
Data supporting the reported results can be found with the corresponding author.
Conflicts of Interest
The authors declare no conflicts of interest. The funders had no role in the design of the study; in the collection, analyses, or interpretation of data; in the writing of the manuscript; or in the decision to publish the results.
References
- Yu, M.; Grasso, S.; Mckinnon, R.; Saunders, T.; Reece, M.J. Review of flash sintering: Materials, mechanisms and modelling. Adv. Appl. Ceram. 2016, 116, 24–60. [Google Scholar] [CrossRef]
- Dancer, C.E.J. Flash sintering of ceramic materials. Res. Express 2016, 3, 102001. [Google Scholar] [CrossRef]
- Cologna, M.; Rashkova, B.; Raj, R. Flash sintering of nanograin zirconia in <5 s at 850 °C. J. Am. Ceram. Soc. 2010, 93, 3556–3559. [Google Scholar]
- Cologna, M.; Raj, R. Surface diffusion-controlled neck growth kinetics in early stage sintering of zirconia, with and without applied DC electrical field. J. Am. Ceram. Soc. 2011, 94, 391–395. [Google Scholar] [CrossRef]
- Obare, J.; Griffin, W.D.; Conrad, H. Effects of heating rate and DC electric field during sintering on the grain size distribution in fully sintered tetragonal zirconia polycrystals stabilized with 3% molar yttria (3Y-TZP). J. Mater. Sci. 2012, 47, 5141–5147. [Google Scholar] [CrossRef]
- Ji, W.; Parker, B.; Falco, S.; Zhang, J.Y.; Fu, Z.Y.; Todd, R.I. Ultra-fast firing: Effect of heating rate on sintering of 3YSZ, with and without an electric field. J. Eur. Ceram. Soc. 2017, 37, 2547–2551. [Google Scholar] [CrossRef]
- Conrad, H. Space charge and grain boundary energy in zirconia (3Y-TZP). J. Am. Ceram. Soc. 2011, 94, 3641–3642. [Google Scholar] [CrossRef]
- Carvalho, S.G.; Muccillo, E.N.; Muccillo, R. Electrical behavior and microstructural features of electric field-assisted and conventionally sintered 3 mol% yttria-stabilized zirconia. Ceramics 2018, 1, 3–12. [Google Scholar] [CrossRef]
- Downs, J.A.; Sglavo, V.M. Electric field assisted sintering of cubic zirconia at 390 °C. J. Am. Ceram. Soc. 2013, 96, 1342–1344. [Google Scholar] [CrossRef]
- Steil, M.C.; Marinha, D.; Aman, Y.; Gomes, J.R.; Kleitz, M. From conventional ac flash-sintering of YSZ to hyper-flash and double flash. J. Eur. Ceram. Soc. 2012, 33, 2093–2101. [Google Scholar] [CrossRef]
- Muccillo, R.; Muccillo, E. Shrinkage control of yttria-stabilized zirconia during ac electric field-assisted sintering. J. Eur. Ceram. Soc. 2014, 34, 3871–3877. [Google Scholar] [CrossRef]
- Hao, X.; Liu, Y.; Wang, Z.; Qiao, J.; Sun, K. A novel sintering method to obtain fully dense gadolinia doped ceria by applying a direct current. J. Power Sources 2012, 210, 86–91. [Google Scholar] [CrossRef]
- Valdebenito, J.U.; Akbari-Fakhrabadi, A.; Viswanathan, M.R. Effect of flash sintering on microstructure of Ce0.9Gd0.1O1.95 electrolyte fabricated by tape-casting. Mater. Lett. 2017, 209, 291–294. [Google Scholar] [CrossRef]
- Biesuz, M.; Dell’Agli, G.; Spiridigliozzi, L.; Ferone, C.; Sglavo, V. Conventional and field-assisted sintering of nanosized Gd-doped ceria synthesized by co-precipitation. Ceram. Int. 2016, 42, 11766–11771. [Google Scholar] [CrossRef]
- Spiridigliozzi, L.; Biesuz, M.; Dell’agli, G.; Di Bartolomeo, E.; Zurlo, F.; Sglavo, V.M. Microstructural and electrical investigation of flash-sintered Gd/Sm-doped ceria. J. Mater. Sci. 2017, 52, 7479–7488. [Google Scholar] [CrossRef]
- Jiang, T.; Wang, Z.; Zhang, J.; Hao, X.; Rooney, D.; Liu, Y.; Sun, W.; Qiao, J.; Sun, K.; Jia, T. Understanding the flash sintering of rare-earth-doped ceria for solid oxide fuel cell. J. Am. Ceram. Soc. 2015, 98, 1717–1723. [Google Scholar] [CrossRef]
- Li, J.; Guan, L.; Zhang, W.; Luo, M.; Song, J.; Song, X.; An, S. Sintering behavior of samarium doped ceria under DC electrical field. Ceram. Int. 2018, 44, 2470–2477. [Google Scholar] [CrossRef]
- Muccillo, R.; Muccillo, E.N.S.; Kleitz, M. Densification and enhancement of the grain boundary conductivity of gadolinium-doped barium cerate by ultra fast flash grain welding. J. Eur. Ceram. Soc. 2012, 32, 2311–2316. [Google Scholar] [CrossRef]
- Muccillo, R.; Esposito, V.; de Florio, D.; Muccillo, E. Electric field-assisted pressureless sintering gadolinium-, yttrium- and samarium-doped barium cerate. Scr. Mater. 2018, 156, 6–9. [Google Scholar] [CrossRef]
- M’peko, J.-C.; Francis, J.S.; Raj, R. Field-assisted sintering of undoped BaTiO3: Microstructure evolution and dielectric permittivity. J. Eur. Ceram. Soc. 2014, 34, 3655–3660. [Google Scholar] [CrossRef]
- Uehashi, A.; Yoshida, H.; Tokunaga, T.; Sasaki, K.; Yamamoto, T. Enhancement of sintering rates in BaTiO3 by controlling of DC electric current. J. Ceram. Soc. Jpn. 2015, 123, 465–468. [Google Scholar] [CrossRef]
- Nakagawa, Y.; Yoshida, H.; Uehashi, A.; Tokunaga, T.; Sasaki, K.; Yamamoto, T. Electric current-controlled synthesis of BaTiO3. J. Am. Ceram. Soc. 2017, 100, 3843–3850. [Google Scholar] [CrossRef]
- Perez-Maqueda, L.A.; Gil-Gonzalez, E.; Perejon, A.; Lebrun, J.-M.; Sanchez-Jimenez, P.E.; Raj, R. Flash sintering of highly insulating nanostructured phase-pure BiFeO3. J. Am. Ceram. Soc. 2017, 100, 3365–3369. [Google Scholar] [CrossRef]
- Jesus, L.M.; Silva, R.S.; Raj, R.; M’peko, J.-C. Electric field-assisted flash sintering of CaCu3Ti4O12: Microstructure characteristics and dielectric properties. J. Alloys Compd. 2016, 682, 753–758. [Google Scholar] [CrossRef]
- Zhang, Y.; Luo, J. Promoting the flash sintering of ZnO in reduced atmospheres to achieve nearly full densities at furnace temperatures of <120 °C. Scr. Mater. 2015, 106, 26–29. [Google Scholar]
- Zhang, Y.; Jung, J.-I.; Luo, J. Thermal runaway, flash sintering and asymmetrical microstructural development of ZnO and ZnO–Bi2O3 under direct currents. Acta Mater. 2015, 94, 87–100. [Google Scholar] [CrossRef]
- Gao, H.; Asel, T.J.; Cox, J.W.; Zhang, Y.; Luo, J.; Brillson, L.J. Native point defect formation in flash sintered ZnO studied by depth-resolved cathodoluminescence spectroscopy. J. Appl. Phys. 2016, 120, 105302. [Google Scholar] [CrossRef]
- Muccillo, E.; Muccillo, R. Electric field-assisted sintering of tin dioxide with manganese dioxide addition. J. Eur. Ceram. Soc. 2014, 34, 3699–3706. [Google Scholar] [CrossRef]
- Muccillo, R.; Muccillo, E. Electric field-assisted flash sintering of tin dioxide. J. Eur. Ceram. Soc. 2014, 34, 915–923. [Google Scholar] [CrossRef]
- Gonzalez-Julian, J.; Guillon, O. Effect of electric field/current on liquid phase sintering. J. Am. Ceram. Soc. 2015, 98, 2018–2027. [Google Scholar] [CrossRef]
- Biesuz, M.; Sglavo, V.M. Current-induced abnormal and oriented grain growth in corundum upon flash sintering. Scr. Mater. 2018, 150, 82–86. [Google Scholar] [CrossRef]
- Straka, W.; Amoah, S.; Schwartz, J. Densification of thoria through flash sintering. MRS Commun. 2017, 7, 677–682. [Google Scholar] [CrossRef]
- Raftery, A.M.; da Silva, J.G.P.; Byler, D.D.; Andersson, D.A.; Uberuaga, B.P.; Stanek, C.R.; McClellan, K.J. Onset conditions for flash sintering of UO2. J. Nucl. Mater. 2017, 493, 264–270. [Google Scholar] [CrossRef]
- Valdez, J.; Byler, D.; Kardoulaki, E.; Francis, J.; McClellan, K. Flash sintering of stoichiometric and hyper-stoichiometric urania. J. Nucl. Mater. 2018, 505, 85–93. [Google Scholar] [CrossRef]
- Charalambous, H.; Jha, S.K.; Wang, H.; Phuah, X.L.; Wang, H.; Tsakalakos, T. Inhomogeneous reduction and its relation to grain growth of titania during flash sintering. Scr. Mater. 2018, 155, 37–40. [Google Scholar] [CrossRef]
- Candelario, V.M.; Moreno, R.; Todd, R.I.; Ortiz, A.L. Liquid-phase assisted flash sintering of SiC from powder mixtures prepared by aqueous colloidal processing. J. Eur. Ceram. Soc. 2017, 37, 485–498. [Google Scholar] [CrossRef]
- Yoshida, H.; Morita, K.; Kim, B.-N.; Sakka, Y.; Yamamoto, T. Reduction in sintering temperature for flash-sintering of yttria by nickel cation-doping. Acta Mater. 2016, 106, 344–352. [Google Scholar] [CrossRef]
- Terauds, K.; Lebrun, J.-M.; Lee, H.-H.; Jeon, T.-Y.; Lee, S.-H.; Je, J.H.; Raj, R. Electroluminescence and the measurement of temperature during Stage III of flash sintering experiments. J. Eur. Ceram. Soc. 2015, 35, 3195–3199. [Google Scholar] [CrossRef]
- Muccillo, R.; Muccillo, E.N.S. Light emission during electric field-assisted sintering of electroceramics. J. Eur. Ceram. Soc. 2015, 35, 1653–1656. [Google Scholar] [CrossRef]
- Yamashita, Y.; Kurachi, T.; Tokunaga, T.; Yoshida, H.; Yamamoto, T. Blue photo luminescence from 3 mol% Y2O3-doped ZrO2 polycrystals sintered by flash sintering under an alternating current electric field. J. Eur. Ceram. Soc. 2019, 40, 2072–2076. [Google Scholar] [CrossRef]
- Charalambous, H.; Jha, S.K.; Okasinski, J.; Tsakalakos, T. Spectral analysis and temperature measurement during flash sintering under AC electric field. Materialia 2020, 6, 100273. [Google Scholar] [CrossRef]
- Jha, S.K.; Terauds, K.; Lebrun, J.-M.; Raj, R. Beyond flash sintering in 3 mol % yttria stabilized zirconia. J. Am. Ceram. Soc. 2016, 124, 283–288. [Google Scholar] [CrossRef]
- Raj, R.; Wol, D.E.; Yamada, C.N.; Jha, S.K.; Lebrun, J.-M. On the confluence of ultrafast high temperature sintering and flash sintering phenomena. J. Am. Ceram. Soc. 2023, 26, 3983–3998. [Google Scholar] [CrossRef]
- Chaim, R. Insights into photoemission origins of flash sintering of ceramics. Scr. Mater. 2021, 196, 113749. [Google Scholar] [CrossRef]
- Bechteler, C.; Kirkpatrick, A.; Todd, R.I. Visible light emissions during flash sintering of 3YSZ are thermal radiation. Scripta Mater. 2022, 2019, 114849. [Google Scholar] [CrossRef]
- Kleitz, M.; Kennedy, J.H. Resolution of multicomponent impedance diagrams. In Fast ion Transport in Solids; Mundy, J.N., Shenoy, G.K., Vashishta, P., Eds.; Elsevier: Amsterdam, The Netherlands, 1979; pp. 185–188. [Google Scholar]
- Barsoukov, J.E. Ross Macdonald, Impedance Spectroscopy—Theory, Experiment, and Applications; Wiley-Interscience: Hoboken, NJ, USA, 2005. [Google Scholar]
- Muccillo, R.; Muccillo, E. Electric field assisted sintering of electroceramics and in situ analysis by impedance spectroscopy. J. Electroceramics 2016, 38, 24–42. [Google Scholar] [CrossRef]
- Hewitt, I.J.; Lacey, A.A.; Todd, R.I. A mathematical model for flash sintering. Math. Model. Nat. Phenom. 2015, 10, 77–89. [Google Scholar] [CrossRef]
- Todd, R.I.; Zapata-Solvas, E.; Bonilla, R.S.; Sneddon, T.; Wilshaw, P.R. Electrical characteristics of flash sintering: Thermal runaway of Joule heating. J. Eur. Ceram. Soc. 2015, 35, 1865–1867. [Google Scholar] [CrossRef]
- Bichaud, E.; Chaix, J.; Carry, C.; Kleitz, M.; Steil, M. Flash sintering incubation in Al2O3/TZP composites. J. Eur. Ceram. Soc. 2015, 35, 2587–2592. [Google Scholar] [CrossRef]
- Dong, Y.; Chen, I. Onset Criterion for Flash Sintering. J. Am. Ceram. Soc. 2015, 98, 3624–3627. [Google Scholar] [CrossRef]
- Available online: https://fityk.nieto.pl (accessed on 2 January 2021).
- Wang, T.-S.; Wang, G.-F.; Qiu, M.-L.; Cheng, W.; Zhang, J.-F.; Zhao, G.-Q. The origin of the 500 nm luminescence band related to oxygen vacancies in ZrO2. J. Lumin. 2021, 237, 118133. [Google Scholar] [CrossRef]
- Dickinson, J.; Langford, S.; Avanesyan, S.; Orlando, S. Color center formation in KCl and KBr single crystals with femtosecond laser pulses. Appl. Surf. Sci. 2007, 253, 7874–7878. [Google Scholar] [CrossRef]
- Costantini, J.-M.; Beuneu, F. Point defects induced in yttria-stabilized zirconia by electron and swift heavy ion irradiations. J. Phys. Condens. Matter 2011, 23, 115902. [Google Scholar] [CrossRef] [PubMed]
- Anselmi-Tamburini, U.; Woolman, J.N.; Munir, Z.A. Transparent Nanometric Cubic and Tetragonal Zirconia Obtained by High-Pressure Pulsed Electric Current Sintering. Adv. Funct. Mater. 2007, 17, 3267–3273. [Google Scholar] [CrossRef]
- Tsukuma, K.; Yamashita, I.; Kusunose, T. Transparent 8 mol% Y2O3–ZrO2 (8Y) Ceramics. J. Am. Ceram. Soc. 2008, 91, 813–818. [Google Scholar] [CrossRef]
Figure 1.
Experimental setup for measuring luminescent emission during electric-field-assisted sintering (details in the text).
Figure 1.
Experimental setup for measuring luminescent emission during electric-field-assisted sintering (details in the text).

Figure 2.
X-ray diffraction patterns of (a) ZrO2: 8 mol% Y2O3 (8YSZ) and (b) CeO2: 20 mol% Sm2O3 (20SDC) flash-sintered ceramic pellets. The Miller indices used are depicted, using the JCPDS 01-070-4436 file for 8YSZ and the JCPDS 75-0158 file for 20SDC.
Figure 2.
X-ray diffraction patterns of (a) ZrO2: 8 mol% Y2O3 (8YSZ) and (b) CeO2: 20 mol% Sm2O3 (20SDC) flash-sintered ceramic pellets. The Miller indices used are depicted, using the JCPDS 01-070-4436 file for 8YSZ and the JCPDS 75-0158 file for 20SDC.

Figure 3.
Scanning electron micrographs and EDS plots of ZrO2: 8 mol% Y2O3 (top) and CeO2: 20 mol% Sm2O3 (bottom) flash-sintered ceramic pellets.
Figure 3.
Scanning electron micrographs and EDS plots of ZrO2: 8 mol% Y2O3 (top) and CeO2: 20 mol% Sm2O3 (bottom) flash-sintered ceramic pellets.

Figure 4.
Impedance spectroscopy diagrams of (a) ZrO2: 8 mol% Y2O3 (8YSZ) ceramic pellets flash-sintered at 800 °C and (b) sintered at 1650 °C/4 h. Insets: exploded view of diagrams measured at high temperatures; numbers stand for log f (f: Hz).
Figure 4.
Impedance spectroscopy diagrams of (a) ZrO2: 8 mol% Y2O3 (8YSZ) ceramic pellets flash-sintered at 800 °C and (b) sintered at 1650 °C/4 h. Insets: exploded view of diagrams measured at high temperatures; numbers stand for log f (f: Hz).

Figure 5.
Top: spectrometric optical data in the 200–1200 nm range of the luminescent emission detected at 800 °C during flash sintering of ZrO2: 8 mol% Y2O3 (8YSZ) and CeO2: 20 mol% Sm2O3; (20SDC) bottom: thickness monitoring of both ceramic pellets with the digital linear gauge.
Figure 5.
Top: spectrometric optical data in the 200–1200 nm range of the luminescent emission detected at 800 °C during flash sintering of ZrO2: 8 mol% Y2O3 (8YSZ) and CeO2: 20 mol% Sm2O3; (20SDC) bottom: thickness monitoring of both ceramic pellets with the digital linear gauge.

Figure 6.
Optical spectrometric data of the luminescent emission detected at 800 °C before (top), during (center), and after (bottom) the shrinkage surge under flash sintering of CeO2: 20 mol% Sm2O3 (20SDC) and ZrO2: 8 mol% Y2O3 (8YSZ). The red lines are plots of the deconvolution bands using the Fityk software [53]; the blue lines represent the deviation of the sum of the deconvoluted and the experimental spectra.


Table 1.
Values of wavelengths at the peak amplitude of the Gaussian bands obtained by deconvolution of the luminescent spectra collected before, during, and after the occurrence of the flash event during flash sintering of CeO2: 20 mol% Sm2O3 and ZrO2: 8 mol% Y2O3; bold red types denote extra band maxima.
| Sample, λmax (nm) |
|---|
| 20SDC before flash 610, 750, 940 |
| 20SDC during flash 517, 610, 690, 750, 940 |
| 20SDC after flash, 610, 750, 940 |
| 8YSZ before flash, 610, 750, 940 |
| 8YSZ during flash 500, 610, 680, 750, 940 |
| 8YSZ after flash, 610, 750, 940 |
Disclaimer/Publisher’s Note: The statements, opinions and data contained in all publications are solely those of the individual author(s) and contributor(s) and not of MDPI and/or the editor(s). MDPI and/or the editor(s) disclaim responsibility for any injury to people or property resulting from any ideas, methods, instructions or products referred to in the content. |
© 2024 by the authors. Licensee MDPI, Basel, Switzerland. This article is an open access article distributed under the terms and conditions of the Creative Commons Attribution (CC BY) license (https://creativecommons.org/licenses/by/4.0/).
Share and Cite
MDPI and ACS Style
Muccillo, R.; Diaz, J.C.C.A.; Muccillo, E.N.S. Analysis of the Luminescent Emission during Flash Sintering of 8YSZ and 20SDC Ceramics. Ceramics 2024, 7, 329-341. https://doi.org/10.3390/ceramics7010021
AMA Style
Muccillo R, Diaz JCCA, Muccillo ENS. Analysis of the Luminescent Emission during Flash Sintering of 8YSZ and 20SDC Ceramics. Ceramics. 2024; 7(1):329-341. https://doi.org/10.3390/ceramics7010021
Chicago/Turabian StyleMuccillo, Reginaldo, Julio Cesar C. A. Diaz, and Eliana N. S. Muccillo. 2024. "Analysis of the Luminescent Emission during Flash Sintering of 8YSZ and 20SDC Ceramics" Ceramics 7, no. 1: 329-341. https://doi.org/10.3390/ceramics7010021