Abstract
In this numerical study, the performance of ceramic-based mullite hollow fiber (HF) membranes in a direct contact membrane distillation (DCMD) process was evaluated. Three types of membranes were tested: (i) hydrophobic membrane C8-HFM, (ii) rod-like omniphobic membrane (C8-RL/TiO2), and (iii) flower-like omniphobic membrane (C8-FL/TiO2). The CFD model was developed and validated with experimental results, which were performed over a 500 min period. The initial mass flux of C8-HFM was 30% and 9% higher than that of C8-FL/TiO2 and C8-RL/TiO2, respectively. However, the flower-like omniphobic membrane C8-FL/TiO2 had the lowest drop in flux, around 11%, while the rod-like omniphobic membrane C8-RL/TiO2 had a 15% reduction, both better than the 23% reduction in the hydrophobic membrane C8-HFM over the 500 min. The study also analyzed the impact of fouling by examining the variation in mass transfer coefficient (MTC) over time. The results indicated that the ceramic-based mullite HF membranes with TiO2 flowers and rods demonstrated a high resistance to fouling compared to C8-HFM. The modified membranes could find applications in the desalination and handling of seawater samples containing organic contaminants. The CFD model’s versatility can be utilized beyond the current investigation’s scope, offering a valuable tool for efficient membrane development solutions, particularly for challenges such as the presence of organic contaminants in seawater.
1. Introduction
Thermally driven membrane distillation (MD) is gaining popularity as a method for desalinating seawater due to its ability to eliminate the requirement for extra condensation apparatus. MD is a promising alternative to traditional desalination methods like reverse osmosis (RO), primarily when waste heat can be effectively utilized. However, several challenges must be addressed to enhance its commercial viability, including the relatively low membrane mass flux observed in MD modules [1,2]. Research and application have led to the development of four distinct MD configurations. These are, namely, direct contact membrane distillation (DCMD), sweeping gas membrane distillation (SGMD), air gap membrane distillation (AGMD), and vacuum membrane distillation (VMD). Among these, DCMD stands out as an excellent choice, particularly well-suited for desalination purposes thanks to its uncomplicated operation, minimal equipment demands, and relatively high permeation flux [3,4,5].
Nonetheless, of the three commonly employed DCMD geometries—flat-sheet (FS), tubular, and hollow-fiber (HF)—the latter, HF, has recently gained significant traction as a promising choice for real-world desalination applications [6]. Hollow-fiber modules offer several noteworthy benefits, such as their self-supporting operation and remarkable resistance to polarization and fouling effects [6,7]. Notably, hollow-fiber modules can achieve a high packing density of up to 9000 m2 per m3 through simple assembly, allowing for further enhancements, including spacers and turbulent promoters [8]. Aside from selecting an appropriate module, the choice of membrane material also exerts a notable influence on the performance of the DCMD module. Membrane material selection can substantially impact factors like permeability, selectivity, and overall efficiency within the desalination process. While polymeric membranes are often chosen for their cost effectiveness, they come with limitations, notably restricted chemical and thermal stability [9]. One advantage of polymeric membranes is their ease of modification, coupled with a relatively low thermal conductivity, which typically falls within the range from 0.1 to 0.5 Wm−1 K−1. Conversely, ceramic membranes are widely acknowledged for their exceptional chemical and mechanical stability, high water permeation flux, reduced fouling propensity, and excellent resilience to aggressive cleaning procedures, without compromising the membrane integrity [10]. The widespread adoption of commercial ceramic membranes has been impeded by the prohibitively expensive raw materials, including titania, zirconia, alumina, and silicon carbide [10]. Consequently, ceramic-based membranes come at a significantly higher cost compared to their polymeric counterparts. In response to this challenge, scientists have ventured into exploring cost-effective alternatives by turning to naturally available materials like pyrophyllite, bauxite, rice husk, apatite powder, dolomite, calcite, sawdust, and mineral coal fly ash [11,12]. The utilization of alternative raw materials in the production of ceramic membranes can bring about notable benefits for the desalination sector, including cost efficiency and sustainability.
A recent investigation was conducted by Haiqal et al. [13], which showcased the successful development of mullite membranes using ball clay as the primary raw material, followed by a comprehensive assessment of their performance. The study’s results demonstrated that mullite membranes derived from ball clay offer an economical and practical solution for producing high-performance membranes. Membrane fouling and wetting remain significant challenges for the sustainability of MD processes. Traditional hydrophobic membranes tend to experience wetting from low-surface-tension substances found in saltwater, including dissolved organic matter, surfactants, and hydrophobic species. This wetting process leads to fouling, resulting in the intrusion of liquid and a decline in permeate flux, thereby impacting the long-term performance of MD systems [14,15]. Researchers have discovered that modifying membrane surfaces can significantly enhance their resistance to fouling. As a result of these efforts, two membranes, namely a rod-like omniphobic membrane (C8-RL/TiO2) and a flower-like omniphobic membrane (C8-FL/TiO2), were developed in our previous study [16], which demonstrated impressive resistance to low-surface-tension feed liquids, effectively repelling them.
Utilizing computational fluid dynamics (CFD) offers an efficient approach to understanding the transport phenomena in membrane separation systems, phenomena that are sometimes inaccessible through experimental tests. Additionally, this will prove the ability to provide detailed flow information at any specific location within the studied geometry without causing any disruption or discontinuity to the flow or overall operation. These capabilities of CFD lead to significant reductions in the time, costs, and risks associated with experimental work, thus enabling performance optimization and the identification of ‘performance bottlenecks’.
This numerical study aims to develop a CFD model for a ceramic-based naturally occurring material, a novel endeavor in the field. The performance of DCMD manufactured from this ceramic material will be assessed, considering both unmodified and modified surfaces. The evaluation aims to enhance performance by extending the desalination operational time and reducing fouling tendencies.
2. Materials and Methods
In this case, an in-depth investigation was conducted by gathering experimental data from a desalination process using a fabricated hydrophobic mullite ceramic hollow-fiber membrane (M-CHFM) and two mullite surface-modified membranes, namely omniphobic flower-like membrane C8-FL/TiO2 and omniphobic rod-like membrane C8-RL/TiO2. Subsequently, the CFD model was created, considering material properties, geometric configuration, and boundary conditions to accurately simulate ceramic membranes by incorporating the obtained experimental data. By establishing a robust validation process, the credibility of the analysis of ceramic membranes is enhanced. This rigorous validation approach ensures the reliability and accuracy of the subsequent findings in the study. Furthermore, the developed numerical simulations were utilized to model the performances and blockage times of three ceramic membranes, which focused on a comparison between the mullite surface-modified membranes (C8-RL/TiO2 and C8-FL/TiO2) with the original mullite membrane. This analysis aimed to improve the comprehension of membrane behavior and facilitate stable and efficient operation in various applications, including desalination and treating seawater containing organic contaminants.
2.1. Mullite HF Membrane Fabrication, Surface Modification, and Characterization
The original mullite ceramic membrane was fabricated, modified, and characterized by our research group in our laboratory in Universiti Teknologi Malaysia [13]. The membranes’ fabrication was conducted using the wet-spinning method with the sintering technique. Ball clay powder was mixed with Polyethyleneglycol 30 Dipolyhydroxystrearate (Arlacel P135) and N-methyl 2-pyrrolidone (NMP) to produce a ceramic suspension. After milling and adding a polymer binder, the suspension was degassed and spun according to the method as described elsewhere [17], which can be found in the Supplementary Materials. The precursor underwent an air gap and coagulation bath before being dried and sintered in a tube furnace. The sintered hollow fibers were then cooled. Surface modification was achieved through surface functionalization. A rough layer composed of flower-like (FL) and rod-like (RL) TiO2 structures was applied by using a hydrothermal method at different reaction times (5 h for the rod-like structure and 10 h for the flower-like structure). Subsequently, surface fluorination was conducted using 1H,1H,2H,2H-perfluorodecyltriethoxysilane. As a result, two different hollow-fiber membranes were created employing these techniques, TiO2 flower fluorinated (C8-FL/TiO2) and TiO2 rod fluorinated (C8-RL/TiO2), and detailed information is available in the Supporting Information section. The thermophysical properties of the membrane, which can represented by (Ҳ), including density (), specific heat (Cp,m), and thermal conductivity (km), can be expressed as functions of the membrane porosity and the corresponding properties of the membrane material (mullite in this case) and vapor [18].
The properties of the mullite, vapor, and testing fluids (seawater and pure water) are listed in Table 1—the values are the same as existing literature [19,20,21,22].

Table 1.
Thermophysical properties of used materials.
Tortuosity, which characterizes the fluid flow pathway within a membrane, was calculated based on the membrane’s porosity [23,24]. The surface morphology of the developed membranes was observed using a scanning electron microscope (SEM). The cross-sectional area was evaluated with a field emission scanning electron microscope (FESM) equipped with an energy-dispersive X-ray (EDX) analyzer. The mercury intrusion porosimetry (MIP) technique was utilized to measure the membrane porosity characteristics, such as the pore size distribution and total porosity [16]. FESM images of the three ceramic membrane’s cross-sections, highlighted in Figure 1, were digitalized to obtain the inner and outer diameters of the three different membranes [16].
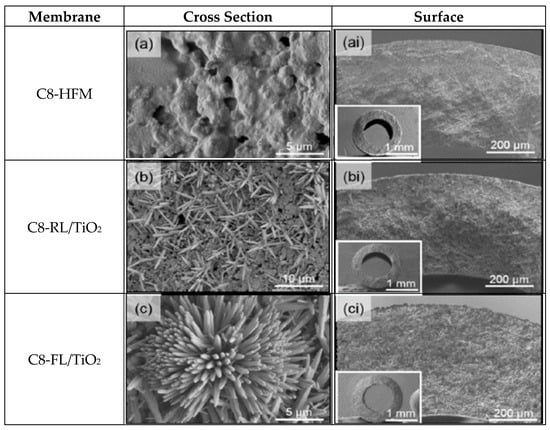
Figure 1.
SEM surface image (a,b,c) and cross-sectional (ai,bi,ci) morphology for mullite original and surface modified membrane at a magnification of 2000–3000× [16]. Reprinted with permission from [16], 2020, Membrane Science.
Since the inner or outer membrane surfaces were not a perfect circle, the measured values were averaged to obtain the main diameters. The membranes were installed in a 9 cm long acrylic tube, with an effective length of hollow fibers of 7 cm. The characteristics of the 3 different produced membranes are presented in Table 2.
Table 2.
Properties of the three mullite-based membranes.
2.2. CFD Modeling Methodology
2.2.1. Governing Transport Equations in the CFD Model
In the DCMD process, mass transfer occurs across the membrane through the following steps: (1) the evaporation of liquid takes place in the feed side, (2) the resultant vapor flows from the feed side to the permeate side of the membrane, and (3) upon reaching the permeate side, condensation transpires due to the low temperature at the permeate side. This mass transfer process generates a mass flux across the membrane, known as transmembrane mass flux. In the case of a single fiber, as considered in this study, the transmembrane mass flux rate is observed to be insignificant compared to the mass flow rates of both the feed and permeate [25]. Consequently, this negligible contribution simplifies the complex membrane modeling, specifically regarding mass transfer and heat transfer considerations.
The first assumption is to ignore the transmembrane mass flux influence in the continuity and momentum equations, Equations (1) and (2). However, the heat generated and consumed due to evaporation and condensation, i.e., the latent heat, is incorporated into the energy equation, Equation (3), as an extra source term. Considering steady-state modeling, the conservation equations are presented as follows:
In these equations, is the velocity at the Cartesian coordinate direction of i, is the coordinate distance in the direction of i, is the density, p is the pressure, is the fluid viscosity, is the turbulent viscosity, is the gravity, T is the temperature, is the specific heat coefficient, is the heat conductivity coefficient, and (W m−3) is the latent heat source term, Equation (4). is the feed’s latent heat flux, and thus, the heat source term can be presented by , which is negative as the evaporation absorbs energy. Here, is the distance between the computational cell center and the membrane surface. Then, the heat source term on the permeate side is . The ratio of describes the area ratio of the membrane between the outer surface (in contact with the feed) and the inner surface (in contact with the permeate), i.e., the inner and outer fiber radii.
The mass flux across a porous membrane relates to the pressure gradient between its two sides. For hydrophobic membranes, as the driving mechanisms are evaporation and condensation [26], the mass flux relation can be presented by Equation (5):
is the coefficient of the relation which will be presented as the MTC in this paper. Vapor pressure on the feed side is represented by , while is that on the permeate sides. In DCMD models, determining the MTC constitutes a fundamental distinction among different approaches [27]. The effective membrane properties, such as porosity, contact angle, and thickness, along with the MD operating conditions, such as pressure and temperature, collectively contribute to the intrinsic MTC of the membrane. However, studies have indicated that the dependency on operating conditions is relatively insignificant and can be neglected [28,29,30]. Therefore, it is feasible to approximate the membrane properties as constant values obtained through fitting experimental measurements [25]. Consequently, this study employs a constant value of C, derived from a series of tested single-fiber modules, for the simulations.
The vapor pressures and are functions of the local temperature at the membrane surface. is the product of water activity and the vapor saturation pressure , where it is calculated from the Antoine equation [31] at temperature T:
The water activity is calculated using the correlation proposed by [27] as follows:
The parameter b represents the molality of NaCl (mol/kg). In the experimental analysis, since the fabricated membranes demonstrated a complete salt rejection of approximately 99.99% [32], the value of for the distillate was assumed to be 1, similar to the approach followed in reference [33].
Hence, Equation (5) can be modified as follows:
Here, is the saturation pressure difference across the membrane, is the saturation pressure on the feed contact of the membrane, and is the saturation pressure of the permeate contact of the membrane.
Considering a constant latent heat coefficient and knowing the transmembrane mass flux, the evaporation/condensation energy can be estimated by Equation (10),
Note that, as we calculate the absorbed energy on the feed contact side of the membrane and then correlate it with the released energy on the membrane permeate side, represents the latent heat at the feed side temperature (). The Nusselt number (Nu) was estimated using the Reynolds number (Re), using the formula of , which is frequently found in the literature [34,35,36,37,38]. In this investigation, the correlation equation’s exponent “c” used a value of 0.33 and was found to be a commonly used value for Prandtl number (Pr) correlations [35,39,40]. The Nusselt Equation proposed by Thomas [41] was used and is highlighted as being suitable for membrane distillation (MD) applications [42].
2.2.2. Geometry and Boundary Conditions
Figure 2 presents a general description of a single-fiber module with a cylindrical structure. In order to follow the experimental setup, a counter-flow setup where the permeate flowed in the inner tube and the feed passed through the outer tube separated by the membrane was considered, as shown in Figure 2a. The fiber was assumed to have a length of L, membrane inner radii of , membrane outer radii of , membrane thickness , and housing radii of Rh, as demonstrated in Figure 2b. The temperature across the fiber schematic picture is also shown in Figure 2c, in which is the feed inflow temperature, is the feed outflow temperature, is the permeate inflow temperature, is the permeate outflow temperature, is the feed–membrane contact temperature, and is the permeate–membrane contact temperature.
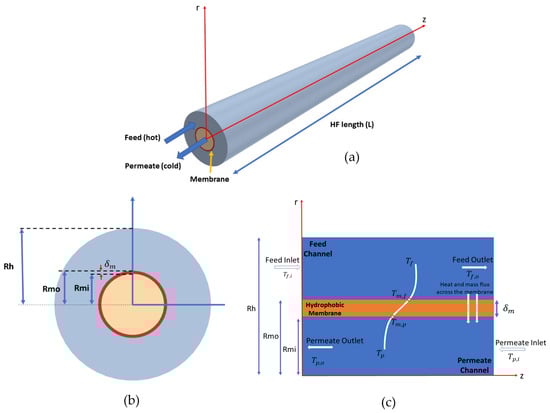
Figure 2.
(a) Schematic of the computational domain of a single hollow-fiber module, (b) cross-sectional view of the DCMD module, and (c) schematic representation of DCMD configuration: Tf and Tp refer to the local bulk stream temperatures along the feed and permeate.
The model consists of three major components: a ceramic membrane that serves as the solid domain, as well as feed and permeate streams that correspond to fluid domains [43]. The inlet and outlet boundaries are highlighted in Table 3 and were established in line with [25], such that the boundaries were defined to be velocity inlets and pressure outlets. In the feed and permeate inlets, the velocity and temperature of the flow were constant and predefined according to the operating conditions. At the outlets, the pressure was set to zero, and the other properties were the results of the simulations. At the membrane wall, a no-slip condition was applied for the velocity along with the conjugate heat condition, indicating that both the temperature and heat flux were equal between the flow and the membrane surfaces, as presented in Equations (13) and (14):
Table 3.
Operating conditions of the reference DCMD.
No-slip conditions were assumed within the boundary layer next to the membrane walls. The module’s outer wall surfaces were thermally insulated with no heat loss to the ambient. The internal interface boundaries (feed/membrane and membrane/permeate) were considered as conjugate heat transfer (CHT) boundaries, which was set in the simulator as the “contact interface thermal condition”. Since the fiber’s length-to-diameter ratio (L/d) was sufficient, the entry effects on both sides of the membrane may be ignored [44]. The MD vapor flux impact on the feed and permeate flows was negligible, while the transmembrane flux had minimal impact on the properties of the fluid. A heat transfer function was developed to calculate the heat transfer source term during the evaporation and condensation of water occurring at the membrane adjacent cells. The function was linked to the energy equation to transfer the heat from the feed to the permeate. The heat flux was assigned as an energy source at the interfaces. At the feed/membrane and membrane/permeate interfaces, the source terms were defined as outflow from the feed channel and inflow into the permeate channel, respectively. The energy term was linked to the equation used for calculating qMD, and the values of J were determined by integrating the mass and momentum source terms into corresponding formulas.
2.2.3. Software Tool, Computational Settings, and Algorithm
CFD simulations were executed using the commercial software of Star-CCM+ ver. 2302 [45]. The simulations in this study can be conducted in a two-dimensional (2D) axisymmetric flow configuration. This approach assumes that the fiber performance is primarily dominated by the axial and radial directions rather than in the azimuthal direction. This assumption provides a simplified yet accurate representation of the flow dynamics within the membrane, enabling a comprehensive analysis of the DCMD performance. The pre-processing step in this study involved the utilization of CAD (computer-aided design) and the Star-CCM+ software’s meshing packages. A Polygonal Mesher with a target cell size of 4.0 × 10⁻⁵ m was employed to create the computational cells. Prismatic layers were generated close to the membrane contact surfaces where the thermal boundary layers formed, giving the smallest cell size of 4 × 10⁻⁶ m. In Figure 3, the cell distribution across the fiber and a close-up view of the membrane are presented.
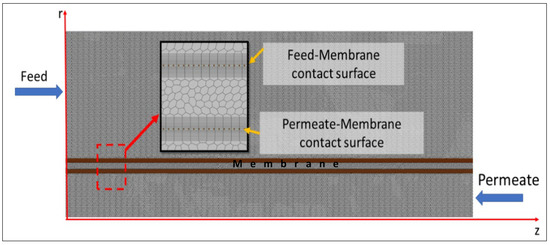
Figure 3.
Mesh and cell distribution across the fiber.
The feed, membrane, and permeate geometries were created as three-dimensional (3D) geometry inside the software. Then, the utility called Badge for 2D meshing was converted into axisymmetric geometries. The computational domain consisted of prismatic layers on membrane contact surfaces and the housing surface to capture the boundary layers, viscous and thermal. To follow the StarCCM+ guideline on capturing the thermal boundary layer, around 20 layers of prismatic cells were employed. The rest of the domain was meshed using the Polyhedral Mesher with a target cell size of 0.2 mm. Close to the contact surfaces, an extra cell refinement criterion was applied to provide finer cells with sizes around 0.04 mm. The target cell size was obtained by conducting a mesh dependency study including five cases, as shown in Table 4, with target cell sizes ranging from 0.1 mm to 1.6 mm. The range considered in Yu was based on the guidelines from the Star CCM+ for thermal boundary layer analysis [45].
Table 4.
Target cell sizes for different cases designed for mesh dependency study.
Both the feed and permeate flows were treated as constant density flows. The mass and momentum equations were solved using the SIMPLE (semi-implicit method for pressure linked equation) algorithm coupled with the energy equation through the couple solver of the software. All the gradients were resolved by the second-order linear scheme, where a limiter was used to compensate for the errors introduced by the highly skewed surfaces. The Under Relaxation Factor (URF) determines the extent to which newly computed data replace the old data in each iteration step of the solution [45], and was defined as 0.3 for the coupled implicit solver.
The maximum allowable residual of 10−6 was applied to the solution of each equation to satisfy a proper convergence, such a figure was implemented, and the convergence was achieved in [46]. To calculate the saturation pressure on the membrane surfaces, a probe line consisting of 200 points was defined on the feed–membrane and membrane–permeate contact surfaces. Then, the temperature was interpolated on these points. Then, the saturation pressure on these probe points was calculated using the Antoine equation and through a field function. Two more field functions were developed to calculate the energy source terms of the membrane contact with adjacent cells. Mass and heat transfer across the membrane were calculated according to Equations (8) and (9).
The present study used the previously developed CFD methodology to couple the Navier–Stokes equations with the energy equation to model the hydrodynamic and thermal performance of DCMD. A heat transfer function was developed to calculate the heat transfer source term during the evaporation and condensation of water occurring at the membrane adjacent cells. The function was linked to the energy equation to transfer the heat from the feed to the permeate. The heat transfer coefficient, temperature profiles on the feed–membrane and membrane–permeate contact surfaces, and MD thermal efficiencies at different operating conditions were some of the outcomes of this study. The numerical analysis in this study focused on evaluating the influence of the target cell size on the predicted results of a reference polymeric hollow-fiber membrane. Mesh dependency tests were conducted, highlighting the sensitivity of the temperature profiles to the cell size. The blended CDS scheme was employed for the discretization to solve the mathematical equations accurately. The agreement between the numerical analysis and experimental measurements confirmed the reliability and effectiveness of the methodology.
2.2.4. Validation Process
The validation process for the developed model consisted of two parts, including numerical model calibration and ceramic model validation. The numerical model calibration was conducted based on data from prior studies, using experimental data by Yu [25] and numerical data utilizing the Star CCM+ software by Belin [47]. The successful calibration and validation of the PVDE membrane using this software, previously unutilized for membrane modeling, established a solid foundation for its application in this study. Subsequently, the ceramic model calibration was performed using DCMD experimental data previously established in [16].
3. Results
3.1. Numerical Model Calibration
In this section, the developed numerical model was calibrated and validated utilizing data from the existing literature by Yu [25] and Belin [47]. This step was crucial to establish the validity and reliability of the constructed model before extending its application to ceramic features.
3.1.1. Mesh Dependency Test
This analysis was conducted to assess the mesh cell size’s impact on the predicted results of the reference single hollow-fiber membrane [25,30,47] and ensure accurate outcomes from the developed CFD model. Feed and permeate outlet temperatures were selected as parameters to compare numerical simulations with experimental data [25] for various target cell sizes, as shown in Figure 4. The mesh dependency study was conducted using a membrane length (L) of 0.25 m, a feed inlet velocity (Uf,I) of 0.060 m/s, and a permeate inlet velocity (Up,I) of 0.4171 m/s, corresponding to Reynolds numbers of 836 and 460, respectively. The permeate temperature exhibited a higher degree of sensitivity to changes in cell size compared to the feed temperature. This observation highlights the importance of selecting an appropriate cell size to accurately predict the performance of the membrane in terms of temperature profiles.
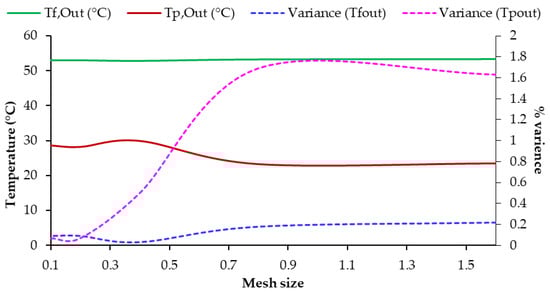
Figure 4.
Mesh dependency study: comparison of outlet temperatures between experimental model outputs, References are (52.7 °C) and (28.4 °C).
3.1.2. Average Bulk Temperature along Membrane Length
The impact of the membrane length on the average bulk temperature of the fiber for both the feed and permeate sides, as well as its comparison with experimental data [25], is presented in Table 5. In this analysis, the inflow feed and permeate temperatures and velocities were maintained as constant, while the changes in fiber length were monitored to observe the resulting variation in outflow temperature. This comparison demonstrates that the numerical results showed an excellent agreement with the experimental data, with a less than 1% discrepancy, which is aligned with the mesh dependency analysis outcome.
Table 5.
Comparison of feed and permeate averaged bulk temperature for different fiber lengths: experimental against model outputs (Ref = 836, Rep = 460).
The temperature distribution of the membrane contact surfaces, considering the feed and permeate sides, was analyzed numerically in this study. The simulation considered specific parameters, including the same L, , and in 6.1.1 with a feed inlet velocity of Uf,In = 0.144 m/s corresponding to Ref = 2000. Figure 5 displays the obtained temperature distribution and includes the results from a reference study [47] for comparison and further model validation. The temperature difference across the contact surfaces, combined with the properties of the membrane, are key factors in determining the permeation mass flux. The following sections will discuss a further analysis and comparison with ceramic mullite membranes.
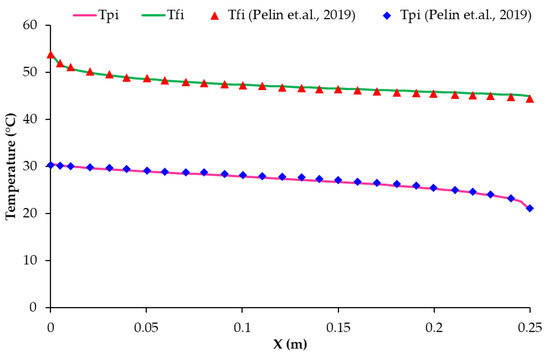
Figure 5.
Temperature distribution of the membrane contact surface at feed and membrane sides (Ref = 2000, Rep = 460); comparison with previous published data [47].
3.1.3. Transmembrane Mass Sensitivity with Feed Velocity
Figure 6 illustrates the impact of the feed velocity on the permeation flux, comparing the obtained numerical results in this study with experimental measurements by [25] and previous CFD studies from [47]. The module operates with Up,In = 0.4171 m/s, = 53 °C, and = 21 °C. The graph indicates that the permeate flux increased as the feed velocity rose. The numerical results demonstrate an almost linear relationship between the mass flux and feed velocity, whereas the experimental data show a less pronounced performance enhancement, resulting in a lower increase in mass flux at higher feed velocities.
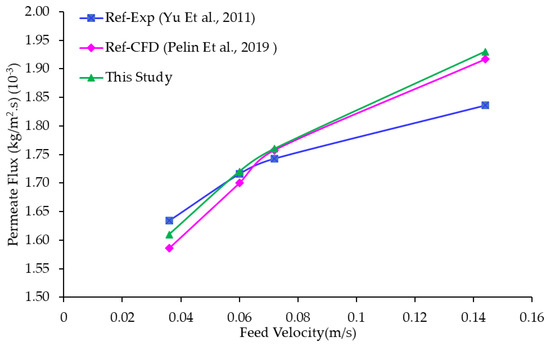
Figure 6.
Permeate flux versus the feed velocity for a single hollow-fiber module; comparison with previous published data [25,47].
3.2. Ceramic Membrane Numerical Model Putput
3.2.1. Model Validation
In the DCMD mathematical model described in Section 2, the membrane properties, such as porosity, contact angle, and thickness, are accounted for by the MTC coefficient in Equation (9). [48,49]. The MTC value directly affects the trans-membrane flux and heat source terms. Figure 7 compares the experimental measurements and numerical predictions of the trans-membrane mass flux (J) for three tested membranes: C8-HFM, C8-RL/TiO2, and C8-FL/TiO2. The experimental measurements and CFD simulations were conducted with constant permeate and feed inlet velocities and temperatures. The CFD predictions with all values exhibited excellent agreement with less than 10% of the experimental flux values, including Jo and Javg, for the three studied membranes. The excellent agreement between the mathematical model results and experimental data demonstrates high confidence in our mathematical model’s accuracy and predictive capability. The experimental measurements and simulations were conducted with constant permeate and feed inlet velocities and temperatures, depicted in the Table 3. Figure 7 indicates the initial mass flux and average mass flux for all tested membranes, which indicates that the initial mass flux for C8-HFM was higher than that of the surface modified membranes (C8-RL/TiO2 and C8-FL/TiO2). It is noted that the initial mass flux, in the case of the unmodified ceramic membrane, was about 30% higher than the C8-FL/TiO2 and 9% higher than the C8-RL/TiO2 membrane.
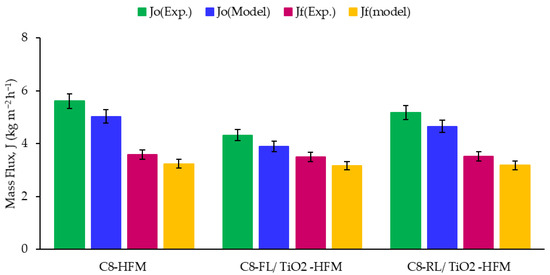
Figure 7.
Comparison of experimental measurements and simulation calculated initial (red bars) and averaged (green bars) trans-membrane mass flux for different membrane types.
3.2.2. Membrane Flux and the Correlation with Intrinsic Mass Transfer
A comparative analysis of membrane flux was conducted for the three investigated membrane types (original mullite with two surface-modified membranes), utilizing both experimental and numerical analyses, as shown in Figure 8.
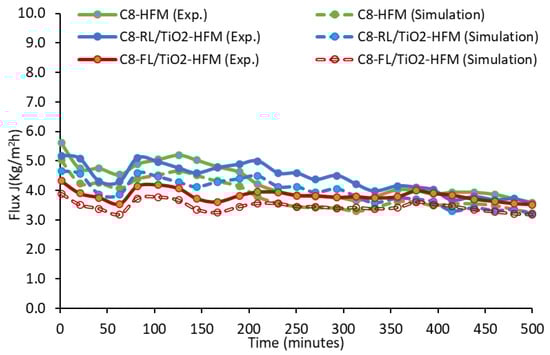
Figure 8.
Real-time trans-membrane mass flux for different membrane types over time with experimental and modeling data.
The data show agreement between the modeling results and experimental outputs, illustrating the model’s capability and credibility for modeling ceramic membranes. The minor fluctuations in the flux over time may have been due to the recycling of the hot feed and the top-up of fresh feed, which could have had a minor effect on the feed concentration and overall mass balance. The analysis facilitated a comprehensive comparison of membrane performance, as presented in Table 6, considering the influence of different membrane types on the flux behavior.
Table 6.
Performance characteristics of different membrane types with experimental [16] and modeling data.
3.2.3. Fouling Impact on Membrane Performance
Upon calibrating each data point of the J values over time using the correlation shown in Figure 9, it was possible to extract the variation in the MTC over time up to 500 min for each hollow-fiber membrane (HFM), as demonstrated in Figure 9a. These results allow us to evaluate and analyze the performance of the HFMs under different operating conditions over time. Based on the analysis, it is clear that, among the evaluated HFMs, C8-FL/TiO2 showcased the highest level of performance stability, which is indicated by its consistent MTC value and normalized MTC trendlines over time. On the contrary, C8-HFM exhibited the lowest stability, as evidenced by the fluctuations and drop in the MTC values and normalized MTC trendlines in Figure 9b.
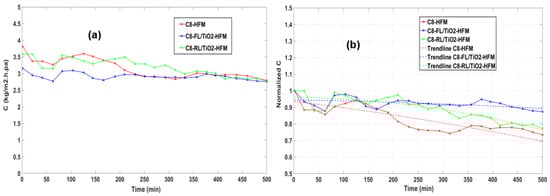
Figure 9.
Values of parameter change over time (up to 500 min) for various membrane types during the experiment for (a) MTC and (b) normalized MTC.
The Polyfit curve fitting function in MATLAB software ver. R2017b was used to accurately fit the data points and derive a normalized mathematical relationship of the MTC values with time. This analysis enabled the interpretation of MTC trends, estimating the MTC values within and beyond the available data range, and provided a quantitative framework to understand the variation in the MTC for different DCMD systems. Such data can be valuable for optimizing the DCMD design and operating conditions. In Figure 9b, the dashed lines represent the derived mathematical relationship of the MTC with time.
The fouling resistances of C8-HFM, C8-RL/TiO2-HFM, and C8-FL/TiO2-HFM in an MD were also evaluated by our research group by assessing the changes in the morphology and water contact angle after 500 min [16]. The C8-HFM membrane lost its omniphobicity, with a decrease in the contact angle to 93° due to the deposition of a foulant layer, reducing its effective surface coverage. This fouling formed sporadic cake-like layers, clogging some membrane pores (see Figure 10a). Similar morphologies were observed in an earlier study [50]. C8-RL/TiO2-HFM showed a reduced contact angle of 106°, attributed to a clear foulant layer at the nano-scale and damage to TiO2 nanorods under sporadic foulant domains (Figure 10b). In contrast, C8-FL/TiO2-HFM maintained its original water and oil contact angle. The TiO2 microflowers on its surface remained intact, and no noticeable morphology change or fouling layer was observed, even after 500 min of the MD operation (Figure 10c).
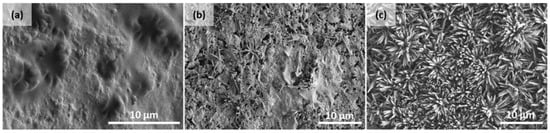
Figure 10.
FESEM images for different membrane types: (a) C8-HFM, (b) C8-RL/TiO2-HFM, and (c) C8-FL/TiO2-HFM after 500 min of testing [16]. Reprinted with permission from [16], 2020, Membrane Science.
The permeate flow reduction factor, introduced by Rahimnia [51], also known as the normalized flux decline (FDn) parameter, can be used to evaluate the influence of fouling on membrane performance in various geometries and configurations. Since no dedicated fouling experiment has been performed, FDn is defined as the following [52]:
The values of FDn ranged from 0% to 95%. The foulant nature has a significant effect on these values. In general, organic foulants (more prominent in desalination) caused more decline in the normalized flux compared to inorganic foulants. The FDn values obtained from the three membranes are highlighted below in Figure 11.
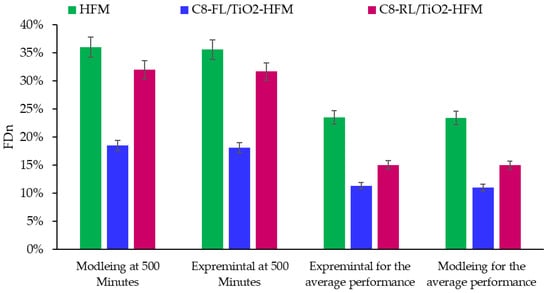
Figure 11.
FDn of different membranes with experimental and modeling data.
With the lowest FDn of 11.34 for C8-FL/TiO2, followed by C8-RL/TiO2 and C8-HFM with FDns of 15.06 and 23.3, respectively, the FDn value was in line with the projected membrane fouling performance. In our investigation of membrane fouling characteristics, we comprehensively compared various membranes documented in the literature, as summarized in Table 7.
Table 7.
Comparative study with published studies on membrane fouling (FDn) in DCMD for different geometry and membrane materials.
The above discussion shows the alignment of J, J/o, and FDn between the simulation and experimental data, which is crucial for several reasons: (1) Model Validation: the strong alignment indicates that the numerical model used for the simulations is valid and accurately represents the real-world behavior of the membranes, suggesting that the model can be relied upon for predicting performance under various conditions. This means the model can be relied upon for predicting performance under various conditions. (2) Predictive Power: with a validated model, the simulation can confidently predict membrane behaviour in conditions that might be challenging or expensive to test experimentally. (3) Optimization: the ability to predict performance accurately allows for optimizing membrane configurations, operating conditions, and other factors without extensive trial and error, which was already considered and will be highlighted in detail in this report. (4) Cost Savings: using simulations alongside experiments can save time and resources by narrowing down the best options before investing in large-scale experiments.
4. Discussion
From the numerical perspective, the mathematical equations were discretized using a set of techniques and then numerically solved to achieve the desired level of accuracy. The high accuracy and convergence rate in solving the equations were achieved by carefully selecting the grid resolution and employing the appropriate discretization techniques, considering their interactions. The Blended Central Differencing Scheme (CDS) used in this study combined second-order CDS discretization in high-quality cells with a first-order upwind scheme in low-quality cells [59,60]. The target cell size was gradually reduced, and the grid resolution increased throughout the study to minimize discrepancy error.
For cell sizes larger than 0.5 mm, the discrepancy error exceeded 1%, while it stabilized at around 0.1% for resolutions smaller than 0.2 mm. Thus, a target cell size of 0.2 mm was deemed appropriate for further analysis. Given the similar geometry and properties, and no significant changes in the operational parameters, this cell size can also be effectively used for simulating ceramic membranes.
Despite some assumptions made in modeling the trans-membrane mass flux and its heat transfer characteristics, the numerical results showed remarkable agreement with the experimental measurements, with discrepancies within 0.1%. This close agreement justifies the suitability of the selected method and its practicality in capturing the essential features of trans-membrane mass flux and its associated heat transfer phenomena.
At a feed inflow velocity of 0.14 m/s, a discrepancy between the CFD results and experimental data was observed, despite similar predictions for the permeate flux in both the current and reference CFD analyses [25,30]. The slight discrepancy observed can be attributed to assuming a fully laminar flow at a high feed velocity, corresponding to Re = 2000. While this assumption might have affected the thermal and fluid boundary layers [61], it is noteworthy that the resulting deviation fell within an acceptable range of 10%. Such an outcome indicates that the impact of assuming a laminar flow in the transition Reynolds number regime provides a simplistic and effective approach without compromising the model’s accuracy. Furthermore, physical deformation parameters, such as membrane thickness, porosity, and shape, were assumed to be constant throughout the study, a consideration consistent with earlier research [47]. Changes in membrane deformation can alter the permeability and conductivity of membranes, both of which significantly impact the membrane flux.
Notably, the averaged flux (Javg) value over 500 min was smaller than the initial flux (Jo) value, indicating that, as the membrane operated, its pores became increasingly clogged with fouling substances, eventually leading to blockage and a decrease in J to zero. This aligns with the expected fouling behaviour in membrane processes. The slight discrepancy observed in the model, specifically the lower flux, can be attributed to assuming a fully laminar flow at a high feed velocity, corresponding to an Re of 2000, and it is important to consider its impact on the overall accuracy of the model’s predictions.
The unmodified original mullite membrane exhibited the most significant flux reduction throughout the operation, particularly after 50 min, with a decline of 23% at t = 500 min. This decrease in flux suggests that the membrane experienced fouling and pore wetting, where the pores became clogged with substances that impeded the passage of water molecules. As a result, a further deterioration of water quality was expected as the operation continued. In contrast, the surface-modified membranes C8-RL/TiO2 and C8-FL/TiO2 exhibited a lower Jo of 5.18 kg/m2 and 4.32 and, respectively. Nevertheless, these membranes demonstrated lower flux reductions than the original mullite membrane up to 500 min. The C8-FL/TiO2 membrane exhibited the lowest drop in flux, with a reduction of approximately 15%. The RL/TiO2 membrane had a slightly higher reduction in flux, around 11%, which was still lower than that of the original mullite membrane. Nonetheless, the observed permeate flux values for the developed membranes are comparable and consistent with those reported in previous studies on DCMD polymeric membranes while being higher than those observed in ceramic membranes [62,63,64,65,66,67]. Comparisons between the three membranes are presented in Table 6.
The relationship between flux and pore size is described by the Hagen–Poiseuille equation, which states that the permeation flux is proportional to the square of the pore size [68]. Therefore, the slight reduction in pore size observed for both the C8-RL/TiO2 and C8-FL/TiO2 membranes due to the TiO2 coating resulted in a lower initial flux compared to that of the unmodified mullite membrane [69]. Additionally, the dense layer of TiO2 coating increased the mass transfer resistance within the membrane by diminishing the evaporation’s effective surface area at the liquid/air/solid interface [70,71,72].
The lowest reduction in flux over time was observed for C8-FL/TiO2 due to the significant alteration in its surface topography. Modifying the membrane with TiO2 microflowers led to ridge and valley structures that enhanced its roughness. The ridges on the membrane surface created effective water permeation pathways, even when contaminants covered the valleys [73]. The TiO2 microflowers’ hierarchical structure successfully prevented liquid from entering the membrane pores and kept them dry by forming an air layer on the membrane’s surface. The unique hierarchical microflower structure of the C8-FL/TiO2 membrane, acting as a multi-barrier system, supported convex liquid–vapor interfaces, maintaining a high equilibrium contact angle (θ) of 161.6 ± 3.3 degrees, indicative of superomniphobic properties [74]. This structure ensured a robust and repulsive air film, effectively repelling liquids and keeping the pores open and dry for efficient vapor transfer, leading to a stable permeate flux.
In contrast, the RL/TiO2 and C8-HFM membranes had smoother surfaces and fewer valley structures. As a result, the RL/TiO2 membrane displayed an air layer with some liquid intrusion into the air film on the membrane surface. The unmodified C8-HFM membrane did not exhibit a significant air film at the macroscopic level. Additionally, the C8-RL/TiO2 membranes exhibited higher levels of omniphobicity compared to C8-HFM, with contact angles of 155.9 ± 2.5 and 131.9 ± 1.1 degrees, respectively. Therefore, the advantage of the modified hollow-fiber membranes over the unmodified ones is their significantly reduced membrane pore wetting, effectively ensuring 100% salt rejection. The chemically modified membrane achieved this on-wetting performance at a modest flux penalty (<20% lower). This suggests that the surface modifications on the membranes contributed to an improved performance and reduced fouling effects, resulting in a more stable flux over time.
Second-order polynomials best represented the performance trendline (MTC) of all three hollow-fiber membranes. These trendlines offer valuable insights into the expected timeframe for fouling occurrence, ultimately leading to process cessation. The surface-modified membranes exhibited a longer projected operational time than the unmodified membrane. Specifically, the C8-FL/TiO2 membrane demonstrated a significantly longer operational time, exceeding three times, while the C8-RL/TiO2 membrane exhibited a relatively shorter operational time, being around 1.3 times longer than the original membrane. This finding aligned with the DCMD experimental results in terms of the resistance of the membranes to low-surface-tension liquids, in which the order was found to be C8-FL/TiO2, C8-RL/TiO2, and C8-HFM, going from highest to lowest.
The ceramic hollow-fiber membranes exhibited a superior fouling resistance compared to polymeric membranes such as PTFE and PVDF flat-sheet membranes, with higher FDn values (e.g., 60% for PTFE and 30% for PVDF). Remarkably, the hollow-fiber membranes demonstrated a better fouling resistance, with PVDF and PP hollow fibers having FDn values of 30% and a range of 0–40%, respectively. These results support the consideration of hollow-fiber geometry and the effectiveness of surface modifications in reducing fouling compared to other membrane materials and geometries [75].
5. Conclusions
In conclusion, this numerical study successfully constructed a novel computational fluid dynamics (CFD) model for a ceramic-based, naturally occurring material, focusing on evaluating the performance of DCMD membranes made from this material. The DCMD performance of fabricated mullite HF membranes, including the original (C8-HFM) and two surface-modified membranes, C8-FL/TiO2 and C8-RL/TiO2, was evaluated computationally. The CFD model, validated with published experimental results, provided detailed insights into the fluid dynamics of these membranes, which are challenging to explore experimentally. Simulations were carried out for a DCMD for up to 500 min with a consistent inlet feed velocity of 1.178 m/s and a permeate velocity of 0.33 m/s. The feed inlet temperature was maintained at approximately 65 °C, while the permeate inlet temperature was held at around 20 °C. The findings indicate that the C8-HFM membrane exhibited an initial mass flux approximately 30% higher than that of the C8-FL/TiO2 membrane and 9% higher than the C8-RL/TiO2 membrane. Although the surface-modified membranes indicated a lower initial mass flux, they indicated lower flux reductions than the original mullite membrane up to 500 min. The results indicate that the C8-FL/TiO2 membrane exhibited the lowest drop in flux, with a reduction of approximately 11%. The C8-RL/TiO2 membrane had a slightly higher reduction in flux, around 15%, which was still lower than that of the original mullite membrane (23%). The impact of fouling on the membrane performance was investigated by analyzing the variation in MTC over time. It was observed that different membrane types exhibited varying levels of performance stability, with membranes containing a TiO2 layer demonstrating a higher stability compared to those without a TiO2 layer. The trendlines of normalized MTC provided valuable information about the performance and blockage points of the membranes.
The study also employed the permeate flow reduction factor (FRF) to assess fouling in DCMD, revealing a superior resistance to fouling and wetting in the membranes with TiO2 microflowers and nanorods. Consequently, the fouling trend observed indicated that the mullite hollow-fiber membrane incorporating TiO2 microflowers and nanorods demonstrated a superior resistance to fouling and wetting compared to C8-HFM. These findings suggest potential for these membranes in desalination applications, particularly in handling seawater containing organic contaminants, demonstrating the model’s versatility. Additionally, it proves the model’s versatility, which can be utilized beyond the current investigation scope, offering a valuable tool for efficient membrane development solutions, particularly for challenges such as the presence of organic contaminants in seawater. Future work will investigate critical parameters, including MTC, system temperature, and membrane properties, and their impacts on thermal and fluid boundary layers and desalination performance.
Supplementary Materials
The following supporting information can be downloaded at: https://www.mdpi.com/article/10.3390/ceramics7010009/s1 [13,16,17,76,77,78,79].
Author Contributions
M.M.A. was responsible for conceptualization, data curation, formal analysis, investigation, methodology, validation, visualization, writing—original draft and writing—review and editing. M.H.D.O. was responsible for funding acquisition, project administration, resources, supervision and writing—review and editing. M.R. was responsible for software, visualization, editing and writing—review and editing. Z.S.T. was responsible for writing—editing and review. A.A. was responsible for methodology. M.H.P. was responsible for writing—editing and review. J.J. was responsible for supervision and writing—editing and review. M.A.R. was responsible for supervision and writing—editing and review. M.F.A.A.-O. was responsible for writing—editing and review. All authors have read and agreed to the published version of the manuscript.
Funding
This research received the financial support from Universiti Teknologi Malaysia under High-Tech Fantastic Four Grant (Project Number: Q.J130000.4622.00Q17), UTM Fundamental Research (Project Number: Q.J130000.3809.22H07), Matching Grant (Project Number: Q.J130000.3009.03M15), UMW (Project Number: R.J130000.7609.4C471).
Institutional Review Board Statement
Not applicable.
Informed Consent Statement
Not applicable.
Data Availability Statement
All data generated or analyzed during the current study are available from the corresponding author on reasonable request.
Acknowledgments
The authors gratefully acknowledge the financial support from Universiti Teknologi Malaysia under High-Tech Fantastic Four Grant (Project Number: Q.J130000.4622.00Q17), UTM Fundamental Research (Project Number: Q.J130000.3809.22H07), Matching Grant (Project Number: Q.J130000.3009.03M15). In addition, the authors also would like to acknowledge the financial support from UMW (Project Number: R.J130000.7609.4C471).
Conflicts of Interest
The authors declare no conflicts of interest.
References
- Tokui, Y.; Moriguchi, H.; Nishi, Y. Comprehensive environmental assessment of seawater desalination plants: Multistage flash distillation and reverse osmosis membrane types in Saudi Arabia. Desalination 2014, 351, 145–150. [Google Scholar] [CrossRef]
- Alftessi, S.A.; Othman, M.H.D.; Adam, M.R.B.; Farag, T.M.; Tai, Z.S.; Raji, Y.O.; Rahman, M.A.; Jaafar, J.; Ismail, A.F.; Bakar, S.A. Hydrophobic silica sand ceramic hollow fiber membrane for desalination via direct contact membrane distillation. Alex. Eng. J. 2022, 61, 9609–9621. [Google Scholar] [CrossRef]
- Ali, K.; Arafat, H.A.; Ali, M.I.H. Detailed numerical analysis of air gap membrane distillation performance using different membrane materials and porosity. Desalination 2023, 551, 116436. [Google Scholar] [CrossRef]
- Ali, K.; Alwan, A.A.; Bahayan, S.; Alhseinat, E.; Ali, M.I.H. A numerical analysis of the electromagnetic field effect on direct contact membrane distillation performance. Energy Convers. Manag. 2023, 292, 117328. [Google Scholar] [CrossRef]
- Ali, K.; Ali, M.I.H. Energy and cost analysis of a multiple channel direct contact membrane distillation module: Case study. Case Stud. Chem. Environ. Eng. 2023, 8, 100449. [Google Scholar] [CrossRef]
- Pagliero, M.; Khayet, M.; Garcia-Payo, C.; Garcia-Fernandez, L. Hollow fibre polymeric membranes for desalination by membrane distillation technology: A review of different morphological structures and key strategic improvements. Desalination 2021, 516, 115235. [Google Scholar] [CrossRef]
- Lau, H.S.; Lau, S.K.; Soh, L.S.; Hong, S.U.; Gok, X.Y.; Yi, S.; Yong, W.F. State-of-the-art organic-and inorganic-based hollow fiber membranes in liquid and gas applications: Looking back and beyond. Membranes 2022, 12, 539. [Google Scholar] [CrossRef]
- Wan, C.F.; Yang, T.; Lipscomb, G.G.; Stookey, D.J.; Chung, T.-S. Design and fabrication of hollow fiber membrane modules. In Hollow Fiber Membranes; Elsevier: Amsterdam, The Netherlands, 2021; pp. 225–252. [Google Scholar]
- Hubadillah, S.K.; Othman, M.H.D.; Matsuura, T.; Rahman, M.A.; Jaafar, J.; Ismail, A.; Amin, S.Z.M. Green silica-based ceramic hollow fiber membrane for seawater desalination via direct contact membrane distillation. Sep. Purif. Technol. 2018, 205, 22–31. [Google Scholar] [CrossRef]
- Jeong, Y.; Cho, K.; Kwon, E.E.; Tsang, Y.F.; Rinklebe, J.; Park, C. Evaluating the feasibility of pyrophyllite-based ceramic membranes for treating domestic wastewater in anaerobic ceramic membrane bioreactors. Chem. Eng. J. 2017, 328, 567–573. [Google Scholar] [CrossRef]
- Naseri, M.; Omidkhah, M. Optimizing the fabrication conditions of monolithic mullite whisker membrane from kaolin and bauxite using the Taguchi method. Ceram. Int. 2023, 49, 23612–23626. [Google Scholar] [CrossRef]
- Bose, S.; Das, C. Preparation and characterization of low cost tubular ceramic support membranes using sawdust as a pore-former. Mater. Lett. 2013, 110, 152–155. [Google Scholar] [CrossRef]
- Abd Aziz, M.H.; Othman, M.H.D.; Hashim, N.A.; Adam, M.R.; Mustafa, A. Fabrication and characterization of mullite ceramic hollow fiber membrane from natural occurring ball clay. Appl. Clay Sci. 2019, 177, 51–62. [Google Scholar] [CrossRef]
- Meng, S.; Ye, Y.; Mansouri, J.; Chen, V. Fouling and crystallisation behaviour of superhydrophobic nano-composite PVDF membranes in direct contact membrane distillation. J. Membr. Sci. 2014, 463, 102–112. [Google Scholar] [CrossRef]
- Chen, Y.; Tian, M.; Li, X.; Wang, Y.; An, A.K.; Fang, J.; He, T. Anti-wetting behavior of negatively charged superhydrophobic PVDF membranes in direct contact membrane distillation of emulsified wastewaters. J. Membr. Sci. 2017, 535, 230–238. [Google Scholar] [CrossRef]
- Abd Aziz, M.H.; Othman, M.H.D.; Alias, N.H.; Nakayama, T.; Shingaya, Y.; Hashim, N.A.; Kurniawan, T.A.; Matsuura, T.; Rahman, M.A.; Jaafar, J. Enhanced omniphobicity of mullite hollow fiber membrane with organosilane-functionalized TiO2 micro-flowers and nanorods layer deposition for desalination using direct contact membrane distillation. J. Membr. Sci. 2020, 607, 118137. [Google Scholar] [CrossRef]
- Abdullah, N.; Rahman, M.A.; Othman, M.H.D.; Ismail, A.F.; Jaafar, J.; Aziz, A.A. Preparation and characterization of self-cleaning alumina hollow fiber membrane using the phase inversion and sintering technique. Ceram. Int. 2016, 42, 12312–12322. [Google Scholar] [CrossRef]
- Yadav, A.; Ghosh, A.; Kumar, A. Experimental and numerical study of thermal field and weld bead characteristics in submerged arc welded plate. J. Mater. Process. Technol. 2017, 248, 262–274. [Google Scholar] [CrossRef]
- Mishra, R.; Ningthoujam, R.S. Chapter 11—High-Temperature Ceramics. In Materials Under Extreme Conditions; Tyagi, A.K., Banerjee, S., Eds.; Elsevier: Amsterdam, The Netherlands, 2017; pp. 377–409. [Google Scholar]
- Mahnicka-Goremikina, L.; Svinka, R.; Svinka, V.; Grase, L.; Juhnevica, I.; Rundans, M.; Goremikins, V.; Tolendiuly, S.; Fomenko, S. Thermal Properties of Porous Mullite Ceramics Modified with Microsized ZrO2 and WO3. Materials 2022, 15, 7935. [Google Scholar] [CrossRef]
- Sparrow, B.S. Empirical equations for the thermodynamic properties of aqueous sodium chloride. Desalination 2003, 159, 161–170. [Google Scholar] [CrossRef]
- Yaws, C.L. Chemical Properties Handbook; McGraw-Hill Education: New York, NY, USA, 1999. [Google Scholar]
- Soukane, S.; Lee, J.-G.; Ghaffour, N. Direct contact membrane distillation module scale-up calculations: Choosing between convective and conjugate approaches. Sep. Purif. Technol. 2019, 209, 279–292. [Google Scholar] [CrossRef]
- Matyka, M.; Khalili, A.; Koza, Z. Tortuosity-porosity relation in porous media flow. Phys. Rev. E 2008, 78, 026306. [Google Scholar] [CrossRef]
- Yu, H.; Yang, X.; Wang, R.; Fane, A.G. Numerical simulation of heat and mass transfer in direct membrane distillation in a hollow fiber module with laminar flow. J. Membr. Sci. 2011, 384, 107–116. [Google Scholar] [CrossRef]
- Fane, A.G.; Schofield, R.; Fell, C.J.D. The efficient use of energy in membrane distillation. Desalination 1987, 64, 231–243. [Google Scholar] [CrossRef]
- Hitsov, I.; Maere, T.; De Sitter, K.; Dotremont, C.; Nopens, I. Modelling approaches in membrane distillation: A critical review. Sep. Purif. Technol. 2015, 142, 48–64. [Google Scholar] [CrossRef]
- Yazgan-Birgi, P.; Arafat, H.A.; Ali, M.I.H. Implementation of two multiphase flow methods in modeling wetting of microporous hydrophobic membranes. Sci. Total Environ. 2019, 691, 1251–1261. [Google Scholar] [CrossRef] [PubMed]
- Rezakazemi, M. CFD simulation of seawater purification using direct contact membrane desalination (DCMD) system. Desalination 2018, 443, 323–332. [Google Scholar] [CrossRef]
- Yu, H.; Yang, X.; Wang, R.; Fane, A.G. Analysis of heat and mass transfer by CFD for performance enhancement in direct contact membrane distillation. J. Membr. Sci. 2012, 405, 38–47. [Google Scholar] [CrossRef]
- Sherwood, T.K.; Pigford, R.L.; Wilke, C.R. Mass Transfer; McGraw-Hill Education: New York, NY, USA, 1999. [Google Scholar]
- Twibi, M.F.; Othman, M.H.D.; Hubadillah, S.K.; Alftessi, S.A.; Adam, M.R.B.; Ismail, A.F.; Rahman, M.A.; Jaafar, J.; Raji, Y.O.; Abd Aziz, M.H. Hydrophobic mullite ceramic hollow fibre membrane (Hy-MHFM) for seawater desalination via direct contact membrane distillation (DCMD). J. Eur. Ceram. Soc. 2021, 41, 6578–6585. [Google Scholar] [CrossRef]
- Lou, J.; Vanneste, J.; DeCaluwe, S.C.; Cath, T.Y.; Tilton, N. Computational fluid dynamics simulations of polarization phenomena in direct contact membrane distillation. J. Membr. Sci. 2019, 591, 117150. [Google Scholar] [CrossRef]
- Yun, Y.; Ma, R.; Zhang, W.; Fane, A.; Li, J. Direct contact membrane distillation mechanism for high concentration NaCl solutions. Desalination 2006, 188, 251–262. [Google Scholar] [CrossRef]
- Phattaranawik, J.; Jiraratananon, R.; Fane, A.G. Heat transport and membrane distillation coefficients in direct contact membrane distillation. J. Membr. Sci. 2003, 212, 177–193. [Google Scholar] [CrossRef]
- Khayet, M.; Velázquez, A.; Mengual, J.I. Modelling mass transport through a porous partition: Effect of pore size distribution. J. Non-Equilib. Thermodyn. 2004, 29, 279–299. [Google Scholar] [CrossRef]
- Qtaishat, M.; Matsuura, T.; Kruczek, B.; Khayet, M. Heat and mass transfer analysis in direct contact membrane distillation. Desalination 2008, 219, 272–292. [Google Scholar] [CrossRef]
- Gryta, M.; Tomaszewska, M. Heat transport in the membrane distillation process. J. Membr. Sci. 1998, 144, 211–222. [Google Scholar] [CrossRef]
- Leitch, M.E.; Lowry, G.V.; Mauter, M.S. Characterizing convective heat transfer coefficients in membrane distillation cassettes. J. Membr. Sci. 2017, 538, 108–121. [Google Scholar] [CrossRef]
- Sieder, E.N.; Tate, G.E. Heat transfer and pressure drop of liquids in tubes. Ind. Eng. Chem. 1936, 28, 1429–1435. [Google Scholar] [CrossRef]
- Thomas, L.C. Fundamentals of Heat Transfer; Englewood Cliffs; Prentice-Hall, Inc: New Jersey, NJ, USA, 1980. [Google Scholar]
- Ibrahim, S.S.; Alsalhy, Q.F. Modeling and simulation for direct contact membrane distillation in hollow fiber modules. AIChE J. 2013, 59, 589–603. [Google Scholar] [CrossRef]
- Mustakeem, M.; Qamar, A.; Alpatova, A.; Ghaffour, N. Dead-end membrane distillation with localized interfacial heating for sustainable and energy-efficient desalination. Water Res. 2021, 189, 116584. [Google Scholar] [CrossRef] [PubMed]
- Guan, G.; Yang, X.; Wang, R.; Field, R.; Fane, A.G. Evaluation of hollow fiber-based direct contact and vacuum membrane distillation systems using aspen process simulation. J. Membr. Sci. 2014, 464, 127–139. [Google Scholar] [CrossRef]
- Siemens Digital Industries Software. Simcenter STAR-CCM+; Version 2302; Siemens: Munich, Germany, 2023. [Google Scholar]
- Ni, W.; Li, Y.; Zhao, J.; Zhang, G.; Du, X.; Dong, Y. Simulation study on direct contact membrane distillation modules for high-concentration NaCl solution. Membranes 2020, 10, 179. [Google Scholar] [CrossRef] [PubMed]
- Yazgan-Birgi, P.; Ali, M.I.H.; Arafat, H.A. Comparative performance assessment of flat sheet and hollow fiber DCMD processes using CFD modeling. Sep. Purif. Technol. 2019, 212, 709–722. [Google Scholar] [CrossRef]
- Karam, A.M.; Laleg-Kirati, T.M. Membrane fouling modeling and detection in direct contact membrane distillation. J. Process Control 2019, 81, 190–196. [Google Scholar] [CrossRef]
- Park, D.J.; Norouzi, E.; Park, C. Experimentally-validated computational simulation of direct contact membrane distillation performance. Int. J. Heat Mass Transf. 2019, 129, 1031–1042. [Google Scholar] [CrossRef]
- Shan, H.; Liu, J.; Li, X.; Li, Y.; Tezel, F.H.; Li, B.; Wang, S. Nanocoated amphiphobic membrane for flux enhancement and comprehensive anti-fouling performance in direct contact membrane distillation. J. Membr. Sci. 2018, 567, 166–180. [Google Scholar] [CrossRef]
- Rahimnia, R.; Pakizeh, M. Preparation and characterization of PPO/PS porous membrane for desalination via direct contact membrane distillation (DCMD). J. Membr. Sci. 2023, 669, 121297. [Google Scholar] [CrossRef]
- Laqbaqbi, M.; Sanmartino, J.A.; Khayet, M.; García-Payo, C.; Chaouch, M. Fouling in membrane distillation, osmotic distillation and osmotic membrane distillation. Appl. Sci. 2017, 7, 334. [Google Scholar] [CrossRef]
- Naidu, G.; Jeong, S.; Vigneswaran, S. Interaction of humic substances on fouling in membrane distillation for seawater desalination. Chem. Eng. J. 2015, 262, 946–957. [Google Scholar] [CrossRef]
- Naidu, G.; Jeong, S.; Kim, S.-J.; Kim, I.S.; Vigneswaran, S. Organic fouling behavior in direct contact membrane distillation. Desalination 2014, 347, 230–239. [Google Scholar] [CrossRef]
- Guillen-Burrieza, E.; Thomas, R.; Mansoor, B.; Johnson, D.; Hilal, N.; Arafat, H. Effect of dry-out on the fouling of PVDF and PTFE membranes under conditions simulating intermittent seawater membrane distillation (SWMD). J. Membr. Sci. 2013, 438, 126–139. [Google Scholar] [CrossRef]
- Srisurichan, S.; Jiraratananon, R.; Fane, A. Humic acid fouling in the membrane distillation process. Desalination 2005, 174, 63–72. [Google Scholar] [CrossRef]
- Ge, J.; Peng, Y.; Li, Z.; Chen, P.; Wang, S. Membrane fouling and wetting in a DCMD process for RO brine concentration. Desalination 2014, 344, 97–107. [Google Scholar] [CrossRef]
- Gryta, M. Polyphosphates used for membrane scaling inhibition during water desalination by membrane distillation. Desalination 2012, 285, 170–176. [Google Scholar] [CrossRef]
- Petrovai, D.M. Asymptotic Convergence Algorithms. Procedia Eng. 2017, 181, 920–923. [Google Scholar] [CrossRef]
- Asnaghi, A.; Feymark, A.; Bensow, R. Numerical investigation of the impact of computational resolution on shedding cavity structures. Int. J. Multiph. Flow 2018, 107, 33–50. [Google Scholar] [CrossRef]
- Chauhan, K.S.; Tyagi, H. Thermal modeling of fluid flow and heat transfer in direct contact membrane distillation. Energy Convers. Manag. 2023, 291, 117249. [Google Scholar] [CrossRef]
- Kujawa, J.; Cerneaux, S.; Koter, S.; Kujawski, W. Highly efficient hydrophobic titania ceramic membranes for water desalination. ACS Appl. Mater. Interfaces 2014, 6, 14223–14230. [Google Scholar] [CrossRef] [PubMed]
- Zuo, J.; Chung, T.-S. Metal–organic framework-functionalized alumina membranes for vacuum membrane distillation. Water 2016, 8, 586. [Google Scholar] [CrossRef]
- Abu-Zeid, M.A.E.-R.; Zhang, Y.; Dong, H.; Zhang, L.; Chen, H.-L.; Hou, L. A comprehensive review of vacuum membrane distillation technique. Desalination 2015, 356, 1–14. [Google Scholar] [CrossRef]
- Johnson, R.A.; Nguyen, M.H. Understanding Membrane Distillation and Osmotic Distillation; John Wiley & Sons: Hoboken, NJ, USA, 2017. [Google Scholar]
- Laganà, F.; Barbieri, G.; Drioli, E. Direct contact membrane distillation: Modelling and concentration experiments. J. Membr. Sci. 2000, 166, 1–11. [Google Scholar] [CrossRef]
- Wang, J.-W.; Li, L.; Zhang, J.-W.; Xu, X.; Chen, C.-S. β-Sialon ceramic hollow fiber membranes with high strength and low thermal conductivity for membrane distillation. J. Eur. Ceram. Soc. 2016, 36, 59–65. [Google Scholar] [CrossRef]
- Yoon, K.; Hsiao, B.S.; Chu, B. Functional nanofibers for environmental applications. J. Mater. Chem. 2008, 18, 5326–5334. [Google Scholar] [CrossRef]
- Ma, H.; Hsiao, B.S. Electrospun nanofibrous membranes for desalination. In Current Trends and Future Developments on (Bio-) Membranes; Elsevier: Amsterdam, The Netherlands, 2019; pp. 81–104. [Google Scholar]
- Xiao, Z.; Zheng, R.; Liu, Y.; He, H.; Yuan, X.; Ji, Y.; Li, D.; Yin, H.; Zhang, Y.; Li, X.-M. Slippery for scaling resistance in membrane distillation: A novel porous micropillared superhydrophobic surface. Water Res. 2019, 155, 152–161. [Google Scholar] [CrossRef] [PubMed]
- Li, J.; Ren, L.-F.; Huang, M.; Yang, J.; Shao, J.; He, Y. Facile preparation of omniphobic PDTS-ZnO-PVDF membrane with excellent anti-wetting property in direct contact membrane distillation (DCMD). J. Membr. Sci. 2022, 650, 120404. [Google Scholar] [CrossRef]
- Feng, H.; Li, H.; Li, M.; Zhang, X. Construction of omniphobic PVDF membranes for membrane distillation: Investigating the role of dimension, morphology, and coating technology of silica nanoparticles. Desalination 2022, 525, 115498. [Google Scholar] [CrossRef]
- Hu, D.; Ren, X.; Fu, H.; Wang, Y.; Feng, X.; Li, H. Constructing highly rough skin layer of thin film (nano) composite polyamide membranes to enhance separation performance: A review. J. Appl. Polym. Sci. 2022, 139, e52692. [Google Scholar] [CrossRef]
- Chen, Y.; Chen, W.; Fu, L.; Yang, Y.; Wang, Y.; Hu, X.; Wang, F.; Mu, T. Surface tension of 50 deep eutectic solvents: Effect of hydrogen-bonding donors, hydrogen-bonding acceptors, other solvents, and temperature. Ind. Eng. Chem. Res. 2019, 58, 12741–12750. [Google Scholar] [CrossRef]
- Nambikkattu, J.; Kaleekkal, N.J. Fluoroalkylsilane grafted FeOOH nanorods impregnated PVDF-co-HFP membranes with enhanced wetting and fouling resistance for direct contact membrane distillation. J. Environ. Chem. Eng. 2023, 11, 109624. [Google Scholar] [CrossRef]
- Xia, M.; Jiang, Y.; Zhao, L.; Li, F.; Xue, B.; Sun, M.; Liu., D.; Zhang., X. Wet grinding of montmorillonite and its effect on the properties of mesoporous montmorillonite. Colloids Surf. A Physicochem. Eng. Asp. 2010, 356, 1–9. [Google Scholar] [CrossRef]
- Güneyisi, E.; Gesoǧlu, M.; Özturan, T.; Mermerdaş, K. Microstructural properties and pozzolanic activity of calcined kaolins as supplementary cementing materials. Can. J. Civ. Eng. 2012, 39, 1274–1284. [Google Scholar] [CrossRef]
- Li, L.; Chen, M.; Dong, Y.; Dong, X.; Cerneaux, S.; Hampshire, S.; Cao, J.; Zhu, L.; Zhu, Z.; Liu, J. A low-cost alumina-mullite composite hollow fiber ceramic membrane fabricated via phase-inversion and sintering method. J. Eur. Ceram. Soc. 2016, 36, 2057–2066. [Google Scholar] [CrossRef]
- Hubadillah, S.K.; Othman, M.H.D.; Harun, Z.; Ismail, A.F.; Iwamoto, Y.; Honda, S.; Rahman, M.A.; Jaafar, J.; Gani, P.; Sokri, M.N.M. Effect of fabrication parameters on physical properties of metakaolin-based ceramic hollow fibre membrane (CHFM). Ceram. Int. 2016, 42, 15547–15558. [Google Scholar] [CrossRef]
Disclaimer/Publisher’s Note: The statements, opinions and data contained in all publications are solely those of the individual author(s) and contributor(s) and not of MDPI and/or the editor(s). MDPI and/or the editor(s) disclaim responsibility for any injury to people or property resulting from any ideas, methods, instructions or products referred to in the content. |
© 2024 by the authors. Licensee MDPI, Basel, Switzerland. This article is an open access article distributed under the terms and conditions of the Creative Commons Attribution (CC BY) license (https://creativecommons.org/licenses/by/4.0/).