
The Fuel Moisture Index Based on Understorey Hygrochron iButton Humidity and Temperature Measurements Reliably Predicts Fine Fuel Moisture Content in Tasmanian Eucalyptus Forests


Abstract
:1. Introduction
- (1)
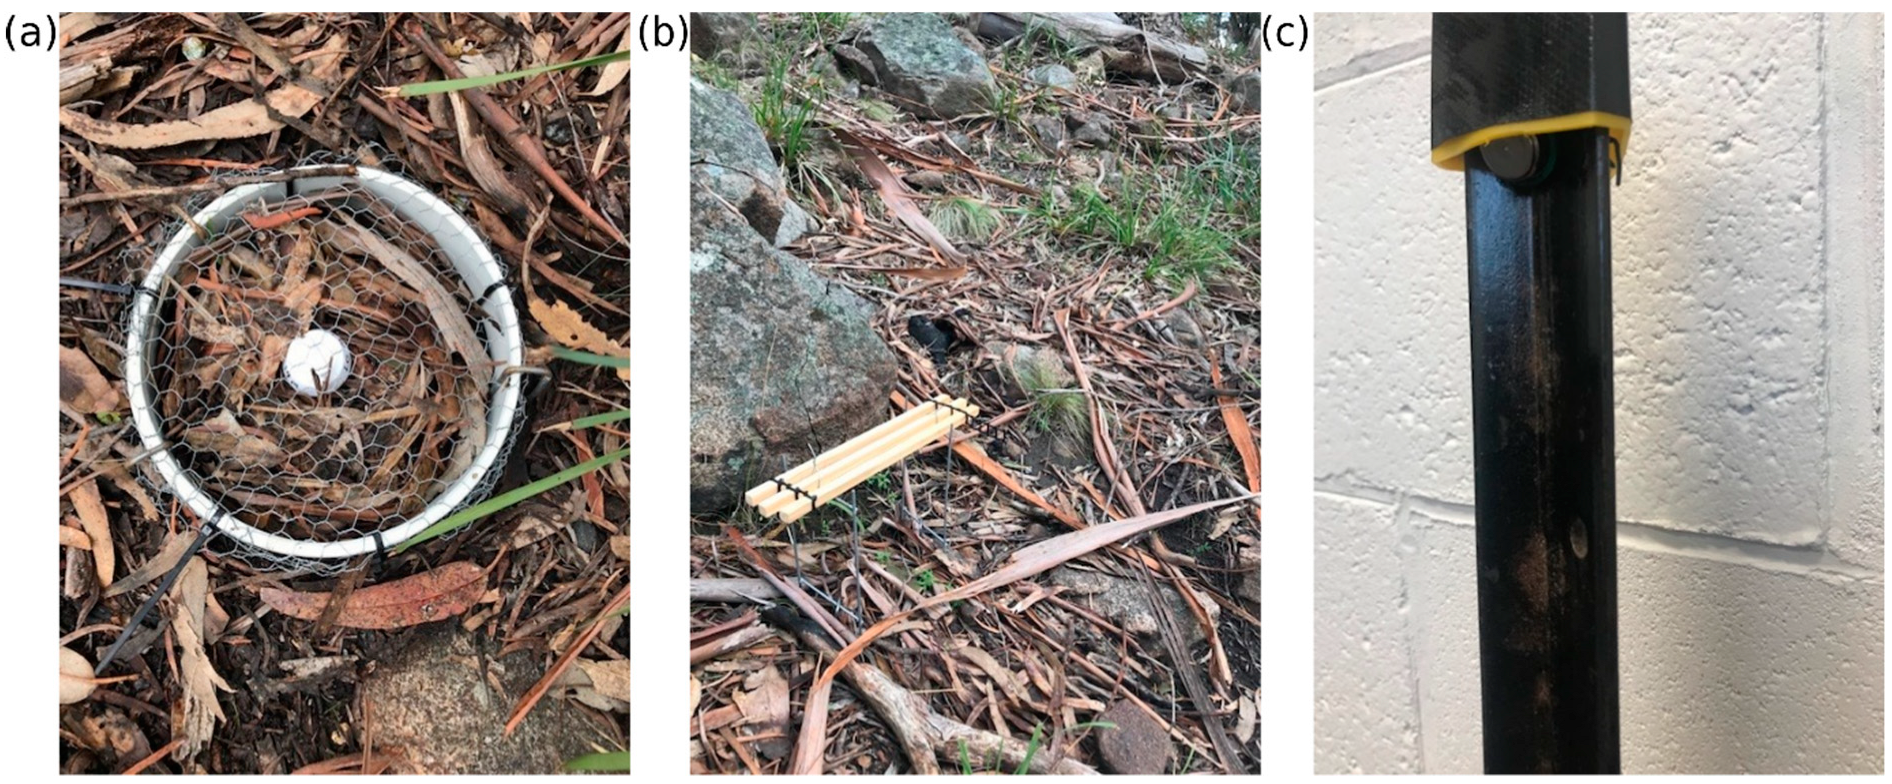
- Correlating between gravimetric moisture content of leaf litter (c. 1 h fuels) with gravimetric fuel moisture sticks (c. 10 h fuels [12]) 30 cm above the litter layer;
- (2)
- (3)
- Comparing estimates of FFMC using Hygrochron iButtons positioned in litter pack and 0.75 m above the litter layer.

2. Methods
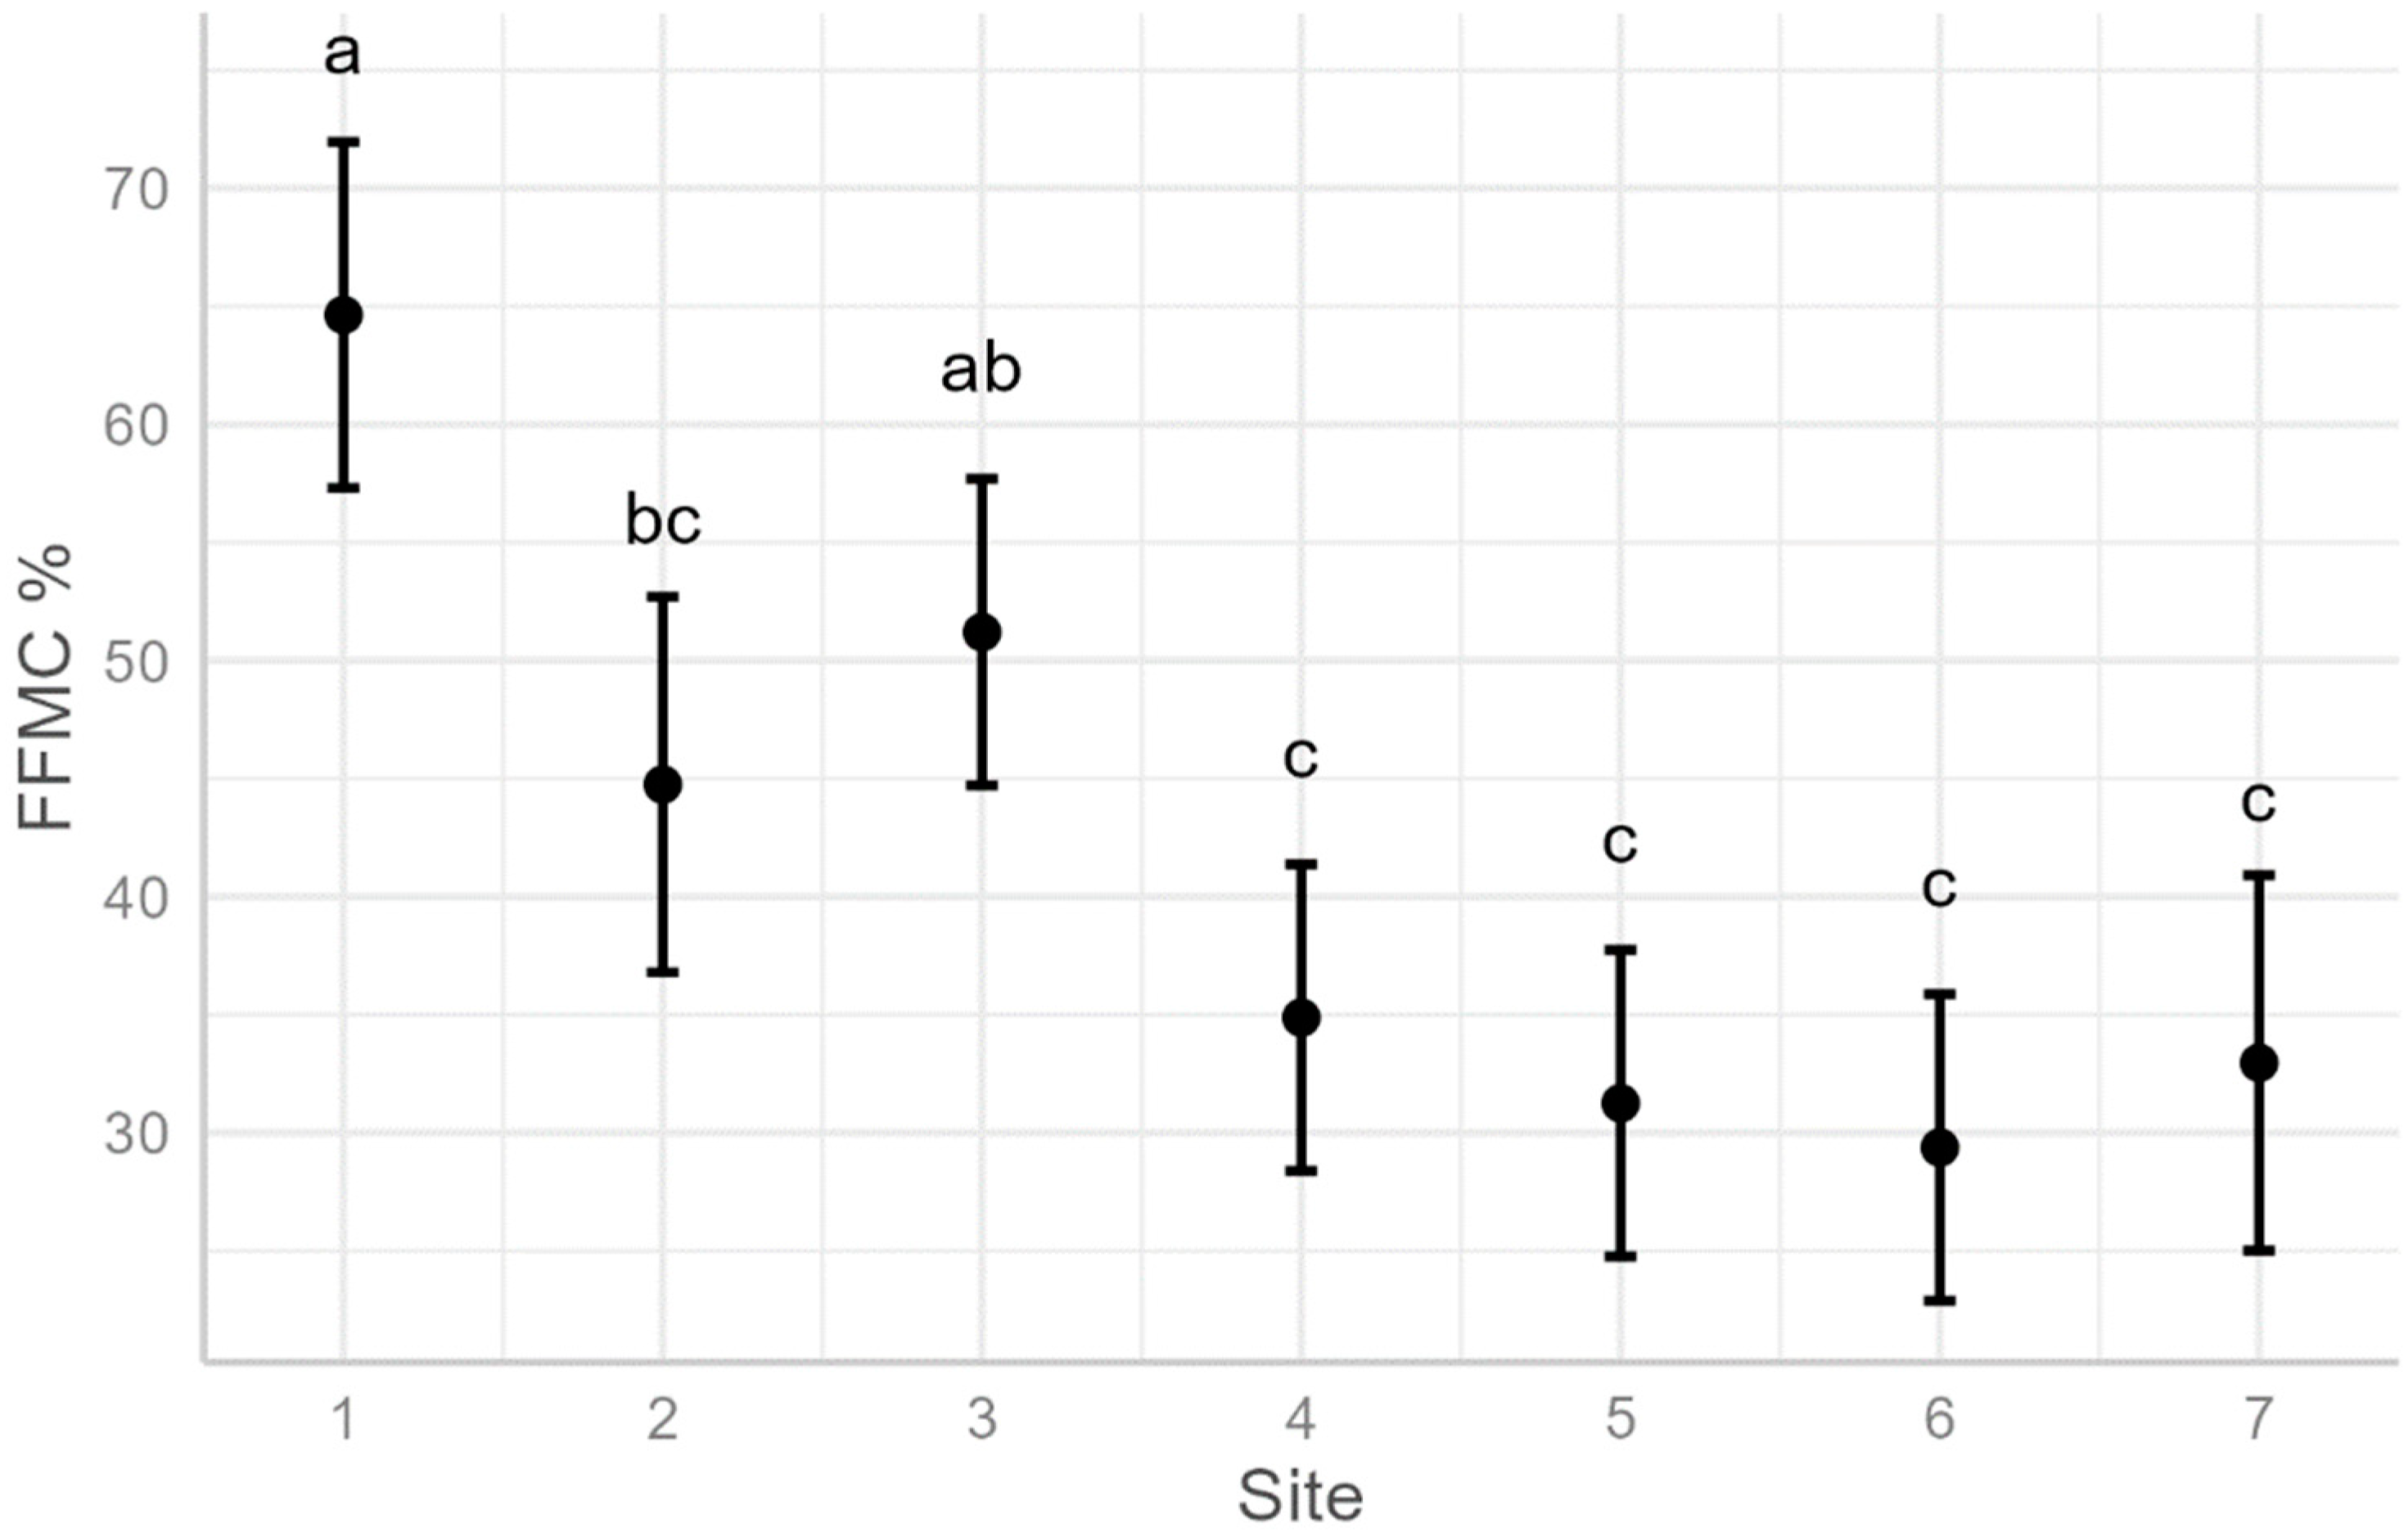
2.1. Field Sampling
2.2. Data Analysis
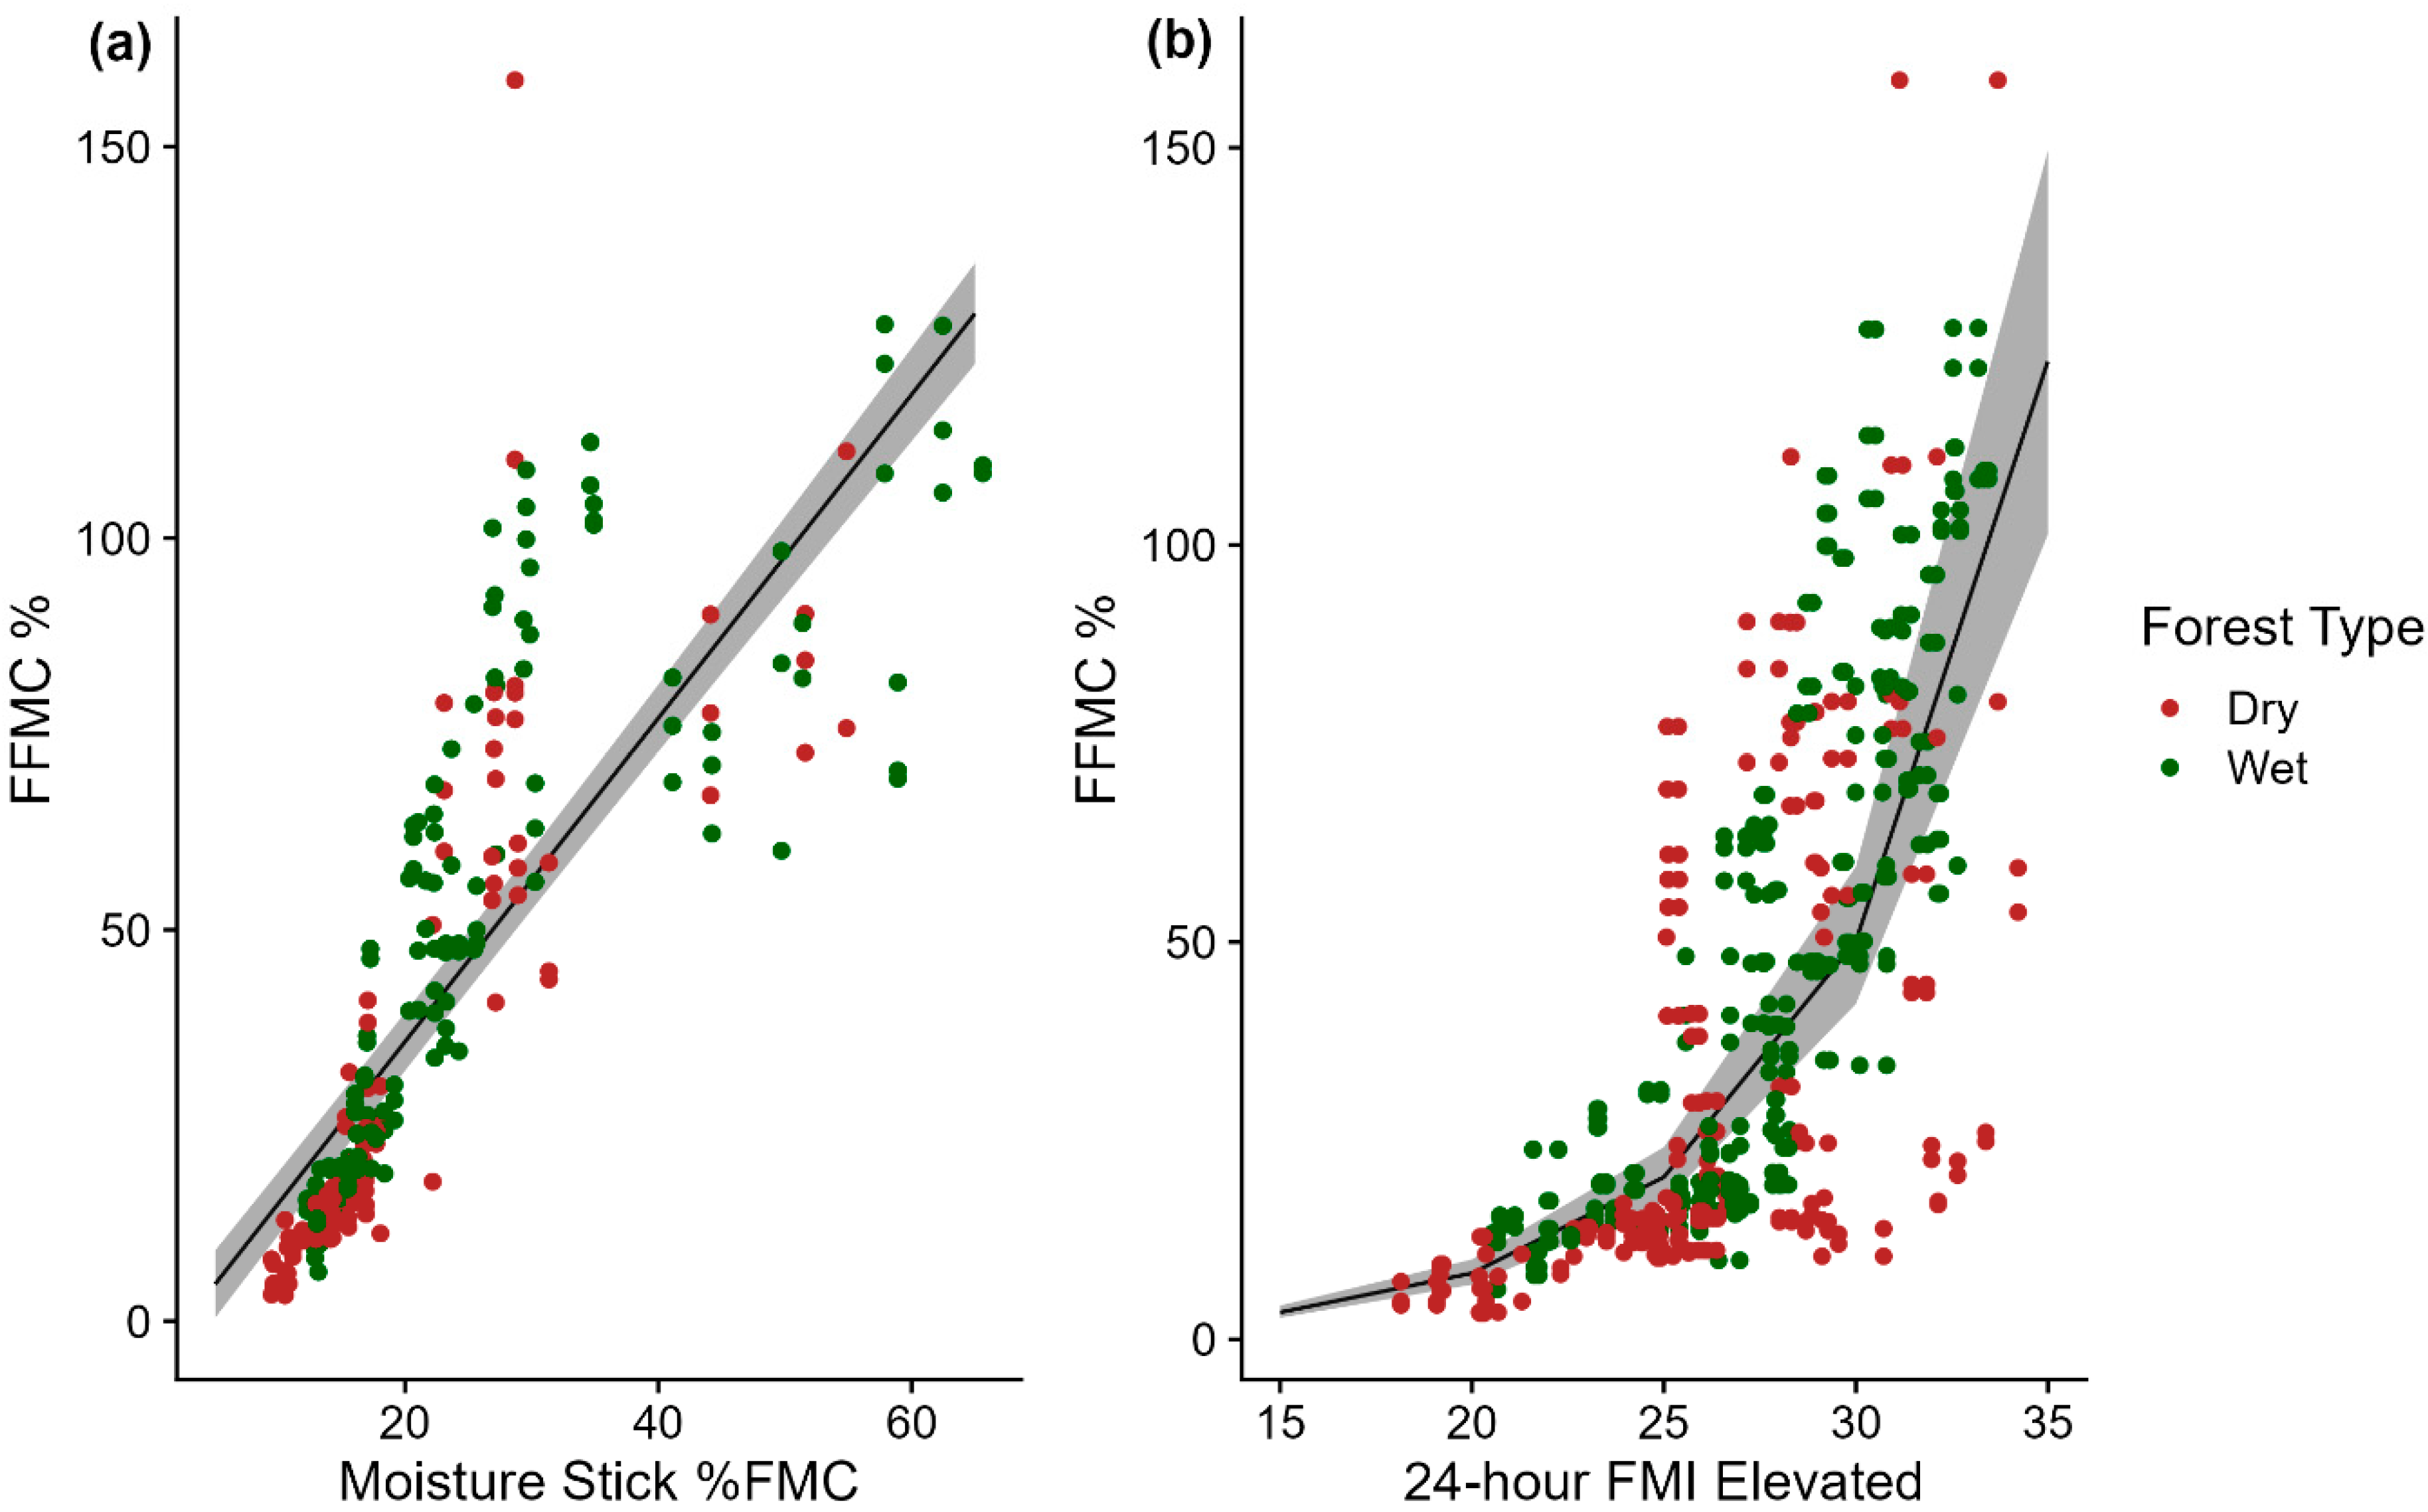
3. Results and Discussion
Supplementary Materials
Author Contributions
Funding
Institutional Review Board Statement
Informed Consent Statement
Data Availability Statement
Acknowledgments
Conflicts of Interest
References
- Matthews, S. Dead fuel moisture research: 1991–2012. Int. J. Wildland Fire 2013, 23, 78–92. [Google Scholar] [CrossRef]
- Viney, N.R. A review of fine fuel moisture modelling. Int. J. Wildland Fire 1991, 1, 215–234. [Google Scholar] [CrossRef]
- Ellis, T.M.; Bowman, D.M.; Jain, P.; Flannigan, M.D.; Williamson, G.J. Global increase in wildfire risk due to climate-driven declines in fuel moisture. Glob. Chang. Biol. 2022, 28, 1544–1559. [Google Scholar] [CrossRef]
- Cawson, J.G.; Nyman, P.; Schunk, C.; Sheridan, G.J.; Duff, T.J.; Gibos, K.; Bovill, W.D.; Conedera, M.; Pezzatti, G.B.; Menzel, A. Estimation of surface dead fine fuel moisture using automated fuel moisture sticks across a range of forests worldwide. Int. J. Wildland Fire 2020, 29, 548–559. [Google Scholar] [CrossRef]
- Cawson, J.G.; Hemming, V.; Ackland, A.; Anderson, W.; Bowman, D.; Bradstock, R.; Brown, T.P.; Burton, J.; Cary, G.J.; Duff, T.J. Exploring the key drivers of forest flammability in wet eucalypt forests using expert-derived conceptual models. Landsc. Ecol. 2020, 35, 1775–1798. [Google Scholar] [CrossRef]
- Cruz, M.G.; Kidnie, S.; Matthews, S.; Hurley, R.J.; Slijepcevic, A.; Nichols, D.; Gould, J.S. Evaluation of the predictive capacity of dead fuel moisture models for Eastern Australia grasslands. Int. J. Wildland Fire 2016, 25, 995–1001. [Google Scholar] [CrossRef]
- Cawson, J.G.; Duff, T.J.; Tolhurst, K.G.; Baillie, C.C.; Penman, T.D. Fuel moisture in Mountain Ash forests with contrasting fire histories. For. Ecol. Manag. 2017, 400, 568–577. [Google Scholar] [CrossRef]
- Slijepcevic, A.; Anderson, W.; Matthews, S. Testing existing models for predicting hourly variation in fine fuel moisture in eucalypt forests. For. Ecol. Manag. 2013, 306, 202–215. [Google Scholar] [CrossRef]
- Slijepcevic, A.; Anderson, W.; Matthews, S.; Anderson, D. Evaluating models to predict daily fine fuel moisture content in eucalypt forest. For. Ecol. Manag. 2015, 335, 261–269. [Google Scholar] [CrossRef]
- Nyman, P.; Metzen, D.; Noske, P.J.; Lane, P.N.; Sheridan, G.J. Quantifying the effects of topographic aspect on water content and temperature in fine surface fuel. Int. J. Wildland Fire 2015, 24, 1129–1142. [Google Scholar] [CrossRef]
- Nolan, R.H.; de Dios, V.R.; Boer, M.M.; Caccamo, G.; Goulden, M.L.; Bradstock, R.A. Predicting dead fine fuel moisture at regional scales using vapour pressure deficit from MODIS and gridded weather data. Remote Sens. Environ. 2016, 174, 100–108. [Google Scholar] [CrossRef]
- Nelson, R.M., Jr. Prediction of diurnal change in 10-h fuel stick moisture content. Can. J. For. Res. 2000, 30, 1071–1087. [Google Scholar] [CrossRef]
- Matthews, S. Effect of drying temperature on fuel moisture content measurements. Int. J. Wildland Fire 2010, 19, 800–802. [Google Scholar] [CrossRef]
- Catchpole, E.; Catchpole, W.; Viney, N.; McCaw, W.; Marsden-Smedley, J. Estimating fuel response time and predicting fuel moisture content from field data. Int. J. Wildland Fire 2001, 10, 215–222. [Google Scholar] [CrossRef]
- Shin, M.; Patton, R.; Mahar, T.; Ireland, A.; Swan, P.; Chow, C.M. Calibration and validation processes for relative humidity measurement by a Hygrochron iButton. Physiol. Behav. 2017, 179, 208–212. [Google Scholar] [CrossRef]
- Sharples, J.J.; McRae, R.H.; Weber, R.; Gill, A.M. A simple index for assessing fire danger rating. Environ. Model. Softw. 2009, 24, 764–774. [Google Scholar] [CrossRef]
- Sharples, J.J.; McRae, R.H. Evaluation of a very simple model for predicting the moisture content of eucalypt litter. Int. J. Wildland Fire 2011, 20, 1000–1005. [Google Scholar] [CrossRef]
- Furlaud, J.M.; Prior, L.D.; Williamson, G.J.; Bowman, D.M. Bioclimatic drivers of fire severity across the Australian geographical range of giant Eucalyptus forests. J. Ecol. 2021, 109, 2514–2536. [Google Scholar] [CrossRef]
- Furlaud, J.M.; Prior, L.D.; Williamson, G.J.; Bowman, D.M. Fire risk and severity decline with stand development in Tasmanian giant Eucalyptus forest. For. Ecol. Manag. 2021, 502, 119724. [Google Scholar] [CrossRef]
- Mount, A. The Derivation and Testing of a Soil Dryness Index Using Run-Off Data; Tasmania Forestry Commission: Hobart, Australia, 1972. [Google Scholar]
- Noble, I.; Gill, A.; Bary, G. McArthur’s fire-danger meters expressed as equations. Aust. J. Ecol. 1980, 5, 201–203. [Google Scholar] [CrossRef]
- Marsden-Smedley, J.B. Planned Burning in Tasmania: Operational Guidelines and Review of Current Knowledge; Tasmanian Parks and Wildlife Service: Hobart, Australia, 2009; p. 93. [Google Scholar]
- R Core Team. R: A Language and Environment for Statistical Computing; R Foundation for Statistical Computing: Vienna, Austria, 2013. Available online: https://www.gbif.org/tool/81287/r-a-language-and-environment-for-statistical-computing (accessed on 29 August 2022).
- Bates, D.; Maechler, M.; Bolker, B.; Walker, S. Fitting linear mixed-effects models using lme4. J. Stat. Softw. 2015, 67, 1–48. [Google Scholar] [CrossRef]
- Barton, K. MuMIn: Multi-Model Inference. R Package Version 1. 0. 0. 2009. Available online: http://r-forge.r-project.org/projects/mumin/ (accessed on 29 August 2022).
- Lüdecke, D. ggeffects: Tidy data frames of marginal effects from regression models. J. Open Source Softw. 2018, 3, 772. [Google Scholar] [CrossRef]
- Bureau of Meteorology. ENSO Outlook. Available online: http://www.bom.gov.au/climate/enso/outlook/#tabs=ENSO-Outlook-history (accessed on 29 August 2022).
- Kirkpatrick, J.; Nunez, M. Vegetation-radiation relationships in mountainous terrain: Eucalypt-dominated vegetation in the Risdon Hills, Tasmania. J. Biogeogr. 1980, 7, 197–208. [Google Scholar] [CrossRef]
- Pickering, B.J.; Duff, T.J.; Baillie, C.; Cawson, J.G. Darker, cooler, wetter: Forest understories influence surface fuel moisture. Agric. For. Meteorol. 2021, 300, 108311. [Google Scholar] [CrossRef]
- Sharples, J.; Matthews, S. Evaluation of some simplified models for predicting the moisture content of fine, dead fuels. In Proceedings of the MODSIM2011, 19th International Congress on Modelling and Simulation, Perth, Australia, 12–16 December 2011; Chan, F., Marinova, D., Anderssen, R.S., Eds.; Modelling and Simulation Society of Australia and New Zealand: Perth, Australia, 2011; pp. 12–16. [Google Scholar]
- Prior, L.D.; Murphy, B.P.; Williamson, G.J.; Cochrane, M.A.; Jolly, W.M.; Bowman, D.M. Does inherent flammability of grass and litter fuels contribute to continental patterns of landscape fire activity? J. Biogeogr. 2017, 44, 1225–1238. [Google Scholar] [CrossRef]
- Prior, L.D.; Murphy, B.P.; Bowman, D.M. Conceptualizing ecological flammability: An experimental test of three frameworks using various types and loads of surface fuels. Fire 2018, 1, 14. [Google Scholar] [CrossRef]
- Sullivan, A.L.; McCaw, W.L.; Cruz, M.G.; Matthews, S.; Ellis, P.F. Fuel, fire weather and fire behaviour in Australian ecosystems. In Flammable Australia: Fire Regimes, Biodiversity and Ecosystems in a Changing World; Bradstock, R.A., Williams, R.J., Gill, A.M., Eds.; CSIRO Publishing: Collingwood, Australia, 2012; pp. 51–77. [Google Scholar]
- Nolan, R.H.; Boer, M.M.; Resco de Dios, V.; Caccamo, G.; Bradstock, R.A. Large-scale, dynamic transformations in fuel moisture drive wildfire activity across southeastern Australia. Geophys. Res. Lett. 2016, 43, 4229–4238. [Google Scholar] [CrossRef]
- Bowman, D.M.; Perry, G.L. Soil or fire: What causes treeless sedgelands in Tasmanian wet forests? Plant Soil 2017, 420, 1–18. [Google Scholar] [CrossRef]
- Krawchuk, M.A.; Meigs, G.W.; Cartwright, J.M.; Coop, J.D.; Davis, R.; Holz, A.; Kolden, C.; Meddens, A.J. Disturbance refugia within mosaics of forest fire, drought, and insect outbreaks. Front. Ecol. Environ. 2020, 18, 235–244. [Google Scholar] [CrossRef]


| Model | K | AICc | ΔAICc | AICc Weight | Log Lik. | Cum. Weight | Mr2 | RMSE |
|---|---|---|---|---|---|---|---|---|
| FMI 24 h Elevated | 4 | 761.5 | 0.00 | 1 | −376.7 | 1 | 0.588 | 0.49 |
| FMI 1 h Elevated | 4 | 923.2 | 161.6 | 0 | −457.5 | 1 | 0.531 | 0.58 |
| FMI 1 h Litter Pack | 4 | 992.0 | 230.4 | 0 | −492.0 | 1 | 0.354 | 0.61 |
| FMI 24 h Litter Pack | 4 | 1124.0 | 362.5 | 0 | −558.0 | 1 | 0.221 | 0.70 |
| Null | 3 | 1229.5 | 467.9 | 0 | −611.7 | 1 | 0.000 | 0.77 |
Publisher’s Note: MDPI stays neutral with regard to jurisdictional claims in published maps and institutional affiliations. |
© 2022 by the authors. Licensee MDPI, Basel, Switzerland. This article is an open access article distributed under the terms and conditions of the Creative Commons Attribution (CC BY) license (https://creativecommons.org/licenses/by/4.0/).
Share and Cite
Bowman, D.M.J.S.; Furlaud, J.M.; Porter, M.; Williamson, G.J. The Fuel Moisture Index Based on Understorey Hygrochron iButton Humidity and Temperature Measurements Reliably Predicts Fine Fuel Moisture Content in Tasmanian Eucalyptus Forests. Fire 2022, 5, 130. https://doi.org/10.3390/fire5050130
Bowman DMJS, Furlaud JM, Porter M, Williamson GJ. The Fuel Moisture Index Based on Understorey Hygrochron iButton Humidity and Temperature Measurements Reliably Predicts Fine Fuel Moisture Content in Tasmanian Eucalyptus Forests. Fire. 2022; 5(5):130. https://doi.org/10.3390/fire5050130
Chicago/Turabian StyleBowman, David M. J. S., James M. Furlaud, Meagan Porter, and Grant J. Williamson. 2022. "The Fuel Moisture Index Based on Understorey Hygrochron iButton Humidity and Temperature Measurements Reliably Predicts Fine Fuel Moisture Content in Tasmanian Eucalyptus Forests" Fire 5, no. 5: 130. https://doi.org/10.3390/fire5050130