
Factors Influencing Risk during Wildfires: Contrasting Divergent Regions in the US
1
Wildland Fire Management Research Development and Application (WFMRDA), Rocky Mountain Research Station, USDA Forest Service, 5775 W. Broadway Street, Missoula, MT 59808, USA
2
National Center for Landscape Fire Analysis, University of Montana, CHCB 441, 32 Campus Drive, Missoula, MT 59812, USA
*
Author to whom correspondence should be addressed.
Fire 2022, 5(5), 131; https://doi.org/10.3390/fire5050131
Submission received: 8 July 2022
/
Revised: 23 August 2022
/
Accepted: 25 August 2022
/
Published: 30 August 2022
(This article belongs to the Topic Recent Breakthroughs in Forest Fire Research)
Abstract
:(1) Background: Federal land managers in the US are charged with risk-based decision-making which requires them to know the risk and to direct resources accordingly. Without understanding the specific factors that produce risk, it is difficult to identify strategies to reduce it. (2) Methods: Risk characterized by U.S. land managers during wildfires was evaluated from 2010–2017 to identify factors driving risk perceptions. Annotation from 282 wildfires in two regions with distinctive risk profiles, the Northwest and Southwest Geographic Areas, were qualitatively coded using the risk assessment framework of hazards, values, and probability from the Relative Risk Assessment in the Wildland Fire Decision Support System (WFDSS). (3) Results: The effects of climate on seasonal severity, fuel condition, and fire behavior emerged as the most influential factors driving risk perceptions and characterizations of risk in both regions. Monsoonal precipitation extended the longevity of landscape barriers, especially in the Southwest. The results suggest that a scarcity of values at risk and a mild fire environment produce low risk fires regardless of location, while high risk fires reflect specific local values and geography, under the umbrella of dry climate. (4) Conclusions: the climatic contrasts between the two regions highlight how influential climate change will be on future characterizations of wildfire risk.
1. Introduction
U.S. federal land management agencies have sought to adopt risk management for almost every facet of wildland fire management. Risk assessment frameworks are commonly applied for a variety of spatial and temporal scales to plan and prepare for wildland fires pre-season [1,2]; to assess risks associated with fire-fighting tactics and operations [3], and strategically in the Wildland Fire Decision Support System (WFDSS) [4,5], with its relative risk assessment (RRA) representing a synthesis of operational and strategic wildfire risk [6,7]. The myriad of risk frameworks introduces unclear or conflicting concepts and terminology that manifest differently in multiple assessments based on specific contexts within wildland fire management processes [8]. In the research presented here, risk is the result of hazard, spread probability and values at risk from the relative risk assessment (RRA) conducted during wildfires in WFDSS [9]. RRA is used to assess the initial risk of emerging, federal incidents that are longer in duration because they escape initial attack suppression efforts or will be managed to achieve a resource objective.
Understanding the factors that drive risk perceptions on wildfires is expected to enable systematic changes to how risk is characterized, thereby allowing for greater decision-space to use wildfire to achieve resource objectives and ultimately, better-alignment of fire management practice and U.S. fire policy [10]. Currently, many ecosystems in the western U.S. are experiencing a fire deficit [11] or “disturbance deficit” [12] and there is critical need to reintroduce fire to vast expanses of land to enhance ecosystem resiliency and reduce uncharacteristic levels of fuel loading [13]. Ongoing and impending changes in climate have increased the urgency of this reintroduction [14,15,16]. Considerably reducing the number of directly suppressed wildfires in favor of alternative management strategies such as confine/contain and point/zone protection remains an important goal to get more acres “treated” with unplanned wildfire ignitions [17,18,19]. Additionally, embedded in every federal land management agency mission statement is an imperative to manage lands for future generations. This directive challenges land managers to consider long-term consequences of current management decisions. There needs to be a systematic process to account for decisions that both achieve and fail to address long term goals of landscape resiliency [19]. One way to address this need is to measure if chosen strategies accomplish both resource and protection objectives on wildfires. Understanding the drivers of decision maker’s risk perceptions are needed to enable such measurements.
Arguably, there is no single definition of risk. Instead, ‘risk’ is a conceptual understanding based on the probability and consequence of uncertain future events [20]. The biophysical characterization of risk composed of wildfire hazard, the likelihood of a wildfire event (probability), and a measure of how values at risk will be changed by wildfire, provides an objective measure of “risk” [2]. However, this quantitative risk may not explicitly reflect land manager’s perceptions of risk that are influenced by a multitude of factors. Assumptions, recent memories, quality, skill and bias associated with professional judgments, perceived affect, and real risk are factors influencing risk perceptions [21,22,23,24,25]. Unless otherwise noted, risk is defined by the risk produced from the relative risk assessment. The relative risk assessment reflects perceptions of risk from land managers guided, in part, by objective, biophysical risk, and it composes the ‘real’ risk that impacts decisions made on wildfires.
Historically, the RRA provided a systematic process to rapidly assess risk in order to decide whether to use wildland fire as an alternative to suppression [26], stemming from a desire to formalize protocols related to wildland fire use that emerged after the 1988 Yellowstone wildfires. In 2009, the RRA evolved to inform initial assessments of risk to guide any fire management strategy including full suppression, reflecting revisions in terminology and policy that merged all previous types of fire into two: prescribed and wildfire [3,10].
Using relative risk assessment data from 5087 US wildfires from 2010 through 2017, Noonan-Wright and Seielstad [27] showed the existence of large regional variations in RRA risk, with fires in the West Coast regions typified by high risk and fires in the Southwest and Eastern regions characterized by low risk. The present study examines the qualitative text data of the RRAs to identify driving factors behind these differences. Specifically, it seeks to identify the main themes and codes that uniquely classify high and low risk fires in the two most risk divergent regions in the US, the Northwest and Southwest Geographic Areas (GA), and to identify geographic dependencies. Focusing on these ‘extreme’ GAs provides the advantage of insight into factors related to risk at the two ends of the risk continuum but comes at the cost of overlooking factors representing the average condition typical of other GAs. We hypothesize that differences in climatology drive differences in risk profiles between regions, whereby the onset of the North American Monsoon in the Southwest provides a mid-summer, semi-predictable backstop to the fire season compared with the more uncertain, open-ended fire season in the Northwest.
The analysis capitalizes on a dataset that is mandated for specific, longer duration, federal wildfires that either required action beyond the initial attack to suppress the fire or had resource objectives that resulted in a longer duration event. These types of federal wildfires necessitate formal decisions [10] and the RRA is part of the decision workflow [9] (Figure 1). Within WFDSS, the RRA is a semi-quantitative process enabling fire managers to assign rankings to risk elements using predetermined categories and terminology ‘relative’ to a wildfire [8]. Most of the RRA elements are derived subjectively through deliberation by small groups of local decision-makers informed by models and data [9,28]. As such, they provide snapshots of how land managers, administrators, and fire specialists with access to state-of-the-art data, models, and analysis tools assess risk on thousands of wildfires.
The research follows a mixed method explanatory design by using frequency summaries of the risk ratings (quantitative data) to inform the sample design of the relative risk notes (qualitative data) [29,30]. Mining qualitative text is expected to provide a “deeper” understanding regarding some phenomena such as risk perceptions related to wildfire [29,31] by generating greater specificity through text coding, and by providing a more holistic understanding of the factors influencing risk perceptions documented on risk assessments when fire is burning and the risk is tangible.
2. Materials and Methods
2.1. Data Collection
The RRA data are from the WFDSS database, extending from 2010 through 2017, stratified by U.S. federal fire agency, relative risk rating and region to obtain a random sample of 149 wildfires from the Southwest region and 133 wildfires from the Northwest region. From these RRAs, all the qualitative text data (Figure 1) were consolidated and coded to produce the presence or absence of codes by wildfire.
The relative risk framework evaluates risk based on three common tenets: values at risk, hazard and spread probability and it provides visual estimates of high, moderate or low risk on wildfires [3] (Figure 1). Users also contextualize selected ratings through qualitative text inputs. The values element is composed of ecological ratings concerning natural resources, cultural values and infrastructure, social and economic concerns, and the proximity and threat of the fire to the values at risk. Hazard represents the conditions of the fire and is composed of ratings related to observed fire behaviour, fuel condition, and the potential growth of the fire. The probability element includes seasonal severity, prevalence of barriers to fire spread, and time of season relative to the normal fire season. The RRA produces an estimate of risk based on a conditional risk assessment; a condition that a fire is actively burning on the landscape, and its associated qualitative text data provides a portrayal of the issues influencing wildfire risk and decision-making.
For context, there were 616,032 wildfires in the U.S. from 2010–2017 [32]. Of these, approximately 17 percent were fires on federal lands. Among federal fires, 4.9 percent (n = 5087) resulted in publication of a risk assessment in WFDSS to provide documentation of the probability, hazard and values influencing the characterization of risk [9]. This analysis, then, provides insights into risk on mostly federal lands for wildfires that were expected to pose management challenges.
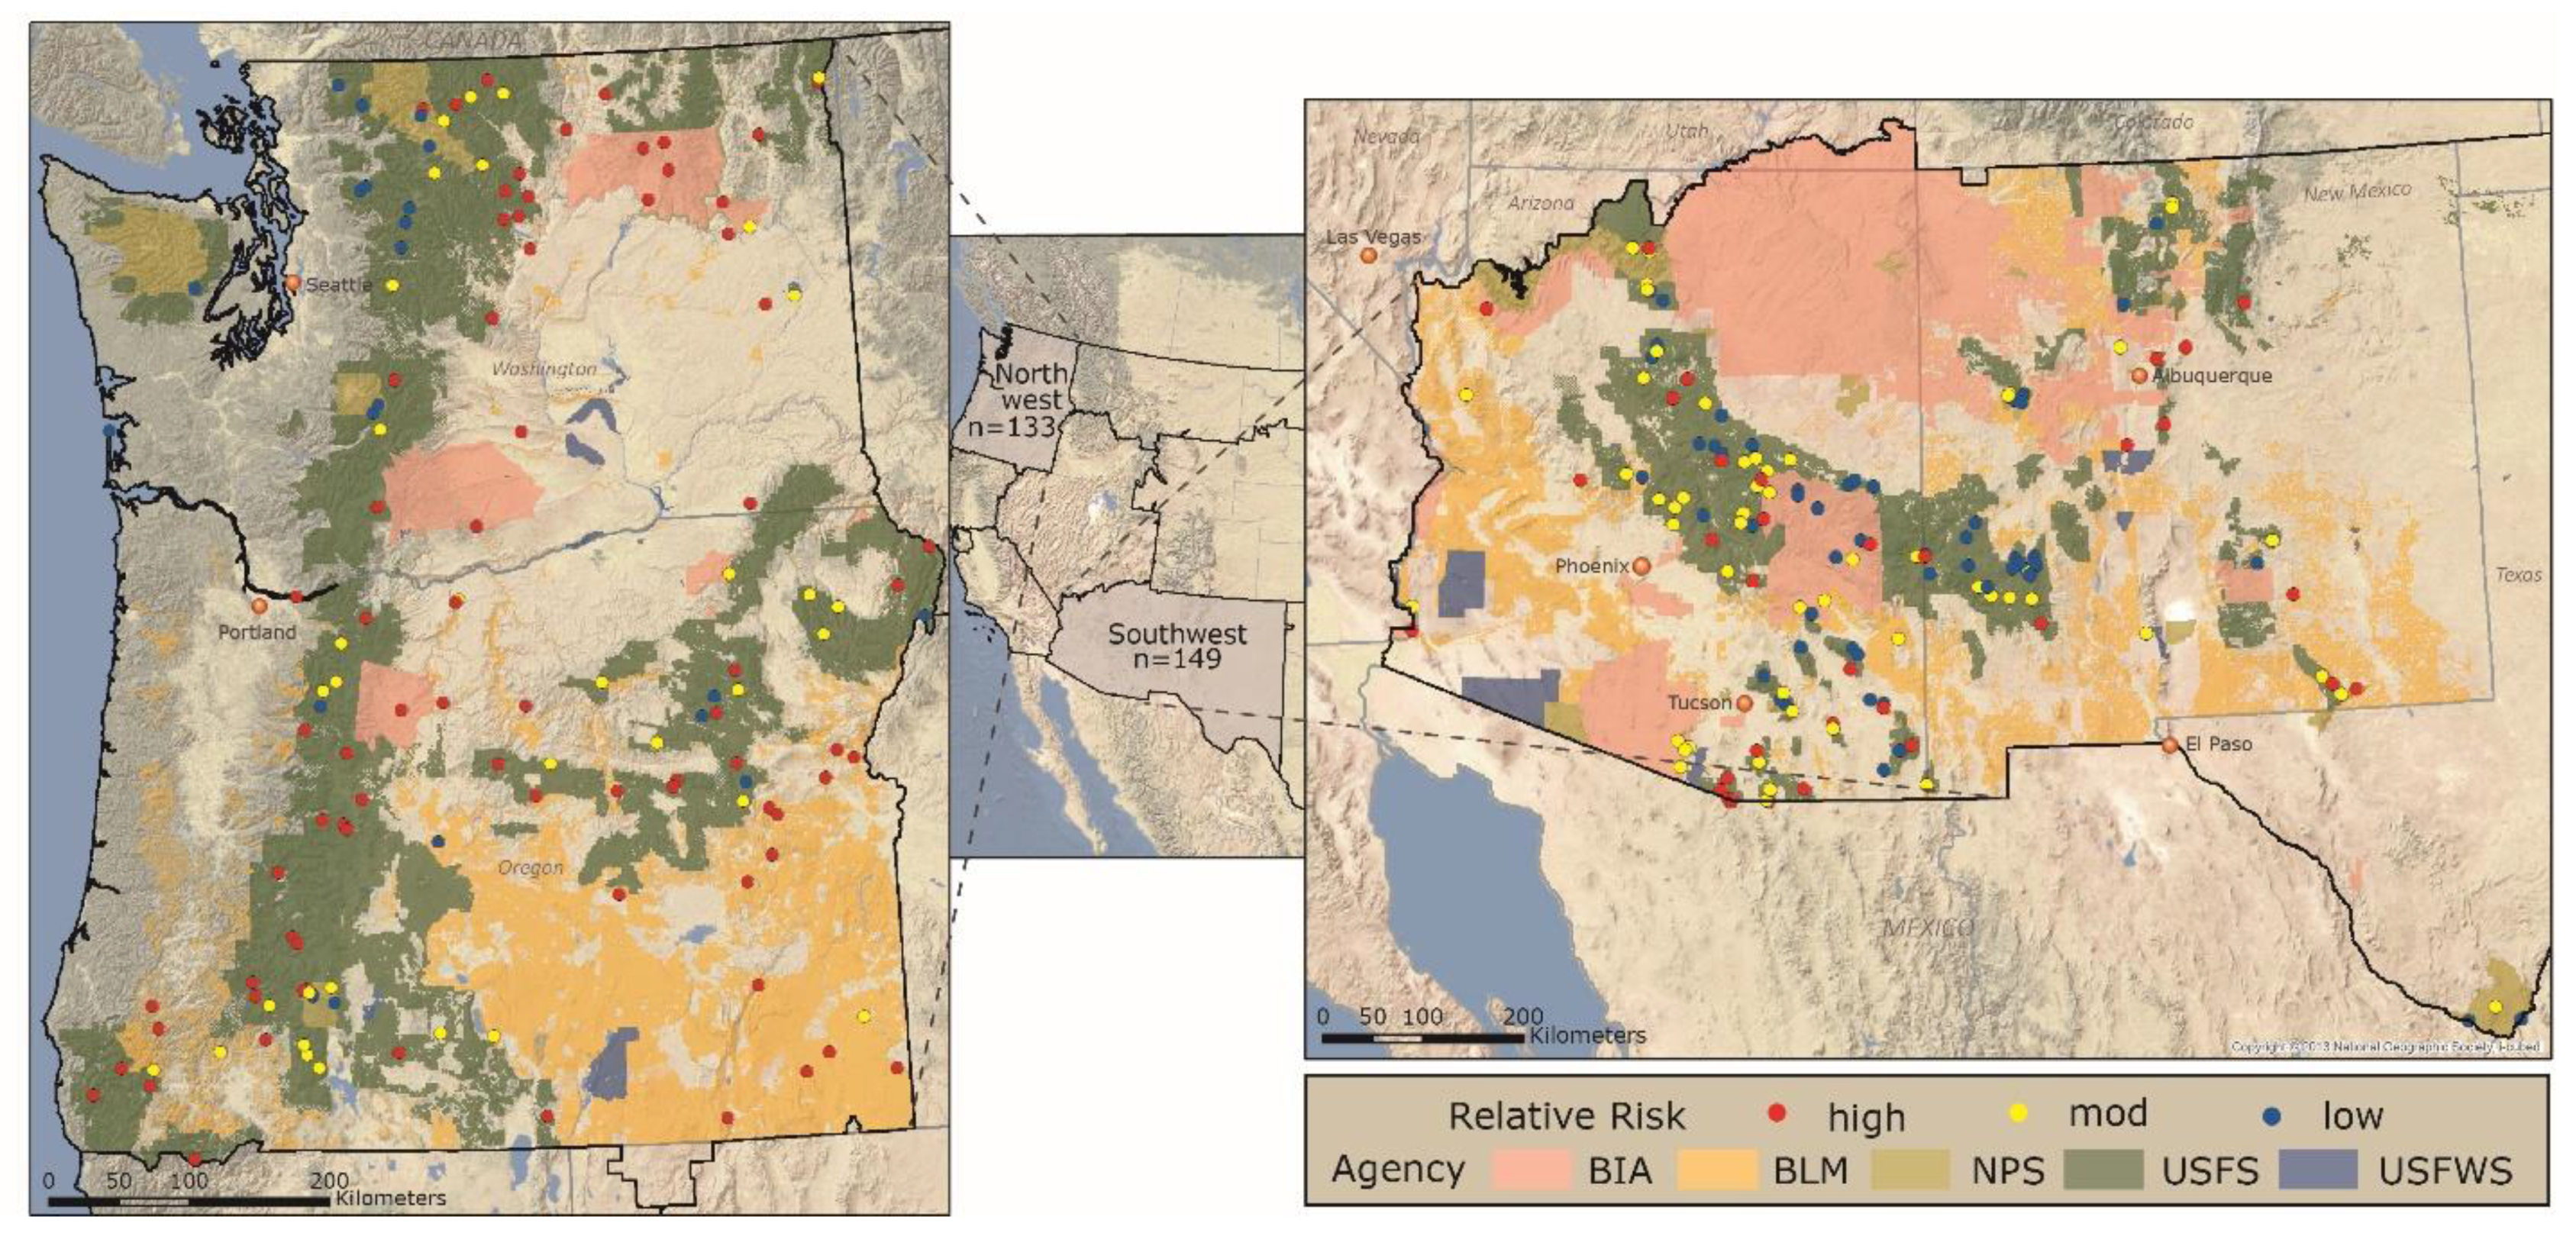
A stratified random sample representing 20% of the fires from the Northwest and Southwest geographic areas was selected to develop codes from the RRA qualitative notes. The fires were stratified by high, moderate and low relative risk and agency to ensure the sample was representative of the geographic area (Table 1, Figure 2). Subsequently, 282 wildfires were coded with 133 sample wildfires from the Northwest, and 149 from the Southwest. Land management agencies included the Bureau of Land Management (BLM), Bureau of Indian Affairs (BIA), National Park Service (NPS), Fish and Wildlife Service (FWS), United States Forest Service (USFS), State, County & Local, and Other (Department of Defense, Bureau of Reclamation, Department of Energy (DOE), etc.). Land management agencies have different missions which may reflect the characterization of risk. Overall, the frequencies of high, moderate, and low relative risk ratings between the population and sample differed by <1%. Agency differences were <4%. The sample (and population) reflect dominance of U.S Forest Service wildfires (Table 1).
2.2. Coding
Each wildfire documented in the risk assessment could have from 1 to 4 entries reflecting hazard, values, probability, and relative risk (Figure 1). The entries are typically 1–3 sentences per element. Approximately 11% of users write no text to explain any rating and a handful of users write paragraphs for each element. A code can be a word or short phrase that symbolically represents an important meaning from language-based data [33]. As each wildfire was evaluated, simultaneous codes were developed that were later categorized into broader classifications using deductive coding from the general framework of the relative risk assessment. NVIVO v11 coding software [34] was used to organize and categorize the codes and to map coding structures. A total of 83 separate codes were developed from themes that tiered from hazard, values, and probability elements directly applicable to the RRA. Themes were derived from the labeled axes of the RRA for each element and then split further to accommodate finer classification of the codes. For example, codes for the ‘Values’ element were split into 6 themes: Natural Resources, Infrastructure, Cultural Concerns, Social Concerns, Economic Concerns and Proximity (of the fire to values at risk, Figure 3). Themes, sub-themes and codes for the Hazard and Probability elements are available in Appendix A.
Check-coding was conducted on a random sample of fifteen wildfires by three analysts with operational and fire management backgrounds, to verify the comprehensiveness of the coding scheme and accuracy of the main coder. They collectively achieved a mean Kappa of 0.67 (moderate agreement). Kappa scores were also measured for individual codes. Lower kappa scores were usually the result of a check coder missing an opportunity to denote a code that had been discussed in the qualitative text or the codes themselves were too broadly defined, leading to a different interpretation from the main coder. In some cases, these discrepancies necessitated further lumping of codes. Additional queries were run in NVIVO to minimize the main coder error associated with missing key concepts and to verify that each code was only represented once per wildfire record. Codes were counted once per wildfire, even if certain concepts were discussed numerous times to facilitate computing frequencies on a per fire basis.
2.3. Data Analysis
Data analysis was a mixture of different techniques to investigate how values at risk, hazard and probability affect summaries of relative risk and how that risk was geographically unique or similar. First, the frequency of codes for different levels of relative risk was computed as the presence or absence of each code summed and divided by the total number of sample fires per geographic area (n = 133, Northwest; n = 149, Southwest) and by relative risk rating level (high, moderate, and low). Some percentages exceed 100% because multiple codes occurred for one wildfire; for example, users may note that both private residences and private land occurred as values at risk (i.e., two separate examples of the “infrastructure” theme), which were normalized individually by the total number of sample fires, not the total sum of codes (Table 2). Second, aggregate summaries were generated for codes and their associated themes by region and relative risk to identify the contribution of individual codes to a theme (Figure 4, Figure 5, Figure 6 and Figure 7).
A1We also used three statistical tests to evaluate the importance of different codes on the prediction of high, moderate, and low relative risk by region. First, Pearson’s Chi-square tests were performed on a 3 by 2 level matrix (3 levels of relative risk by 2 levels representing presence or absence for each code for each region. Some codes occurred for all levels of risk. p-values less than 0.05 suggest that the composition of the codes had unequal proportions of high, moderate or low relative risk ratings, e.g., some ratings were used more or less than expected (Table 2). Second, we used Random Forest to predict levels of relative risk (high, moderate or low) for each region given the presence or absence of the 83 codes. Some codes were removed because they had no observations for any of the incidents when the data set was divided into specific regions. Codes were also grouped and assigned into broader themes; for example, “forests” and “range” were assigned to the “fuel type” theme for subsequent analysis (Appendix A).
The Random Forests algorithm [35] grew 1500 classification trees based on a bootstrap of the data. For each tree, variation in the response variable was partitioned based on the predictor variables (i.e., high, moderate, or low relative risk). We applied a model selection approach using the model improvement ratio (MIR) to test the model parameters and select the model with the best error component. The “mir” scale option performs a row standardization. The scaled importance measures are calculated as: mir = i/max(i), where (I) is the given importance of a given metric and Imax is the maximum model improvement score. The strength of using the MIR is that it is comparable between models. The random forest analysis was performed 10 times due to the instability of the model for each region, following protocols from Dillon et al. 2011 [36]. For the 10 iterations for each region, the median MIR value was computed and ranked for each code (Table 2).
Median MIR scores greater than zero were used reduce the 90+ codes to 46 variables for the Southwest and 47 variables for the Northwest for a Classification and Regression Tree (CART) analysis, used to identify main codes important to predict risk in the two regions. Trees were set to a minimum split at 10 with an initial cp at 0.00001 with the full set of variables. Trees were pruned again, using the most optimal complexity parameter (cp) that minimized error. The cp value for the Northwest was 0.051 and 0.078 for the Southwest. We used Variable Importance from the CART model as a general measure of the value the code contributed to the sum of improvements in all nodes in which the code appears as a splitter. Variable importance was used as an indication of the variables that were most influential in the classification of different levels of relative risk. These values were ranked from most influential to least influential (Table 2). All analyses were performed using R software [37] and various packages: Random Forest analysis [38], Classification trees [39], Model Improvement Ratio [35], and plotting [40].
3. Results
3.1. Themes and Codes Related to Wildfire Risk
A summary of influential codes and associated themes is provided in Table 2, where the frequency of codes by H (high), M (moderate), L (low), and T (total) relative risk ratings are expressed as percentages, along with Chi-square p-values, and rankings from the Random Forest (highest to lowest MIR value) and Classification and Regression Tree (highest to lowest variable importance value). Influential codes were identified by tabulating a combination of Chi-square p-values < 0.05 and ordering codes according to ‘high’ frequencies greater than or equal to 10%; and ordering ‘low’ frequencies greater than or equal to 5% for the Northwest (Table 3). Because there were more Southwest low risk fires than high risk fires, an inverse ordering for the Southwest (5% or less ‘high’ frequencies, 10% or less ‘low’ frequencies) were included in Table 4.
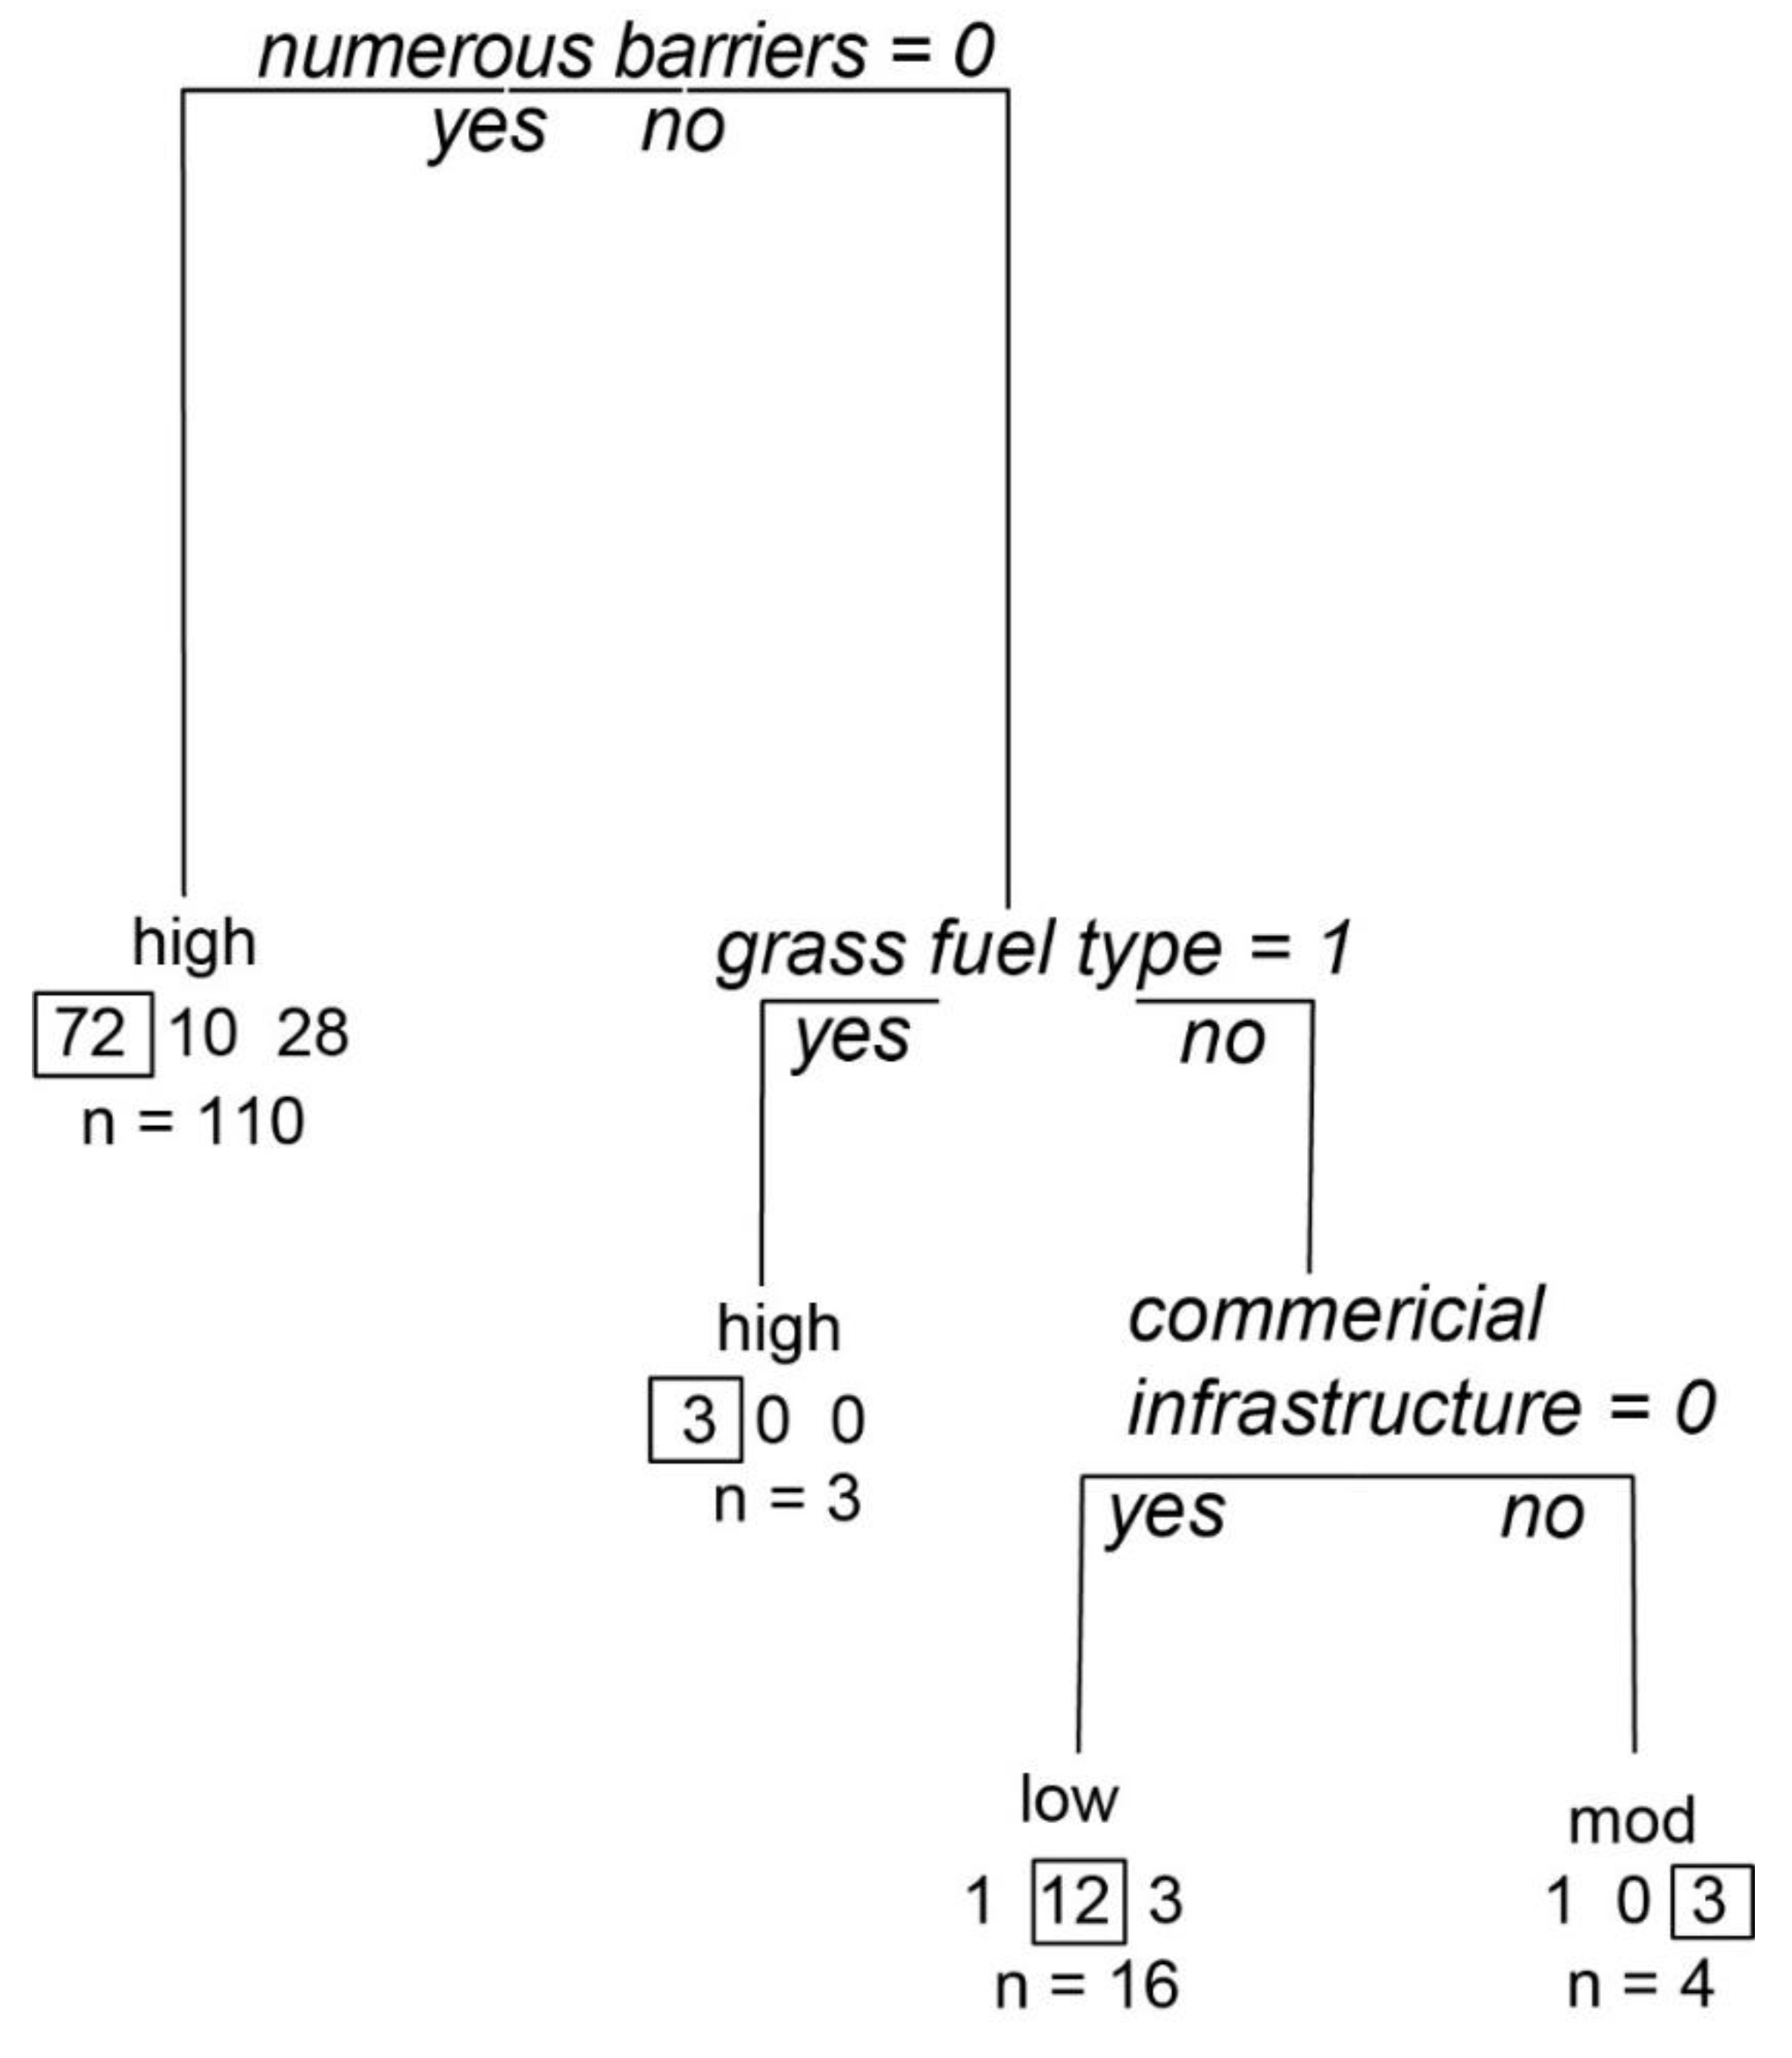
Barriers and fire behavior play critical roles to predict risk level for both GAs. In the Northwest GA, the absence of numerous barriers is the most important factor contributing to high risk in the CART model. Grass fuel types plus numerous barriers also produce high risk (Table 2, Appendix C). Overall CART classification accuracy between observed and predicted was 68%, with a tendency to misclassify moderate and low risk as high risk. The critical role that barriers play in determining the relative risk rating is further supported by the chi-square and frequency rankings (Table 3). Natural barriers are ubiquitous for both high and low risk Northwest wildfires and numerous barriers are more common for Northwest low risk fires (Table 3). Dry fuel moisture and housing are the most commonly discussed codes in high risk fires in the Northwest, occurring on ~25% of them, while low risk fires are described by low fire potential, precipitation, forested fuel types and vegetation within historical ranges. In addition, high risk fires in the Northwest tend to reference natural barriers, large spread potential, grassy fuel types and natural resource concerns common to grass/shrub fuel types like ACEC (Areas of Critical Environmental Concern) and sage grouse habitat (Table 3).
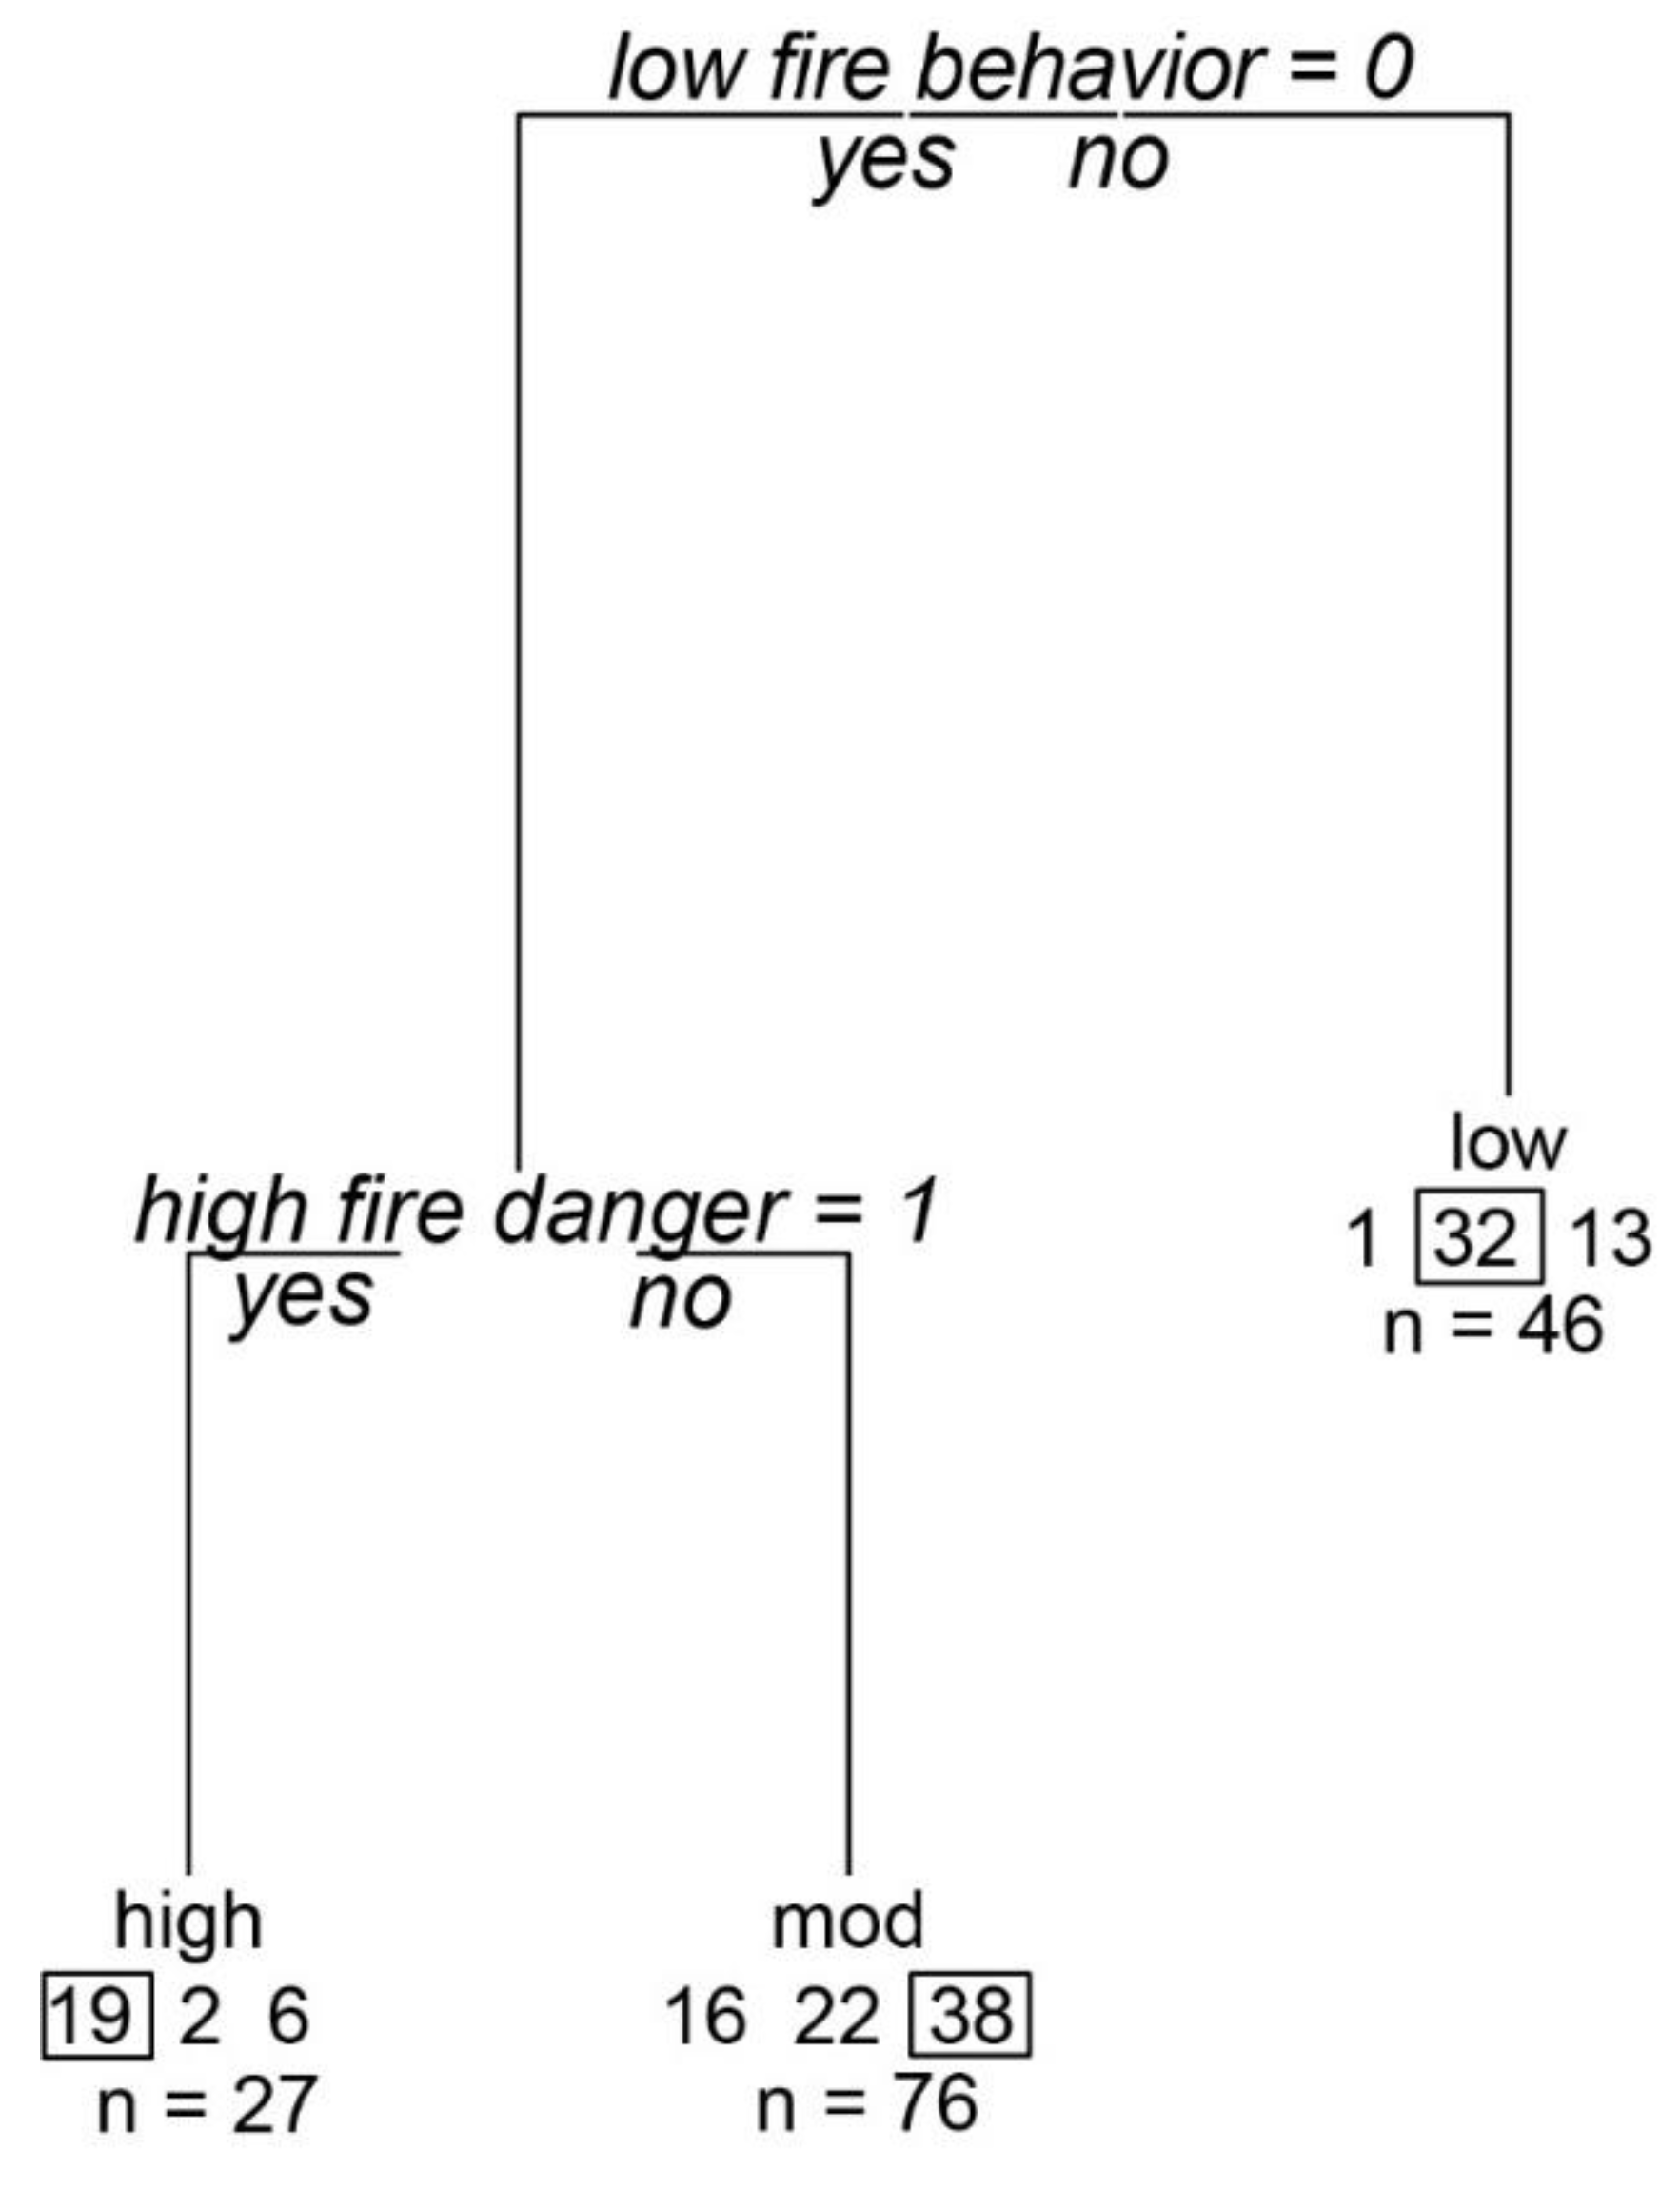
In the Southwest, the presence of low fire behavior is the most important predictor of relative risk (Table 2, Appendix C), and along with discussion of the monsoon, both codes occurring about 20% with low risk fires. High risk results when there is no mention of low fire behavior and when fire danger is high. When low fire behavior is mentioned, the CART predicts low risk. Classification accuracy is 60% with a tendency to misclassify to moderate risk. From the chi-square and rankings, high risk fires in the Southwest generally include a discussion of codes influencing high fire spread potential (e.g., low relative humidity, windy, hot, high fire potential, red flag conditions (i.e., weather conditions that occur to promote extreme fire behavior), and seasonal severity (e.g., high fire danger, dry fuels, high seasonal severity (Table 4). Other codes relate to fuel condition (high fuel loads), natural resources (wildlife habitat) and social concerns (multijurisdictional fires). Low risk fires use seasonal severity themes such as the monsoon, high fuel moisture, and late time of season. Themes related to fire potential and barriers are also common, e.g., precipitation, low spread potential, and numerous landscape barriers.
3.2. VALUES: Common Values at Risk Discussed by Land Managers on Wildfires
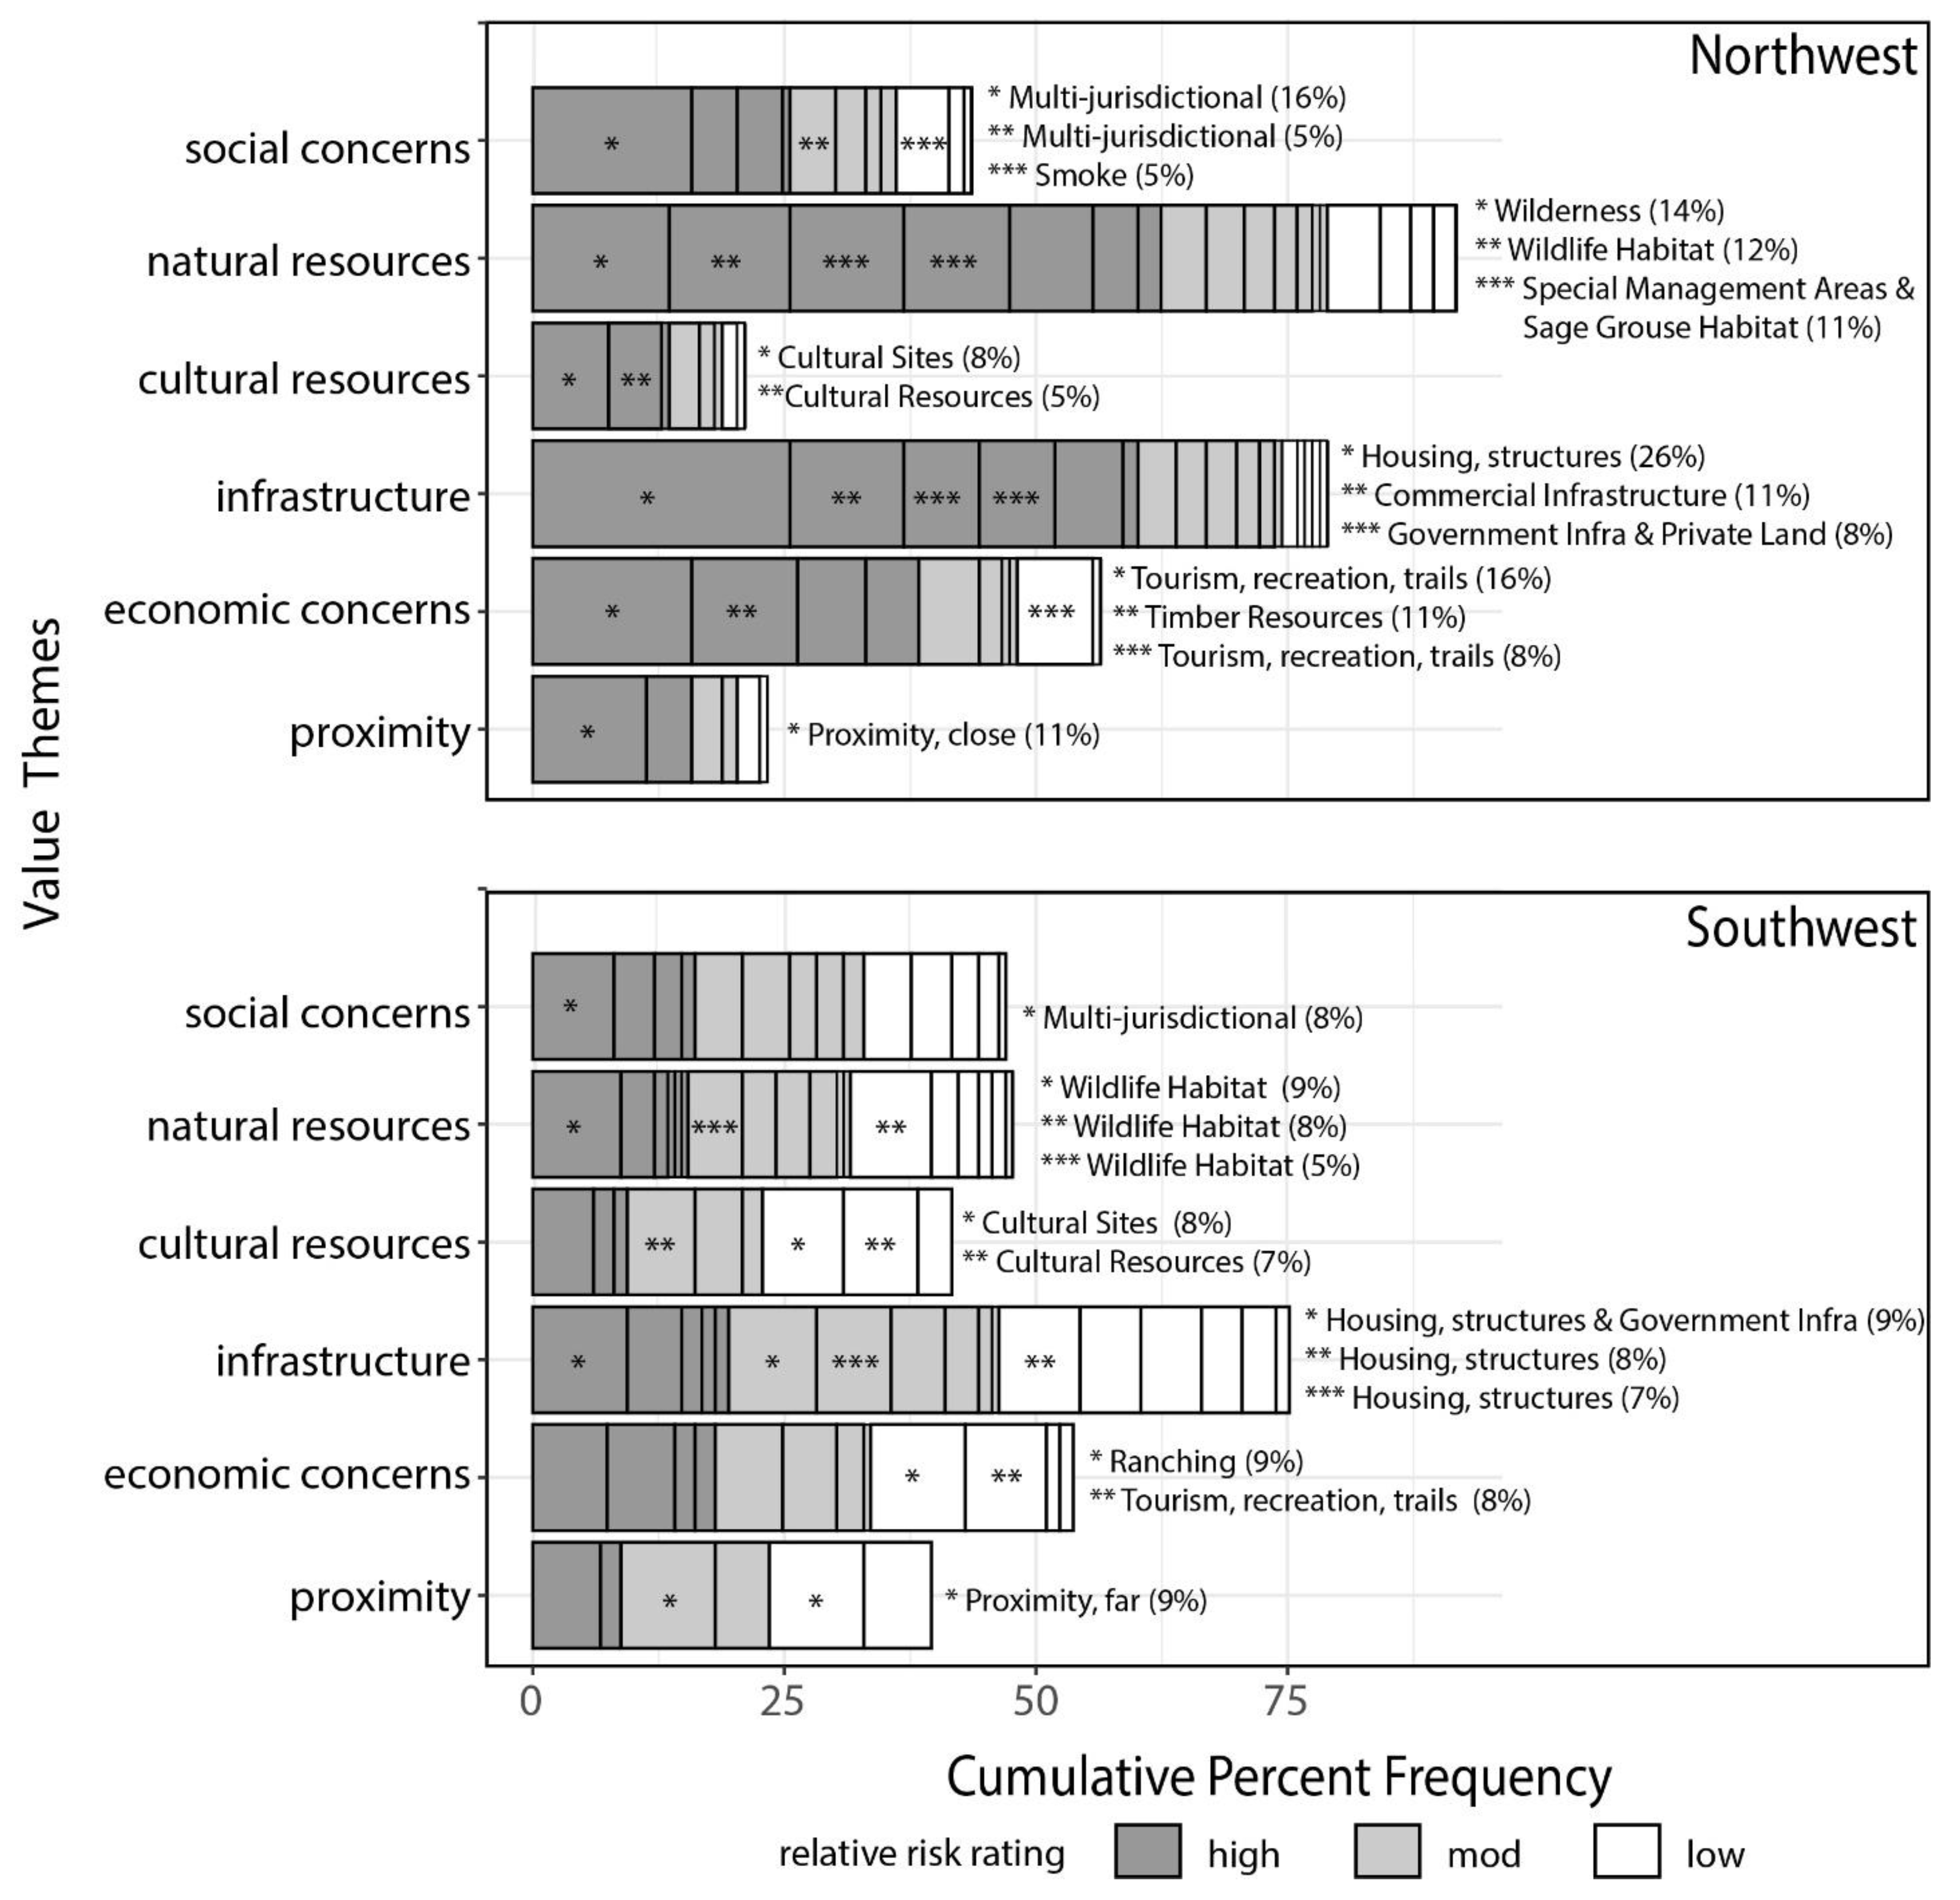
Values at risk are discussed at less the half the frequency of hazard and probability attributes by both regions. However, values at risk are present in higher frequencies for high risk fires for both geographic areas, related to natural resources, infrastructure and social concerns. Northwest managers tend to characterize proximity of wildfires as ‘close’ to values at risk compared with Southwestern managers who describe proximity as ‘far’ (Figure 4).
Values in the Northwest focus on natural resources, specifically wilderness (23%), wildlife habitat (19%), threatened and endangered species (14%) and special management areas (14%, Table 2), but infrastructure, especially housing and structures, is also frequently discussed (26%, Table 2) and ranks second in the random forests analysis. Economic concerns related to recreation/tourism are prevalent for all levels of risk, but most frequently invoked for high risk fires (16%), while timber (marketable forest products) is mentioned for mostly high risk fires (11%) but is not a statistically significant factor. Social concerns regarding multijurisdictional fires are not significant but occur on 22% of mostly high risk fires.
Infrastructure more than any other value at risk theme is discussed by land managers in the Southwest, related to housing and structures, and occurring across all levels of risk (25%, Table 2). Natural resource concerns are discussed at about half the frequency of the Northwest and are specific to wildlife habitat, occurring for all levels of risk (22%) but more than expected for high risk fires (Table 2). Cultural resources are discussed at twice the rate as the Northwest for all levels of risk, mostly referencing general cultural resource sites and concerns. Economic concerns related to recreation and tourism and ranching are prevalent for all levels of risk with multijurisdictional fires tending to be high risk.
3.3. HAZARD: Conditions Amendable to Fire Spread
Land managers from both GAs discuss fire “potential” more than the other hazard themes (Figure 5) and many related codes are significant, suggesting that fire potential, topography and weather are impactful attributes associated with both high and low risk fires. Steep topography (16%) and windy conditions (14%) are additionally used to describe potential for high risk fires in the Northwest. High fuel loads, likely associated with “highly departed vegetation” are also more common for high risk fires in the Northwest.
Discussion of hazard in the Southwest is dominated by precipitation (34%) and low fire behavior (31%, Figure 5), both significant codes on low risk fires and ranked important in the CART model (Table 2). A finer inspection of hazard themes especially for fuel condition shows that grass and shrub fuel types are discussed with some frequency (greater than 20%) for all levels for risk in the Southwest. Fuel loading is also important, with high fuel loads noted more for high risk fires; low fuel loads for low risk fires, and average fuel loads occurring more than expected on moderate risk fires (p < 0.05).
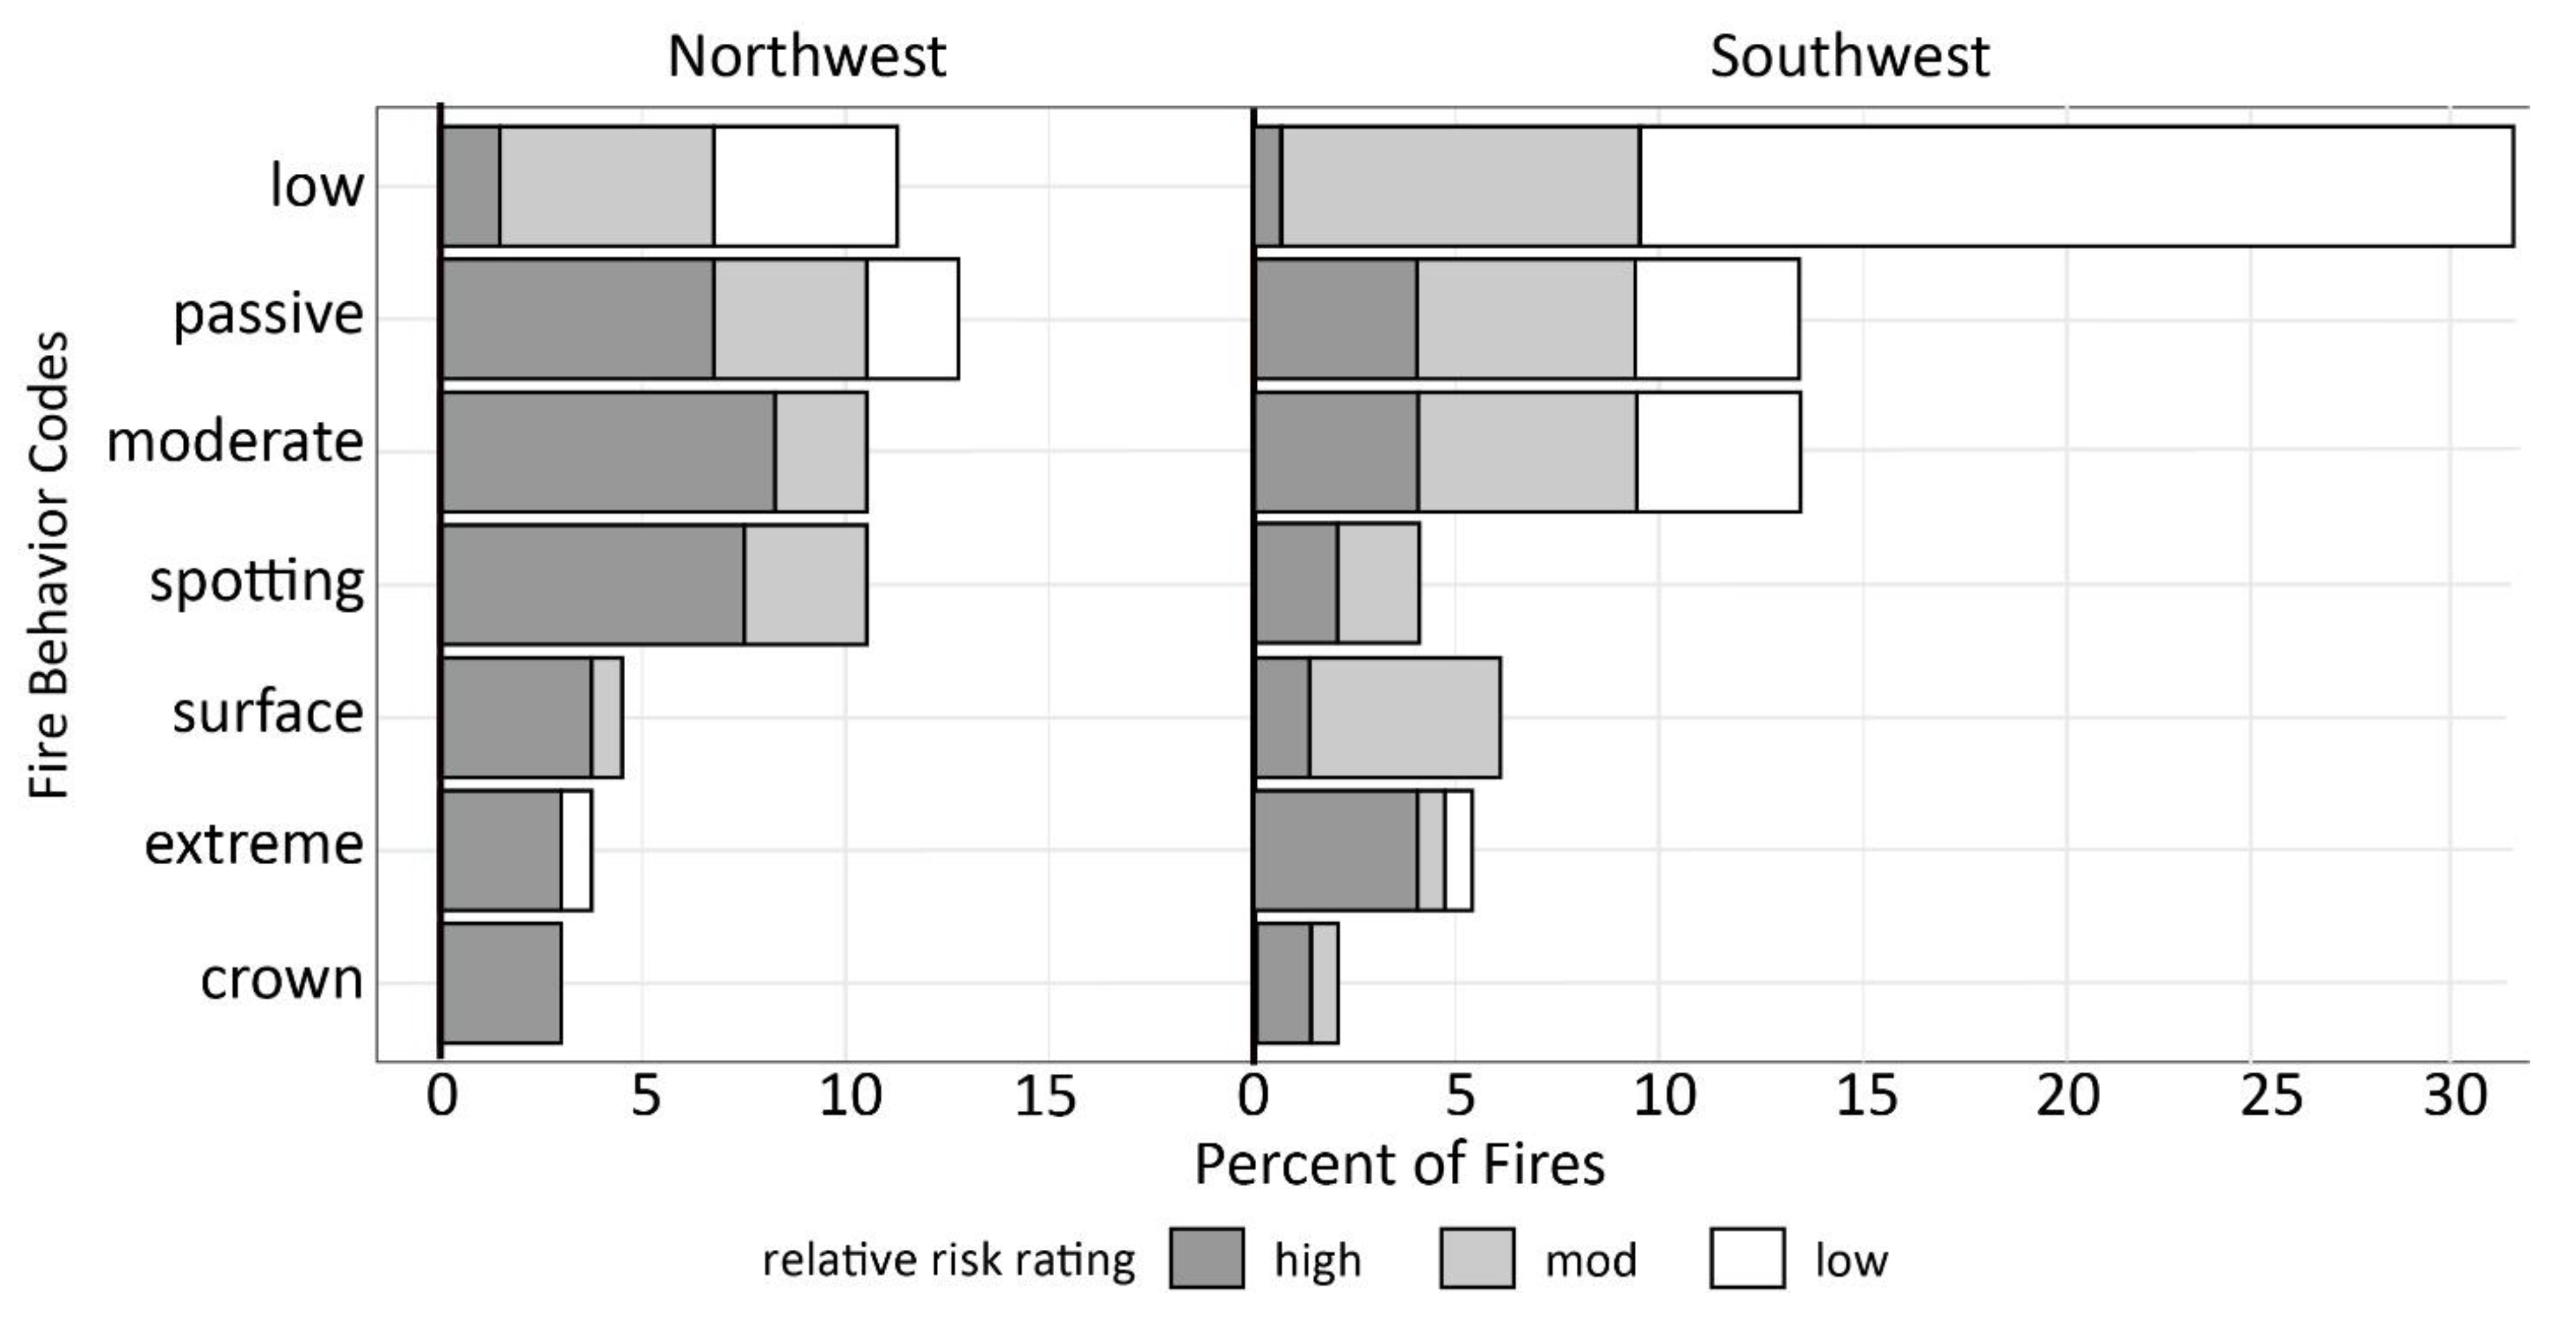
Passive and moderate fire behavior are discussed commonly by both GAs, in connection with all levels of risk in the Southwest, and with moderate and high risk in the Northwest (Figure 6). The Northwest also discusses spotting for high and moderate risk fires. While used sparingly, extreme fire behavior is a significant code in the Southwest for high risk fires, and surface fire (vs. crown fire) is significant for moderate risk fires (Figure 6). Low fire behavior dominates the fire behavior discussion in the Southwest (31%), is used significantly more than expected for low risk fires (21%) and is the most influential predictor of low risk for the CART model (Table 2, Appendix C).
3.4. PROBABILITY: Codes Influencing the Likelihood of Active Fire
Barriers to fire spread and seasonal severity are the most commonly discussed themes in both GAs, with low fuel moisture a significant code for high risk fires, and high fuel moisture significant for low risk fires (Table 2). The Northwest often describes the conditions of a challenging fire environment for high risk fires (Figure 7), although high fire danger and drought are discussed frequently for all levels of risk. Time of season is not used as much relative to other probability themes, but there are some interesting trends. For example, the Northwest references middle time of season (15%) and early season fires (8%) more commonly for high risk fires. Additionally, the type and number of landscape barriers is important at all levels of risk in the Northwest, and references to “few” barriers also occurs preferentially on high risk fires.
In the Southwest, seasonal severity is the focus of themes and codes and is associated with mostly low and moderate risk fires. The North American monsoon contributes to low (21%) and moderate risk (12%), and high fire danger is present for high risk fires (13%), and across all risk levels (23%), indicating a dominant dry climate impacted by sporadic (but semi-predictable) monsoonal rains that trigger low to moderate risk. Discussion of time-of–season occurs more than expected for fires that start late in the fire season and tends to be associated with low risk fires. Barriers to fire spread of all types is commonly discussed, with those created by prescribed fire occurring more than expected for low risk fires even though they are discussed less frequently overall.
4. Discussion
The discussion of risk in the Southwest and Northwest regions is focused on whether fire is expected to reach values at risk, related to both the probability of fire spread and the barriers that will impede this spread. If there is a good chance fire will reach values, risk is high. Otherwise, risk trends low. Values are discussed at less than half the rate of hazard and probability and there is no discussion of the actual or relative worth of values, the ability of values to resist fire, or the facility of the public to accept and deal with the consequences of wildfire. In short, managers see high risk when fire and values, especially housing, might interact. In the context of the oft-stated assertion that ‘people need to learn to live with fire’, these findings highlight a gap that exists between this ideal and current practice.
Despite the inherent complexity of the fires in WFDSS, fire behavior is generally described as moderate, low, passive or spotting fire behavior. High or extreme fire is mentioned less than 6% of the time. This finding is consistent with the perspective that high/extreme fire behavior is rare and fleeting on a majority of wildfires. Another way to conceptualize fire behavior as a risk factor is to consider that a break in the conditions that promote high fire behavior, for example, precipitation associated with the North American monsoon, can provide land managers with some confidence that values at risk will not be impacted by wildfire. Sporadic rains or more certainty about the end of the fire season, coupled with barriers to fire spread, lend themselves to greater decision space when devising fire management strategies by reducing the probability that fire will interact with values. We suggest that the relative confidence managers have in the occurrence of a season-ending event is a major contributor to differences in risk factors between regions.
4.1. Geographically Dependent Characteristics of Low-Risk Fires
There are some aspects of low risk fires that are geographically dependent. For example, the Southwest discusses a mild fire environment more than the Northwest likely due to the occurrence of the North American monsoon. The monsoon climatic pattern strongly affects fire weather in the Southwestern US, associated with sporadic rains typically occurring around the end of June or early July through September [41]. It contributes to a hard-stop to the fire season precisely when most of the rest of the western US is ramping up toward peak burning conditions and offers an element of predictability in fire activity. When the monsoon is referenced in the Southwest, it is usually discussed in the context of reducing fire behavior and potential and is mentioned in the context of certainty regarding the end of the fire season, i.e.,
“Given the recent and forecasted monsoonal moisture this fire is not expected to grow much, if at all and fire behavior is expected to be low” (Southwest, Low Relative Risk); or
“We are starting to see the onset of monsoon moisture which indicates the peak fire season is drawing to a close.” (Southwest, Low Relative Risk)
When precipitation with the monsoon was lacking, managers discussed the “inconsistent” or “atypical” conditions and associated them with higher levels of risk, i.e.,
“Due to atypical monsoonal patterns, continued prolonged drought, and high temperatures, fuel moistures are very low and seasonal severity is extreme. Typically, the area would have already experienced green-up from monsoonal moisture and fire activity would be minimal” (Southwest, High Relative Risk); or
“Due to sustained drought, seasonal severity would rank higher than average. Monsoon storms have been inconsistent.” (Southwest, Moderate Relative Risk).
Landscape barriers from previous wildfires are also discussed frequently in the Southwest and prescribed fire barriers are noted on low risk fires indicating that managers recognize the benefits of previous wildfire strategies that used wildfire to manage landscape vegetation when considering risk. The following example from the Southwest exemplifies many of these common attributes:
“Overall relative risk is low, primarily because of the time of the year and the fact that we have received good monsoon rain in the last three weeks. There are minimal values to protect in this area, and fire behavior is expected to be low. The fire area has not burned in recent history but is surrounded by numerous areas that have burned in wildfires or prescribed fires in the last 5 years.” (Southwest, Low Relative Risk).
The connections managers make between the presence of landscape barriers and risk support research efforts aimed at expanding decision-space on wildfires. For example, the dependencies between final fire perimeters and landscape features (topography, roads, ridgetops, fuel changes) have been combined in an empirical model to predict Potential Control Lines where fire management efforts might be most successful in limiting fire spread [42]. The formulation of management zones (Potential Delineations of Operations) dependent upon these barriers have subsequently been used to promote more options to manage wildfire in the Southwest [43]. Our findings showing the importance of barriers in risk perception suggest that the former efforts are likely to be successful in changing decision-spaces around wildfires.
In the Northwest, despite the dominance of dry summer climate and the absence of a predictable fire season-end, there is also evidence that when fire conditions are moderated by sporadic summer precipitation, the result is low to moderate relative risk related to lower fire behavior and spread potential, similar to what is referenced by land managers in the Southwest. Low risk fires in the Northwest also have some unique aspects, such as high elevation, forested fuel types, vegetation within historical ranges, numerous and natural barriers, and smoke as the only social concern. This excerpt from a Northwest wilderness fire provides an example of many of these common low risk attributes; for example,
“The fire is surrounded by rock on 3 sides, with a significant landslide on the 4th. Indices and fuels conditions are somewhere between average and slightly above average. At this time, only 3 smokes are showing between all 3, and there is no reason to believe, that this won’t happen on the Jumbo as well. Should significant growth occur, it is anticipated that it will be up drainage away from private values, further into the Boulder Creek Wilderness. We are entering the last week of August, with the historical season ending event taking place in the next 2–3 weeks.” (Northwest, Low Relative Risk)
Although the latter conditions likely occur less frequently in the Northwest, the excerpt illustrates remote fires with low spread potential burning at high elevation late in the fire season with few values at risk as emblematic of low risk fires.
4.2. Climate and Local Values Distinguish High Risk Fires
High risk fires have fewer common factors shared between the GAs. There are a variety of hazard and probability codes that commonly describe a challenging fire environment, but the similarities diverge for the discussion of values at risk. Important values at risk in the Northwest during high risk fires are housing, sage grouse habitat, and special management areas (i.e., ACEC—Areas of Critical Environmental Concern) often associated with grass/shrub fuel types. Wildlife habitat, often associated with the Mexican Spotted Owl (Strix occidentalis lucida), is influential for Southwestern high risk fires. Housing and recreation values at risk are discussed ubiquitously across regions and risk levels.
Unlike the Southwest, the Northwest does not benefit from consistent seasonal rains during the summer months [44], and is expected to experience increases in fuel aridity and wildfire activity associated with anthropogenic climate change [45]. Climate manifests as dry summers without predictable precipitation and is the foundation for the fire season leading land managers to frequently comment that fuels are dry and fire danger is high. The artifact of dry summers, departed vegetation condition, grass fuel types, and dry fuel moistures, coupled with the influence of specific values at risk that do not interact with fire in beneficial ways (e.g., loss of structures and habitat) are all associated with higher ratings of risk. The variety of factors influencing high risk in the Northwest is exemplified below:
“The relative risk is high due primarily to the potential for a high rates of fire spread and large fire growth. Fire behavior indices are above normal for the time of year. Natural resource concerns include general and priority sage grouse habitat, ACEC, and noxious weeds. There are moderate social/political concerns due to the ranches and private land scattered throughout the planning area and impacts to grazing and wildlife habitat. Fuels are primarily grass. Topography is rough and access is limited. Even though early in the fire season, fuels are reaching critical stages. This area is experiencing a persistent drought conditions.” (Northwest, High Relative Risk)
Previous studies suggest that most houses and structures do not respond favorably to wildfire [46,47] and yet the intermix of national forests and housing is considered a hot spot for development [48]. Both the number of people and homes in the wildland urban area have increased [49] with a concurrent increase in the probability of wildfires for many western U.S. counties [50]. The origination of wildfire ignitions is often human-caused on private lands [51]. These factors are increasing the general jurisdictional complexity of federal lands with transboundary wildfire exposure among federal, state, and private entities all impacting communities [52]. Increasingly, the focus on human vulnerability is a major tenet of federal wildfire management and not one that can be readily ignored by managers [53]. It is therefore not surprising that land managers charged with managing wildfire on public lands which are generally absent of private residences are discussing housing and structures for all levels of risk in the populated and growing Northwest region along with complexities associated with multijurisdictional wildfire management.
High risk, multijurisdictional fires appeared to be more complicated and prevalent for both GAs; for example, there are administrative complexities along with issues related with competing land management objectives associated with different agencies as exemplified in the excerpts below:
“The fire is expected to involve several jurisdictions, cooperators, and special interest groups and agreements requiring significant negotiation need to be developed” (Northwest, High Relative Risk); or
“The western perimeter is 1.5 miles from the Forest Service boundary. The strategic direction for the fire is to prevent spread onto neighboring jurisdictions.” (Northwest, Moderate Relative Risk)
In many cases, pro-active measures to incorporate multiple shareholders to provide input into pre-fire planning processes are already occurring [54], stemming from efforts associated with cohesive strategy [55], but the jurisdictional issue is still evident in the data, perhaps related to the different missions of the various federal and non-federal landowners.
4.3. Climate Change
The strong and contrasting coupling of climate and risk between the Southwest and Northwest highlights the role climate change may play in future wildfire risk. Southwestern land managers clearly rely on the predictability of the monsoon to manage risk and the Northwest clearly suffers the consequences of a highly uncertain moisture regime each summer. Future projections of monsoonal moisture are uncertain with a changing climate [56]. Some research has suggested that precipitation associated with the monsoon could sharply decrease due to increased atmospheric stability and less wind associated with more uniform sea surface temperatures [57], while others suggest the reliability of monsoonal precipitation could shift to later in the fire season [58]. This, in turn, could result in significantly more large wildfires (>24,000 ha), and more days with extreme conditions including very low fuel moistures and high fire danger for the Southwest [45]. The years between 2000 and 2021 are noted as the driest 22 year period for the last 800 years [59], and it seems probable that selection of a ‘low’ relative risk rating could wane in the Southwest. Based on the findings of this study, climate changes that result in more variability (or decreased predictability) will almost certainly increase operational wildfire risk. The constant threat of high consequence, low probability events drives up operational risk.
The Northwest is predicted to experience an increase in more extreme fire days as climate changes. Fuel aridity is likely the cause of larger fires in forested ecosystems [60,61], in part, due to anthropogenic activity leading to increases in temperature and vapor pressure deficit [62]. An evaluation of climate from the Pacific Northwest from 1901 to 2012 showed increased warming, a long-term increase in spring precipitation and decreased summer and fall precipitation leading to larger climatic water deficits [63]. Manifestations of future climate is expected to produce more unfavorable weather and fuel conditions amenable to fire spread, posing challenges for land managers in both GAs [14].
On the positive side, there is evidence in both regions that when managers get a break from high fire environment conditions with a favorable weather forecast or time of season, they find low risk and consider a wider variety of management strategies. We hypothesized that manager confidence in the occurrence and effects of the monsoon would be a major aspect of Southwestern fire management that lent itself to lower risk and perhaps greater decision space when devising fire management strategies. However, we did not anticipate the same behavior in the Northwest when occasional sporadic moisture and certainty with respect to fire season end worked together to produce some low risk and perhaps different management strategies. There is a need to exploit these favorable conditions more frequently in order to opportunistically use unplanned and planned ignitions to accomplish long-term management objectives. Given expected future climates, now is the time to change how fire is managed, which likely means reducing risk (or changing perceptions of it) and using different management strategies on a larger fraction of fires [13].
5. Conclusions
Unique to this study are results from wildfire risk assessments made during actual events, when risk was evolving, dynamic, uncertain, and inconclusive. Land managers articulated a range of factors to justify risk with common themes emerging for the two most risk-disparate geographic areas in the country. The Northwest and Southwest both identified housing and habitat as the most common values at risk. Both discussed the role of natural and unnatural landscape barriers; as well as high seasonal severity, especially in of the context of high fire danger and dry fuel moistures. However, the Southwest selected low and moderate relative risk with greater frequencies than the Northwest and the factors managers write about relate primarily to characteristics of the fire environment amenable to ‘low fire behavior’ and ‘small potential’, in part, due to precipitation associated with the North American monsoon. The Northwest found high and moderate risk with high frequency, and it is not surprising that its land managers write more about values at risk, aspects of seasonal severity leading to greater fire spread and potential, and steep topography. Perspectives from both GAs highlight the critical role that climate plays in dictating weather, fuel moisture, and fire behavior as noted in other studies [64,65] when assessing risk during wildfires, which ultimately influences how wildfire will be managed.
5.1. Limitations
While there are many efforts to quantify wildfire risk [2,66], this data set from the mandated U.S. Wildland Fire Decision Support System represents perceptions of risk from primarily federal land managers once a wildfire ignition is established. We surmise the RRA represents a mixture of land manager’s risk perceptions influenced by agency culture, individual biases, risk aversions, [28,67,68,69,70,71] and biophysical risk, among other factors. This study makes no attempt to understand the motivations behind an individuals’ propensity toward rating a RRA as “high” or “low” risk, and instead summarizes these issues on regional scales to explore these data. Semi structured interviews of land managers as conducted in other studies could help explore the contribution of personal motivations behind assessments of risk [28,66,68,69] and is a topic for further research.
We assumed exploring risk perception data from the RRA in WFDSS was worthwhile because these data capture a snapshot of wildfire decision making in real-time that is difficult to gain from decision makers who are busy managing a wildfire. There is debate regarding the true impact to decision making when using decision support systems like WFDSS; some advocating for its usefulness [64] and others suggesting barriers to its adoption [72,73]. Some studies have used U.S. wildfire institutional data sets to explore patterns and suggest improvements to fire-fighting resource allocation [64,74,75,76]. Prior to this investigation, the information content of the WFDSS RRA data set and its suitability for studying risk systematically was unknown. Thus, an exploratory approach was taken to better understand the geography of wildfire risk perceptions [27], and then to identify codes to predict this risk.
5.2. Further Research
Data collected on wildfires in numerous mandated systems, forms, and databases collectively tell a story about the decisions surrounding one of the most influential moments on a landscape—a wildfire. Researchers should endeavor to tell these stories to land managers and administrators through exploration and analysis of these data. If managed strategically, wildfires can leave communities and the surrounding environment in a more resilient state than without that disturbance. Analyzing wildfire data ex post facto to identify decisions that lessened fire-fighter exposure, costs, and increased landscape resiliency, is a component to convincing land managers and the public that wildland fire is an opportunity to gain benefit for landscape resiliency.
Author Contributions
Conceptualization, E.N.-W. and C.S.; methodology, E.N.-W. and C.S.; formal analysis, E.N.-W.; investigation, E.N.-W. and C.S.; data curation, E.N.-W.; writing—original draft preparation, E.N.-W. and C.S.; writing—review and editing, E.N.-W. and C.S.; visualization, E.N.-W. and C.S.; funding acquisition, E.N.-W. and C.S. All authors have read and agreed to the published version of the manuscript.
Funding
This research was funded by the Wildland Fire Management Research Development and Application Group, Rocky Mountain Research Station, USDA Forest Service and the National Center for Landscape Fire Analysis (Fire Center), W.A. Franke College of Forestry, University of Montana.
Data Availability Statement
Data produced in this study are available from the corresponding authors upon reasonable request.
Acknowledgments
Laurie Yung, Anne Black, and Vita Wright provided critical assistance to develop social science methods. Valentijn Hoff and Chris Moran (University of Montana, Fire Center) provided assistance with check coding. Chris Moran, Vita Wright and Anne Black provided internal reviews and thoughtful suggestions to this manuscript. Three anonymous reviewers provided thoughtful revisions. Finally, we thank Tom Zimmerman who implemented the initial relative risk assessment and provided background on the development of efforts to address risk in support of the decisions to manage wildfires for resource objectives.
Conflicts of Interest
The authors declare no conflict of interest. The funders had no role in the design of the study; in the collection, analyses, or interpretation of data; in the writing of the manuscript; or in the decision to publish the results.
Appendix A
Hazard and Probability Coding Schema
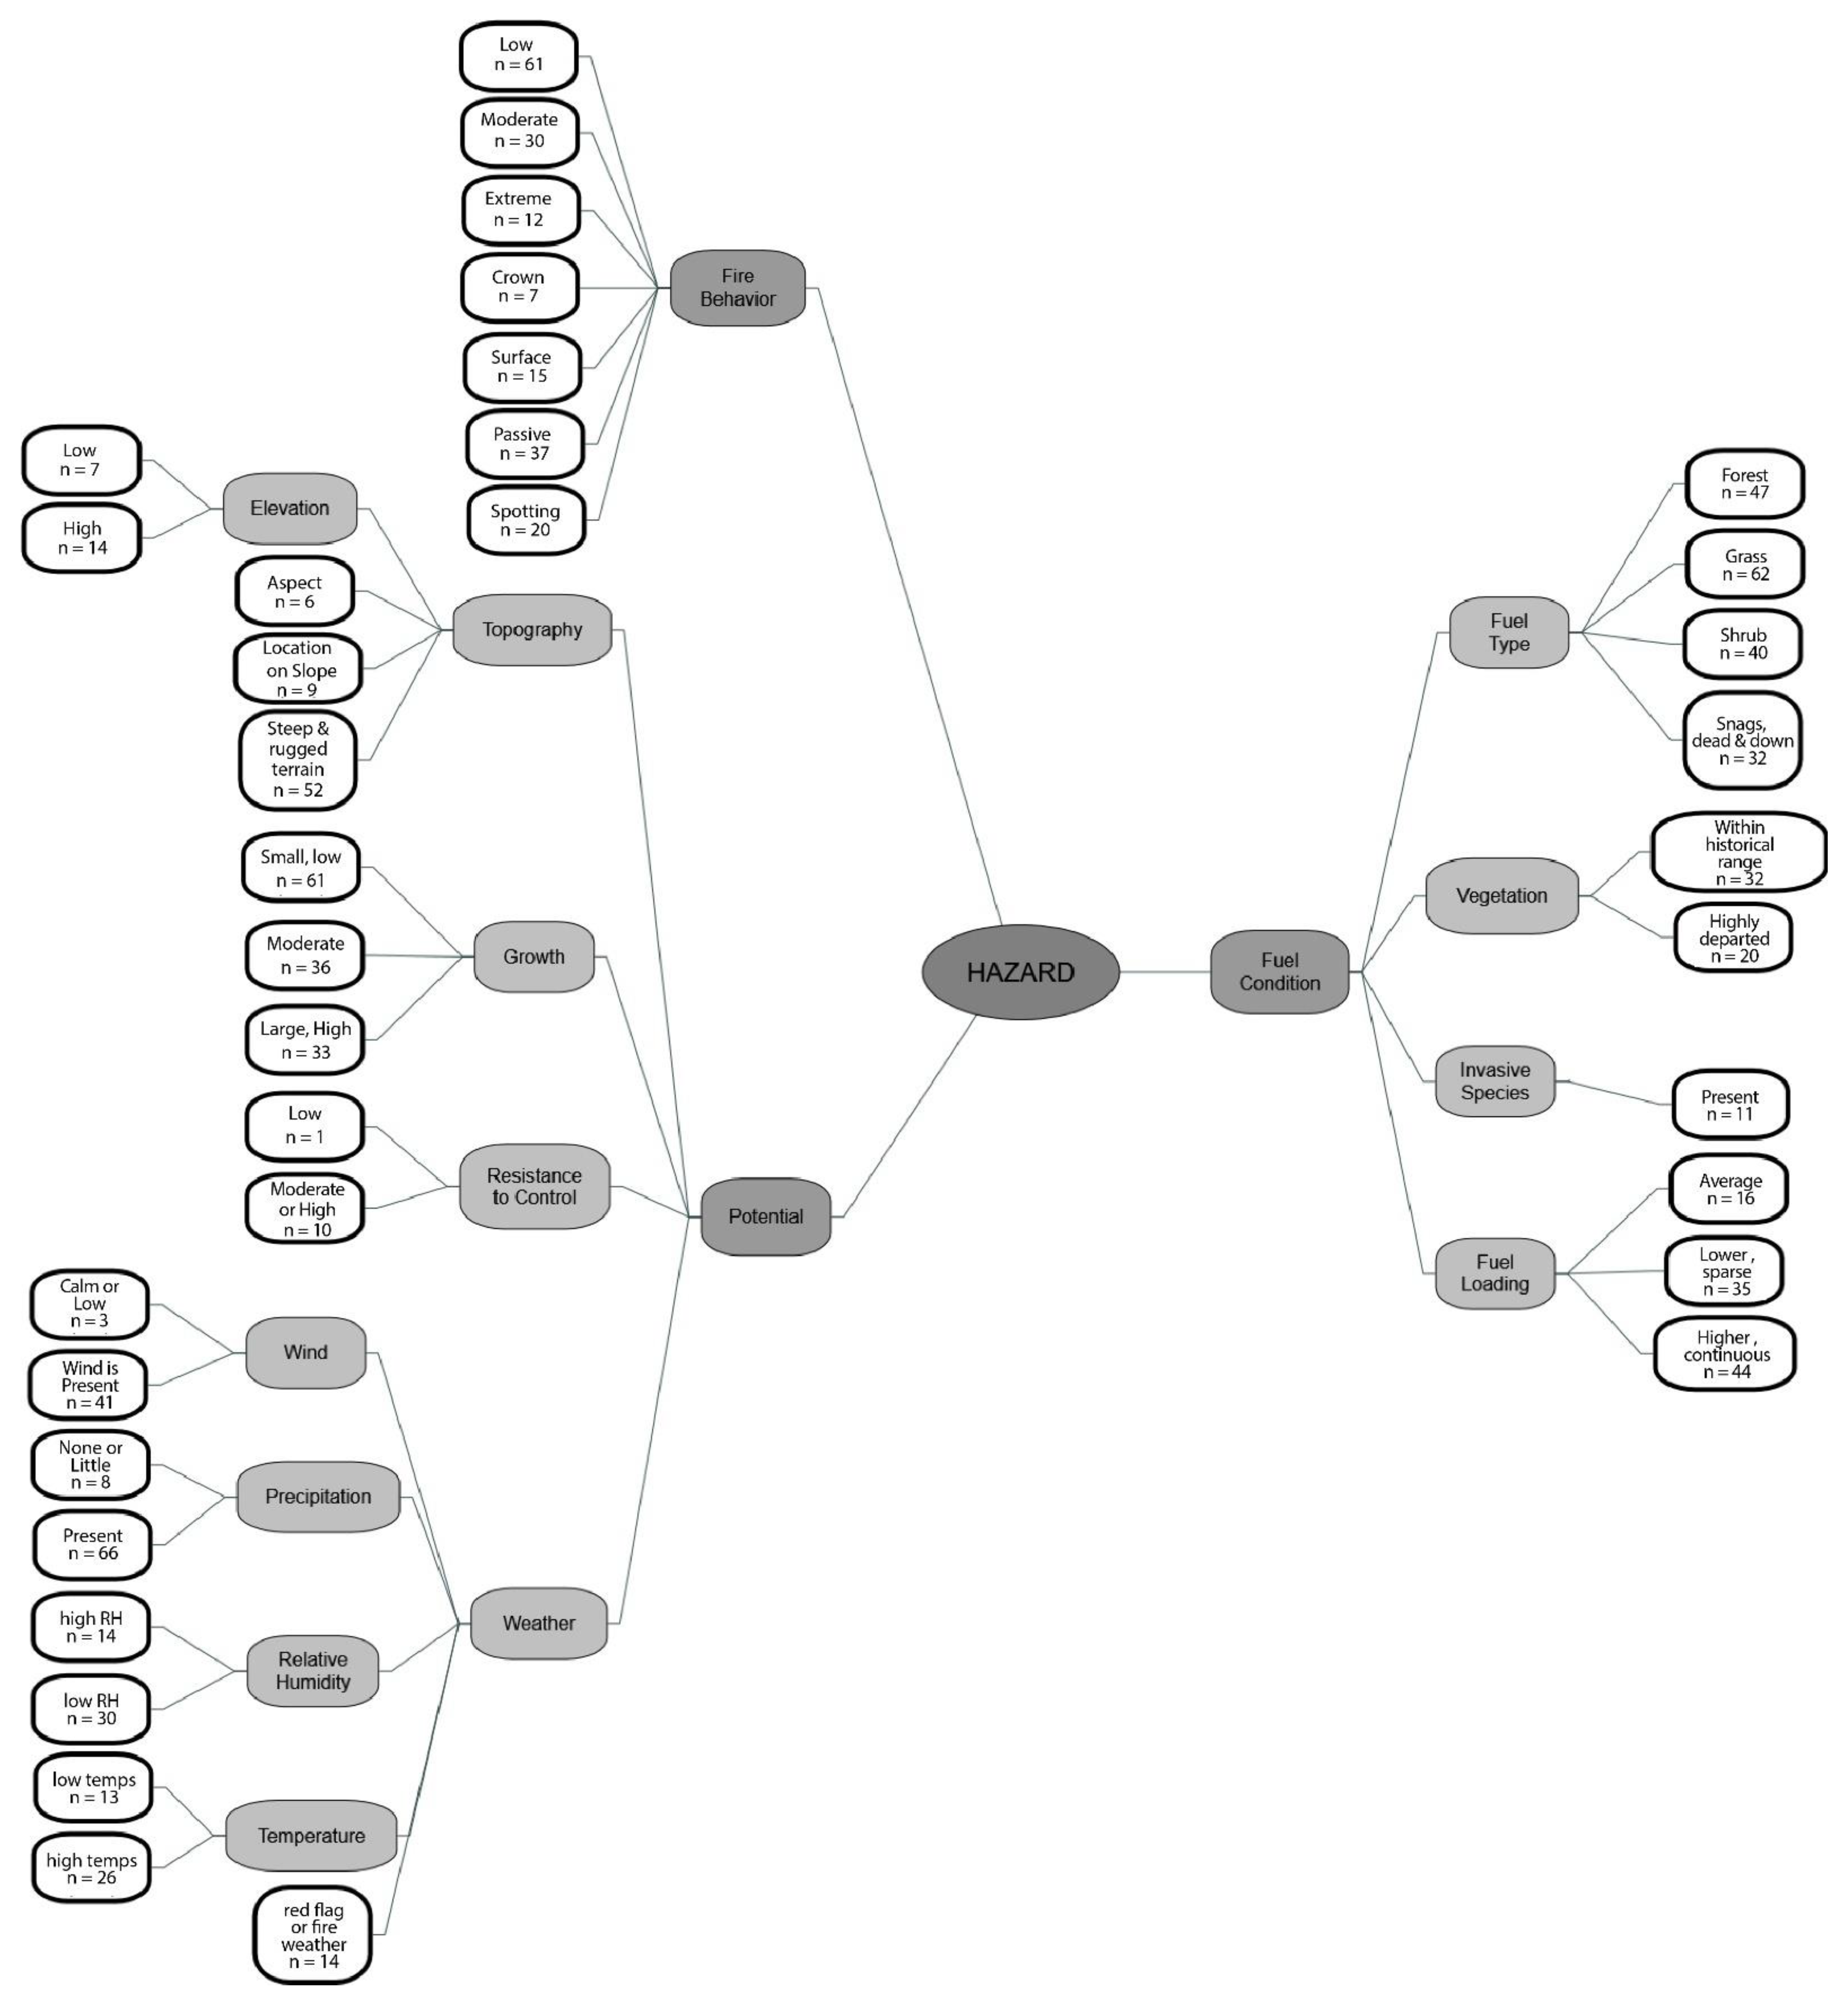
Coding structures of the Hazard and Probability elements of the relative risk assessment. The total number of times codes were counted (n) are shown in white shapes. Gray shapes denote sub-themes to summarize codes. There are a total of 282 wildfires from the relative risk assessment dataset that were coded simultaneously to produce 83 codes.
Figure A1.
The Hazard Element is summarized by themes (Potential, Fuel Condition and Fire Behavior). The themes are further described by second and third-order sub-themes (light grey shapes), used to summarize types of codes, with the total number of wildfires associated with a specific code, denoted with white shapes.

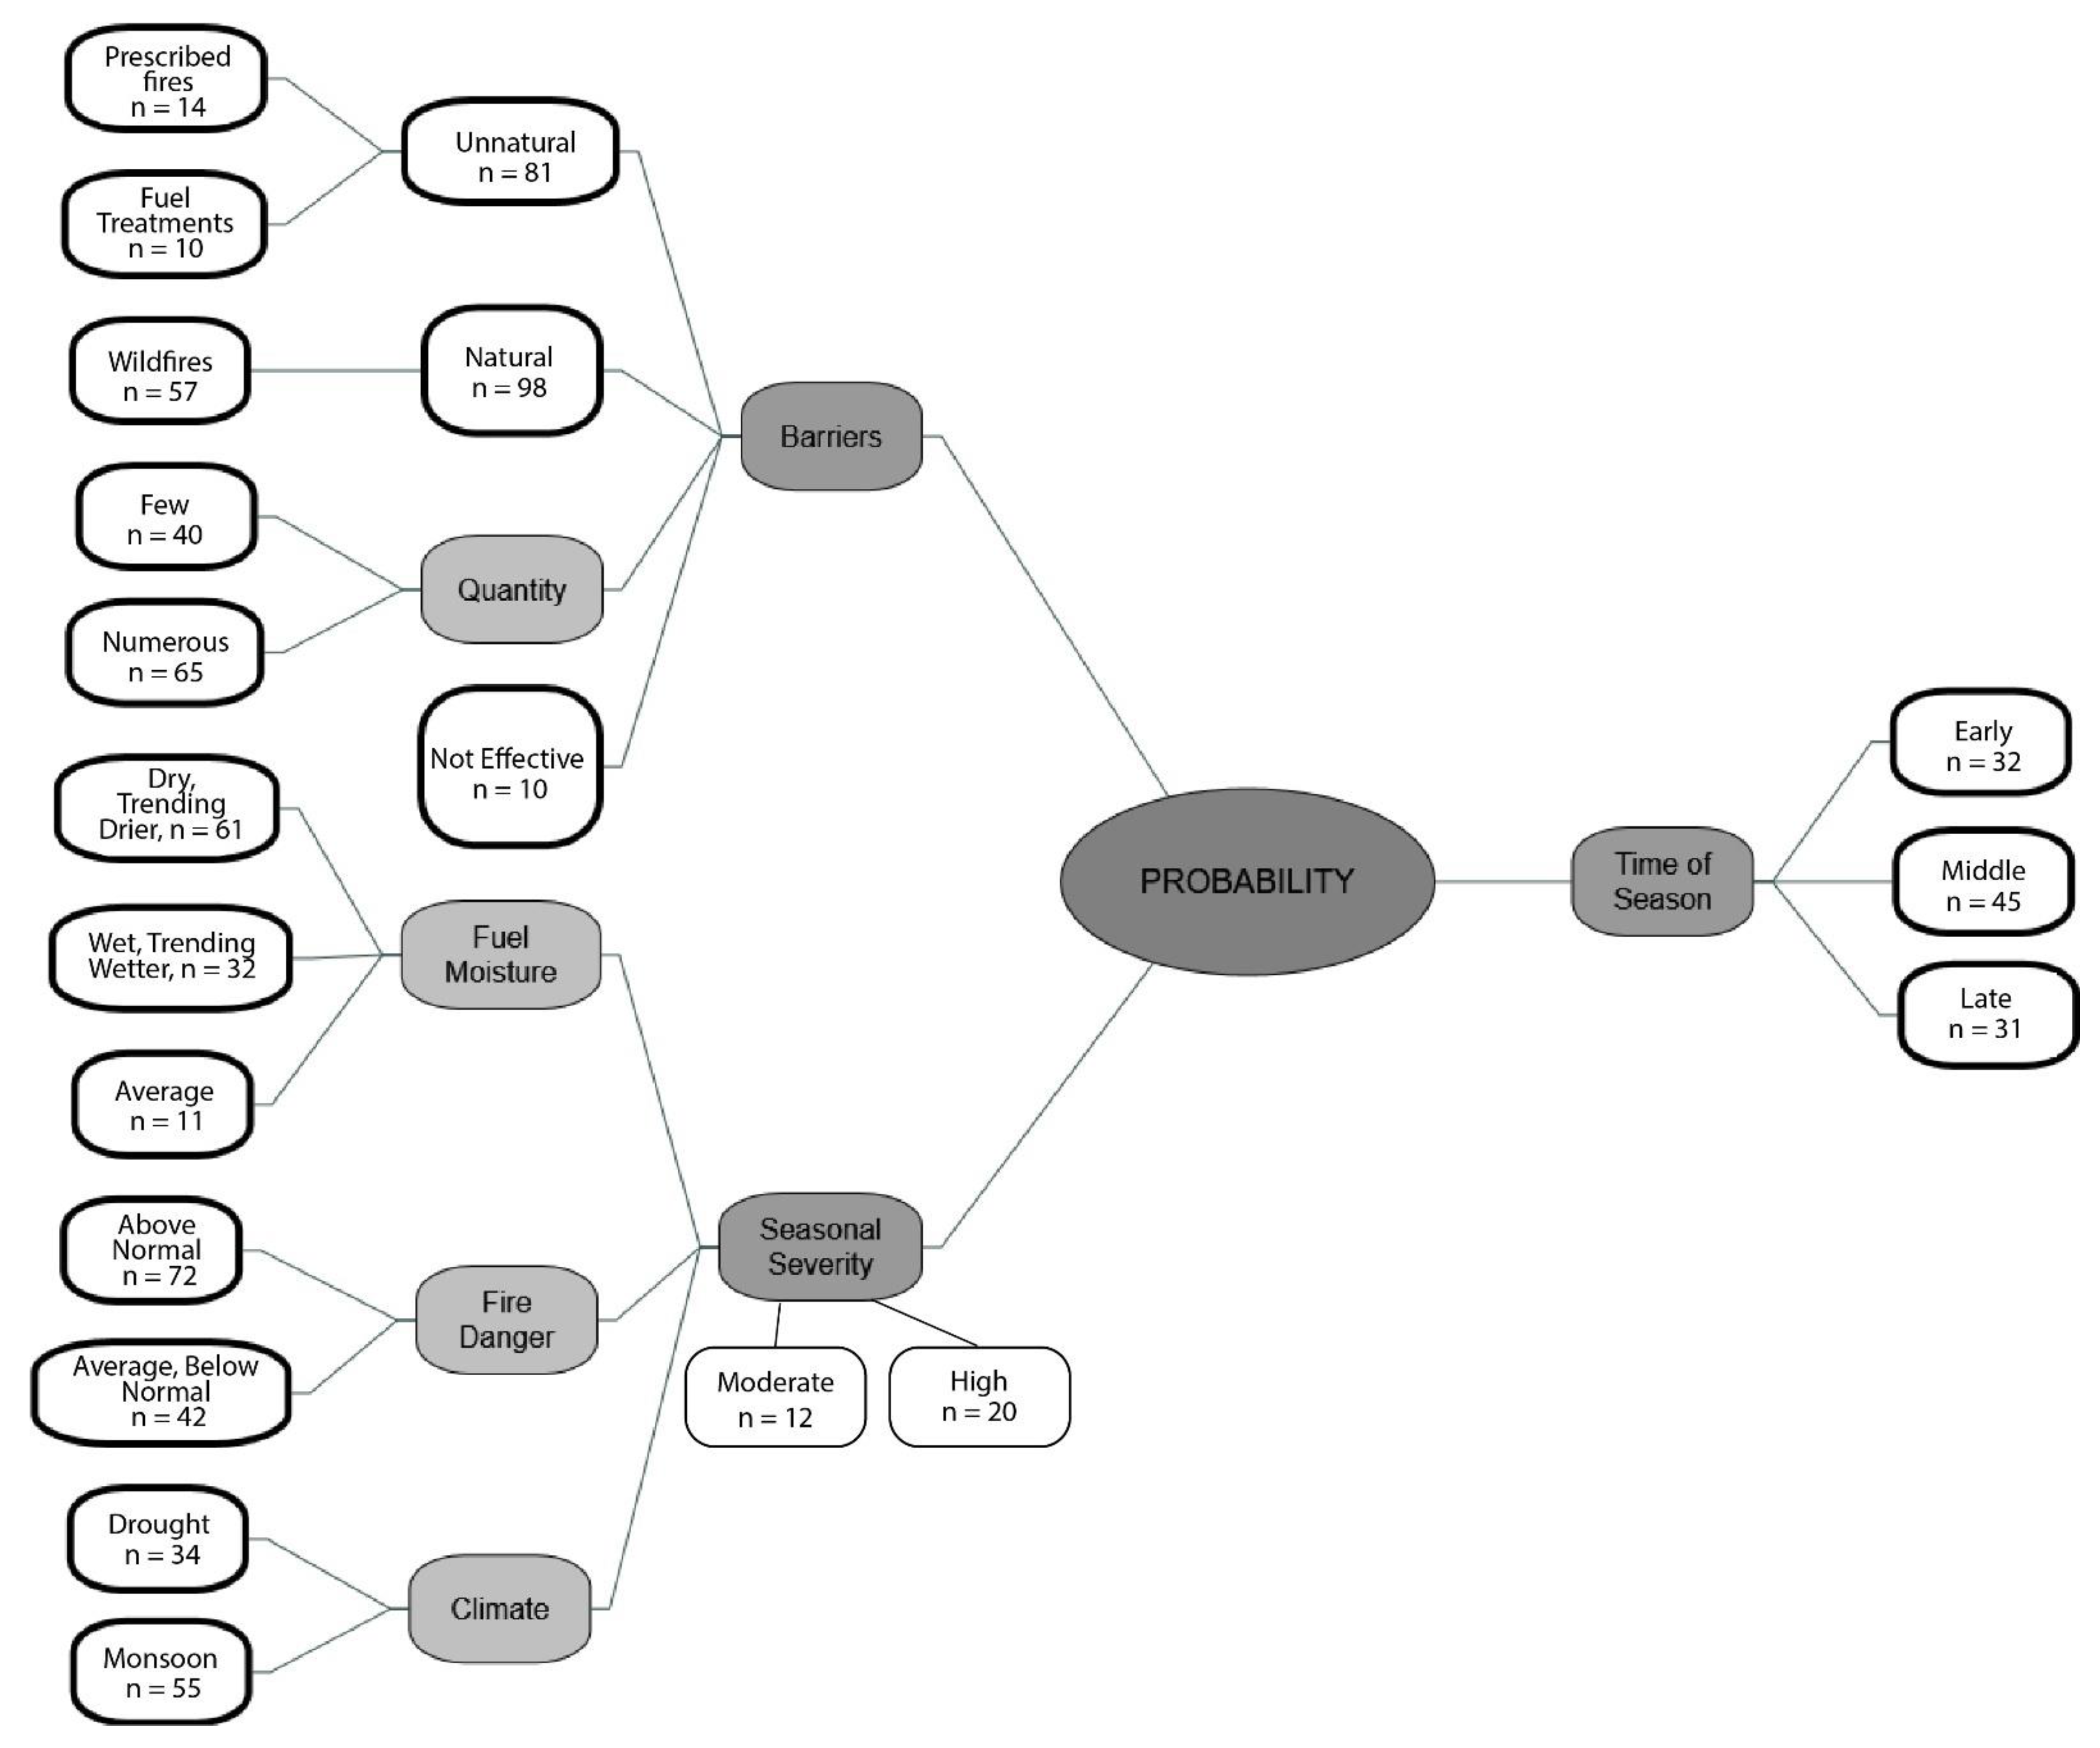
Figure A2.
The Probability Element is summarized by themes (Time of Season, Seasonal Severity and Barriers). The themes are further described by second and third-order sub-themes (light grey shapes), used to summarize types of codes, with the total number of wildfires associated with a specific code, denoted with white shapes.

Appendix B
Uncommon Codes

Table A1.
Codes that occurred with low frequency, are not significant (chi-square > 0.05) and are not ranked in either the Random Forest or CART analysis.
Table A1.
Codes that occurred with low frequency, are not significant (chi-square > 0.05) and are not ranked in either the Random Forest or CART analysis.
| Element | Theme | Code | Northwest | Southwest | ||||||||||||
|---|---|---|---|---|---|---|---|---|---|---|---|---|---|---|---|---|
| Frequency (%) | Chi-sq. | RF MIR, Rank | CART, Var. Imp., Rank | Frequency (%) | Chi-sq. | RF MIR, Rank | CART, Var. Imp., Rank | |||||||||
| H | M | L | T | p-Value | H | M | L | T | p-Value | |||||||
| Hazard | fire behavior | crown | 3% | 0% | 0% | 3% | 0.223 | NA | NA | 1% | 1% | 0% | 2% | 0.177 | NA | NA |
| Hazard | fuel condition | invasive species | 2% | 0% | 0% | 2% | 0.478 | NA | NA | 2% | 3% | 1% | 6% | 0.238 | NA | NA |
| Hazard | potential | low elevation | 2% | 0% | 0% | 2% | 0.478 | NA | NA | 1% | 3% | 0% | 3% | 0.114 | NA | NA |
| Hazard | potential | precipitation absent | 1% | 0% | 1% | 2% | 0.384 | NA | NA | 1% | 3% | 0% | 4% | 0.143 | NA | NA |
| Hazard | potential | high resistance | 3% | 0% | 0% | 3% | 0.223 | NA | NA | 1% | 2% | 1% | 4% | 0.557 | NA | NA |
| Hazard | potential | low resistance | 0% | 0% | 0% | 0% | N/A | NA | NA | 0% | 1% | 0% | 1% | 0.444 | NA | NA |
| Hazard | potential | high relative humidity | 1% | 0% | 1% | 2% | 0.384 | NA | NA | 0% | 4% | 4% | 8% | 0.125 | NA | NA |
| Hazard | potential | low temperature | 2% | 0% | 2% | 4% | 0.216 | NA | NA | 0% | 2% | 3% | 5% | 0.179 | NA | NA |
| Hazard | potential | aspect | 2% | 1% | 1% | 3% | 0.894 | NA | NA | 0% | 0% | 1% | 1% | 0.186 | NA | NA |
| Hazard | potential | slope | 2% | 2% | 2% | 5% | 0.392 | NA | NA | 1% | 0% | 1% | 2% | 0.176 | NA | NA |
| Hazard | potential | calm winds | 0% | 1% | 0% | 1% | 0.231 | NA | NA | 1% | 1% | 0% | 1% | 0.498 | NA | NA |
| Probability | barriers | ineffective | 4% | 0% | 0% | 4% | 0.151 | NA | NA | 1% | 2% | 0% | 3% | 0.210 | NA | NA |
| Probability | barriers | fuel treatment | 2% | 2% | 0% | 4% | 0.169 | NA | NA | 0% | 1% | 3% | 3% | 0.124 | NA | NA |
| Probability | seasonal severity | average fuel moisture | 1% | 1% | 2% | 3% | 0.168 | NA | NA | 2% | 1% | 2% | 5% | 0.330 | NA | NA |
| Probability | seasonal severity | moderate | 0% | 0% | 1% | 1% | 0.079 | NA | NA | 1% | 4% | 3% | 7% | 0.378 | NA | NA |
| Values | cultural resources | absent | 1% | 1% | 2% | 3% | 0.168 | NA | NA | 1% | 2% | 3% | 7% | 0.702 | NA | NA |
| Values | economic concerns | mining, outfitters, agriculture | 5% | 1% | 1% | 7% | 0.445 | NA | NA | 2% | 3% | 1% | 6% | 0.597 | NA | NA |
| Values | infrastructure | few or no houses | 2% | 3% | 1% | 5% | 0.135 | NA | NA | 1% | 1% | 3% | 6% | 0.477 | NA | NA |
| Values | infrastructure | highway | 7% | 2% | 1% | 9% | 0.447 | NA | NA | 2% | 1% | 1% | 4% | 0.284 | NA | NA |
| Values | natural resources | flora (whitebark pine, ecosystems) | 5% | 2% | 3% | 9% | 0.247 | NA | NA | 1% | 1% | 1% | 3% | 0.836 | NA | NA |
| Values | natural resources | general natural resources | 2% | 1% | 0% | 3% | 0.640 | NA | NA | 1% | 1% | 3% | 4% | 0.314 | NA | NA |
| Values | social concerns | negative perceptions of fire | 1% | 2% | 1% | 3% | 0.384 | NA | NA | 3% | 3% | 2% | 7% | 0.583 | NA | NA |
| Values | social concerns | positive perceptions of fire | 0% | 0% | 0% | 0% | N/A | NA | NA | 0% | 3% | 5% | 7% | 0.081 | NA | NA |
Appendix C
CART Results
Figure A3.
Northwest CART model classifying high, moderate and low relative risk.

Figure A4.
Southwest CART model classifying high, moderate and low relative risk.

References
- Calkin, D.E.; Ager, A.A.; Gilbertson-Day, J. (Eds.) Wildfire Risk and Hazard: Procedures for the First Approximation; Gen. Tech. Rep. RMRS-GTR-235; U.S. Department of Agriculture, Forest Service, Rocky Mountain Research Station: Fort Collins, CO, USA, 2010; 62p. [Google Scholar]
- Scott, J.H.; Thompson, M.P.; Calkin, D.E. A Wildfire Risk Assessment Framework for Land and Resource Management; Gen. Tech. Rep. RMRS-GTR-315; U.S. Department of Agriculture, Forest Service, Rocky Mountain Research Station: Fort Collins, CO, USA, 2013; 83p. [Google Scholar]
- NWCG. NWCG#042-2010: Wildfire Fire Risk and Complexity Assessment; National Wildfire Coordinating Group: Boise, ID, USA, 2010. [Google Scholar]
- Zimmerman, G.T. Fire Science Application and Integration in Support of Decision Making. In Proceedings of the 5th International Wildland Fire Conference, Sun City, South Africa, 9–13 May 2011. [Google Scholar]
- Noonan-Wright, E.K.; Opperman, T.S.; Finney, M.A.; Zimmerman, G.T.; Seli, R.C.; Elenz, L.M.; Calkin, D.E.; Fiedler, J.R. Developing the US Wildland Fire Decision Support System. J. Combust. 2011, 2011, 168473. [Google Scholar] [CrossRef]
- NWCG. Adoption and Release of the Risk and Complexity Assessment; National Wildfire Coordinating Group: Boise, ID, USA, 2013; 2p. [Google Scholar]
- NWCG. Risk and Complexity Analysis, PMS-236. Available online: https://www.nwcg.gov/sites/default/files/publications/pms236.pdf (accessed on 7 July 2022).
- Thompson, M.P.; Zimmerman, T.G.; Mindar, D.; Taber, M. Risk Terminology Primer: Basic Principles and a Glossary for the Wildland Fire Management Community; RMRS-GTR-349; U.S. Department of Agriculture, Forest Service, Rocky Mountain Research Station: Fort Collins, CO, USA, 2016; 13p. [Google Scholar]
- Taber, M.A.; Elenz, L.M.; Langowski, P.G. Decision Making for Wildfires: A Guide for Applying a Risk Management Process at the Incident Level; Gen. Tech. Rep. RMRS-GTR-298WWW; U.S. Department of Agriculture, Forest Service, Rocky Mountain Research Station: Fort Collins, CO, 2013; 59p. [Google Scholar]
- USDA/USDI. Guidance for the Implementation of Federal Wildland Fire Management Policy; U.S. Department of Agriculture, U.S. Department of Interior; Fire Executive Council, Ed.: Boise, ID, USA, 2009; p. 20. [Google Scholar]
- Parks, S.A.; Miller, C.; Parisien, M.A.; Holsinger, L.M.; Dobrowski, S.Z.; Abatzoglou, J. Wildland fire deficit and surplus in the western United States, 1984–2012. Ecosphere 2015, 6, 1–13. [Google Scholar] [CrossRef]
- Vaillant, N.M.; Reinhardt, E.D. An Evaluation of the Forest Service Hazardous Fuels Treatment Program—Are We Treating Enough to Promote Resiliency or Reduce Hazard? J. For. 2017, 115, 300–308. [Google Scholar] [CrossRef]
- North, M.P.; Collins, B.M.; Stephens, S.L.; Agee, J.K.; Aplet, G.; Franklin, J.F.; Fulé, P.Z. Reform forest fire management. Science 2015, 349, 1280–1281. [Google Scholar] [CrossRef]
- Coop, J.D.; Parks, S.A.; Stevens-Rumann, C.S.; Ritter, S.M.; Hoffman, C.M. Extreme fire spread events and area burned under recent and future climate in the western USA. Glob. Ecol. Biogeogr. 2022. Online Version of Record. [Google Scholar] [CrossRef]
- Prichard, S.J.; Hessburg, P.F.; Hagmann, R.K.; Povak, N.A.; Dobrowski, S.Z.; Hurteau, M.D.; Kane, V.R.; Keane, R.E.; Kobziar, L.N.; Kolden, C.A.; et al. Adapting western North American forests to climate change and wildfires: 10 common questions. Ecol. Appl. 2021, 31, e02433. [Google Scholar] [CrossRef]
- Davis, K.T.; Dobrowski, S.Z.; Higuera, P.E.; Holden, Z.A.; Veblen, T.T.; Rother, M.T.; Parks, S.A.; Sala, A.; Maneta, M.P. Wildfires and climate change push low-elevation forests across a critical climate threshold for tree regeneration. Proc. Natl. Acad. Sci. USA 2019, 116, 6193–6198. [Google Scholar] [CrossRef]
- Schultz, C.A.; Thompson, M.P.; McCaffrey, S.M. Forest Service fire management and the elusiveness of change. Fire Ecol. 2019, 15, 13. [Google Scholar] [CrossRef]
- Thompson, M.P.; MacGregor, D.G.; Dunn, C.J.; Calkin, D.E.; Phipps, J. Rethinking the Wildland Fire Management System. J. For. 2018, 116, 382–390. [Google Scholar] [CrossRef]
- Calkin, D.E.; Thompson, M.P.; Finney, M.A. Negative consequences of positive feedbacks in US wildfire management. For. Ecosyst. 2015, 2, 2–10. [Google Scholar] [CrossRef] [Green Version]
- Yoe, C. Primer on Risk Analysis: Decision Making under Uncertainty; CRC Press: Boca Raton, FL, USA, 2011. [Google Scholar]
- Tversky, A.; Kahneman, D. Availability: A heuristic for judging frequency and probability. Cogn. Psychol. 1973, 5, 207–232. [Google Scholar] [CrossRef]
- Kahneman, D.; Klein, G. Conditions for intuitive expertise: A failure to disagree. Am. Psychol. 2009, 64, 515–526. [Google Scholar] [CrossRef]
- Alhakamil, A.S.; Slovic, P. A Psychological Study of the Inverse Relationship Between Perceived Risk and Perceived Benefit. Risk Anal. 1994, 14, 1085–1096. [Google Scholar] [CrossRef]
- Johnson-Laird, P.N. Mental models and human reasoning. Proc. Natl. Acad. Sci. USA 2010, 107, 18243–18250. [Google Scholar] [CrossRef]
- Sjöberg, L. Factors in Risk Perception. Risk Anal. 2000, 20, 1–12. [Google Scholar] [CrossRef]
- USDI/USDA. Wildland Fire Use: Implementation Procedures Reference Guide; National Interagency Fire Center, Ed.: Boise, ID, USA, 2005. [Google Scholar]
- Noonan-Wright, E.K.; Seielstad, C.A. Patterns of wildfire risk in the United States from systematic operational risk assessments: How risk is characterised by land managers. Int. J. Wildland Fire 2021, 30, 569–584. [Google Scholar] [CrossRef]
- Rapp, C.; Rabung, E.; Wilson, R.; Toman, E. Wildfire decision support tools: An exploratory study of use in the United States. Int. J. Wildland Fire 2020, 29, 581. [Google Scholar] [CrossRef]
- Creswell, J.W.; Plano Clark, V.L. Designing and Conducting Mixed Methods Research; Sage Publications: Thousand Oaks, CA, USA, 2007. [Google Scholar]
- Ivankova, N.V.; Creswell, J.W.; Stick, S.L. Using Mixed-Methods Sequential Explanatory Design: From Theory to Practice. Field Methods 2016, 18, 3–20. [Google Scholar] [CrossRef]
- Creswell, J.W.; Clark, V.L.P.; Gutmann, M.; Hanson, W. Advanced Mixed Methods Research Designs; Sage Publications: Thousand Oaks, CA, USA, 2003; pp. 209–240. [Google Scholar]
- Short, K.C. Spatial Wildfire Occurrence Data for the United States, 1992–2015 [FPA_FOD_20170508], 4th ed.; Forest Service Research Data Archive: Fort Collins, CO, USA, 2017. [Google Scholar] [CrossRef]
- Saldana, J. The Coding Manual for Qualitative Researchers; SAGE Publications: Thousand Oaks, CA, USA, 2009. [Google Scholar]
- QSR. NVivo Qualitative Data Analysis Software, Version 11.4.1.1064; QSR International Pty Ltd.: Burlington, MA, USA, 2017. [Google Scholar]
- Evans, J.; Murphy, M. _rfUtilities_, R Package Version 2.1-3; 2018. Available online: https://cran.r-project.org/package=rfUtilities (accessed on 7 July 2022).
- Dillon, G.K.; Holden, Z.A.; Morgan, P.; Crimmins, M.A.; Heyerdahl, E.K.; Luce, C.H. Both topography and climate affected forest and woodland burn severity in two regions of the western US, 1984 to 2006. Ecosphere 2011, 2, 1–33. [Google Scholar] [CrossRef]
- R Core Team. R: A Language and Environment for Statistical Computing; R Foundation for Statistical Computing: Vienna, Austria, 2019. [Google Scholar]
- Liaw, A.; Werner, M. Classification and Regression by randomForest. R News 2002, 2, 18–22. [Google Scholar]
- Therneau, T.; Atkinson, B. Rpart: Recursive Partitioning and Regression Trees. R Package Version 4.1-15; 2019. Available online: https://cran.r-project.org/package=rpart (accessed on 7 July 2022).
- Wickham, H. ggplot2: Elegant Graphics for Data Analysis; Springer: New York, NY, USA, 2016. [Google Scholar]
- Sheppard, P.R.; Comrie, A.C.; Packin, G.D.; Angersbach, K.; Hughes, M.K. The climate of the US Southwest. Clim. Res. 2002, 21, 219–238. [Google Scholar] [CrossRef]
- O’Connor, C.; Calkin, D.; Thompson, M. An empirical machine learning method for predicting potential fire control locations for pre-fire planning and operational fire management. Int. J. Wildland Fire 2017, 26, 587–597. [Google Scholar] [CrossRef]
- O’Connor, C.D.; Calkin, D.E. Engaging the fire before it starts: A case study form the 2017 pinal fire (arizona). Wildfire 2019, 28.1, 14–18. [Google Scholar]
- Holden, Z.A.; Swanson, A.; Luce, C.H.; Jolly, W.M.; Maneta, M.; Oyler, J.W.; Warren, D.A.; Parsons, R.; Affleck, D. Decreasing fire season precipitation increased recent western US forest wildfire activity. Proc. Natl. Acad. Sci. USA 2018, 115, E8349–E8357. [Google Scholar] [CrossRef]
- Stavros, E.N.; Abatzoglou, J.T.; McKenzie, D.; Larkin, N.K. Regional projections of the likelihood of very large wildland fires under a changing climate in the contiguous Western United States. Clim. Chang. 2014, 126, 455–468. [Google Scholar] [CrossRef]
- Calkin, D.E.; Cohen, J.D.; Finney, M.A.; Thompson, M.P. How risk management can prevent future wildfire disasters in the wildland-urban interface. Proc. Natl. Acad. Sci. USA 2014, 111, 746–751. [Google Scholar] [CrossRef]
- Cohen, J.D. Preventing disaster: Home ignitability in the wildland-urban interface. J. For. 2000, 89, 15–21. [Google Scholar]
- Mockrin, M.H.; Helmers, D.; Martinuzzi, S.; Hawbaker, T.J.; Radeloff, V.C. Growth of the wildland-urban interface within and around U.S. National Forests and Grasslands, 1990–2010. Landsc. Urban Plan. 2022, 218, 104283. [Google Scholar] [CrossRef]
- Radeloff, V.C.; Helmers, D.P.; Kramer, H.A.; Mockrin, M.H.; Alexandre, P.M.; Bar-Massada, A.; Butsic, V.; Hawbaker, T.J.; Martinuzzi, S.; Syphard, A.D.; et al. Rapid growth of the US wildland-urban interface raises wildfire risk. Proc. Natl. Acad. Sci. USA 2018, 115, 3314–3319. [Google Scholar] [CrossRef]
- Haas, J.R.; Calkin, D.E.; Thompson, M.P. A national approach for integrating wildfire simulation modeling into Wildland Urban Interface risk assessments within the United States. Landsc. Urban Plan. 2013, 119, 44–53. [Google Scholar] [CrossRef]
- Downing, W.M.; Dunn, C.J.; Thompson, M.P.; Caggiano, M.D.; Short, K.C. Human ignitions on private lands drive USFS cross-boundary wildfire transmission and community impacts in the western US. Sci. Rep. 2022, 12, 2624. [Google Scholar] [CrossRef]
- Ager, A.A.; Palaiologou, P.; Evers, C.R.; Day, M.A.; Barros, A.M.G. Assessing Transboundary Wildfire Exposure in the Southwestern United States. Risk Anal. 2018, 38, 2105–2127. [Google Scholar] [CrossRef] [Green Version]
- Fischer, A.P.; Spies, T.A.; Steelman, T.A.; Moseley, C.; Johnson, B.R.; Bailey, J.D.; Ager, A.A.; Bourgeron, P.; Charnley, S.; Collins, B.M.; et al. Wildfire risk as a socioecological pathology. Front. Ecol. Environ. 2016, 14, 276–284. [Google Scholar] [CrossRef]
- Gilbertson-Day, J.; Scott, J.H.; Vogler, K.C.; Brough, A. Pacific Northwest Quantitative Wildfire Risk Assessment: Methods and Results; Pyrologix: Missoula, MT, USA, 2018. [Google Scholar]
- USDA/USDI. A National Cohesive Wildland Fire Management Strategy; U.S. Department of Agriculture, U.S. Department of Interior; Wildland Fire Leadership Council, Ed.: Washington, DC, USA, 2011. [Google Scholar]
- Pascale, S.; Carvalho, L.; Adams, D.; Castro, C.; Cavalcanti, I. Current and Future Variations of the Monsoons of the Americas in a Warming Climate. Curr. Clim. Chang. Rep. 2019, 5, 125–144. [Google Scholar] [CrossRef]
- Pascale, S.; Boos, W.R.; Bordoni, S.; Delworth, T.L.; Kapnick, S.B.; Murakami, H.; Vecchi, G.A.; Zhang, W. Weakening of the North American monsoon with global warming. Nat. Clim. Chang. 2017, 7, 806–812. [Google Scholar] [CrossRef]
- Hernandez, M.; Chen, L. Future Land Precipitation Changes Over the North American Monsoon Region Using CMIP5 and CMIP6 Simulations. J. Geophys. Res. Atmos. 2022, 127, e2021JD035911. [Google Scholar] [CrossRef]
- Williams, A.P.; Cook, B.I.; Smerdon, J.E. Rapid intensification of the emerging southwestern North American megadrought in 2020–2021. Nat. Clim. Chang. 2022, 12, 232–234. [Google Scholar] [CrossRef]
- Abatzoglou, J.T.; Williams, A.P.; Boschetti, L.; Zubkova, M.; Kolden, C.A. Global patterns of interannual climate-fire relationships. Glob. Chang. Biol. 2018, 24, 5164–5175. [Google Scholar] [CrossRef]
- Abatzoglou, J.T.; Kolden, C.A.; Williams, A.P.; Lutz, J.A.; Smith, A.M.S. Climatic influences on interannual variability in regional burn severity across western US forests. Int. J. Wildland Fire 2017, 26, 269–275. [Google Scholar] [CrossRef]
- Abatzoglou, J.T.; Williams, A.P. Impact of anthropogenic climate change on wildfire across western US forests. Proc. Natl. Acad. Sci. USA 2016, 113, 11770–11775. [Google Scholar] [CrossRef] [PubMed]
- Abatzoglou, J.T.; Rupp, D.E.; Mote, P.W. Seasonal Climate Variability and Change in the Pacific Northwest of the United States. J. Clim. 2014, 27, 2125–2142. [Google Scholar] [CrossRef]
- Young, J.D.; Evans, A.M.; Iniguez, J.M.; Thode, A.; Meyer, M.D.; Hedwall, S.J.; McCaffrey, S.; Shin, P.; Huang, C.-H. Effects of policy change on wildland fire management strategies: Evidence for a paradigm shift in the western US? Int. J. Wildland Fire 2020, 29, 857. [Google Scholar] [CrossRef]
- Rapp, C.E.; Wilson, R.S.; Toman, E.L.; Jolly, W.M. Assessing the role of short-term weather forecasts in fire manager tactical decision-making: A choice experiment. Fire Ecol. 2021, 17, 35. [Google Scholar] [CrossRef]
- Calkin, D.E.; Thompson, M.P.; Finney, M.A.; Hyde, K.D. A Real-Time Risk Assessment Tool Supporting Wildland Fire Decisionmaking. J. For. 2011, 109, 274–280. [Google Scholar]
- Wilson, R.S.; Winter, P.L.; Maguire, L.A.; Ascher, T. Managing wildfire events: Risk-based decision making among a group of federal fire managers. Risk Anal. 2011, 31, 805–818. [Google Scholar] [CrossRef]
- Black, A. The key decision log: Facilitating high reliability and organizational learning. Fire Manag. Today 2009, 69, 5–10. [Google Scholar]
- Williamson, M.A. Factors in United States Forest Service district rangers’ decision to manage a fire for resource benefit. Int. J. Wildland Fire 2007, 16, 755–762. [Google Scholar] [CrossRef]
- Hand, M.S.; Wibbenmeyer, M.J.; Calkin, D.E.; Thompson, M.P. Risk Preferences, Probability Weighting, and Strategy Tradeoffs in Wildfire Management. Risk Anal. 2015, 35, 1876–1891. [Google Scholar] [CrossRef]
- Fillmore, S.D.; McCaffrey, S.M.; Smith, A.M.S. A Mixed Methods Literature Review and Framework for Decision Factors That May Influence the Utilization of Managed Wildfire on Federal Lands, USA. Fire 2021, 4, 62. [Google Scholar] [CrossRef]
- Noble, P.; Paveglio, T.B. Exploring Adoption of the Wildland Fire Decision Support System: End User Perspectives. J. For. 2020, 118, 154–171. [Google Scholar] [CrossRef]
- Colavito, M. The Human Dimensions of Spatial, Pre-Wildfire Planning Decision Support Systems: A Review of Barriers, Facilitators, and Recommendations. Forests 2021, 12, 483. [Google Scholar] [CrossRef]
- Belval, E.J.; Stonesifer, C.S.; Calkin, D.E. Fire Suppression Resource Scarcity: Current Metrics and Future Performance Indicators. Forests 2020, 11, 217. [Google Scholar] [CrossRef]
- Stonesifer, C.S.; Calkin, D.E.; Thompson, M.P.; Belval, E.J. Is This Flight Necessary? The Aviation Use Summary (AUS): A Framework for Strategic, Risk-Informed Aviation Decision Support. Forests 2021, 12, 1078. [Google Scholar] [CrossRef]
- Wei, Y.; Thompson, M.P.; Belval, E.J.; Calkin, D.E.; Bayham, J. Understand Daily Fire Suppression Resource Ordering and Assignment Patterns by Unsupervised Learning. Mach. Learn. Knowl. Extr. 2020, 3, 14–33. [Google Scholar] [CrossRef]
Figure 1.
An example of the relative risk assessment in the U.S. Wildland Fire Decision Support System (WFDSS) and qualitative text (summarized into the prescence/absence of codes and themes) to support semi-empirical ratings for relative risk, values, hazards and probability.
Figure 1.
An example of the relative risk assessment in the U.S. Wildland Fire Decision Support System (WFDSS) and qualitative text (summarized into the prescence/absence of codes and themes) to support semi-empirical ratings for relative risk, values, hazards and probability.

Figure 2.
Relative risk rating for each of the sampled wildfires for the Northwest geographic area (n = 133) and the Southwest geographic area (n = 149) with the primary federal land management agencies in the background.
Figure 2.
Relative risk rating for each of the sampled wildfires for the Northwest geographic area (n = 133) and the Southwest geographic area (n = 149) with the primary federal land management agencies in the background.

Figure 3.
‘Values at risk’ coding structure that follows the framework of the Relative Risk Assessment. The tally of codes is summarized by themes (Infrastructure, Natural Resources, Cultural Concerns, Social Concerns, Economic Concerns and Proximity (and threat of the fire to values at risk). The themes are further described by second-order sub-themes (light grey shapes). White shapes represent the total number of times a specific code was mentioned on a wildfire (out of a total of 282 wildfires).
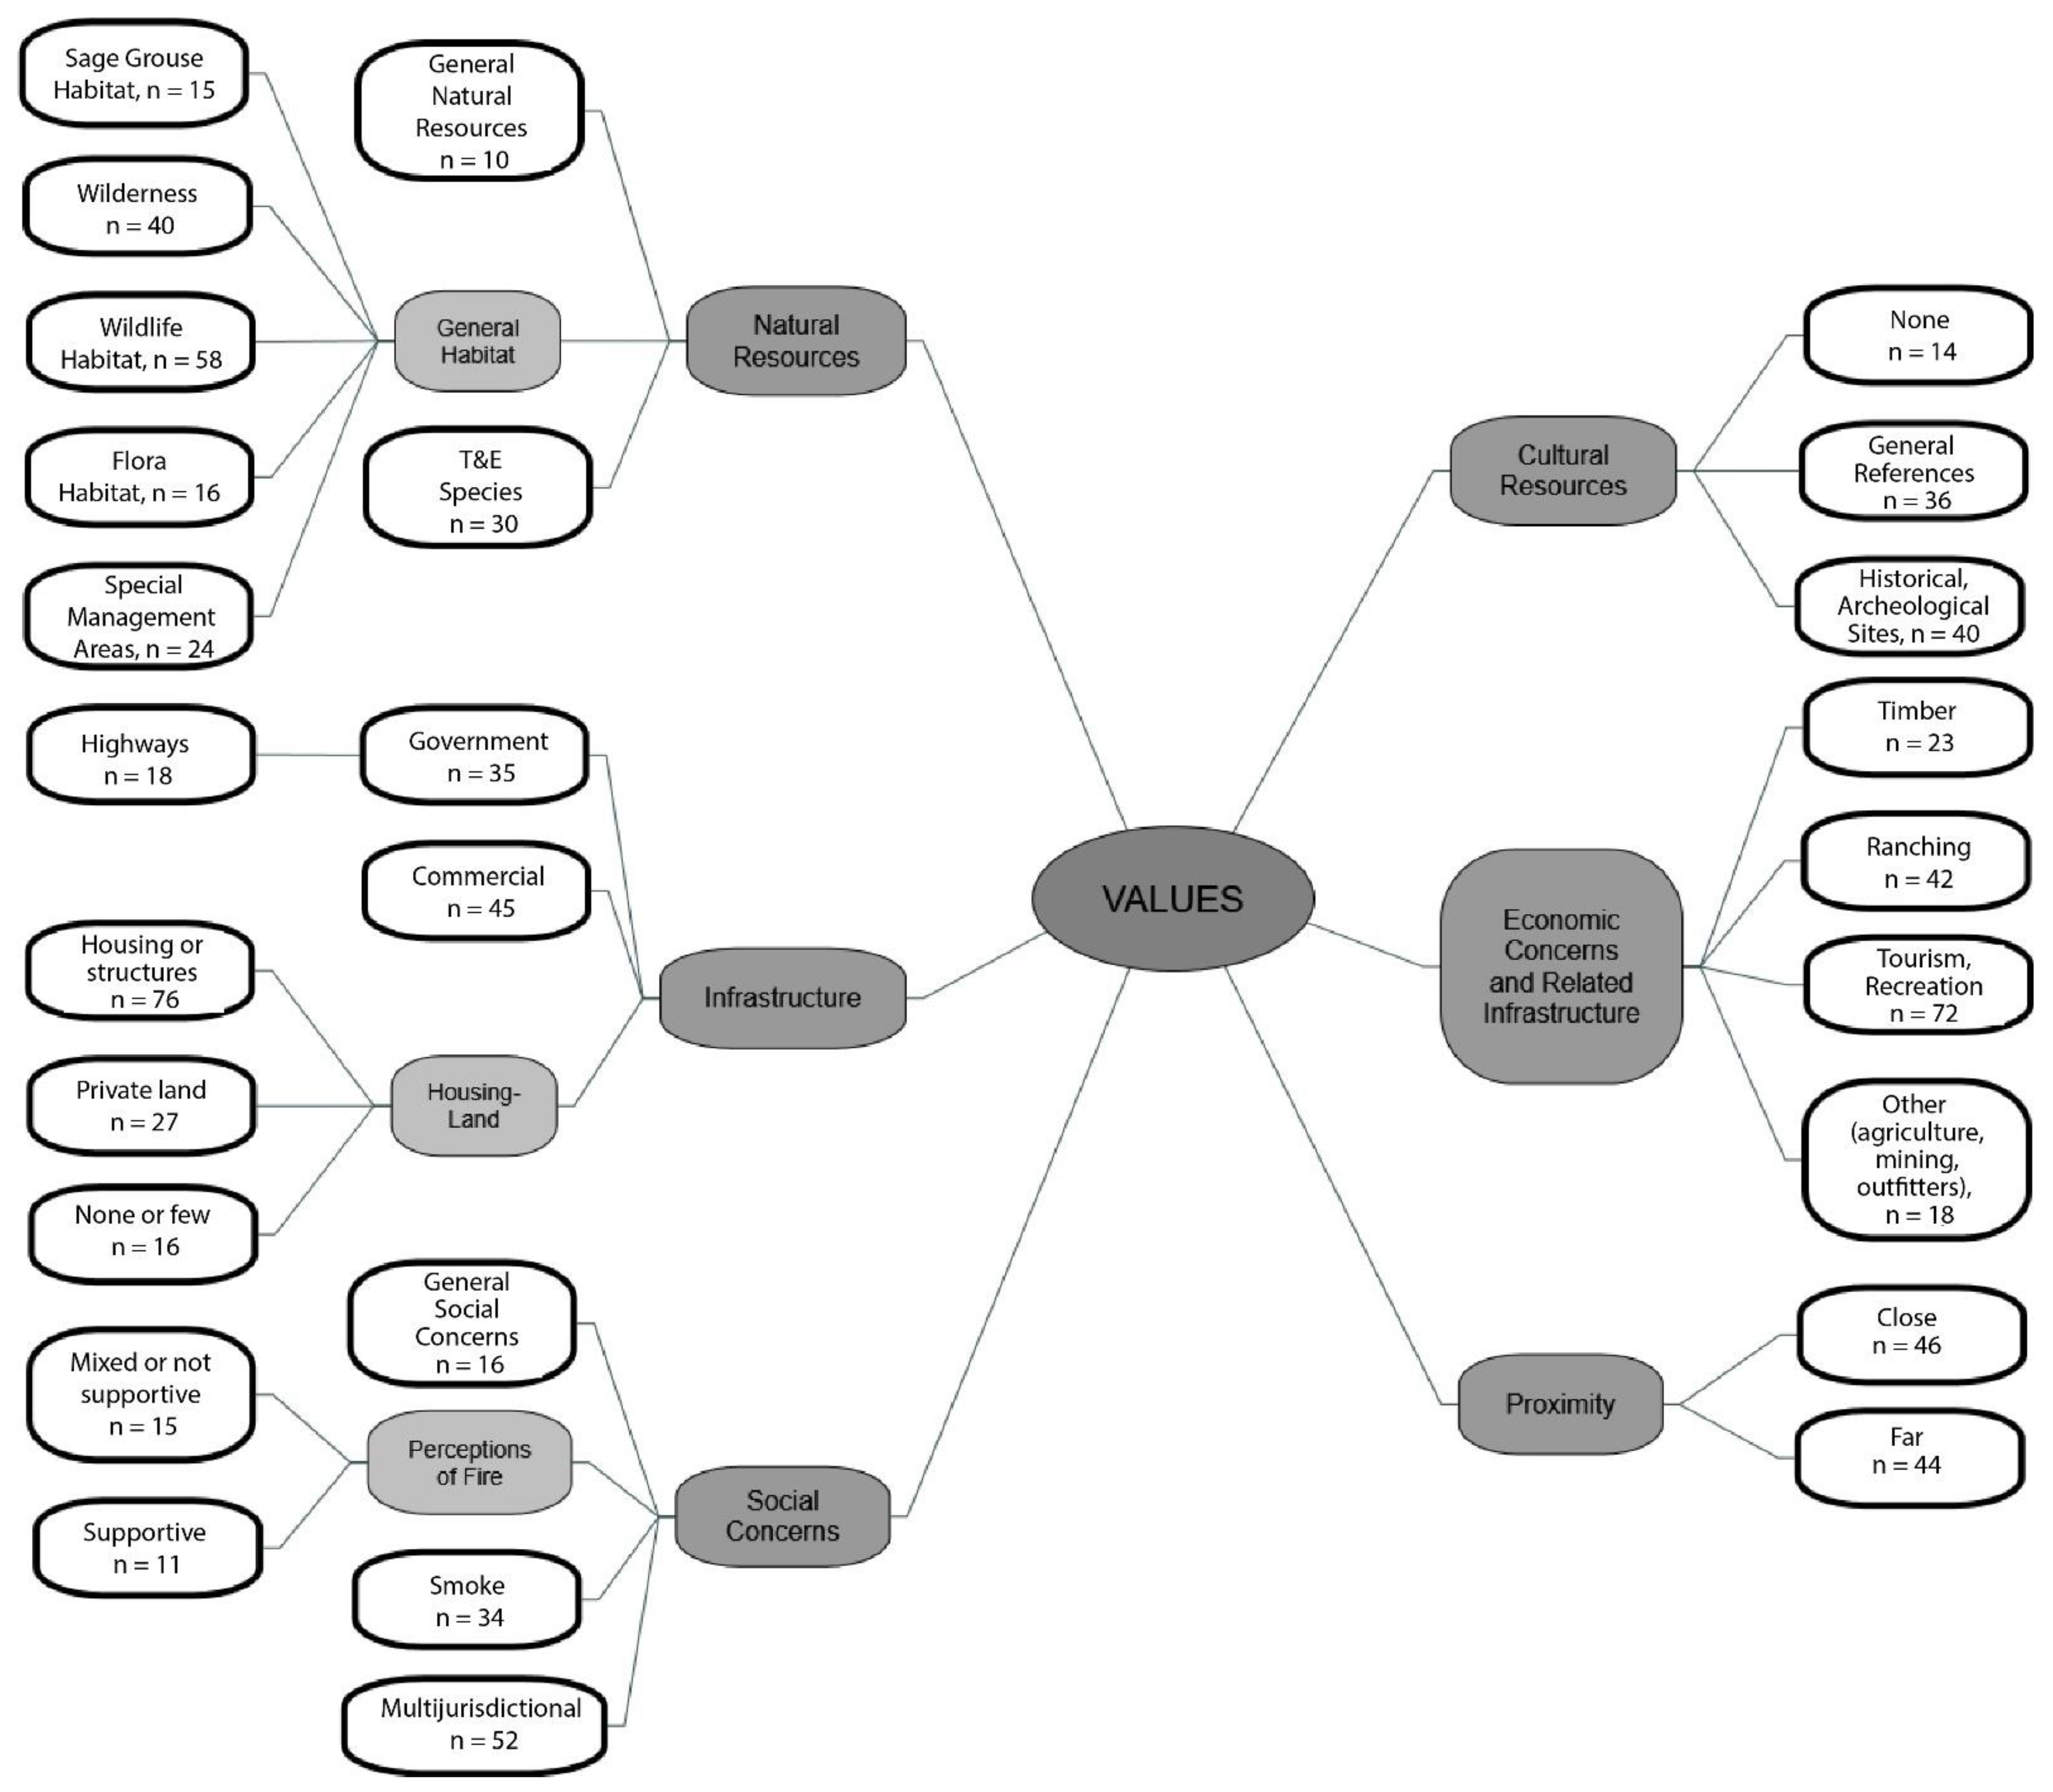
Figure 4.
Cumulative percent frequency of codes summarized with ‘Value’ themes by high, moderate and low relative risk ratings for the Northwest and Southwest Geographic Areas (GAs). The most common codes and their percent frequency are listed in the figure and available in Table 2 and Appendix B.
Figure 4.
Cumulative percent frequency of codes summarized with ‘Value’ themes by high, moderate and low relative risk ratings for the Northwest and Southwest Geographic Areas (GAs). The most common codes and their percent frequency are listed in the figure and available in Table 2 and Appendix B.

Figure 5.
Cumulative percent frequency of codes summarized with ‘Hazard’ themes by high, moderate and low relative risk ratings for the Northwest and Southwest Geographic Areas (GAs). The most common codes and their percent frequency are listed in the figure and available in Table 2 and Appendix B.
Figure 5.
Cumulative percent frequency of codes summarized with ‘Hazard’ themes by high, moderate and low relative risk ratings for the Northwest and Southwest Geographic Areas (GAs). The most common codes and their percent frequency are listed in the figure and available in Table 2 and Appendix B.
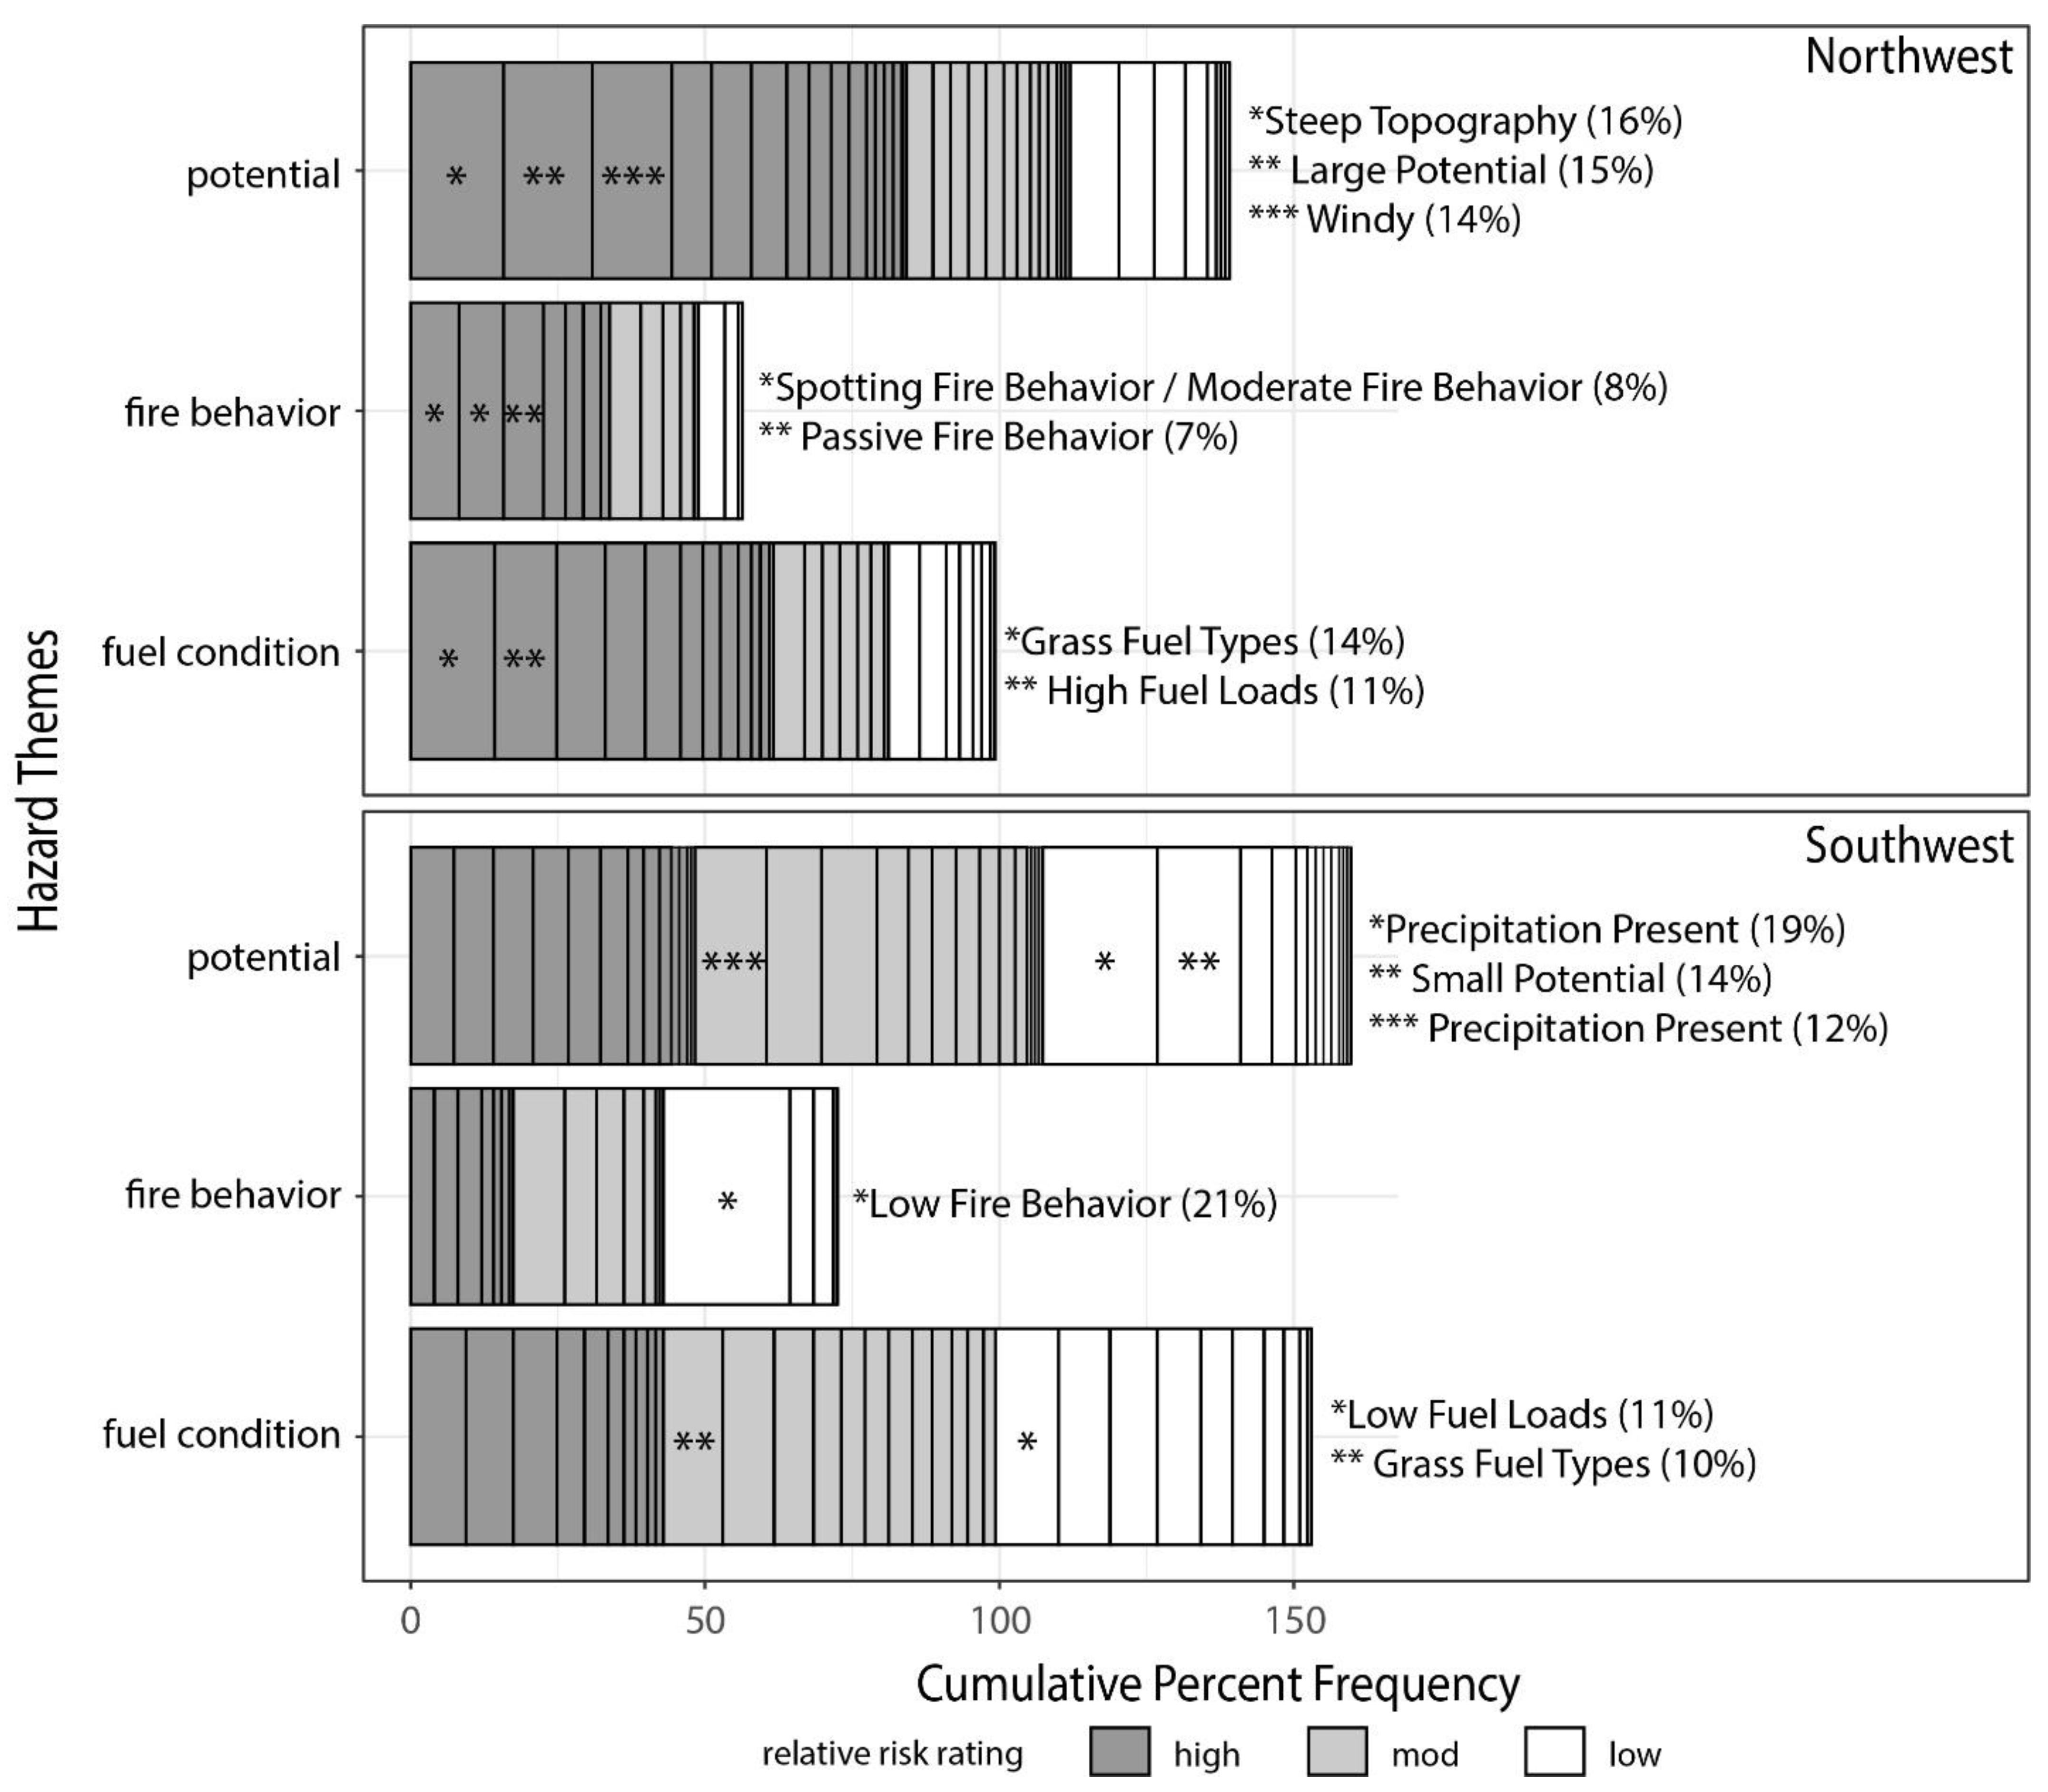
Figure 6.
The frequency of fire behavior codes by relative risk ratings for the Northwest and Southwest geographic areas.
Figure 6.
The frequency of fire behavior codes by relative risk ratings for the Northwest and Southwest geographic areas.

Figure 7.
Cumulative percent frequency of codes summarized with ‘Probability’ themes by high, moderate and low relative risk ratings for the Northwest and Southwest GAs.
Figure 7.
Cumulative percent frequency of codes summarized with ‘Probability’ themes by high, moderate and low relative risk ratings for the Northwest and Southwest GAs.
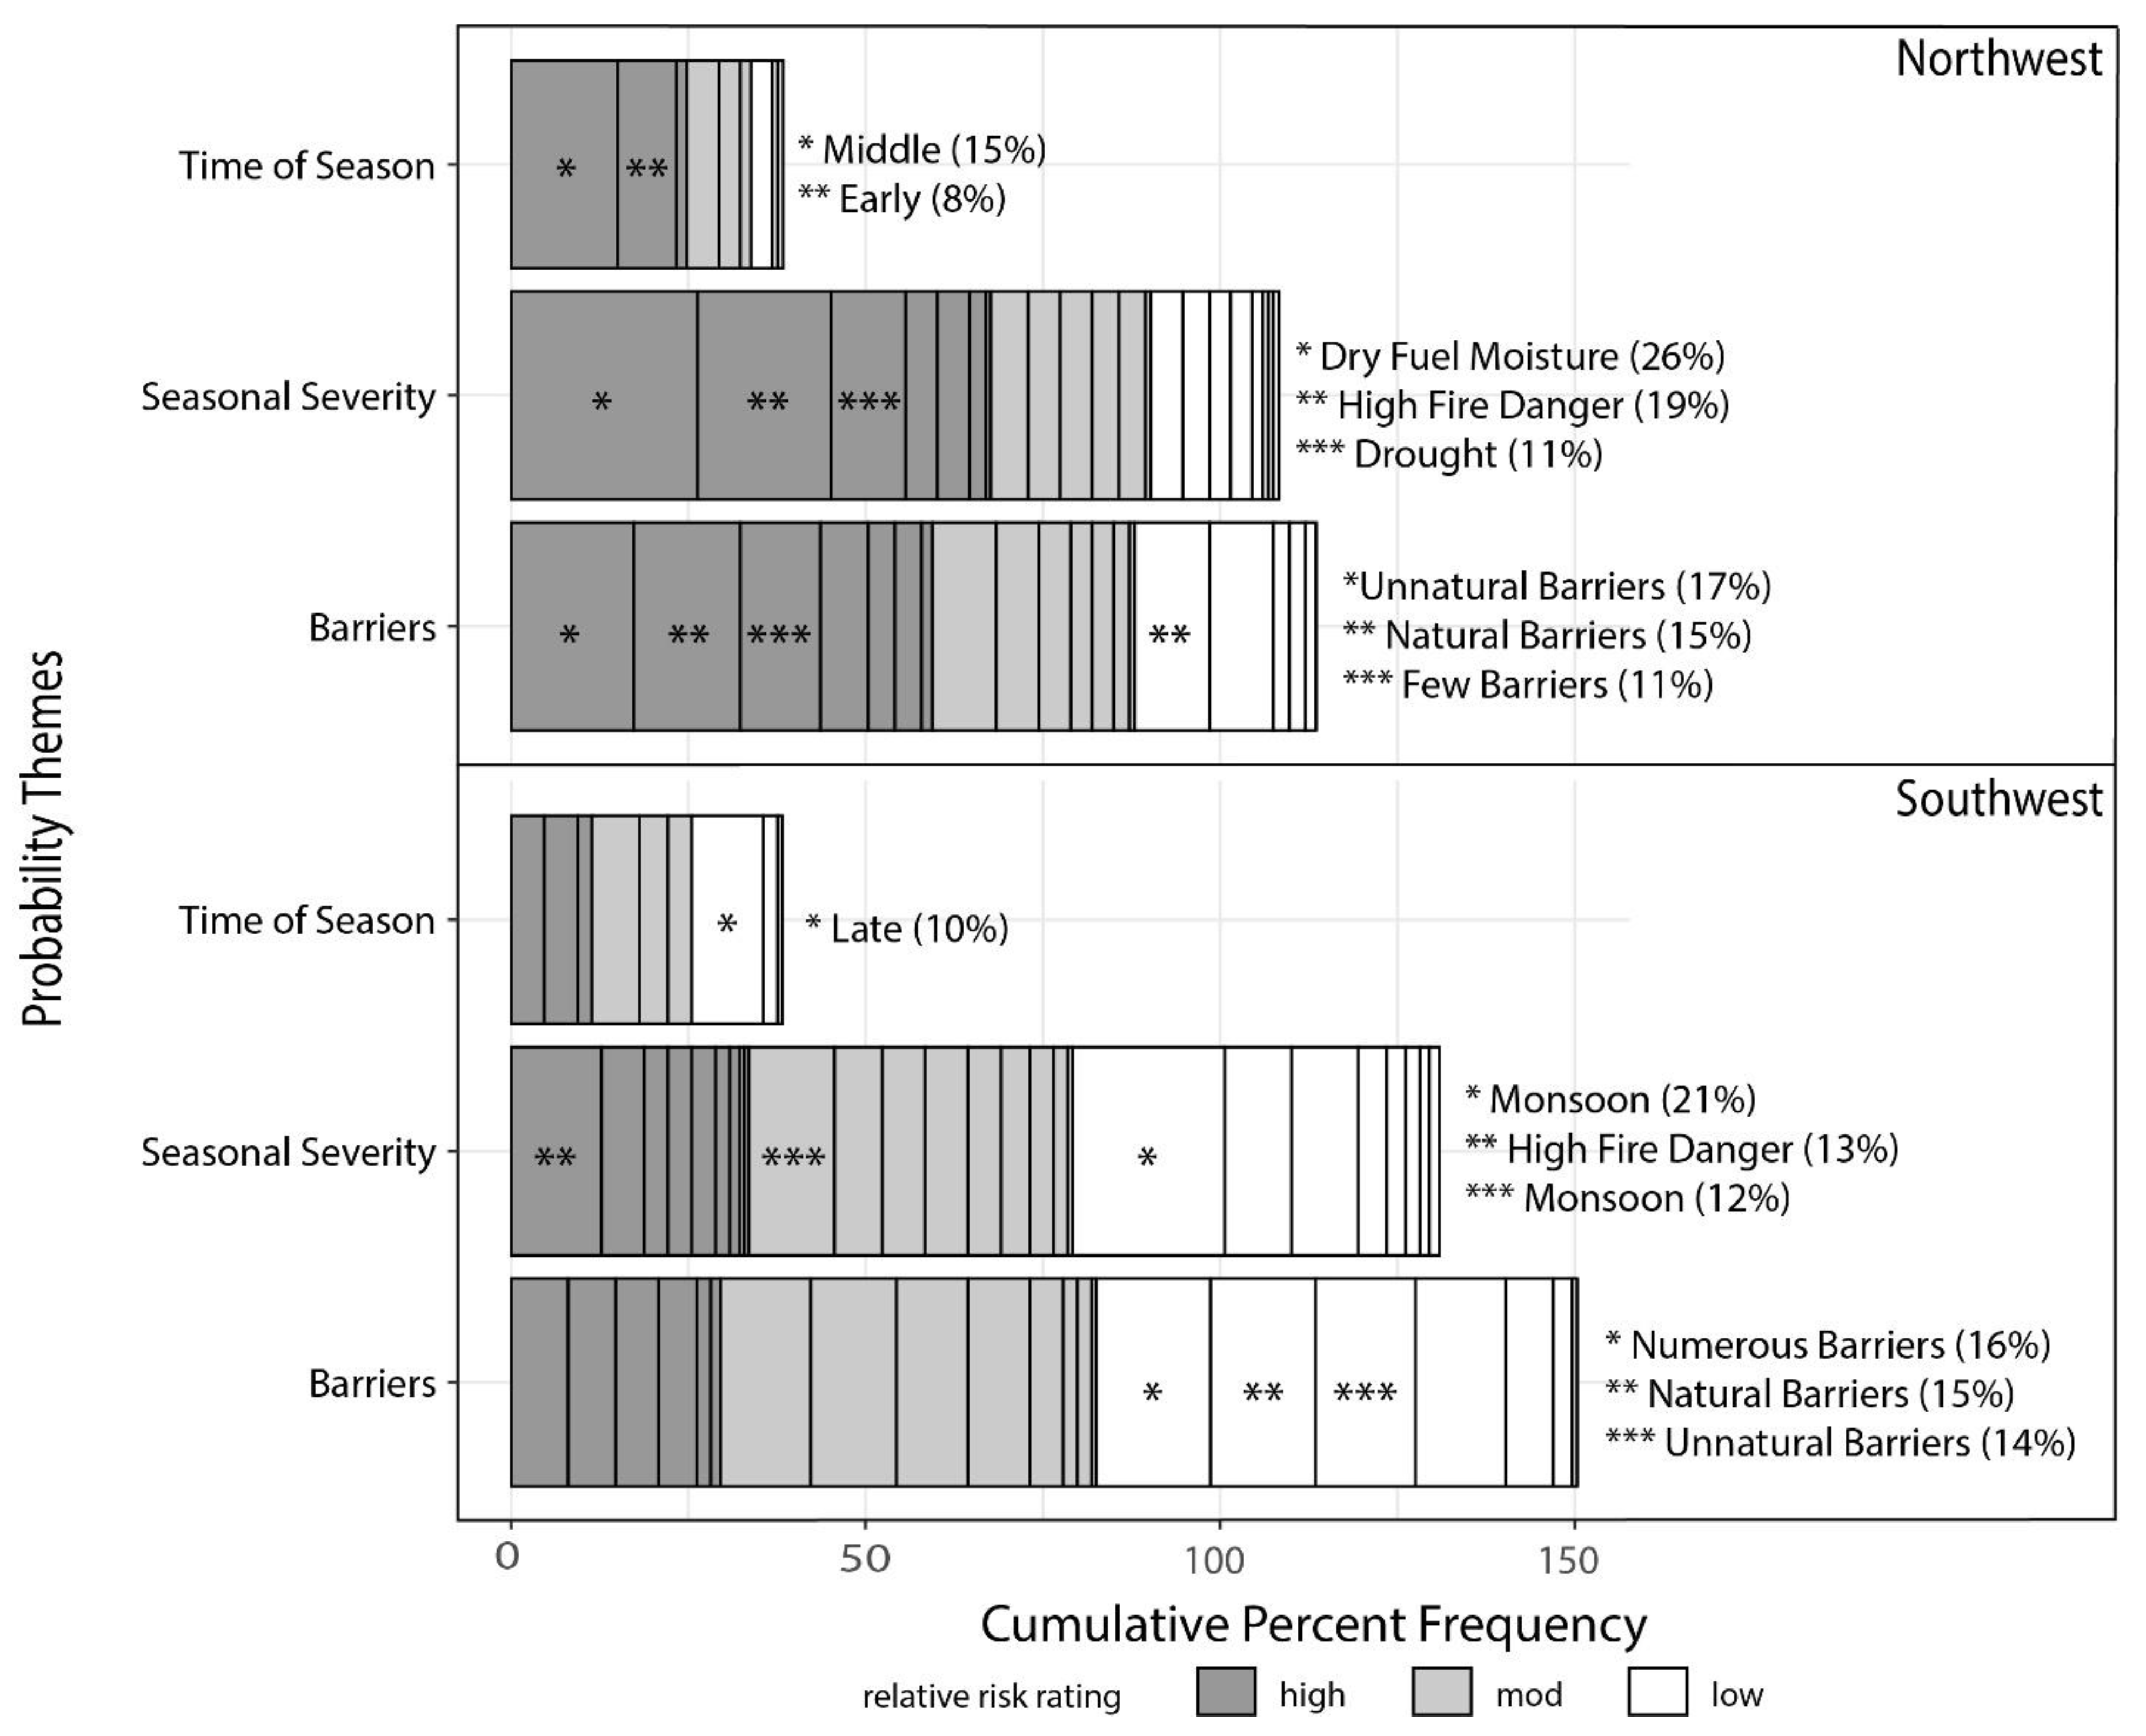
Table 1.
U.S. jurisdictional composition of the sample fires (Northwest, 133; Southwest, 149) reflecting the multijurisdictional nature of fire management, with many agencies sharing responsibility for one wildfire, regardless of the ownership of the point of fire origin.
Table 1.
U.S. jurisdictional composition of the sample fires (Northwest, 133; Southwest, 149) reflecting the multijurisdictional nature of fire management, with many agencies sharing responsibility for one wildfire, regardless of the ownership of the point of fire origin.
| Geographic Area | Agency | |||||||
|---|---|---|---|---|---|---|---|---|
| USFS (%) | BLM (%) | BIA (%) | County (%) | NPS (%) | Other (%) | State (%) | FWS (%) | |
| Northwest | 62 | 31 | 8 | 7 | 12 | 15 | 11 | 8 |
| Southwest | 69 | 16 | 16 | 3 | 15 | 5 | 8 | 1 |
Table 2.
Influential codes and associated themes and elements. Percent frequency of the occurrence of different codes (out of a total of 133 wildfires in the Northwest and 149 wildfires in the Southwest region) tallied by (H) High, (M) Moderate, (L) Low and (T) Total Relative Risk for each region. Chi-square p-values, (MIR) Model Improvement Ratio rankings from the Random Forest (RF) and the Variable Importance (Var. Imp.) ranking from the CART models are included.
| Element | Theme | Code | Northwest | Southwest | ||||||||||||
|---|---|---|---|---|---|---|---|---|---|---|---|---|---|---|---|---|
| Frequency (%) | Chi-sq. | RF MIR, Rank | CART, Var. Imp., Rank | Frequency (%) | Chi-sq. | RF MIR, Rank | CART, Var. Imp., Rank | |||||||||
| H | M | L | T | p-Value | H | M | L | T | p-Value | |||||||
| Hazard | fire behavior | extreme | 3% | 0% | 1% | 4% | 0.406 | 4% | 1% | 1% | 5% | 0.003 | ||||
| Hazard | fire behavior | low | 2% | 5% | 5% | 11% | 0.001 | 5 | 1% | 9% | 21% | 31% | 0.000 | 1 | 1 | |
| Hazard | fire behavior | moderate | 8% | 2% | 0% | 11% | 0.146 | 5 | 4% | 3% | 3% | 11% | 0.419 | |||
| Hazard | fire behavior | passive | 7% | 4% | 2% | 13% | 0.900 | 4% | 5% | 4% | 13% | 0.705 | ||||
| Hazard | fire behavior | spotting | 8% | 3% | 0% | 11% | 0.208 | 2% | 2% | 0% | 4% | 0.116 | ||||
| Hazard | fire behavior | surface | 4% | 1% | 0% | 5% | 0.380 | 1% | 5% | 0% | 6% | 0.023 | ||||
| Hazard | fuel condition | average fuel loads | 3% | 3% | 0% | 6% | 0.175 | 1% | 4% | 0% | 5% | 0.046 | ||||
| Hazard | fuel condition | forested fuel types | 6% | 5% | 5% | 17% | 0.044 | 13 | 5% | 5% | 7% | 17% | 0.512 | |||
| Hazard | fuel condition | grass fuel types | 14% | 2% | 0% | 17% | 0.009 | 12 | 2 | 8% | 10% | 9% | 27% | 0.561 | ||
| Hazard | fuel condition | high fuel loads | 11% | 3% | 2% | 15% | 0.475 | 9% | 4% | 3% | 16% | 0.000 | 6 | |||
| Hazard | fuel condition | highly departed vegetation | 7% | 0% | 0% | 7% | 0.030 | 11 | 3% | 3% | 1% | 7% | 0.353 | |||
| Hazard | fuel condition | low fuel loads | 2% | 3% | 2% | 7% | 0.078 | 0% | 7% | 11% | 17% | 0.002 | 12 | |||
| Hazard | fuel condition | shrub fuel types | 3% | 0% | 0% | 3% | 0.223 | 7% | 9% | 8% | 24% | 0.580 | ||||
| Hazard | fuel condition | snag fuel types | 8% | 1% | 2% | 11% | 0.204 | 2% | 4% | 5% | 11% | 0.657 | ||||
| Hazard | fuel condition | vegetation within range | 4% | 2% | 5% | 11% | 0.018 | 4% | 3% | 5% | 12% | 0.310 | ||||
| Hazard | potential | high elevation | 2% | 3% | 4% | 8% | 0.007 | 15 | 0% | 1% | 1% | 2% | 0.485 | |||
| Hazard | potential | high temperature | 7% | 2% | 0% | 9% | 0.241 | 4 | 5% | 3% | 1% | 9% | 0.038 | |||
| Hazard | potential | large | 15% | 2% | 0% | 17% | 0.002 | 6 | 7% | 1% | 0% | 7% | 0.000 | 2 | ||
| Hazard | potential | low relative humidity | 7% | 2% | 0% | 9% | 0.241 | 7% | 4% | 1% | 12% | 0.000 | 13 | 8 | ||
| Hazard | potential | moderate | 6% | 2% | 0% | 8% | 0.243 | 3% | 9% | 5% | 17% | 0.183 | ||||
| Hazard | potential | precipitation present | 4% | 3% | 5% | 12% | 0.006 | 9 | 2% | 12% | 19% | 34% | 0.000 | 7 | 3 | |
| Hazard | potential | red flag conditions | 3% | 1% | 0% | 4% | 0.506 | 6% | 0% | 0% | 6% | 0.000 | 4 | |||
| Hazard | potential | small | 4% | 5% | 8% | 17% | 0.000 | 3 | 3% | 9% | 14% | 26% | 0.018 | 10 | ||
| Hazard | potential | steep topgraphy | 16% | 3% | 6% | 25% | 0.085 | 5% | 5% | 2% | 13% | 0.057 | ||||
| Hazard | potential | windy | 14% | 3% | 1% | 17% | 0.074 | 7% | 4% | 1% | 12% | 0.002 | ||||
| Probability | barriers | few | 11% | 3% | 2% | 17% | 0.555 | 7% | 5% | 1% | 12% | 0.001 | 15 | |||
| Probability | barriers | wildfire | 7% | 3% | 2% | 12% | 0.968 | 6% | 9% | 13% | 28% | 0.386 | ||||
| Probability | barriers | natural | 15% | 9% | 11% | 35% | 0.005 | 10 | 8% | 12% | 15% | 35% | 0.674 | |||
| Probability | barriers | numerous | 4% | 5% | 9% | 17% | 0.000 | 1 | 1 | 2% | 10% | 16% | 28% | 0.001 | 7 | |
| Probability | barriers | prescribed fire | 0% | 1% | 0% | 1% | 0.231 | 0% | 2% | 7% | 9% | 0.006 | ||||
| Probability | barriers | unnatural | 17% | 6% | 2% | 25% | 0.135 | 5% | 13% | 14% | 32% | 0.302 | ||||
| Probability | seasonal severity | average fire danger | 5% | 5% | 4% | 13% | 0.111 | 1% | 6% | 9% | 17% | 0.050 | ||||
| Probability | seasonal severity | drought | 11% | 4% | 1% | 15% | 0.287 | 3% | 5% | 1% | 9% | 0.162 | ||||
| Probability | seasonal severity | dry fuel moisture | 26% | 5% | 3% | 34% | 0.004 | 4 | 6% | 3% | 1% | 11% | 0.004 | 11 | ||
| Probability | seasonal severity | high (wet) fuel moisture | 2% | 0% | 3% | 5% | 0.008 | 10 | 1% | 7% | 9% | 17% | 0.020 | 4 | ||
| Probability | seasonal severity | above normal fire danger | 19% | 5% | 5% | 29% | 0.438 | 13% | 6% | 4% | 23% | 0.000 | 3 | 2 | ||
| Probability | seasonal severity | high | 5% | 4% | 1% | 9% | 0.365 | 3% | 2% | 0% | 5% | 0.016 | ||||
| Probability | seasonal severity | monsoon | 0% | 0% | 0% | 0% | N/A | 3% | 12% | 21% | 37% | 0.000 | 9 | 6 | ||
| Probability | time of season | early | 8% | 3% | 1% | 12% | 0.464 | 5% | 4% | 2% | 11% | 0.103 | ||||
| Probability | time of season | late | 2% | 2% | 3% | 6% | 0.025 | 2% | 3% | 10% | 15% | 0.012 | ||||
| Probability | time of season | middle | 15% | 5% | 1% | 20% | 0.080 | 5% | 7% | 1% | 12% | 0.011 | 14 | 12 | ||
| Values | cultural resources | general cultural res. | 5% | 2% | 0% | 7% | 0.317 | 6% | 5% | 7% | 18% | 0.280 | ||||
| Values | cultural resources | cultural sites | 8% | 3% | 1% | 11% | 0.541 | 2% | 7% | 8% | 17% | 0.255 | ||||
| Values | economic concerns | ranching | 7% | 1% | 0% | 8% | 0.094 | 7% | 5% | 9% | 21% | 0.209 | ||||
| Values | economic concerns | timber | 11% | 2% | 0% | 13% | 0.057 | 2% | 1% | 1% | 4% | 0.284 | ||||
| Values | economic concerns | tourism, recreation, trails | 16% | 6% | 8% | 29% | 0.176 | 7% | 7% | 8% | 22% | 0.334 | ||||
| Values | infrastructure | commercial | 11% | 4% | 0% | 15% | 0.079 | 3 | 5% | 5% | 6% | 17% | 0.579 | 10 | ||
| Values | infrastructure | government | 8% | 2% | 1% | 11% | 0.488 | 1% | 9% | 4% | 14% | 0.043 | 8 | |||
| Values | infrastructure | housing, structures | 26% | 3% | 1% | 29% | 0.000 | 2 | 8 | 9% | 7% | 8% | 25% | 0.078 | ||
| Values | infrastructure | private land | 8% | 1% | 2% | 10% | 0.258 | 0% | 3% | 6% | 9% | 0.035 | ||||
| Values | natural resources | sage grouse habitat | 11% | 1% | 0% | 11% | 0.012 | 0% | 0% | 0% | 0% | N/A | ||||
| Values | natural resources | special management areas | 11% | 2% | 0% | 14% | 0.040 | 7 | 1% | 3% | 1% | 4% | 0.334 | |||
| Values | natural resources | threatened and endangered species | 8% | 3% | 2% | 14% | 0.938 | 3% | 3% | 1% | 8% | 0.200 | ||||
| Values | natural resources | wilderness | 14% | 4% | 5% | 23% | 0.315 | 1% | 3% | 2% | 7% | 0.731 | ||||
| Values | natural resources | wildlife habitat | 12% | 5% | 2% | 19% | 0.737 | 9% | 5% | 8% | 22% | 0.044 | ||||
| Values | proximity | values are close to fire | 11% | 2% | 1% | 14% | 0.062 | 7% | 5% | 7% | 19% | 0.249 | ||||
| Values | proximity | values are far from fire | 5% | 3% | 2% | 10% | 0.648 | 2% | 9% | 9% | 21% | 0.106 | ||||
| Values | social concerns | general concerns | 5% | 3% | 0% | 8% | 0.262 | 9 | 1% | 2% | 1% | 4% | 0.557 | |||
| Values | social concerns | multijurisdictional | 16% | 5% | 2% | 22% | 0.151 | 8% | 5% | 3% | 15% | 0.002 | ||||
| Values | social concerns | smoke | 5% | 2% | 5% | 11% | 0.004 | 4% | 5% | 4% | 13% | 0.699 | ||||
Table 3.
Codes and associated themes that are more influential to distinguish high and low risk fires in the Northwest. Codes were included if they had a p-value < 0.05 and occurred with frequencies greater than or equal to 10% for high risk fires and 5% for low risk fires, ordered from more to less frequent. An asterisk denotes p < 0.005. Underlined codes were common to both Geographic Areas (GAs).
| Northwest | |||
|---|---|---|---|
| Risk | Codes | Themes | Frequency (%) |
| High | dry fuel moisture * | seasonal severity | 26 |
| Housing * | infrastructure | 26 | |
| large potential * | potential | 15 | |
| natural barriers | barriers | 15 | |
| grass fuel type | fuel condition | 14 | |
| special management areas | natural resources | 11 | |
| sage grouse | natural resources | 11 | |
| Low | natural barriers * | barriers | 11 |
| numerous barriers * | barriers | 9 | |
| small potential * | potential | 8 | |
| forested fuels | fuel condition | 5 | |
| precipitation | potential | 5 | |
| smoke * | social concerns | 5 | |
| low fire behavior * | fire behavior | 5 | |
| veg within range | fuel condition | 5 | |
Table 4.
Codes and associated themes that are more influential to distinguish high and low risk fires in the Southwest. Codes were included if they had a chi-square p-value < 0.05 and occurred with frequencies greater than or equal to 10% for low risk fires and 5% for high risk fires, ranked from most common to less common. An asterisk denotes p < 0.005. Underlined codes were common to both Geographic Areas (GAs).
| Southwest | |||
|---|---|---|---|
| Risk | Codes | Themes | Frequency (%) |
| High | high fire danger * | seasonal severity | 13 |
| high fuel loads * | fuel condition | 9 | |
| wildlife habitat | natural resources | 9 | |
| Multijurisdictional * | social concerns | 8 | |
| low relative humidity * | potential | 7 | |
| few barriers * | barriers | 7 | |
| large potential * | potential | 7 | |
| Windy * | potential | 7 | |
| red flag conditions * | potential | 6 | |
| dry fuel moisture * | seasonal severity | 6 | |
| high temperature | potential | 5 | |
| middle time of season | time of season | 5 | |
| Low | monsoon * | seasonal severity | 21 |
| low fire behavior * | fire behavior | 21 | |
| precipitation * | potential | 19 | |
| numerous barriers * | barriers | 16 | |
| small potential | potential | 14 | |
| low fuel loads * | fuel condition | 11 | |
| late time of season | time of season | 10 | |
Publisher’s Note: MDPI stays neutral with regard to jurisdictional claims in published maps and institutional affiliations. |
© 2022 by the authors. Licensee MDPI, Basel, Switzerland. This article is an open access article distributed under the terms and conditions of the Creative Commons Attribution (CC BY) license (https://creativecommons.org/licenses/by/4.0/).
Share and Cite
MDPI and ACS Style
Noonan-Wright, E.; Seielstad, C. Factors Influencing Risk during Wildfires: Contrasting Divergent Regions in the US. Fire 2022, 5, 131. https://doi.org/10.3390/fire5050131
AMA Style
Noonan-Wright E, Seielstad C. Factors Influencing Risk during Wildfires: Contrasting Divergent Regions in the US. Fire. 2022; 5(5):131. https://doi.org/10.3390/fire5050131
Chicago/Turabian StyleNoonan-Wright, Erin, and Carl Seielstad. 2022. "Factors Influencing Risk during Wildfires: Contrasting Divergent Regions in the US" Fire 5, no. 5: 131. https://doi.org/10.3390/fire5050131