
Forest Fire Patterns and Lightning-Caused Forest Fire Detection in Heilongjiang Province of China Using Satellite Data

1
State Key Laboratory of Remote Sensing Science, Aerospace Information Research Institute, Chinese Academy of Sciences, Beijing 100101, China
2
College of Geodesy and Geomatics, Shandong University of Science and Technology, Qingdao 266590, China
3
Heilongjiang Province Emergency Air Rescue Happiness Station, Harbin 150299, China
4
School of Public Security, Nanjing Forest Police College, Nanjing 210023, China
*
Author to whom correspondence should be addressed.
Fire 2023, 6(4), 166; https://doi.org/10.3390/fire6040166
Submission received: 18 February 2023
/
Revised: 13 April 2023
/
Accepted: 17 April 2023
/
Published: 19 April 2023
(This article belongs to the Topic Application of Remote Sensing in Forest Fire)
Abstract
:Large forest fires can cause significant damage to forest ecosystems and threaten human life and property. Heilongjiang Province is a major forested area in China with the highest number and concentration of lightning-caused forest fires in the country. This study examined the spatial and temporal distribution patterns of forest fires in Heilongjiang Province, as well as the ability of satellite remote sensing to detect these fires using VIIRS 375 m fire point data, ground history forest fire point data, and land cover dataset. The study also investigated the occurrence patterns of lightning-caused forest fires and the factors affecting satellite identification of these fires through case studies. Results show that April has the highest annual number of forest fires, with 77.6% of forest fires being caused by lightning. However, less than 30% of forest fires can be effectively detected by satellites, and lightning-caused forest fires account for less than 15% of all fires. There is a significant negative correlation between the two. Lightning-caused forest fires are concentrated in the Daxing’an Mountains between May and July, and are difficult to monitor by satellites due to cloud cover and lack of satellite transit. Overall, the trend observed in the number of forest fire pixels that are monitored by satellite remote sensing systems is generally indicative of the trends in the actual number of forest fires. However, lightning-caused forest fires are the primary cause of forest fires in Heilongjiang Province, and satellite remote sensing is relatively weak in monitoring these fires due to weather conditions and the timing of satellite transit.
1. Introduction
Forests face damage each year from both man-made and natural causes, including deforestation, pests and diseases, and forest fires [1,2]. Out of all these sources, forest fires are the most destructive natural disasters and have become increasingly frequent since the 21st century due to the impact of global warming [3,4,5]. When a forest fire breaks out, it has the potential to spread rapidly and is notoriously difficult to control. Not only does it pose a significant threat to the environment, but it also endangers human life, health, and property security. The damage caused by forest fires can be irreparable, affecting the natural resources and ecosystem, and compromising the forest’s ability to self-regulate. For instance, a massive forest fire broke out in Muli County, Liangshan Prefecture, Sichuan Province in 2019 when a lightning strike ignited a pine tree. The complex terrain, inaccessible transportation, high altitude, and strong wind that day made it challenging to control the fire, resulting in extensive damage to the forest and ecosystem and causing casualties [6]. Consequently, forest fire prevention has become a critical area of research in the fields of forestry and ecology.
Understanding the patterns of forest fire occurrence is crucial for effective fire prevention efforts, as various factors such as fuel type, meteorological factor, and topography can influence the likelihood of a forest fire. Studying the spatial and temporal distribution pattern of forest fire occurrence using historical fire point information is an essential method, with numerous studies conducted both domestically and internationally to investigate this pattern [7,8,9,10]. The use of remote sensing technology and satellite hotspot data has greatly enhanced our understanding of the patterns of forest fire occurrence. With the development of high spatial and temporal resolution sensors, satellites such as Terra, Aqua, NOAA, NPP, and Landsat series of US land satellites can monitor forest fire hotspots. Among these, the VIIRS sensor on the NPP satellite has become an important tool for satellite fire hotspot monitoring due to its high spatial resolution, good data quality, and sensitivity to hotspots [11,12]. Due to the potential for misreported or underreported historical fire location data, as well as the possibility of satellites interpreting non-fire thermal anomalies as fires, current research on the distribution patterns of forest fires in both China and abroad typically employ a combination of satellite data and historical records. This approach helps to ensure greater accuracy and reliability in the analysis of forest fire distribution patterns [13,14,15,16].
Heilongjiang Province is a large forest province in China and is also a forest fire-prone area, especially in late May and early June when cold front cyclones from Lake Baikal and Inner Mongolia over the Daxing’an Mountains forest area form cold fronts. Due to the low temperature of the cold air and the hilly topography of the forest area, some areas with low water content often experience thunder but no rain under the action of the cold fronts, i.e., dry thunderstorms [17]. Research has demonstrated that lightning is responsible for 68% of forest fires in the Daxing’an Mountains of Heilongjiang Province over the past four decades [18]. The frequent incidence of lightning-caused forest fires has significantly hindered local socioeconomic progress and caused substantial disruptions to the lives of residents. Therefore, preventing the outbreak of lightning fires is a crucial measure towards achieving sustainable economic development in the region. The high forest cover of combustible material in the study area, combined with the frequency of dry thunderstorms, makes the area highly susceptible to lightning-caused forest fires. As lightning-caused forest fires occur in sparsely populated forest areas and because of the complex topography and high altitude of the Daxing’an Mountains, they cannot be detected and extinguished in time, ultimately leading to extensive forest destruction [19]. The objective of this study is to examine the spatial and temporal variations of forest fires in Heilongjiang Province’s jurisdictional area over an extended period. To achieve this goal, the study combines VIIRS 375 m forest fires with historical records of lightning-caused forest fires, conducts a statistical evaluation of the satellite remote sensing’s monitoring capability for lightning-caused forest fires, and investigates the reasons for many lightning-caused forest fires going undetected by satellites. The study intends to provide technical support to the forest fire prevention departments in the region for fire risk prediction and risk assessment, as well as for the timely detection and prevention of fires. Ultimately, the study aims to contribute to the effective suppression of fires in the area.
2. Data and Processing
2.1. Study Region
The study area is under the jurisdiction of Heilongjiang Province, shown in Figure 1, which includes Heilongjiang Province and the Daxing’an Mountains (where the land rights of Jiagedaqi and Songling Districts are under the jurisdiction of the Inner Mongolia Autonomous Region). It is located in the far northeast of China, with coordinates 121°11′~135°05′ E, 43°25′~53°23′ N, and borders Russia to the north and east, and Hulunbuir City and Jilin Province to the west and south. Heilongjiang is the province with the highest latitude in China [20]. The region covers approximately 473,000 km2 and has a varied topography, with higher elevations in the north and southeast, and lower elevations in the east and southwest. The Great and Xiaoxing’an Mountains are in the northwest and northeast, part of the Changbai Mountains are in the southeast, and the Sanjiang Plain and Songnen Plain are in the east and southwest. The mountains range from 300~1600 m above sea level, and the plains are 35~200 m above sea level. The region straddles four major water systems: the Heilongjiang River, the Ussuri River, the Songhua River, and the Suifen River. The climate is a cold temperate continental monsoon, influenced by the monsoon, with well-developed water systems, extensive arable land, and a high forest cover, primarily in the Greater and Lesser Xing’an Mountains and the eastern mountains, with a forest coverage of approximately 43.8% [21,22]. Heilongjiang Province is prone to forest fires, particularly lightning-caused fires.
2.2. VIIRS Data and Forest Fire Records
VIIRS (Visible Infrared Imaging Radiometer Suite) is a sensor from the United States Joint Polar Satellite System (JPSS) that is carried on two satellites: Suomi-NPP (National Polar-orbiting Operational Environmental Satellite System Preparatory Project, launched on 28 October 2011) and NOAA-20 (National Oceanic and Atmospheric Administration, launched on 18 November 2017) [23]. This paper used data from the VIIRS sensor on board the Suomi-NPP satellite for the years 2013–2020 (Figure 1). The VIIRS fire point detection algorithm inherits and improves upon the advantages of the MODIS fire point inversion algorithm. VIIRS maintains the continuity of MODIS observations, covering the globe once every 12 h with approximately 01:30 BST (Beijing Summer Time) transit times. While MODIS has a significantly reduced ability to monitor fires in areas far from the subsatellite point, the special image element aggregation of VIIRS leaves its ability to monitor fires at the edge of the image largely unchanged [24]. The higher-resolution polar-orbiting satellites, such as Landsat, Sentinel, and the GF series of satellite payloads, have higher resolutions but longer revisit cycles and cannot meet the timeliness requirements for forest fire monitoring. Therefore, this study uses forest fire data from the VIIRS sensor. (https://firms.modaps.eosdis.nasa.gov/map/, accessed on 3 September 2022). The forest fire records used in this study were provided by the Forest Fire Prevention Bureau of Heilongjiang Province from 2013 to 2020, with a total of 384 records, as shown in Figure 1b, each containing information such as the latitude and longitude of the fire location, the date and time of discovery, the date and time of extinguishment, the area burned, and the cause of the fire.
2.3. Land Cover Dataset
The 30 m annual land cover dataset and its dynamics in China from 1990 to 2021, which can be found on the Zenodo data sharing platform (https://zenodo.org/record/4417810, accessed on 3 September 2022), is a comprehensive and valuable resource for researchers interested in the long-term changes of land cover in China [25]. The China annual land cover dataset (CLDC) categorizes the land of the country into nine distinct types: cropland, forest, shrub, grassland, water, snow, barren, impervious, and wetland. The accuracy of the CLDC was validated by comparing it with other similar products. The main strength of this dataset is its high temporal resolution, providing 30-m land use classification results for each year over a period of three decades, which is superior to other available products [26]. In summary, the CLDC is a valuable resource for studying land cover change in China over a long time frame, and its high temporal resolution makes it a unique and valuable tool for analyzing land use dynamics.
2.4. Data Processing
Each hotspot monitored by satellite remote sensing has a low, standard, and high confidence level to measure the quality of each fire pixel [27]. In this study, the low confidence VIIRS fire points were removed, and the thermal anomaly data were analyzed by overlaying the thermal anomaly data with the 2013–2020 annual land cover dataset (CLDC), respectively, based on the monitored thermal anomaly location and time information. The hotspot data located in the forest floor were retained as forest fire point data. Based on the annual VIIRS forest fire point data, ground history forest fire point data, and administrative boundary data of the study area, the spatial and temporal distribution patterns of satellite remotely sensed forest fires in the study area were analyzed. The distribution pattern of lightning-caused forest fires and the identification of lightning-caused forest fires by VIIRS were compared with the ground history fire points.
Based on the historical forest fire data and VIIRS 375 m forest fire data, this study matches and analyzes the two datasets according to certain rules from both distance and time perspectives. It should be noted that not all forest fires are detected in a timely manner, and the discovery date in the historical forest fire data may not be the actual ignition date. Generally, the true ignition date is a few days before the discovery date, and it is likely to be detected by satellites at that time. Additionally, some small forest fires may be extinguished before the satellite passes over, but VIIRS is sensitive to thermal anomalies, so even if the fire has been extinguished, if there is residual heat on the ground, it may still be identified by VIIRS. Therefore, this study matches the VIIRS forest fire data within 1 day before and after the discovery date based on the historical records of the discovery date and extinguishing date of each forest fire. In terms of distance, different matching distances are limited by the size of the burned area of each forest fire in the historical records, and the maximum distance set in this study is 10 km. Figure 2 shows an example of historically recorded forest fires matched to VIIRS forest fire data in the study area. It can be seen that the two are separated by a maximum distance of 2.92 km, so all VIIRS fire points in the figure can be matched to this historically recorded fire point.
3. Results and Discussion
3.1. Spatial and Temporal Distribution of Forest Fires Detected by VIIRS
We first analyzed the inter-annual variation in the number of forest fires and the area burned in Heilongjiang Province based on VIIRS forest fire data. The number of forest fire pixels monitored by VIIRS in the study area from 2013 to 2020 was 1465, and the trend in the number of fires over the 8-year period showed an initial increase followed by a decrease. In 2015, the highest number of forest fires was recorded, while in 2019, the fewest forest fires were recorded. The change in the number of forest fire pixels monitored by VIIRS and the trend in the number of forest fires recorded on the ground were generally consistent, with the changes in the number of forest fire pixels monitored by satellite remote sensing generally reflecting changes in the trend of forest fires, as shown in Table 1. For example, in 2018, the proportion of forest fire pixels and forest fires was 8.9% and 11.5%, respectively, while the proportion of forest fire area was as high as 79.5%. This was due to a six-day forest fire that occurred on 3 June 2018, which resulted in an area of 2130 ha being affected by the fire. Figure 3 displays the distribution of the cumulative number of forest fires in the study area over eight years, and it can be seen that Heihe City had the highest number of forest fire pixels, followed by the Daxing’an Mountains, accounting for 40.9% and 20.5% of the total forest fire pixels, respectively.
To further analyze the temporal distribution patterns of forest fires in the study area, the monthly variation of forest fires in the area over an 8-year period was analyzed based on VIIRS forest fire data. The monthly fluctuations in the number of forest fire occurrences within the jurisdiction of Heilongjiang Province are significant, as shown in Figure 4. Specifically, the number of forest fire pixels shows a significant increase from the winter to spring months, followed by a notable decrease from spring to summer, another increase from summer to autumn, and finally, a decrease from autumn to winter, with almost no forest fires occurring during the winter months. The highest number of forest fire pixels recorded from 2013 to 2020 was April 2015, with a total of 228 pixels. Additionally, the number of forest fire pixels in the study area has decreased by 19.6% in 2020 compared to 2013.
3.2. Capacity of Satellite for Forest Fire Detection
To identify the specific causes and corresponding percentages of forest fires in the study area, a statistical analysis was performed on the historical records of forest fires in the study area between 2013 and 2020. This was necessary because the cause of forest fires could not be determined from the satellite-monitored forest fire data. Over the span of eight years from 2013 to 2020, a total of 384 forest fires were recorded and monitored in the study area. These fires were classified into two main sources: those caused by lightning strikes and those caused by human activities, such as agricultural fires, sacrificial fires, construction operations fires, field smoking, and deliberate arson. Among these, lightning-caused forest fires accounted for 77.6% of the total, with 298 fires in this category, as shown in Figure 5. It is worth noting that lightning strikes are a natural and unpredictable cause of forest fires, and can occur frequently in areas like Heilongjiang with unique topography and climate. As a result, it is important to analyze the occurrence of these fires and investigate whether they can be detected in a timely manner by satellite. Understanding the causes and distribution of forest fires is crucial for preventing and mitigating their destructive effects on the environment and local communities.
To investigate the timeliness of satellite remote sensing for detecting forest fires in the study area, ground historical forest fire point data and VIIRS 375 m forest fire point data were matched in distance and time, and analyzed statistically according to certain rules. As shown in Figure 6, out of the 384 forest fires recorded on the ground within the jurisdiction of Heilongjiang Province from 2013 to 2020, 298 forest fires were caused by lightning strikes, with the highest and lowest number of forest fires occurring in 2017 (97) and 2013 (14), respectively. The maximum and minimum number of lightning-caused forest fires occurred in 2015 (73) and 2013 (7), respectively. Over an 8-year period, VIIRS sensors monitored a total of 102 forest fires in the region, with less than 30% of the total number of forest fires being detected by satellite. Only 44 forest fires were detected by satellites that were caused by lightning, accounting for less than 15% of the total number of lightning-caused forest fires. On the other hand, a total of 84 forest fires were detected first by satellites, accounting for 82.4% of the total number of forest fires detected by VIIRS sensors. The time of detection of forest fires by satellites was generally 1–8 h earlier than that of historically recorded ground forest fires, except for 2019, when the number of forest fires detected first by satellites was smaller than the number of forest fires detected first by ground. In all other years, the number of forest fires detected first by satellites was much larger than the number of forest fires detected first by ground. Figure 6 also shows that the proportion of forest fires that can be monitored by VIIRS gradually decreased from 2013 to 2020, while the proportion of forest fires caused by lightning gradually increased. Figure 7a shows the opposite trend, and Figure 7b shows a highly significant negative correlation between the two with r = −0.888, p = 0.003. An increase in the proportion of lightning-caused forest fires reduces the proportion of forest fires detected by satellite remote sensing, suggesting that lightning-caused forest fires are less likely to be monitored by satellite remote sensing. The main reason for this is cloud cover, which is described in detail in Section 2.3.
3.3. Capacity of Satellite for Lightning-Caused Forest Fire Detection
The primary months for lightning-caused forest fires in the jurisdictions of Heilongjiang Province differ from the satellite monitoring of forest fires. Lightning-caused forest fires mainly occur in May, June, and July, with almost no lightning-caused forest fires occurring in other months. July had the most significant number of lightning-caused forest fires and the largest area burned, as shown in Figure 8a. Lightning-caused forest fires were primarily concentrated in the Daxing’an Mountains, with no lightning-caused forest fires in any of the other municipalities between 2013 and 2020, except for Heihe, where only two lightning-caused forest fires were reported, as shown in Figure 8b.
This section analyzes why forest fires caused by lightning strikes in the study area are not easily detected by satellites and quantifies the number of such fires and the area that remains undetected for various reasons. Upon analysis of Figure 6, it was found that between 2013 and 2020, there were a total of 298 forest fires caused by lightning in the Heilongjiang jurisdiction. Out of these, only 44 forest fires were detected by VIIRS, indicating that satellite remote sensing was only able to monitor 14.8% of the lightning-caused forest fires, while the remaining 85.2% were left undetected. When examining MODIS true color images on Worldview before and after the detection date of lightning-caused forest fires, it was found that clouds were generally present, preventing satellite remote sensing from monitoring the fires. In addition, many lightning-caused forest fires are not monitored by satellite remote sensing, not because they are covered by clouds, but rather because the satellite does not pass over the fire at the time it occurs. The VIIRS satellite is expected to transit at around 13:30 BST. To determine whether the satellite is not in transit, we rely on the detection time and extinguishment time of lightning fire data recorded in the past. It is worth noting that the detection time may be later than the actual time of the fire. If the satellite has not passed yet, or if the lightning fire is being artificially extinguished or is self-extinguishing, the satellite will not be able to monitor the lightning fire. Additionally, in situations where there is minimal combustible material present on the surface or high levels of humidity at the time of a lightning strike, the overfire zone may be limited and the satellite sensors themselves may introduce some margin of error, leading to the possibility of the lightning fire going undetected by the satellite. To further analyze the impact of these three reasons on the detection of lightning-caused forest fires by satellite, the number of lightning-caused forest fires not detected for each reason was counted, as shown in Table 2. From 2013 to 2020, 298 lightning-caused forest fires occurred in the region, resulting in a burned area of 283.891 ha. Of these, 85.2% were not monitored, though the area of unmonitored lightning-caused forest fires was only 28.6%. Cloud cover had the greatest impact on satellite monitoring of lightning-caused forest fires, resulting in 141 lightning-caused forest fires not monitored by satellite, covering an area of 42.018 ha. Other causes, such as small fire size, were responsible for 101 and 12 cases, respectively, covering an area of 37.573 ha and 1.630 ha. In summary, most of the lightning-caused forest fires from 2013 to 2020 in Heilongjiang Province were not detected by VIIRS.
3.4. Lightning-Caused Forest Fire Cases
Lightning-caused forest fires are caused by thunderstorms where the lightning strikes combustible materials on the ground under conditions that support combustion. Therefore, there are three basic conditions necessary for a lightning-caused forest fire to occur: a source of ignition, combustible materials, and an environment conducive to the spread of the fire [28,29,30]. When lightning strikes, fires do not typically start immediately; instead, certain conditions must be met for them to ignite [31]. During satellite transit, lightning-caused fires with a certain overfire area can generally be observed by VIIRS sensors under clear weather conditions.
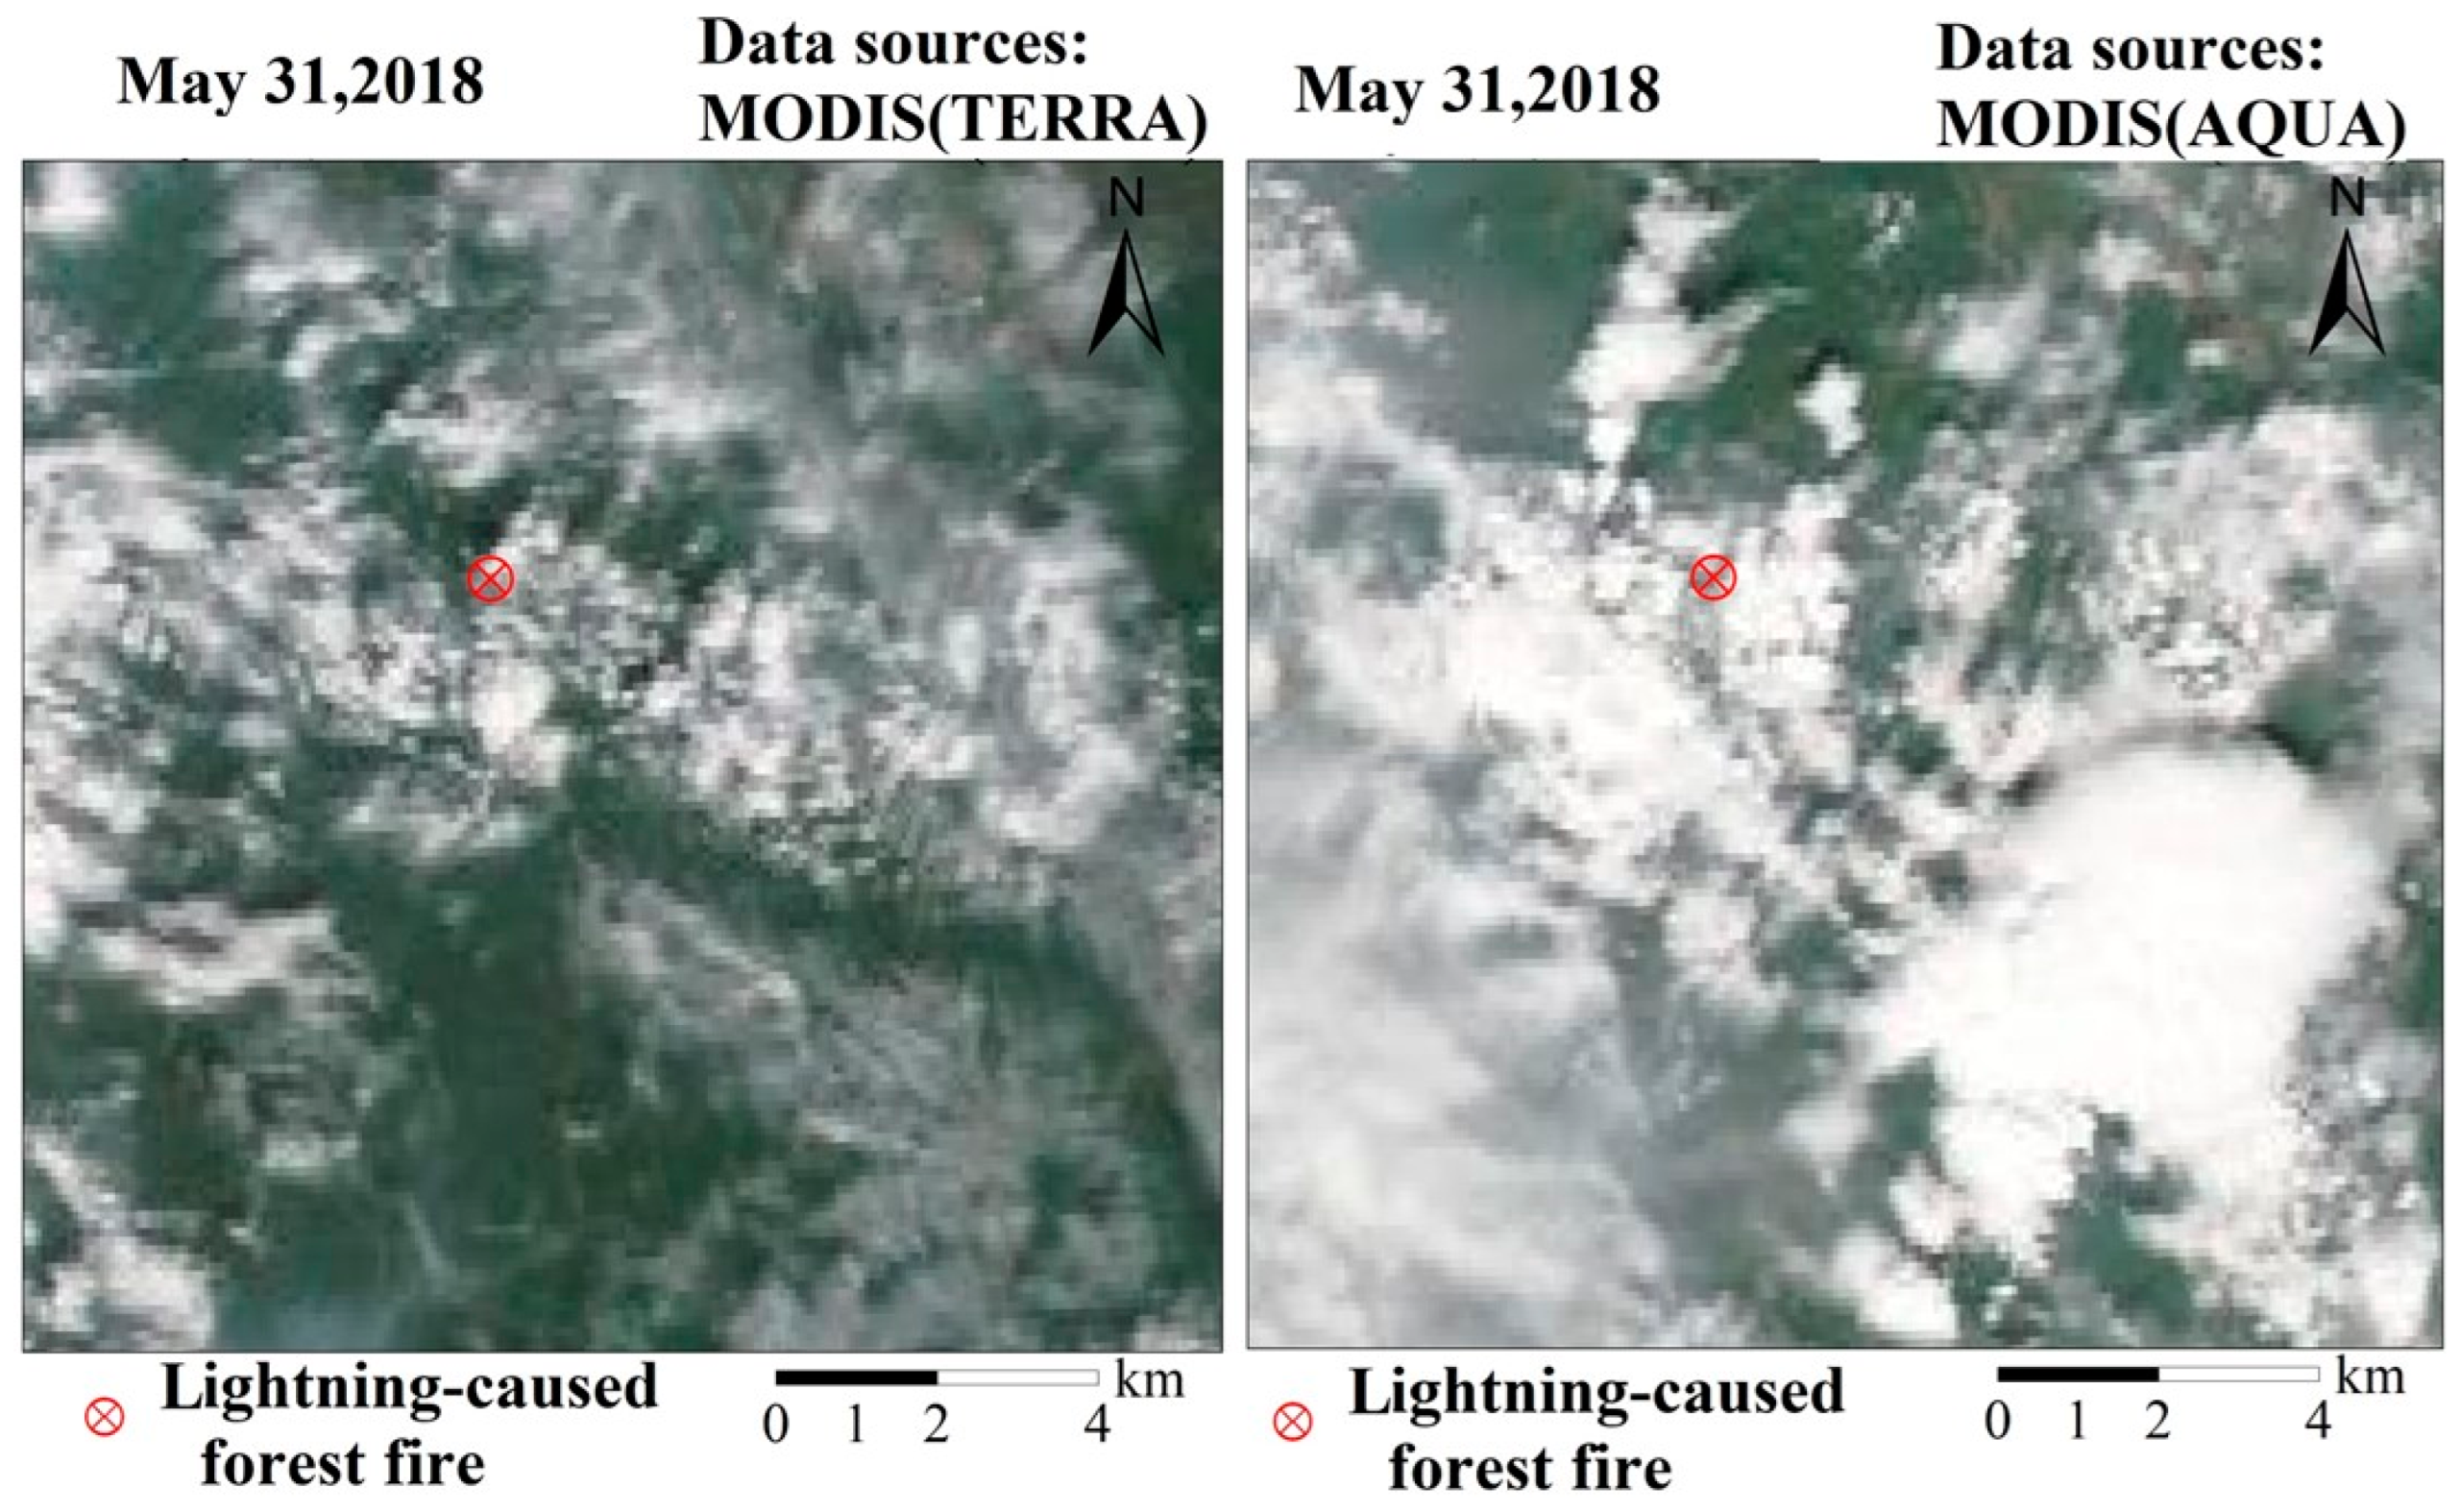
Two specific examples of the aforementioned are presented below. A forest fire was detected in Mohe County at 3:00 PM on 17 July 2015, starting in the 1096 highland area of Daling River in Fuke Mountain forest management area and extinguished at 5:00 AM on 18 July, with a fire duration of approximately 13 h and a total burned area of 98.3 ha. The cause of the forest fire was analyzed as the occurrence of several cloud-ground lightning flashes within 0.4 to 1 km of the fire site from 12 July to 15 July, and several fire spots were monitored by satellite for three consecutive days near the forest fire site from 16 July, as shown in Figure 9. The darker area within the circle of the true color image of 20 July 2015 in Figure 9 represents the burned area. However, if the conditions for lightning ignition are met when lightning strikes the ground, a lightning-caused forest fire will immediately occur, which may be affected by various factors, such as thunderstorm clouds that could obscure or extinguish the fire before the satellite can pass, making it impossible for the lightning-caused forest fires to be detected by the satellite. For instance, on 31 May 2018, at 13:00, a forest fire caused by a lightning strike broke out in the Tuqiang Forestry Bureau in the Daxing’an Mountains, which was started by a lightning strike and lasted for about 6 h, resulting in a forest overfire of 9.4 ha, during which the satellite transit, but no fire was detected, combined with MODIS true color image of the area showed extensive thick cloud cover over the area near the fire site on that day, as shown in Figure 10.
3.5. Discussion
Currently, both domestic and foreign remote sensing satellites operate in various orbits, including geosynchronous and polar orbits, and provide Earth observation data with distinct revisit periods, spatial resolutions, coverage, and spectral characteristics. This diversity of satellite capabilities plays a crucial role in forest fire monitoring. While satellite monitoring offers significant advantages such as timeliness and accuracy, it can be impacted by weather conditions [32,33]. For instance, during a lightning strike, cloud cover may impede the satellite’s ability to monitor the fire.
Heilongjiang Province, a vast forest province in China, is highly susceptible to wildfires, especially in the Daxing’an Mountains, where thunderstorms often occur, leading to lightning-caused forest fires. During late May and early June each year, cold fronts from Lake Baikal and Mongolia converge over the Daxing’an Mountains forest area, resulting in thunderstorms, some of them with minimal rainfall (i.e., dry thunderstorms), due to the low temperature of the cold air and the hilly terrain [17,34]. The region’s high forest coverage and abundant combustible materials, combined with the frequency of dry thunderstorms, increase the risk of lightning-caused forest fires. Moreover, lightning fires in the sparsely populated forest areas of the Daxing’an Mountains, with its complex terrain and high altitude, often go undetected and lead to extensive forest damage. Studies have revealed that lightning caused 44% of the forest fires in the Daxing’an Mountains over the past four decades, hindering social and economic development and causing inconvenience to locals. Therefore, preventing lightning-caused forest fires is a crucial measure for achieving sustainable local economic development [19].
This study reveals that numerous forest fires caused by lightning in the Daxing’an Mountains remain undetected by satellites, primarily due to the region’s climatic and topographic features. Despite limited satellite detection capabilities resulting from factors such as cloud cover and transit time, the satellite monitoring time was earlier than the ground personnel recording time for all fires jointly detected by both satellite and ground personnel, indicating the advantage of satellites in early detection of lightning-strike fires. Due to the study’s time constraints, this paper only utilized VIIRS data from NPP satellites. Currently, there are three VIIRS satellites in orbit, and the satellites’ ability to monitor forest fires will continue to improve in the future.
4. Conclusions
This paper analyzed the spatial and temporal distribution patterns of forest fire points in the jurisdictional area of Heilongjiang Province using VIIRS 375 m resolution forest fire point data, historical forest fire point data, and land use datasets from 2013 to 2020. It also investigated whether VIIRS sensors can effectively monitor lightning-caused forest fires in a timely manner by matching satellite forest fire points with historical forest fire points according to certain rules. The analysis reveals that lightning-caused forest fires are difficult to detect using satellite remote sensing, and thus the occurrence patterns of ground-based historical lightning-caused forest fires was separately examined, along with reasons why they were challenging to detect. Additionally, typical cases of lightning forest fires in the presence and absence of clouds were briefly analyzed. Based on the findings of this study, the main conclusions of this work are as follows:
- The maximum and minimum numbers of forest fire pixels were observed in 2015 and 2019, respectively. The number of forest fire pixels detected by satellite remote sensing is consistent with the trend of changes in the number of historically recorded forest fires. The area over a forest fire is not necessarily correlated with the number of satellite-detected or historically recorded forest fires, due to the long duration of individual fires over a large area. The number of forest fire pixels varied in an M-shaped pattern each year, with a peak in April.
- Analysis of the reasons of historical forest fires reveals that 77.6% of forest fires are caused by lightning strikes. Matching VIIRS forest fire location data with historical ground forest fire data shows that less than 30% of forest fires were detected by satellite, and lightning strikes account for less than 15% of forest fires. A comparison between the timing of satellite observations of forest fires with ground observations shows that 82.4% of forest fires were initially detected by satellite remote sensing. The proportion of fires detected by VIIRS decreased over time, while the proportion of fires caused by lightning increased in the study period, with a highly significant negative correlation coefficient of 0.89 between the two.
- Based on the analysis of lightning-caused forest fire data in the study area from 2013 to 2020, it was found that these fires are mainly concentrated in the Daxing’an Mountains and occur predominantly during May, June, and July. The difficulty in monitoring lightning-caused forest fires is primarily due to cloud cover and limited satellite transit. Specifically, 141 and 101 lightning-caused forest fires were not detected by satellite due to these factors, respectively. The study reveals that certain conditions must be met for a fire to start when lightning strikes combustible material on the ground. In clear weather conditions, the resulting fire can usually be observed through satellite transit. However, if the lightning strike is followed by ignition immediately, thick clouds often obscure the satellite’s view of the lightning-caused forest fires.
Author Contributions
Conceptualization, Q.J. and M.F.; methodology, M.F.; software, Q.J.; validation, J.T., W.W. and D.L.; formal analysis, Q.J.; investigation, M.F.; resources, J.T.; data curation, W.W. and D.L.; writing—original draft preparation, Q.J.; writing—review and editing, M.F.; visualization, J.T.; supervision, P.W.; project administration, J.T.; funding acquisition, M.F. All authors have read and agreed to the published version of the manuscript.
Funding
This research was funded by the Applied Technology Research and Development program of Heilongjiang Province, grant number GA20C013.
Data Availability Statement
If you would like to access data, specific method details, or code used to support the findings of this study, please do not hesitate to contact the corresponding author. They will make the materials available to you upon a reasonable request.
Acknowledgments
The authors would like to thank FIRMS for providing VIIRS fire point data, the Forest Fire Prevention Bureau of Heilongjiang Province for providing historically recorded forest fire data, and the Zenodo data sharing platform for providing land cover dataset. Q.Y. and M.F. acknowledge the support of the Applied Technology Research and Development program of Heilongjiang Province.
Conflicts of Interest
The authors declare no conflict of interest.
References
- Agbeshie, A.A.; Abugre, S.; Atta-Darkwa, T.; Awuah, R. A Review of the Effects of Forest Fire on Soil Properties. J. For. Res. 2022, 33, 1419–1441. [Google Scholar] [CrossRef]
- Xu, R.; Lin, H.; Lu, K.; Cao, L.; Liu, Y. A Forest Fire Detection System Based on Ensemble Learning. Forests 2021, 12, 217. [Google Scholar] [CrossRef]
- Ma, W.; Feng, Z.; Cheng, Z.; Chen, S.; Wang, F. Identifying Forest Fire Driving Factors and Related Impacts in China Using Random Forest Algorithm. Forests 2020, 11, 507. [Google Scholar] [CrossRef]
- Dimopoulou, M.; Giannikos, I. Towards an Integrated Framework for Forest Fire Control. Eur. J. Oper. Res. 2004, 152, 476–486. [Google Scholar] [CrossRef]
- Flannigan, M.D.; Krawchuk, M.A.; de Groot, W.J.; Wotton, B.M.; Gowman, L.M. Implications of Changing Climate for Global Wildland Fire. Int. J. Wildland Fire 2009, 18, 483. [Google Scholar] [CrossRef]
- Tian, Y.; Wu, Z.; Li, M.; Wang, B.; Zhang, X. Forest Fire Spread Monitoring and Vegetation Dynamics Detection Based on Multi-Source Remote Sensing Images. Remote Sens. 2022, 14, 4431. [Google Scholar] [CrossRef]
- Tian, X.; Zhao, F.; Shu, L.; Wang, M. Distribution Characteristics and the Influence Factors of Forest Fires in China. For. Ecol. Manag. 2013, 310, 460–467. [Google Scholar] [CrossRef]
- Yin, S.; Song, G.; Shan, Y.; Gao, B.; Fei, S. Spatial Distribution Analysis of Main Forest Fire Sources in Jilin Province. J. Northeast For. Univ. 2019, 47, 79–84+88. [Google Scholar] [CrossRef]
- Yang, S.; Cao, M.; Zhu, X.; Cheng, Y.; Zheng, C.; Bai, Y. A study on the occurrence pattern of forest fires in the northern Daxing’an Mountains primary forest area of Inner Mongolia, 2001–2019. J. Catast. 2022, 37, 122–128. [Google Scholar]
- Zumbrunnen, T.; Menéndez, P.; Bugmann, H.; Conedera, M.; Gimmi, U.; Bürgi, M. Human Impacts on Fire Occurrence: A Case Study of Hundred Years of Forest Fires in a Dry Alpine Valley in Switzerland. Reg. Environ. Chang. 2012, 12, 935–949. [Google Scholar] [CrossRef]
- Fu, Y.; Li, R.; Wang, X.; Bergeron, Y.; Valeria, O.; Chavardès, R.D.; Wang, Y.; Hu, J. Fire Detection and Fire Radiative Power in Forests and Low-Biomass Lands in Northeast Asia: MODIS versus VIIRS Fire Products. Remote Sens. 2020, 12, 2870. [Google Scholar] [CrossRef]
- Briones-Herrera, C.I.; Vega-Nieva, D.J.; Monjarás-Vega, N.A.; Briseño-Reyes, J.; López-Serrano, P.M.; Corral-Rivas, J.J.; Alvarado-Celestino, E.; Arellano-Pérez, S.; Álvarez-González, J.G.; Ruiz-González, A.D.; et al. Near Real-Time Automated Early Mapping of the Perimeter of Large Forest Fires from the Aggregation of VIIRS and MODIS Active Fires in Mexico. Remote Sens. 2020, 12, 2061. [Google Scholar] [CrossRef]
- Cardil, A.; Monedero, S.; Ramírez, J.; Silva, C.A. Assessing and Reinitializing Wildland Fire Simulations through Satellite Active Fire Data. J. Environ. Manag. 2019, 231, 996–1003. [Google Scholar] [CrossRef]
- He, X.; Li, R.; Zhang, F.; Wang, X.; Chen, L.; Tao, M.; Mei, X.; Song, X. Analysis of the Spatial and Temporal Patterns of Biomass Burning in Hubei Province Based on VIIRS and the Influencing Factors. Resour. Environ. Yangtze Basin 2022, 31, 1627–1640. [Google Scholar]
- Cao, H.; Meng, X.; Kong, M.; Yu, H.; Chen, Y.; Wang, K.; Liu, C.; Liu, X. Spatiotemporal Variation of Straw Burning in Shandong Province Based on VIIRS Data. Environ. Sci. Technol. 2022, 45, 152–161. [Google Scholar] [CrossRef]
- Wang, L. Study on Distribution Characteristics and Risk Grade Division of Forest Fire in Nanchong City; China West Normal University: Nanchong, China, 2020. [Google Scholar]
- Styger, J.; Marsden-Smedley, J.; Kirkpatrick, J. Changes in Lightning Fire Incidence in the Tasmanian Wilderness World Heritage Area, 1980–2016. Fire 2018, 1, 38. [Google Scholar] [CrossRef]
- Shu, Y.; Shi, C.; Yi, B.; Zhao, P.; Guan, L.; Zhou, M. Influence of Climatic Factors on Lightning Fires in the Primeval Forest Region of the Northern Daxing’an Mountains, China. Sustainability 2022, 14, 5462. [Google Scholar] [CrossRef]
- Cattau, M.E.; Wessman, C.; Mahood, A.; Balch, J.K. Anthropogenic and Lightning-started Fires Are Becoming Larger and More Frequent over a Longer Season Length in the U.S.A. Glob. Ecol. Biogeogr. 2020, 29, 668–681. [Google Scholar] [CrossRef]
- Wu, Z.; Li, M.; Wang, B.; Quan, Y.; Liu, J. Using Artificial Intelligence to Estimate the Probability of Forest Fires in Heilongjiang, Northeast China. Remote Sens. 2021, 13, 1813. [Google Scholar] [CrossRef]
- Wang, X.; Wang, C.; Zhao, G.; Ding, H.; Yu, M. Research Progress of Forest Fires Spread Trend Forecasting in Heilongjiang Province. Atmosphere 2022, 13, 2110. [Google Scholar] [CrossRef]
- Guo, F.T.; Hu, H.Q.; Sun, L.; Ma, Z.H. Spatial Patterns of Lightning-Ignited Forest Fires in Daxing’an Mountains, Heilongjiang Province, China, 1973–1997. Adv. Mater. Res. 2011, 183–185, 2268–2274. [Google Scholar] [CrossRef]
- Justice, C.O.; Román, M.O.; Csiszar, I.; Vermote, E.F.; Wolfe, R.E.; Hook, S.J.; Friedl, M.; Wang, Z.; Schaaf, C.B.; Miura, T.; et al. Land and Cryosphere Products from Suomi NPP VIIRS: Overview and Status. J. Geophys. Res. Atmos. 2013, 118, 9753–9765. [Google Scholar] [CrossRef]
- Cao, C.; Xiong, X.; Blonski, S.; Liu, Q.; Guenther, B.; Weng, F. Suomi NPP VIIRS On-Orbit Performance, Data Quality, and New Applications. In Proceedings of the Earth Observing Missions and Sensors: Development, Implementation, and Characterization II, Kyoto, Japan, 9 November 2012; Volume 8528. [Google Scholar] [CrossRef]
- Yang, J.; Huang, X. The 30 m Annual Land Cover Dataset and Its Dynamics in China from 1990 to 2019. Earth Syst. Sci. Data 2021, 13, 3907–3925. [Google Scholar] [CrossRef]
- Wang, L.; Jin, G.; Xiong, X.; Wu, K.; Huang, Q. Mapping Urban Land Dynamics by Automatic Generation of Ground Samples from Globeland30 and Random Forest Classification on the Google Earth Engine. J. Appl. Rem. Sens. 2022, 16, 034526. [Google Scholar] [CrossRef]
- Spruce, J.P.; Ryan, R.E.; Mckellip, R. Potential of VIIRS Time Series Data for Aiding the USDA Forest Service Early Warning System for Forest Health Threats: A Gypsy Moth Defoliation Case Study. 2008. Available online: https://ntrs.nasa.gov/citations/20080008850 (accessed on 5 January 2023).
- Wierzchowski, J.; Heathcott, M.; Flannigan, M.D. Lightning and Lightning Fire, Central Cordillera, Canada. Int. J. Wildland Fire 2002, 11, 41. [Google Scholar] [CrossRef]
- Rorig, M.L.; Ferguson, S.A. Characteristics of lightning and wildland fire ignition in the Pacific Northwest. J. Appl. Meteorol. 1999, 38, 1565–1575. [Google Scholar] [CrossRef]
- Duncan, B.W.; Adrian, F.W.; Stolen, E.D. Isolating the lightning ignition regime from a contemporary background fire regime in east-central Florida, USA. Can. J. For. Res. 2010, 40, 286–297. [Google Scholar] [CrossRef]
- Cha, D.; Wang, X.; Kim, J.W. Assessing Lightning and Wildfire Hazard by Land Properties and Cloud to Ground Lightning Data with Association Rule Mining in Alberta, Canada. Sensors 2017, 17, 2413. [Google Scholar] [CrossRef]
- Zhang, J.H.; Yao, F.M. Advance in Monitoring Forest Fire in China Based on Multi-Satellite Data. Adv. Mater. Res. 2012, 518–523, 5668–5672. [Google Scholar] [CrossRef]
- Zhang, J.H.; Yao, F.M.; Liu, C. Detection, Emission Estimation and Risk Prediction of Forest Fires in China Using Satellite Sensors and Simulation Models in the Past Three Decades—An Overview. Int. J. Environ. Res. Public Health 2011, 8, 3156–3178. [Google Scholar] [CrossRef]
- Fza, B.; Yl, B.; Ls, A. Change in the fire season pattern from bimodal to unimodal under climate change: The case of Daxing’anling in Northeast China. Agric. For. Meteorol. 2020, 291, 108075. [Google Scholar] [CrossRef]
Figure 1.
Spatial distribution of historically recorded and VIIRS-detected forest fires in the jurisdiction of Heilongjiang Province, 2013–2020. In map (a), the red line represents the administrative boundary of Heilongjiang Province, the black line represents the administrative boundary of Hulunbeier City, and the blue shaded area denotes the Daxing’an Mountains. In map (b), the study area of this paper is displayed, with red dots indicating historically recorded forest fires and blue dots representing VIIRS-detected forest fires. By combining maps (a,b), it is evident that the study area of this paper covers two provinces.

Figure 2.
Example of matching VIIRS forest fires with historical forest fires.
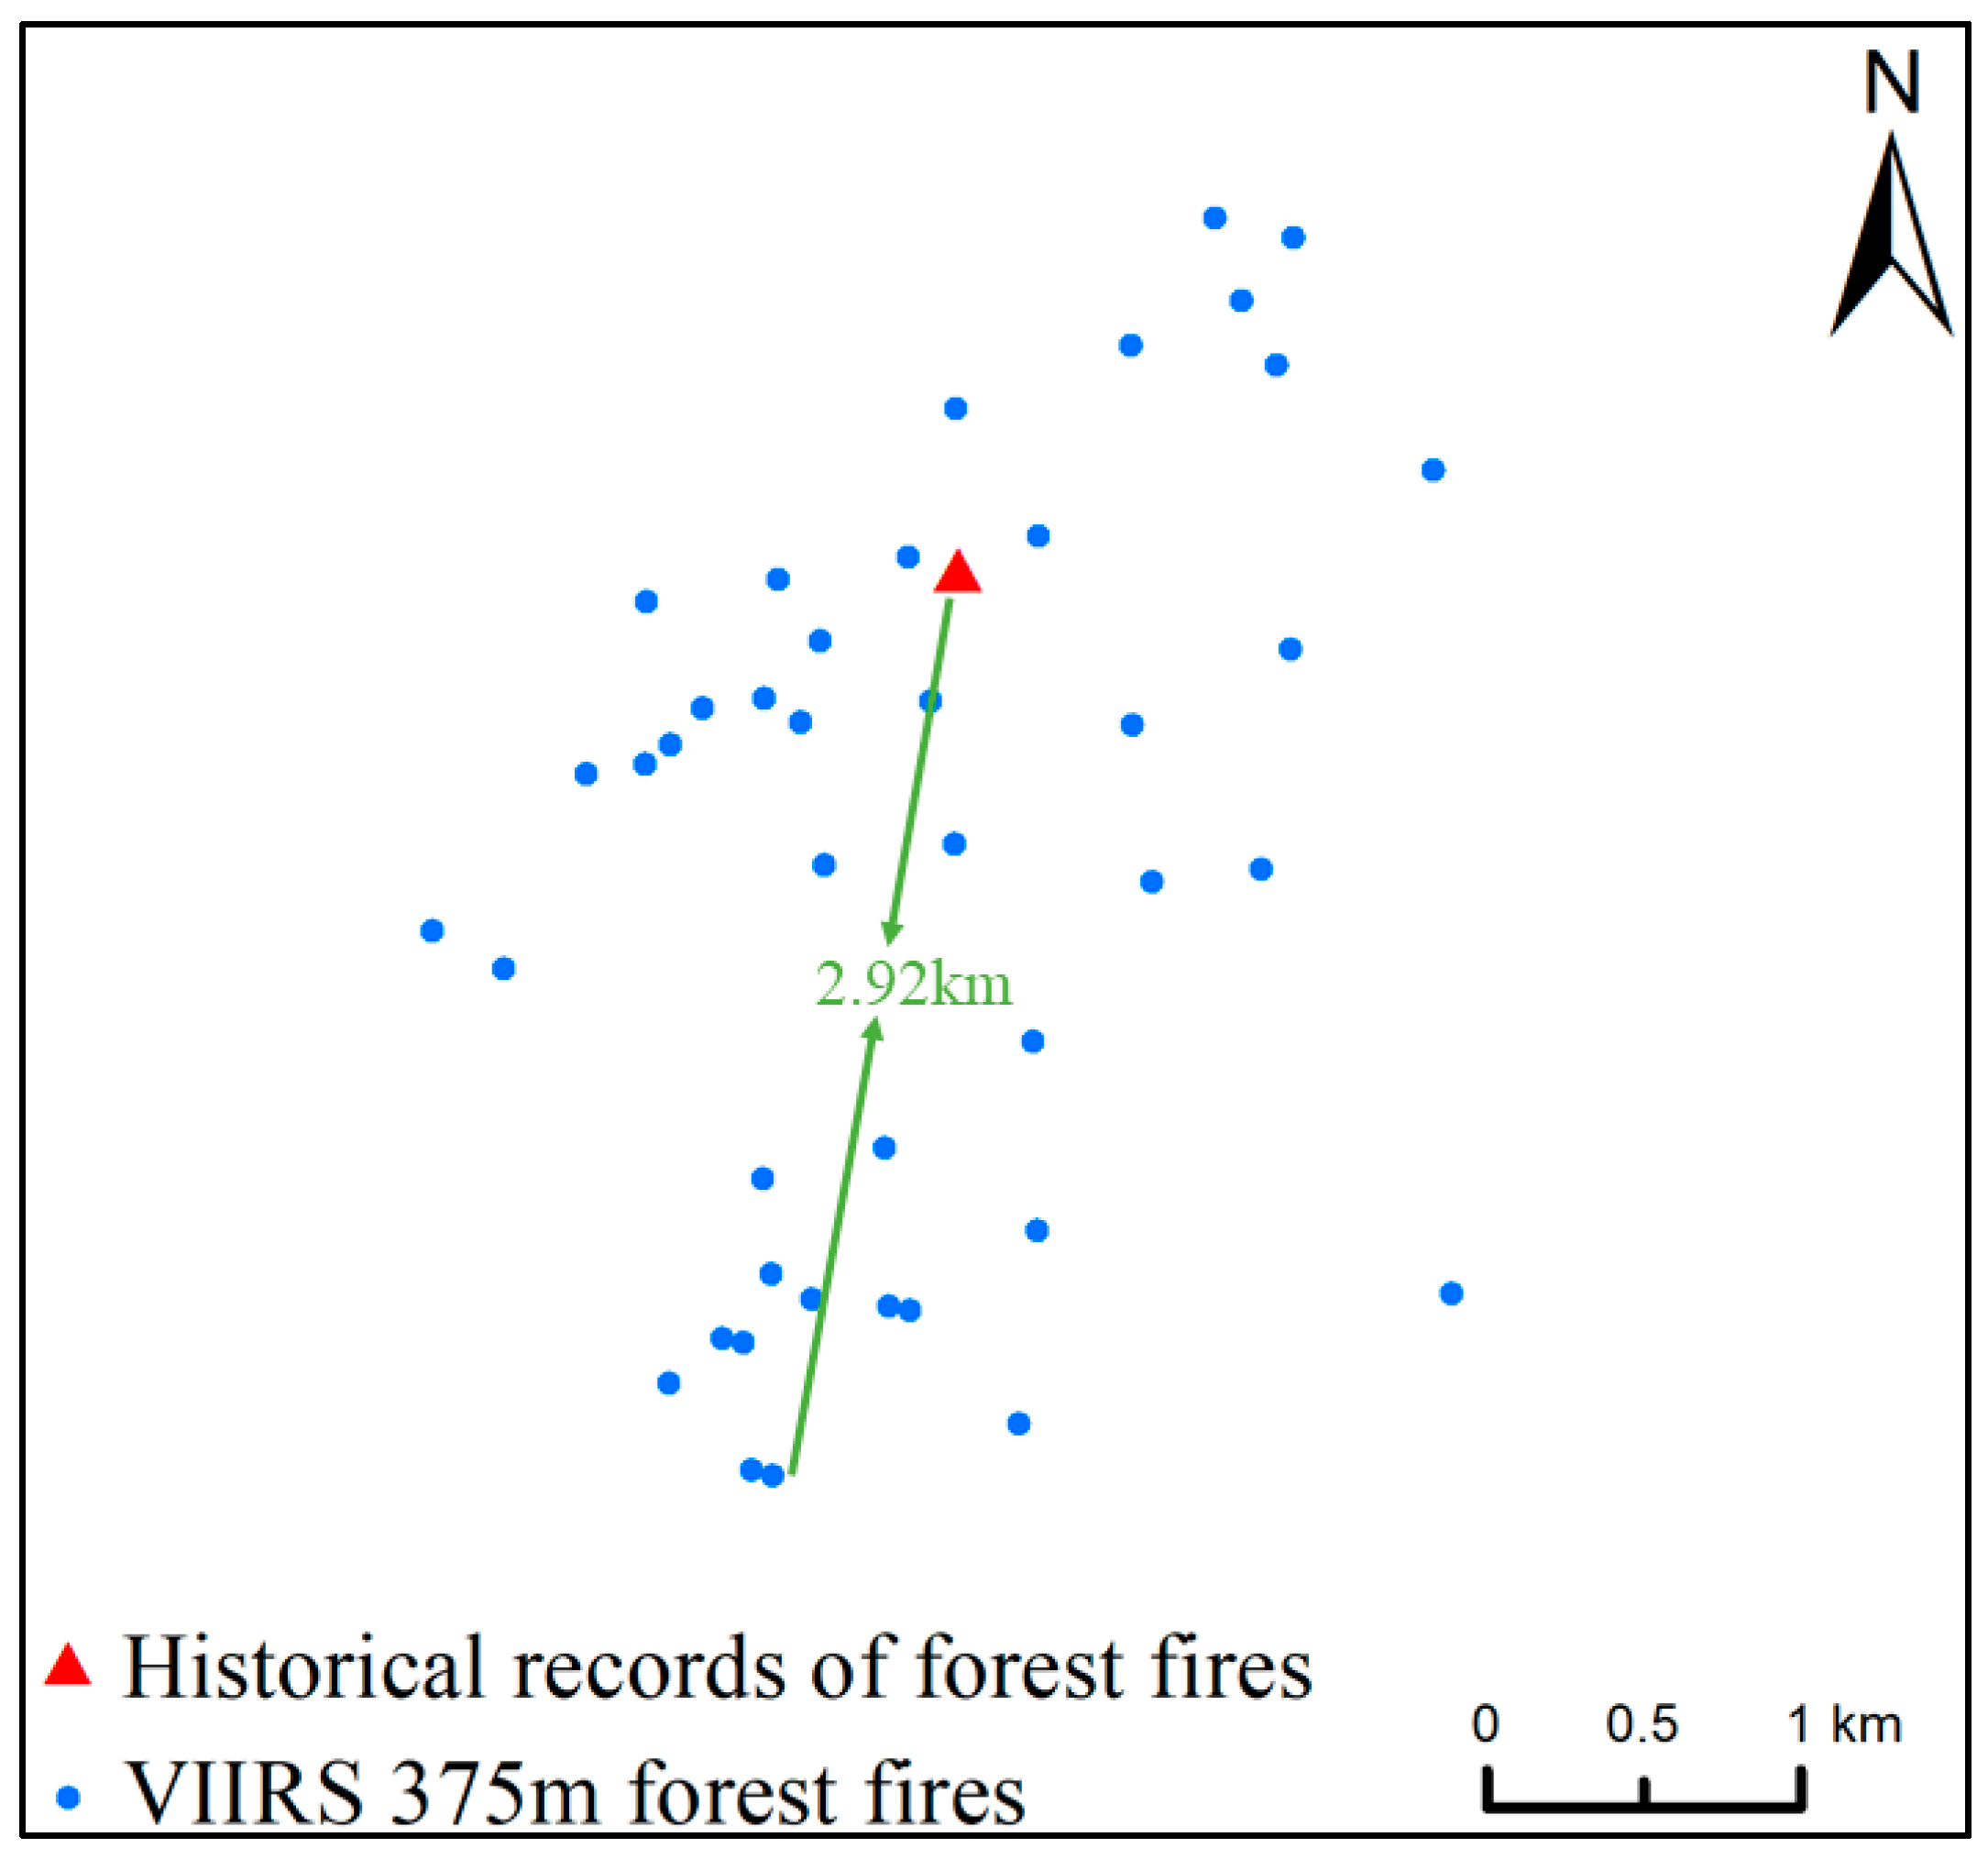
Figure 3.
Distribution of cumulative number of forest fires monitored by VIIRS in the jurisdiction of Heilongjiang Province, 2013–2020.
Figure 3.
Distribution of cumulative number of forest fires monitored by VIIRS in the jurisdiction of Heilongjiang Province, 2013–2020.

Figure 4.
Monthly change in the number of forest fires in the jurisdiction of Heilongjiang Province, 2013–2020.
Figure 4.
Monthly change in the number of forest fires in the jurisdiction of Heilongjiang Province, 2013–2020.
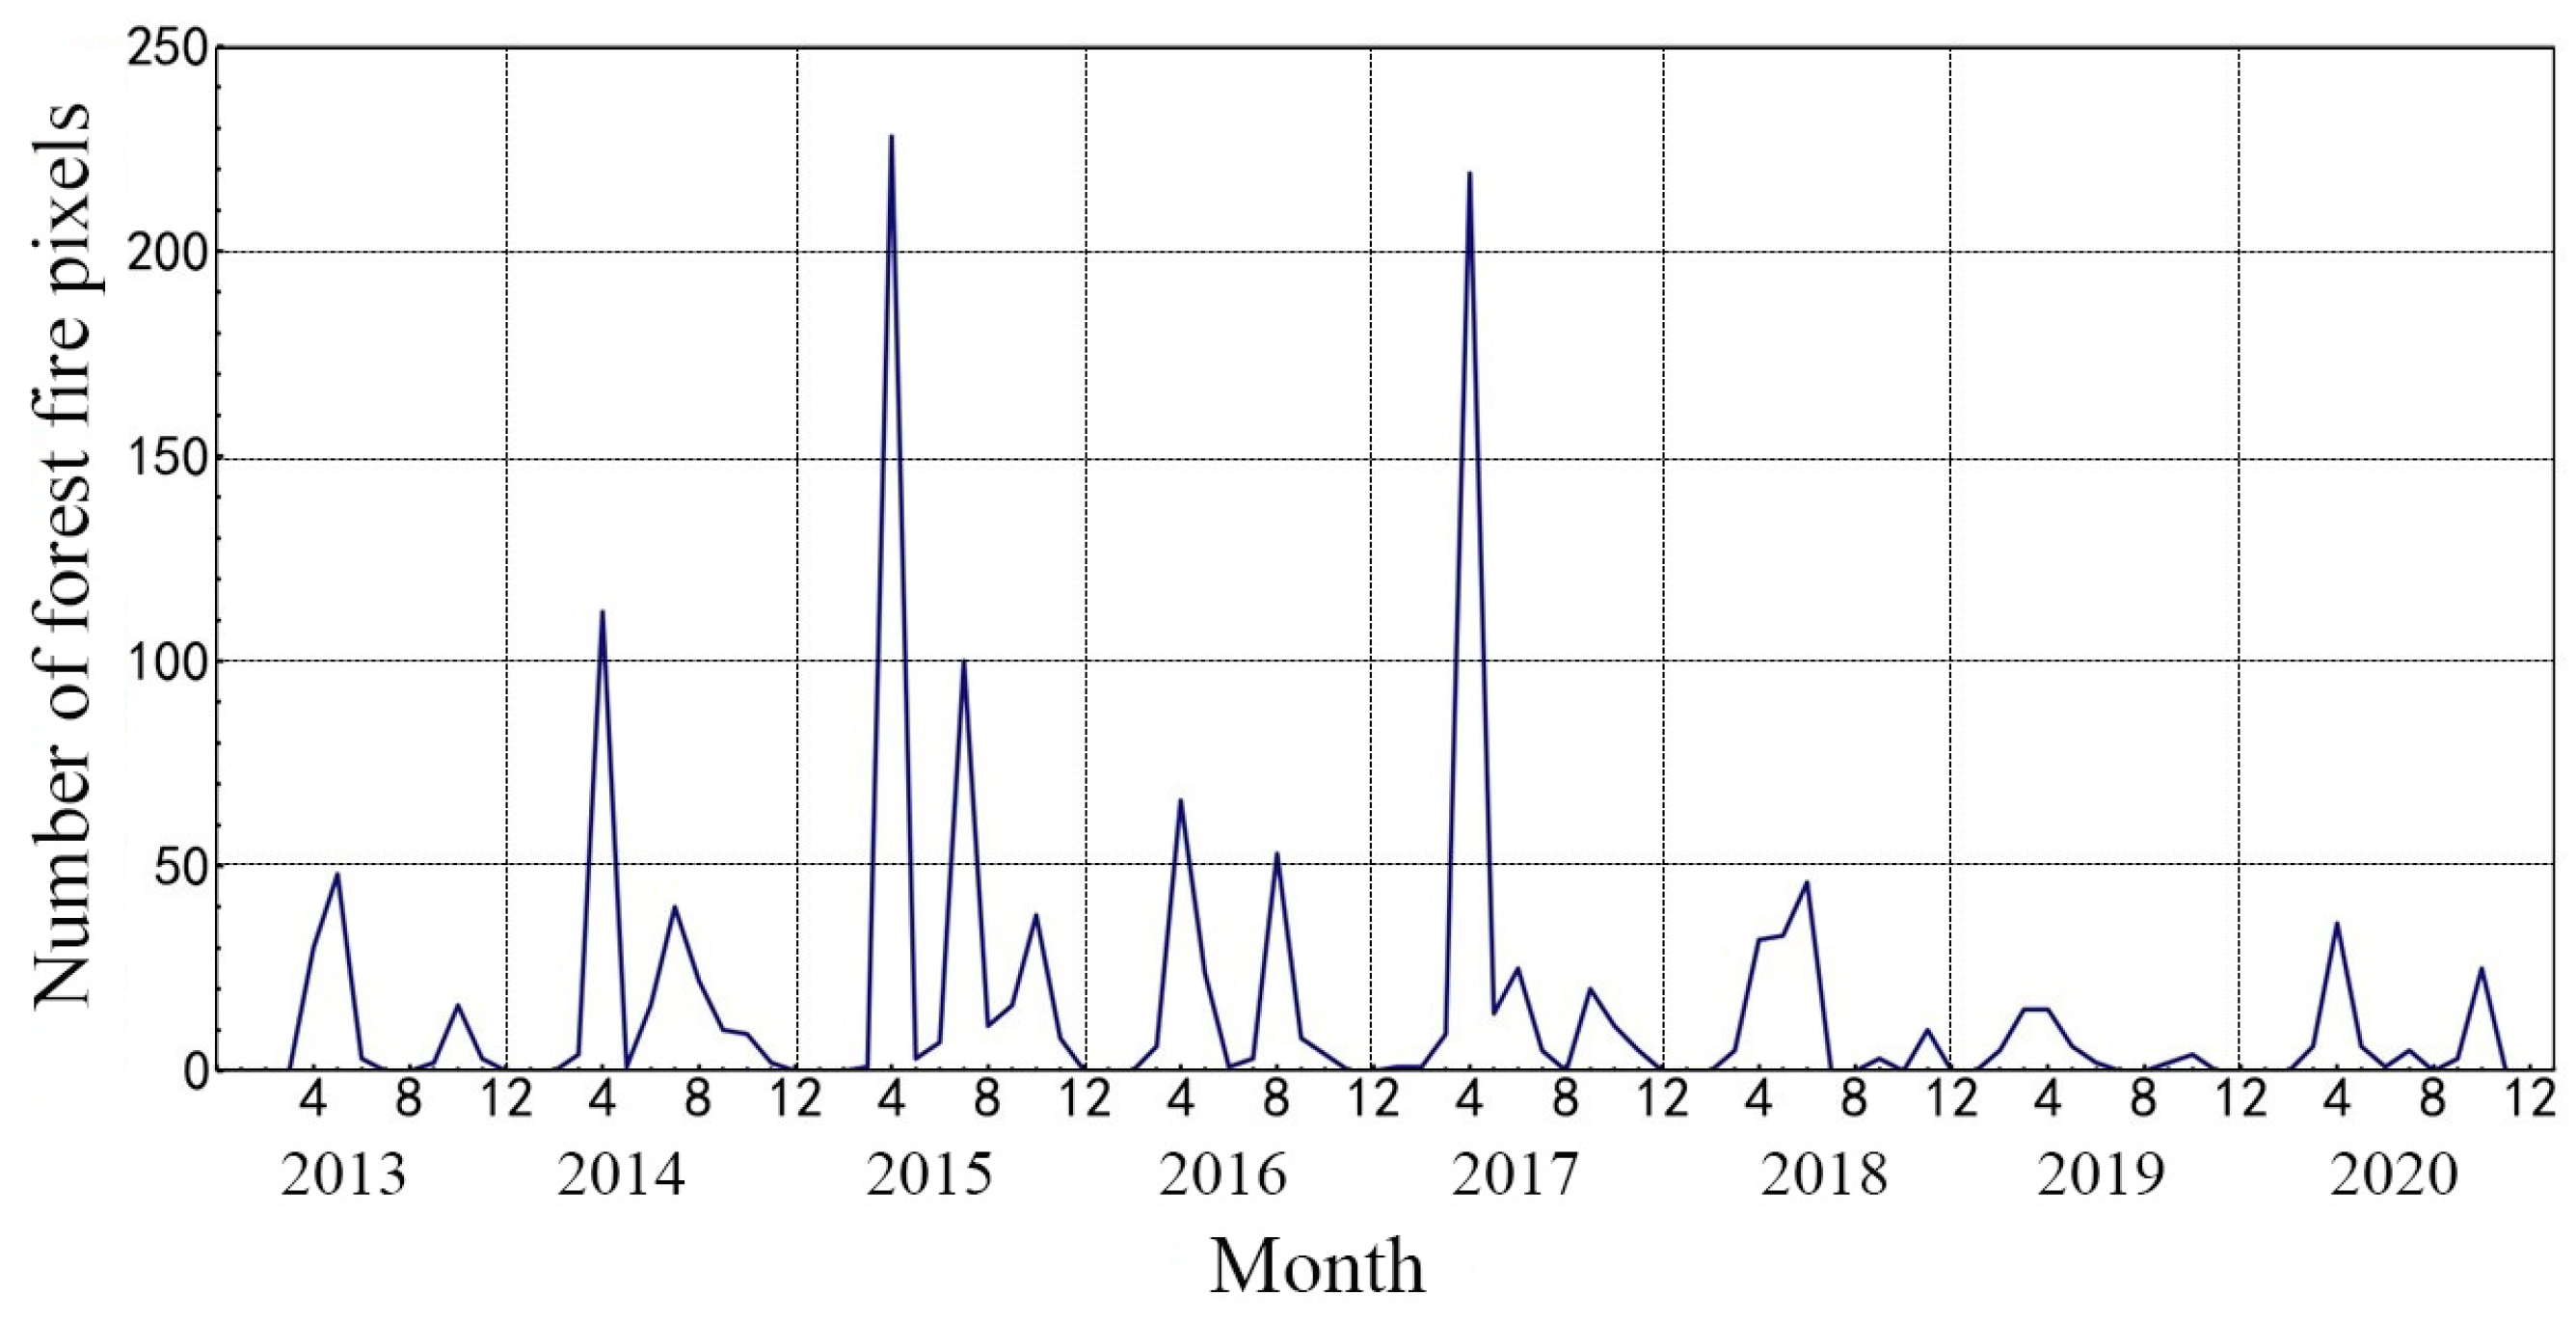
Figure 5.
Percentage of different types of forest fires in the jurisdiction of Heilongjiang Province, 2013–2020.
Figure 5.
Percentage of different types of forest fires in the jurisdiction of Heilongjiang Province, 2013–2020.
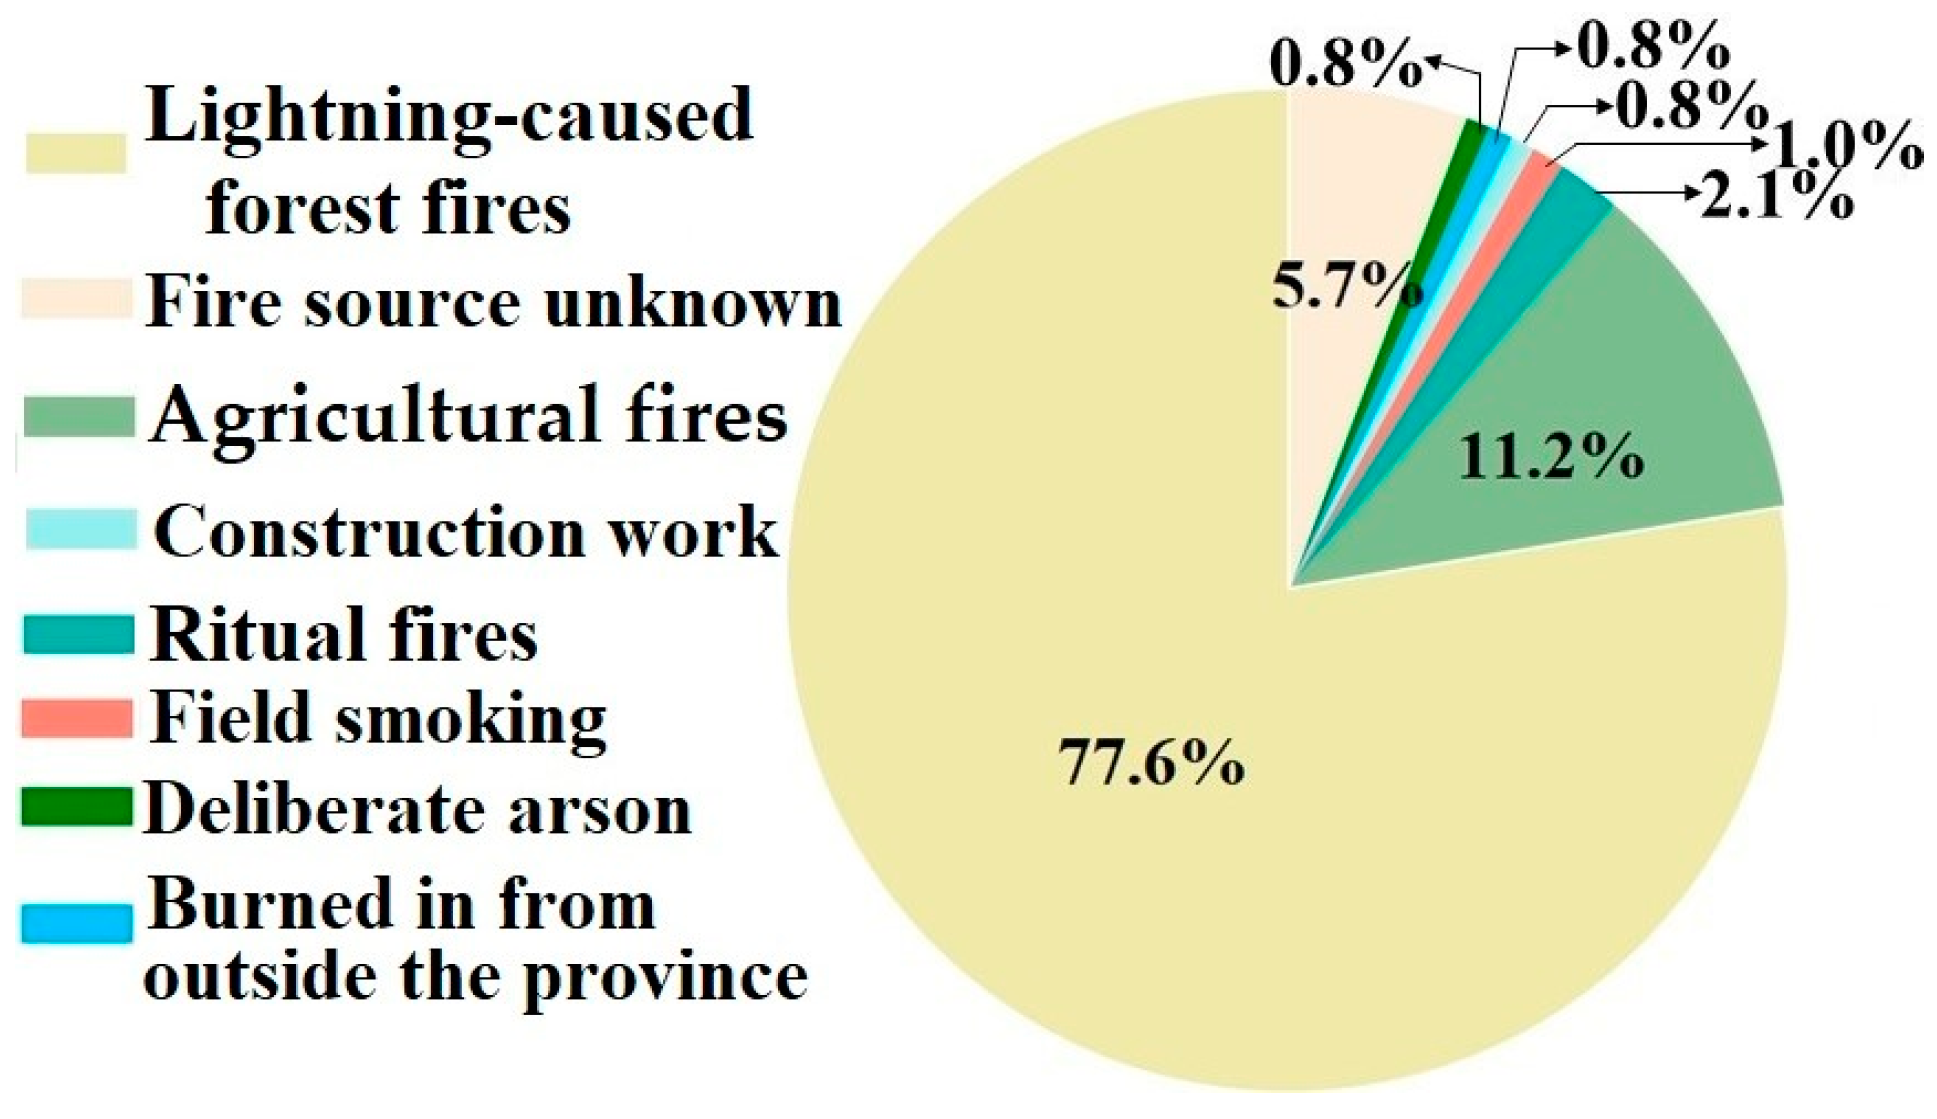
Figure 6.
Annual change in forest fires and lightning-caused forest fires, forest fires and lightning-caused forest fires detected by VIIRS, forest fires first detected by VIIRS, and forest fires first detected on the ground in Heilongjiang provincial jurisdictions, 2013–2020 (total height of bars is total number of forest fires and lightning-caused forest fires, shaded area is total number of forest fires and lightning-caused forest fires detected by VIIRS).
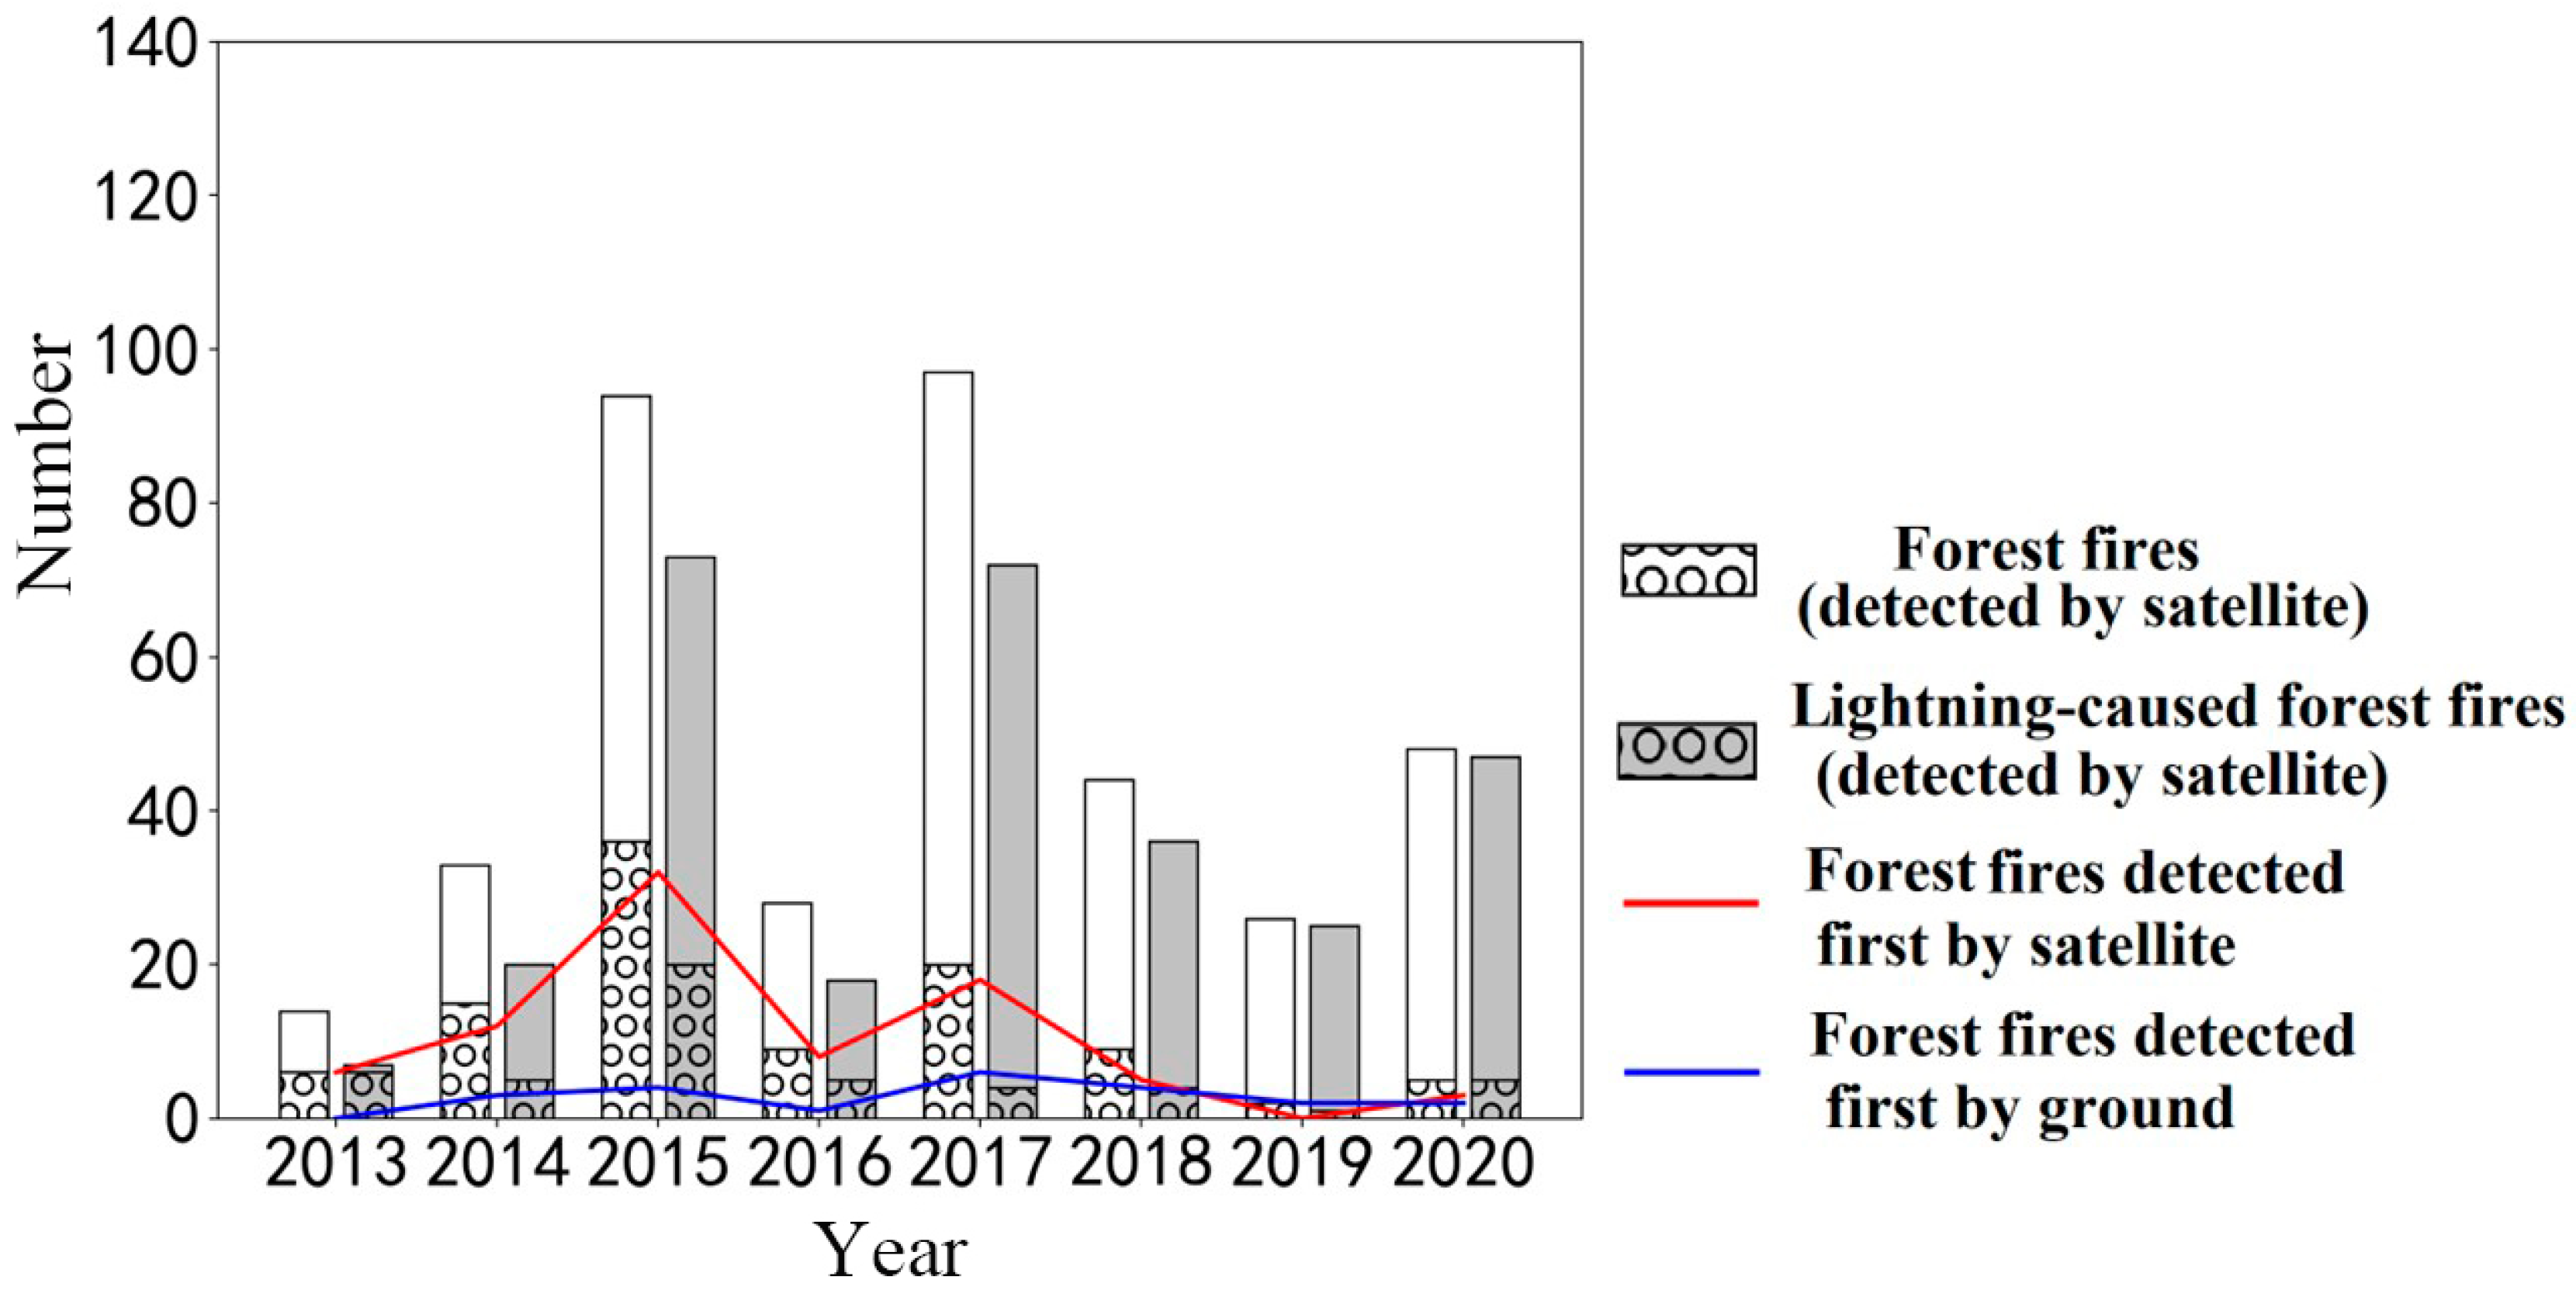
Figure 7.
Annual change in the proportion of forest fires detected by VIIRS and the proportion of lightning-caused forest fires in the jurisdiction of Heilongjiang Province from 2013 to 2020 (a) and linear correlation analysis between the two (b), where K is the total number of historical forest fires, I is the number of historical forest fires caused by lightning, and J is the number of historical forest fires detected by VIIRS.
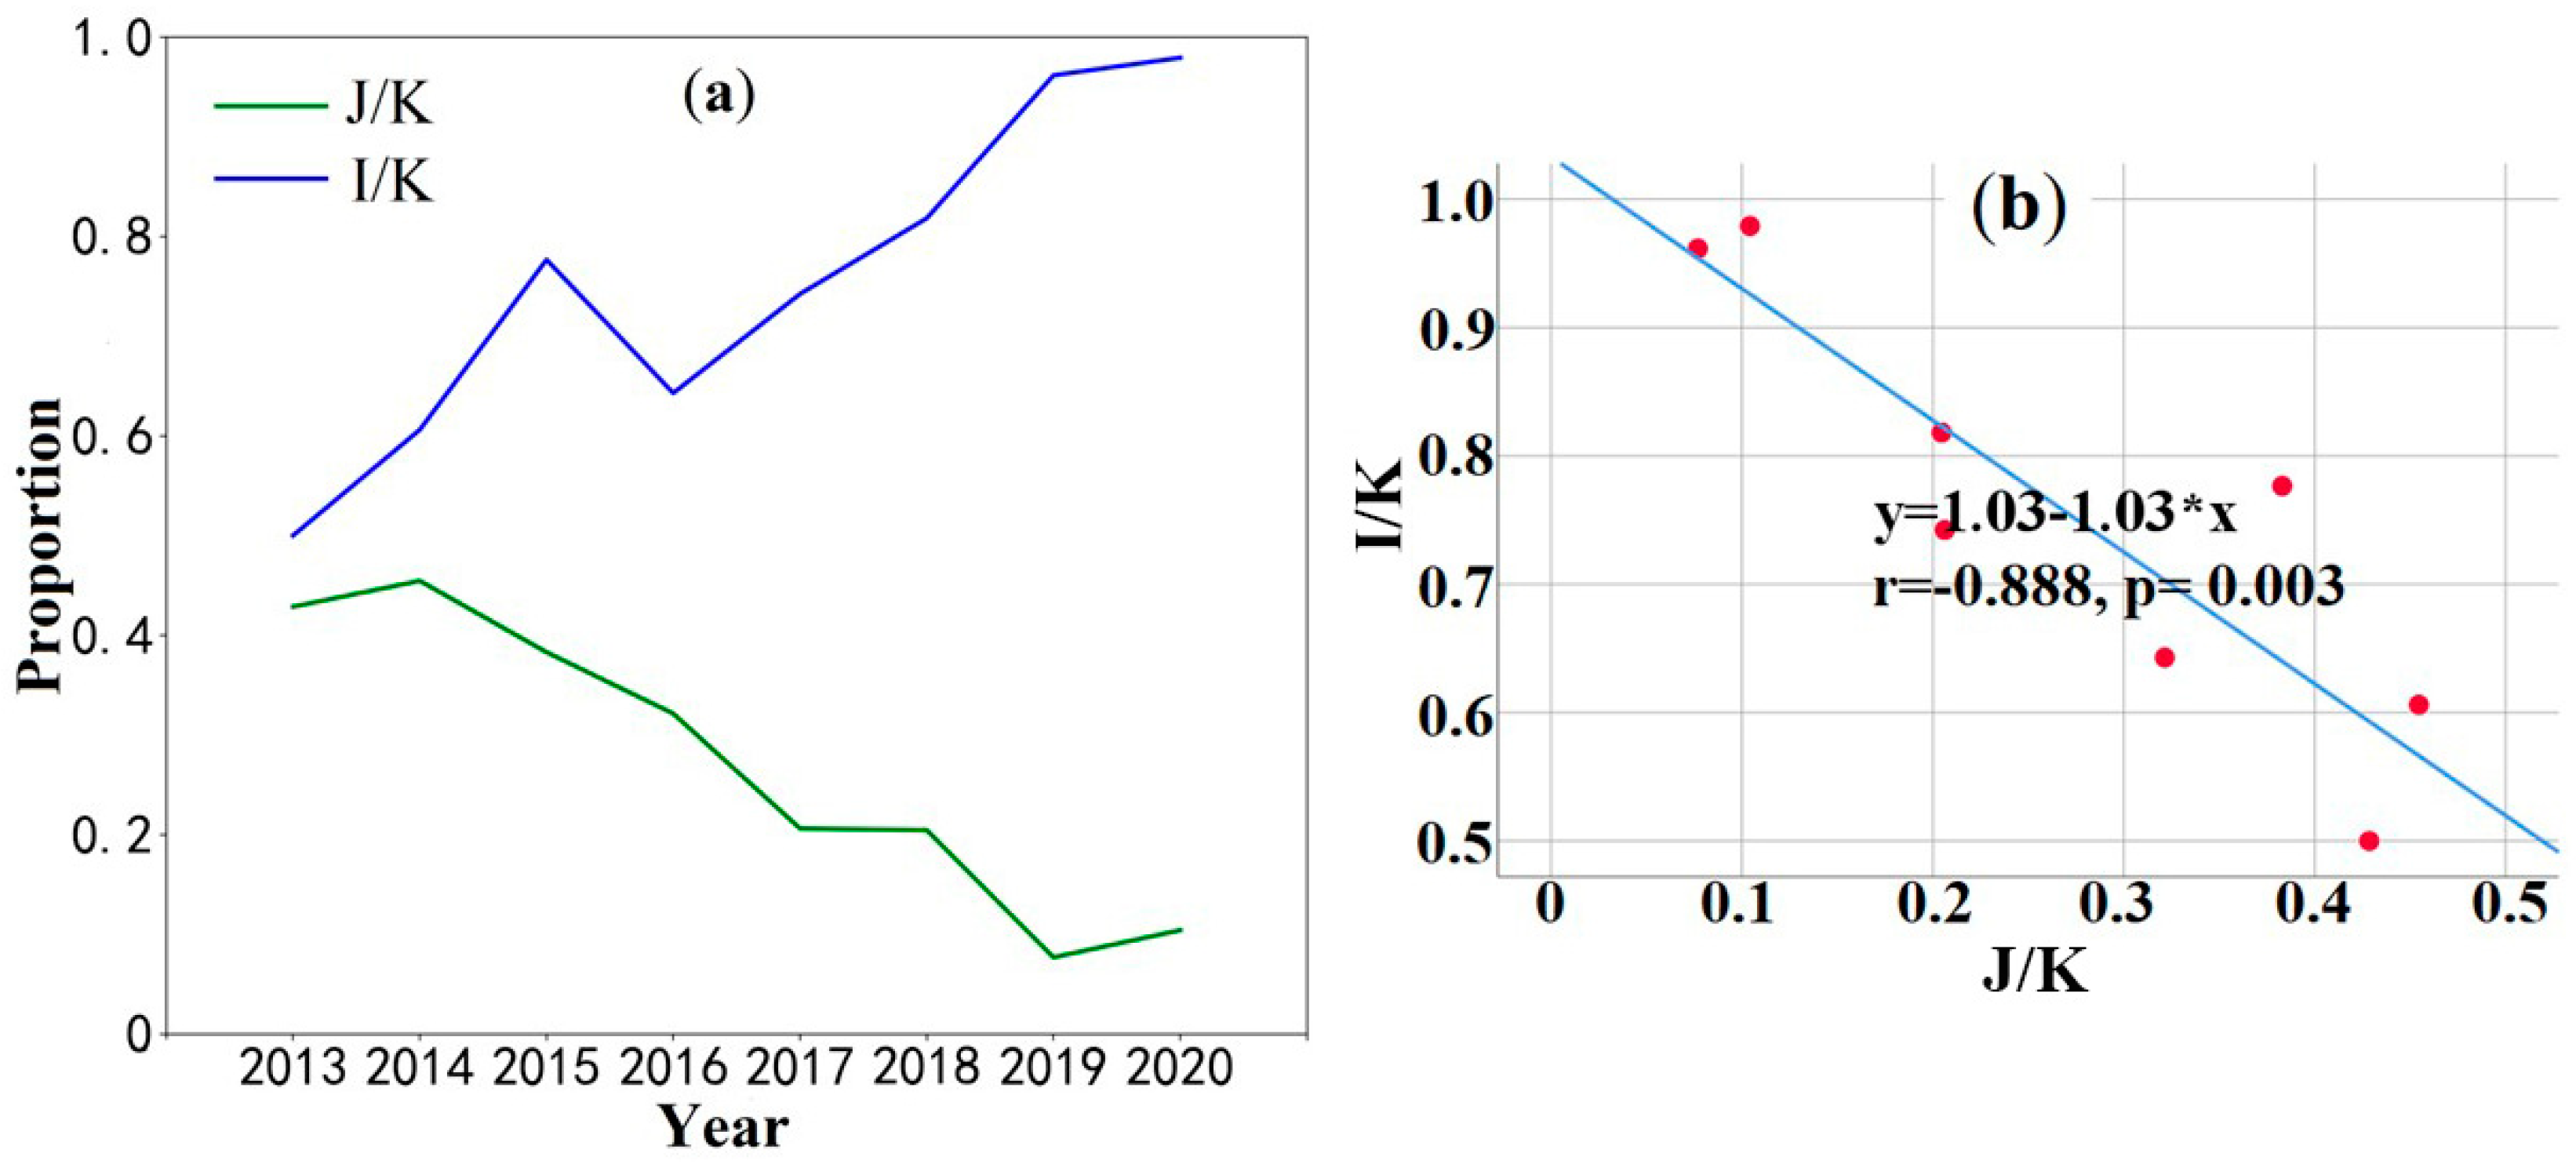
Figure 8.
Monthly variation (a) and spatial distribution (b) of lightning-caused forest fires in the jurisdictions of Heilongjiang Province, 2013–2020.
Figure 8.
Monthly variation (a) and spatial distribution (b) of lightning-caused forest fires in the jurisdictions of Heilongjiang Province, 2013–2020.
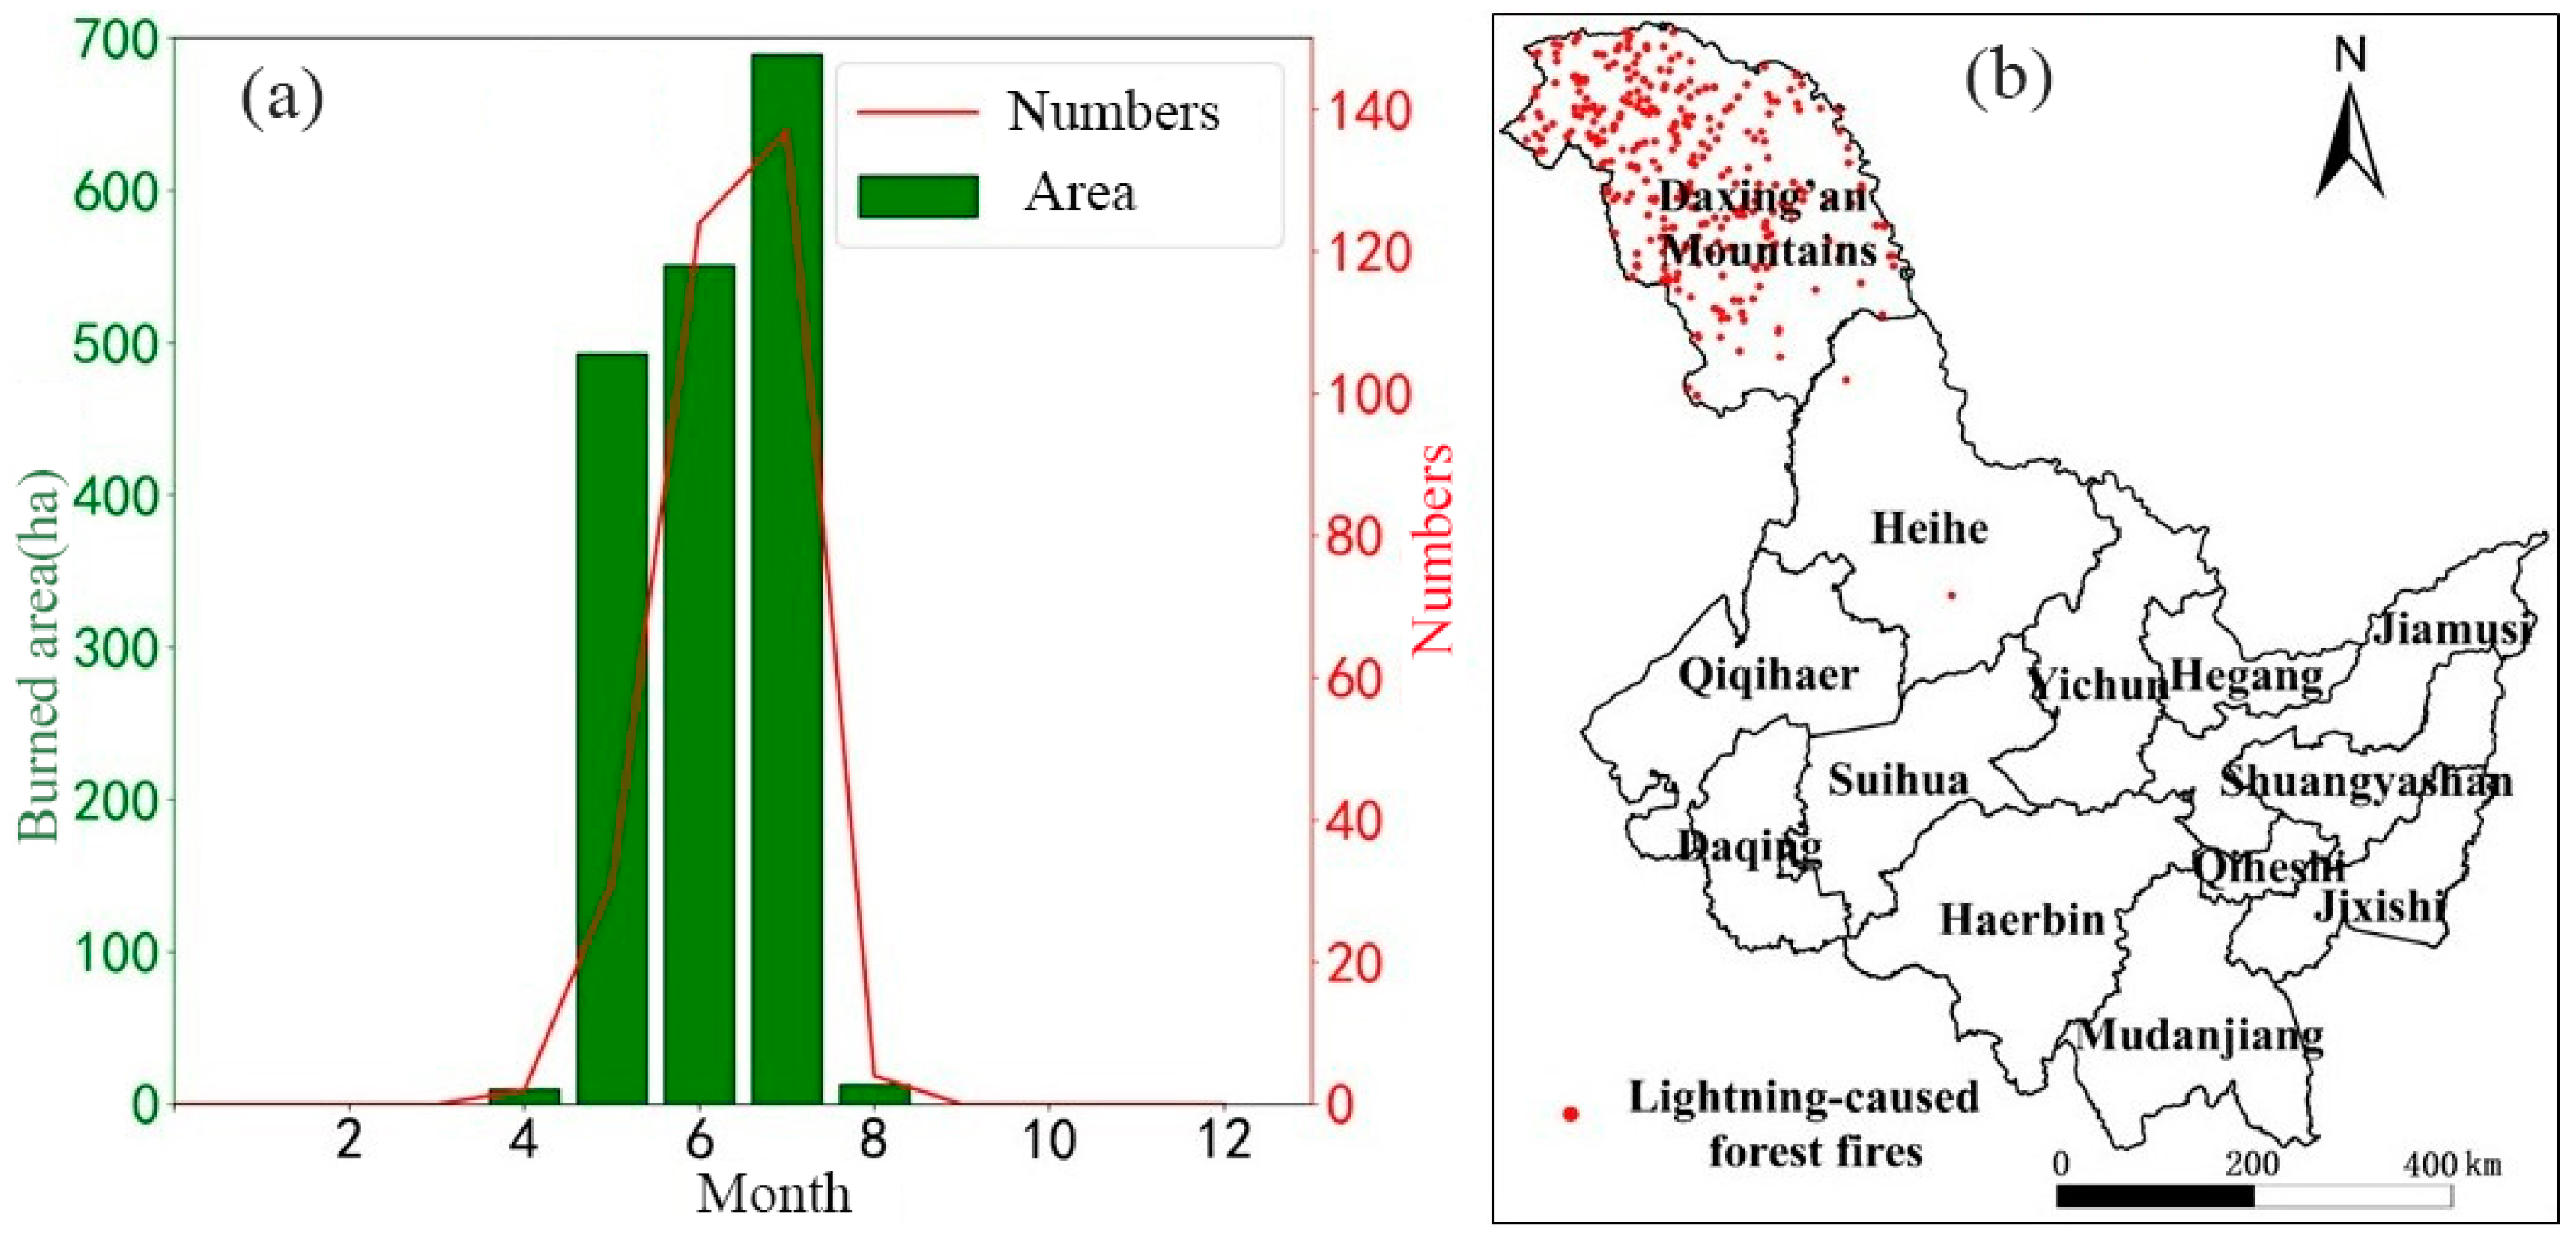
Figure 9.
Comparison of true color images before and after lightning-caused forest fires on 17 July 2015.
Figure 9.
Comparison of true color images before and after lightning-caused forest fires on 17 July 2015.

Figure 10.
True color images from the time of the lightning-caused forest fires on 31 May 2018.

Table 1.
Comparison of the number of forest fire pixels, number of occurrences, and area burned in the jurisdiction of Heilongjiang Province, 2013–2020.
Table 1.
Comparison of the number of forest fire pixels, number of occurrences, and area burned in the jurisdiction of Heilongjiang Province, 2013–2020.
| Year | Pixels | Numbers | Burned Areas (ha) |
|---|---|---|---|
| 2013 | 102 (7.0%) | 14 (3.6%) | 11.01 (0.4%) |
| 2014 | 216 (14.8%) | 33 (8.6%) | 141.82 (4.7%) |
| 2015 | 412 (28.3%) | 94 (24.5%) | 158.01 (5.2%) |
| 2016 | 165 (11.3%) | 28 (7.3%) | 42.54 (1.4%) |
| 2017 | 310 (21.3%) | 97 (25.3%) | 238.66 (7.9%) |
| 2018 | 129 (8.9%) | 44 (11.5%) | 2411.58 (79.5%) |
| 2019 | 49 (3.4%) | 26 (6.8%) | 4.71 (0.2%) |
| 2020 | 82 (5.6%) | 48 (12.5%) | 26.60 (0.9%) |
| Total | 1456 | 384 | 3034.936 |
Table 2.
Number and area of lightning-caused forest fires not detected by VIIRS due to various reasons in the jurisdiction of Heilongjiang Province, 2013–2020.
Table 2.
Number and area of lightning-caused forest fires not detected by VIIRS due to various reasons in the jurisdiction of Heilongjiang Province, 2013–2020.
| Reasons | Numbers | Area (ha) |
|---|---|---|
| Cloud cover | 141 | 42.018 |
| No satellite transit | 101 | 37.573 |
| Other | 12 | 1.630 |
| Total | 254 | 81.221 |
Disclaimer/Publisher’s Note: The statements, opinions and data contained in all publications are solely those of the individual author(s) and contributor(s) and not of MDPI and/or the editor(s). MDPI and/or the editor(s) disclaim responsibility for any injury to people or property resulting from any ideas, methods, instructions or products referred to in the content. |
© 2023 by the authors. Licensee MDPI, Basel, Switzerland. This article is an open access article distributed under the terms and conditions of the Creative Commons Attribution (CC BY) license (https://creativecommons.org/licenses/by/4.0/).
Share and Cite
MDPI and ACS Style
Jiao, Q.; Fan, M.; Tao, J.; Wang, W.; Liu, D.; Wang, P. Forest Fire Patterns and Lightning-Caused Forest Fire Detection in Heilongjiang Province of China Using Satellite Data. Fire 2023, 6, 166. https://doi.org/10.3390/fire6040166
AMA Style
Jiao Q, Fan M, Tao J, Wang W, Liu D, Wang P. Forest Fire Patterns and Lightning-Caused Forest Fire Detection in Heilongjiang Province of China Using Satellite Data. Fire. 2023; 6(4):166. https://doi.org/10.3390/fire6040166
Chicago/Turabian StyleJiao, Qiangying, Meng Fan, Jinhua Tao, Weiye Wang, Di Liu, and Ping Wang. 2023. "Forest Fire Patterns and Lightning-Caused Forest Fire Detection in Heilongjiang Province of China Using Satellite Data" Fire 6, no. 4: 166. https://doi.org/10.3390/fire6040166