Article

Regional-Scale Assessment of Burn Scar Mapping in Southwestern Amazonia Using Burned Area Products and CBERS/WFI Data Cubes

by
Poliana Domingos Ferro
1,2,
Guilherme Mataveli
1,3,*,
Jeferson de Souza Arcanjo
1,
Débora Joana Dutra
4,
Thaís Pereira de Medeiros
1,
Yosio Edemir Shimabukuro
1,
Ana Carolina Moreira Pessôa
5,
Gabriel de Oliveira
6,7 and
Liana Oighenstein Anderson
4
1
Earth Observation and Geoinformatics Division, National Institute for Space Research (INPE), São José dos Campos 12227-010, SP, Brazil
2
Federal Institute of Education, Science and Technology of Acre (IFAC), Xapuri 69930-000, AC, Brazil
3
School of Environmental Sciences, Tyndall Centre for Climate Change Research, University of East Anglia, Norwich NR4 7TJ, UK
4
National Center for Monitoring and Early Warning of Natural Disasters (CEMADEN), São José dos Campos 12247-016, SP, Brazil
5
Instituto de Pesquisa Ambiental da Amazônia (IPAM), Brasília 70836-520, DF, Brazil
6
Department of Earth Sciences, University of South Alabama, Mobile, AL 36688, USA
7
Stokes School of Marine and Environmental Sciences, University of South Alabama, Mobile, AL 36688, USA
*
Author to whom correspondence should be addressed.
Submission received: 31 December 2023 / Revised: 21 February 2024 / Accepted: 23 February 2024 / Published: 25 February 2024
(This article belongs to the Special Issue Remote Sensing of Wildfire: Regime Change and Disaster Response)

Abstract

:
Fires are one of the main sources of disturbance in fire-sensitive ecosystems such as the Amazon. Any attempt to characterize their impacts and establish actions aimed at combating these events presupposes the correct identification of the affected areas. However, accurate mapping of burned areas in humid tropical forest regions remains a challenging task. In this paper, we evaluate the performance of four operational BA products (MCD64A1, Fire_cci, GABAM and MapBiomas Fogo) on a regional scale in the southwestern Amazon and propose a new approach to BA mapping using fraction images extracted from data cubes of the Brazilian orbital sensors CBERS-4/WFI and CBERS-4A/WFI. The methodology for detecting burned areas consisted of applying the Linear Spectral Mixture Model to the images from the CBERS-4/WFI and CBERS-4A/WFI data cubes to generate shadow fraction images, which were then segmented and classified using the ISOSEG non-supervised algorithm. Regression and similarity analyses based on regular grid cells were carried out to compare the BA mappings. The results showed large discrepancies between the mappings in terms of total area burned, land use and land cover affected (forest and non-forest) and spatial location of the burned area. The global products MCD64A1, GABAM and Fire_cci tended to underestimate the area burned in the region, with Fire_cci underestimating BA by 88%, while the regional product MapBiomas Fogo was the closest to the reference, underestimating by only 7%. The burned area estimated by the method proposed in this work (337.5 km2) was 12% higher than the reference and showed a small difference in relation to the MapBiomas Fogo product (18% more BA). These differences can be explained by the different datasets and methods used to detect burned areas. The adoption of global products in regional studies can be critical in underestimating the total area burned in sensitive regions. Our study highlights the need to develop approaches aimed at improving the accuracy of current global products, and the development of regional burned area products may be more suitable for this purpose. Our proposed approach based on WFI data cubes has shown high potential for generating more accurate regional burned area maps, which can refine BA estimates in the Amazon.

1. Introduction

Fire is an important agent of landscape transformation, which negatively affects fire-sensitive ecosystems, such as the Amazon [1]. Except during extreme climate events, the natural occurrence of fires in rainforest regions is extremely rare, as the moist microclimate, high levels of rainfall and the lack of dry fuel create unfavorable conditions for the start and spread of fire [1,2,3]. Nonetheless, every year, thousands of hectares of old-growth forests are burned in the Amazon [4], especially during the dry season between August and October [5,6,7], leading to the degradation of large areas of forest [8,9]. Fires in this region are strongly associated with anthropogenic activities [10,11]. They are often used in pasture management to stimulate forage regrowth, and to control weeds, pests and diseases [10,12]. Fires are also used for deforestation, during the process of burning the felled vegetation to clear the land [13,14,15]. In addition, due to the low adoption of appropriate techniques for the use of fire, both management and deforestation fires often evolve into forest fires, as they escape into adjacent forest areas [12,16].
The burning of vegetation in the Amazon has numerous negative impacts, which include disrupting the stability of environmental and socioeconomic systems. The main impacts are related to an increase in tree mortality [17], changes in the structure and composition of forests [18,19,20], soil impoverishment [21], altering the water cycle [22,23], a decline in biodiversity and habitat integrity [24,25,26,27], and economic losses from the damage to infrastructure and plantations on rural properties [28]. In addition, greenhouse gas emissions and aerosols released by biomass burning modify the energy balance and chemistry of the atmosphere, contributing to global climate change [29,30], deteriorating air quality [11] and affecting human health [31,32]. These effects may also be exacerbated by the positive feedbacks between changes in land use, fire activity and climate anomalies [29,33,34,35,36,37,38,39,40,41].
Recently, there has been an increase in the incidence of fires in the Amazon associated with escalating deforestation [4,42] and the amplification of forest fragmentation [43,44,45]. Extreme drought events have also contributed considerably to the rise in the occurrence and extent of burned area (BA) in the last few decades. For example, during the extreme drought event of 2005, there was an increase of 33% in active fires in the region compared to the period 1999–2005 [46], and an increase of 51% and 99% in the total forest BA during the droughts of 2015 and 2016 compared to the average of the last ten years [47]. As an aggravating factor, climate projections point to an increase in the frequency and intensity of these anomalous climatic events in the Amazon, leading to intensified fire weather conditions [48,49]. Given the predicted uptick in fire occurrence, fire management and prevention will be increasingly important to maintain ecosystem functioning and the services they offer, which influence human well-being; therefore, this issue is a huge present and future challenge for society and governments [1,9].
Mapping areas affected by fires can support the analysis and characterization of fire dynamics and its impacts on vegetation, providing decision-makers with important information for formulating efficient fire prevention and mitigation actions [50,51]. In this context, remote sensing techniques are particularly useful for monitoring the occurrence of fire and extracting information about BA [52,53]. However, mapping BA in tropical forest regions and obtaining its true extent is a challenging task. Firstly, because persistent cloud cover limits optical observations of areas affected by fire [54]. Secondly, because the climatic characteristics of the region favor the rapid recovery of the spectral signature of post-fire vegetation limiting the detection capacity of low temporal resolution sensors [55]. In addition, the closed canopies limit the detection of understory fires, and the presence of small burn scars is not captured by coarser-resolution sensors [56,57].
In recent years, several initiatives have developed operational products, based on orbital sensors, that map BA at global and regional scales, based on different methodological approaches and multiple sensors [57,58]. Therefore, discrepancies among these products are observed, including the extent of BA and in its spatial and temporal patterns, which vary significantly according to the biome and scale of analysis [59,60,61,62,63,64,65]. In some regions of the Amazon, the difference between BA estimates can reach up to 160 times in areas of forest cover [63], which significantly affects the accounting of impacts associated with fire, such as carbon emissions [66,67]. These variations between BA products are associated with the characteristics and specifications of each product [68,69]. Global BA products (e.g., MCD64A1 and Fire_cci), despite the high temporal resolution of MODIS (twice a day), do not detect small-scale BA and have difficulty in identifying understory fires due to their coarser spatial resolution (250–500 m) [55,62,63]. On the contrary, GABAM and MapBiomas Fogo products, with medium spatial resolution (30 m), are more suitable for estimating small burn scars [70,71], but are limited to a few monthly observations (every 16 days), which decreases the likelihood of smoke and cloud-free BA scar observations [64,72].
In this context, to circumvent these difficulties in mapping BA, there is the possibility of exploring the combination of medium spatial resolution images (64 m and 55 m) obtained from the Brazilian Wide Field Imaging Camera (WFI) sensor onboard the CBERS-4 and CBERS-4A satellites, with a temporal resolution of 3 to 5 days when considering both satellites. One way of managing and taking advantage of the large collection of images available from the WFI sensors, reducing interference from clouds, geometric and atmospheric noise that hinders object analysis and demands processing time, is to use the data cubes product provided by the Brazil Data Cube (BDC) project initiative [73,74]. In addition, adopting image processing techniques that emphasize the spectral information of BA facilitates the digital interpretation process and increases the chances of generating more accurate and cohesive maps. One technique that has been widely used for BA mapping is the use of the shade fraction images, derived from spectral mixing models [65,75,76,77,78,79]. Although recent initiatives have used data cubes to improve mapping classification in Brazil [80,81,82,83], none of them have focused on BA mapping nor on exploring the potential of WFI data cubes combined with the linear spectral mixing model.
Thus, this research aimed to (i) evaluate the performance of four operational BA products (MCD64A1, Fire_cci, Gabam and MapBiomas Fogo) at a regional scale in southwestern Amazonia, considering the total BA detected in forest and non-forest land covers; (ii) propose a novel BA mapping approach using fraction images extracted from CBERS-4/WFI and CBERS-4A/WFI data cubes; and (iii) compare the differences and similarities between the four operational BA products, the results of the proposed approach, with a reference BA map based on Sentinel-2/MSI and Planet images.

2. Materials and Methods

2.1. Study Area

The study area is located in the southwestern Brazilian Amazon, in the state of Rondônia, covering the municipalities of Nova Mamoré, Porto Velho, Buritis and Guajará-Mirim with a total area of 3296 km2 (Figure 1). Approximately 50% of the area is occupied by the following protected areas: the Karipuna Indigenous Land, the Guajará-Mirim State Park, the Jaci-Paraná Extractive Reserve and the Igarapé Lage Indigenous Land. The region is inserted in the zone of influence of the BR-421 and RO-420 highways, one of the most conflictive areas in the state of Rondônia, with high rates of deforestation [84,85,86]. The region is also characterized by the incidence of fires [87], induced by the accelerated process of illegal occupation in these protected areas since 2014, following the expansion of the road network within them [85,88].
The region’s vegetation cover consists of dense ombrophilous forest, open ombrophilous forest, and small patches of savanna/forest ecotones [89]. The climate is classified as Am, which indicates tropical rainy weather, characterized by average annual temperatures of 26 °C and an average annual rainfall of 2000 mm [90]. There are two well-defined seasons in the region: the rainy season, spanning from October to April, and the dry season, lasting from May to September. There is also a higher incidence of active fires between July and September [91], coinciding with the peak of the dry season. The landscape is influenced by the expansion of livestock, and the use of fire for agricultural management and clearing areas after deforestation [85,86].

2.2. Methodological Overview and Remote Sensing Datasets

The research was conducted according to the structure summarized in the flowchart below (Figure 2). The initial steps consisted of (I) selecting three global BA products and one regional product; (II) mapping BA using CBERS-4/WFI and CBERS-4A/WFI data cubes combined with the linear spectral mixing model; (III) obtaining a reference BA map to compare the products; (IV) using the forest and non-forest cover map to obtain the burned area estimates by land cover; and finally (V) performing the statistical and similarity analyses based on grid cells.

2.2.1. Burned Area Products

Currently, there are several open-access operational BA products available. Among the global ones, three products widely used in the Amazon were selected (MCD64A1 c6.0, Fire_cci v5.1 and GABAM). At the regional scale, a more recently developed product tailored specifically for Brazil (MapBiomas Fogo c1.0) was selected.
MCD64A1 collection 6.0 is a 500 m spatial resolution monthly global BA product developed by the National Aeronautics and Space Administration (NASA) based on surface reflectance data from the Moderate-Resolution Imaging Spectroradiometer (MODIS) sensors onboard the Terra and Aqua satellites, incorporated with data from 1 km active fire observations [92]. The algorithm employs a burn-sensitive vegetation index (VI) to create dynamic thresholds that are applied to the composite data [92]. In addition, the product has been applied as input for the development of other BA products and for biomass burning emissions models [11,93].
Fire_cci version 5.1 is a 250 m spatial resolution monthly global BA product developed by the European Space Agency (ESA) as part of the Climate Change Initiative (CCI) program. The product inputs are MODIS 250 m surface reflectance bands, active fire information and quality masks. The BA classification algorithm uses a two-phase approach, based on seed detection and region growth. The latest version has been improved from v5.0 [94], including a new concept of cluster-based adaptive thresholding [95] and an expanded period of analysis, until 2020.
GABAM is the operational global BA product with the best spatial resolution currently available. It was developed by China’s Aerospace Information Research Institute (RAD) in collaboration with the Chinese Academy of Sciences (CAS). The product is based on an automated algorithm implemented in GEE, which uses 30 m spatial resolution Landsat reflectance data and spectral indices as inputs in the Random Forest algorithm, and a region-growing approach [70]. Data are available from 1985, aggregated into bi-annual composites until the year 2000 and annual composites from 2000 onward.
MapBiomas Fogo collection 1.0 is the first version of the regional burned area product available for Brazil, developed by the MapBiomas initiative [96]. The product uses surface reflectance Landsat mosaics with a spatial resolution of 30 m and machine learning models for pattern recognition, implemented in Google Earth Engine (GEE) [71]. The method consists of generating annual quality mosaics from minimum NBR index values and collecting samples of both burned and unburned areas for training the Deep Neural Network (DNN) classification model. In post-classification, spatial filters and masks are used to remove noise and reduce the commission error [71]. Estimates of BA from collection 1 are available from 1985 to 2021 in monthly and annual composites. The general characteristics of each of the products can be seen in Table 1.
To perform the analyses, it was necessary to standardize the data obtained from the BA products. The data were acquired in raster format, precisely extracted for the study area. The monthly estimates of BA products (MCD64A1, Fire_cci and MapBiomas Fogo) were aggregated into annual composites for the year 2020, aiming to standardize with the GABAM product.

2.2.2. Burned Area Map with CBERS-4/WFI and CBERS-4A/WFI Data Cubes

The CBERS-4 and CBERS-4A satellites constitute the environmental monitoring program developed by the partnership between Brazil and China [97]. The Wide Field Imaging Camera (WFI) sensor is onboard both satellites, although with some differences regarding spatial resolution (64 m and 55 m) and imaging range (866 km and 684 km), due to variations in platform altitude. The sensor has four spectral bands, blue (0.45–0.52), green (0.52–0.59), red (0.63–0.69) and NIR (0.77–0.89). Operating in tandem, these satellites offer a revisit rate of 3 to 5 days, facilitating cloud-minimized image acquisition and BA mapping.
The WFI images are distributed by the National Institute for Space Research (INPE) in Digital Number (DN) and geometric correction levels L2 (corrected based on auxiliary data sent by the satellite) and L4 (corrected with control points and SRTM). More recently, they started to be distributed at the Surface Reflectance (SR) level, within the scope of the BDC project, in image collection format and multidimensional data cubes [73,98], available on the portal https://brazildatacube.dpi.inpe.br/portal/explore (accessed on 23 February 2024). Data cubes are essentially Analysis Ready Data (ARD), in which satellite images are processed under a minimum set of requirements, and their pixels are aligned in space and time [73]. This arrangement of data simplifies the analysis of large volumes of images and allows for immediate use by the final user [80,83]. The BDC data cubes are generated in the format of regular cubes, which require the definition of a regular time interval (e.g., one month or 16 days) that guides the temporal composition of multiple images available in each time interval, and their metadata are stored in a relational database called the Spatial Temporal Asset Catalog (STAC) [73].
In this work, the CBERS-4/WFI (64 m spatial resolution) and CBERS-4A/WFI (55 m spatial resolution) regular data cubes, generated using 16-day temporal compositing functions from the period of January to December 2020, were used. This compositing function is called the best pixel approach, which consists of classifying the images by selecting the optimal observations of pixels within the scenes during the specified period [73]. The composition guarantees cloud-free observations or observations with the least cloud cover in the time window. To ensure compatibility between the two data cubes for mapping purposes, the CBERS-4A/WFI data cube was resampled to the spatial resolution of 64 m.
The Linear Spectral Mixing Model (LSMM) was applied to the two WFI data cubes to generate the vegetation, soil and shade fraction images, based on selecting pixels that had the closest spectral response to the theoretical curve expected for the pure targets (endmembers) [75]. The LSMM considers that the pixel values of an image are the result of the combinations of reflectance of different endmembers contained in the pixel; consequently, the resulting images are the proportion of each endmember within each pixel [99]. The generation of these synthetic images is an alternative approach to reducing the dimensionality of an image’s data and highlighting the desired features of the targets for digital classification [64,65]. In this case, the shade fraction image was used to identify BA since its spectral response resembles the spectral response of the shadow, characterized by low reflectance.
The BAs were determined after the digital classification of the shade fraction images, similarly to [65,75,77,78,79]. In the first step, we applied the image segmentation technique on the shade fraction using the region-growing algorithm with the parameters of segment size and similarity thresholds (8, 60), respectively. Subsequently, the segmented images were classified using the ISOSEG unsupervised classifier, which employs the covariance matrix and the mean of the spectral values to estimate the class centers in each region [100]. Finally, we grouped the resulting classes into a binary classification between Burned and Unburned, selecting the burned class to compose the final map, called CBERS. All processing was carried out using Terra View software, version 5.6.5 [101].

2.2.3. Reference Map

A reference map containing the BA in 2020 was used to evaluate the burned area estimates derived from the BA products and the CBERS mapping. The map was generated through the visual and manual image interpretation of the polygons of BA identified in Sentinel-2A and 2B Multispectral Instrument (MSI) images, featuring a spatial resolution of 10 m, as well as in monthly mosaics of Planet images with a spatial resolution of approximately 5 m, both with geometric and surface reflectance corrections. All available images from January to December 2020 were used in this stage. Furthermore, active fire data from all sensors available in INPE’s BDQueimadas database [91] were used as ancillary information to classify the burn scars.

2.2.4. Forest and Non-Forest Mapping

The performance of burn scar mapping algorithms can vary depending on the land cover affected by the fires [63,65,102]. Generally, algorithms are more deficient in adequately mapping burn scars on forest cover, as detection on this type of cover is more challenging than on other land covers with lower biomass [103,104]. Thus, stratification of classes allows us to obtain independent assessments of the variations in the performance of BA algorithms [103].
A forest cover map of the year 2020 was used as ancillary data to estimate the areas degraded by fire in both forest and non-forest covers. This evaluation was conducted for each BA product, the reference map and the CBERS BA mapping. The map was generated through the reclassification of land use land cover (LULC) dataset from MapBiomas Brazil collection 6.0, which has 30 m spatial resolution [96]. The classes were divided into forest formation, water and non-forest (aggregation of the remaining LULC classes). The LULC dataset MapBiomas provides annual maps, freely available, which are based on automatic classifications of Landsat images carried out by a Random Forest machine learning algorithm implemented on Google Earth Engine [105].

2.2.5. Evaluation and Agreement Analysis

In order to evaluate the performance of the BA products and the CBERS mapping against the reference data, we first calculated the total estimates of burned areas in 2020. Subsequently, we derived estimates by taking into account the forest and non-forest classifications identified by each BA product, the CBERS mapping and the reference map. The total burned area is a crucial indicator of the performance of a burned area mapping algorithm [61].
A regular grid at the spatial resolution of 1 km was used to analyze the spatial agreement between the reference and BA mappings. This approach ensures homogeneity criteria in the assessment [106], thereby preventing misrecording in the calculation of proportional errors for burned area block sizes and bias in the estimation, overcoming the spatial and temporal limitations inherent to burned area maps [61,107]. The grid cell size was determined after carrying out preliminary tests with grid cells measuring 1 × 1 km, 5 × 5 km and 10 × 10 km (Figure 3). The process took into consideration (i) the size of the study area, the pixels of the burned area maps and the polygons of the burn scars; (ii) the spatial distribution of the scars; and (iii) scale effects. The first and the second items aimed to ensure greater detail and suitability for the analysis of the object of study and were analyzed based on an empirical approach, as suggested by Assis et al. [106]. The third consideration accounted for the scale effect on the statistical parameters’ results. Ultimately, it was determined that the grid with 1 × 1 km cells was the most suitable for this study.
The burned areas derived from the reference map, MapBiomas Fogo, MCD64A1, GABAM, Fire_cci and CBERS were then individually aggregated into 1 × 1 km cell grids. The aggregation consisted of summing the area of each BA pixel into the grid cells. Grid cells not indicating detection of burned areas from any of the analyzed burned area mappings were excluded. Then, the statistical metrics including the coefficient of determination (R2), Pearson’s correlation (R), Root Mean Square Error (RMSE), and Mean Biased (MB) were calculated. These analyses were performed using R language.
Agreement (similarity) analysis was conducted to investigate the spatial variations and inconsistencies among the BA mappings, following the approach employed by Pessoa et al. [63]. In this analysis, the same regular 1 × 1 km grid was adopted, which was converted into raster files containing the burned area information for each mapping. Only cells showing BA in at least one of the mappings were considered. Subsequently, the burned area maps were pairwise compared using the fuzzy numeric method implemented in Map Comparison Kit 3 (MCK) software [108]. This method allowed us to obtain the location and degree of the similarities between pairs of cells of two numeric maps. The outcome is a similarity index ranging between 0 (completely distinct) and 1 (completely identical). It also takes the neighborhood of cells into account to evaluate this similarity [109]. The resulting statistic is the average similarity over the entire area. The parameters employed included the exponential decay function with a halving distance equal to 2 and a neighborhood radius equal to 4.

3. Results

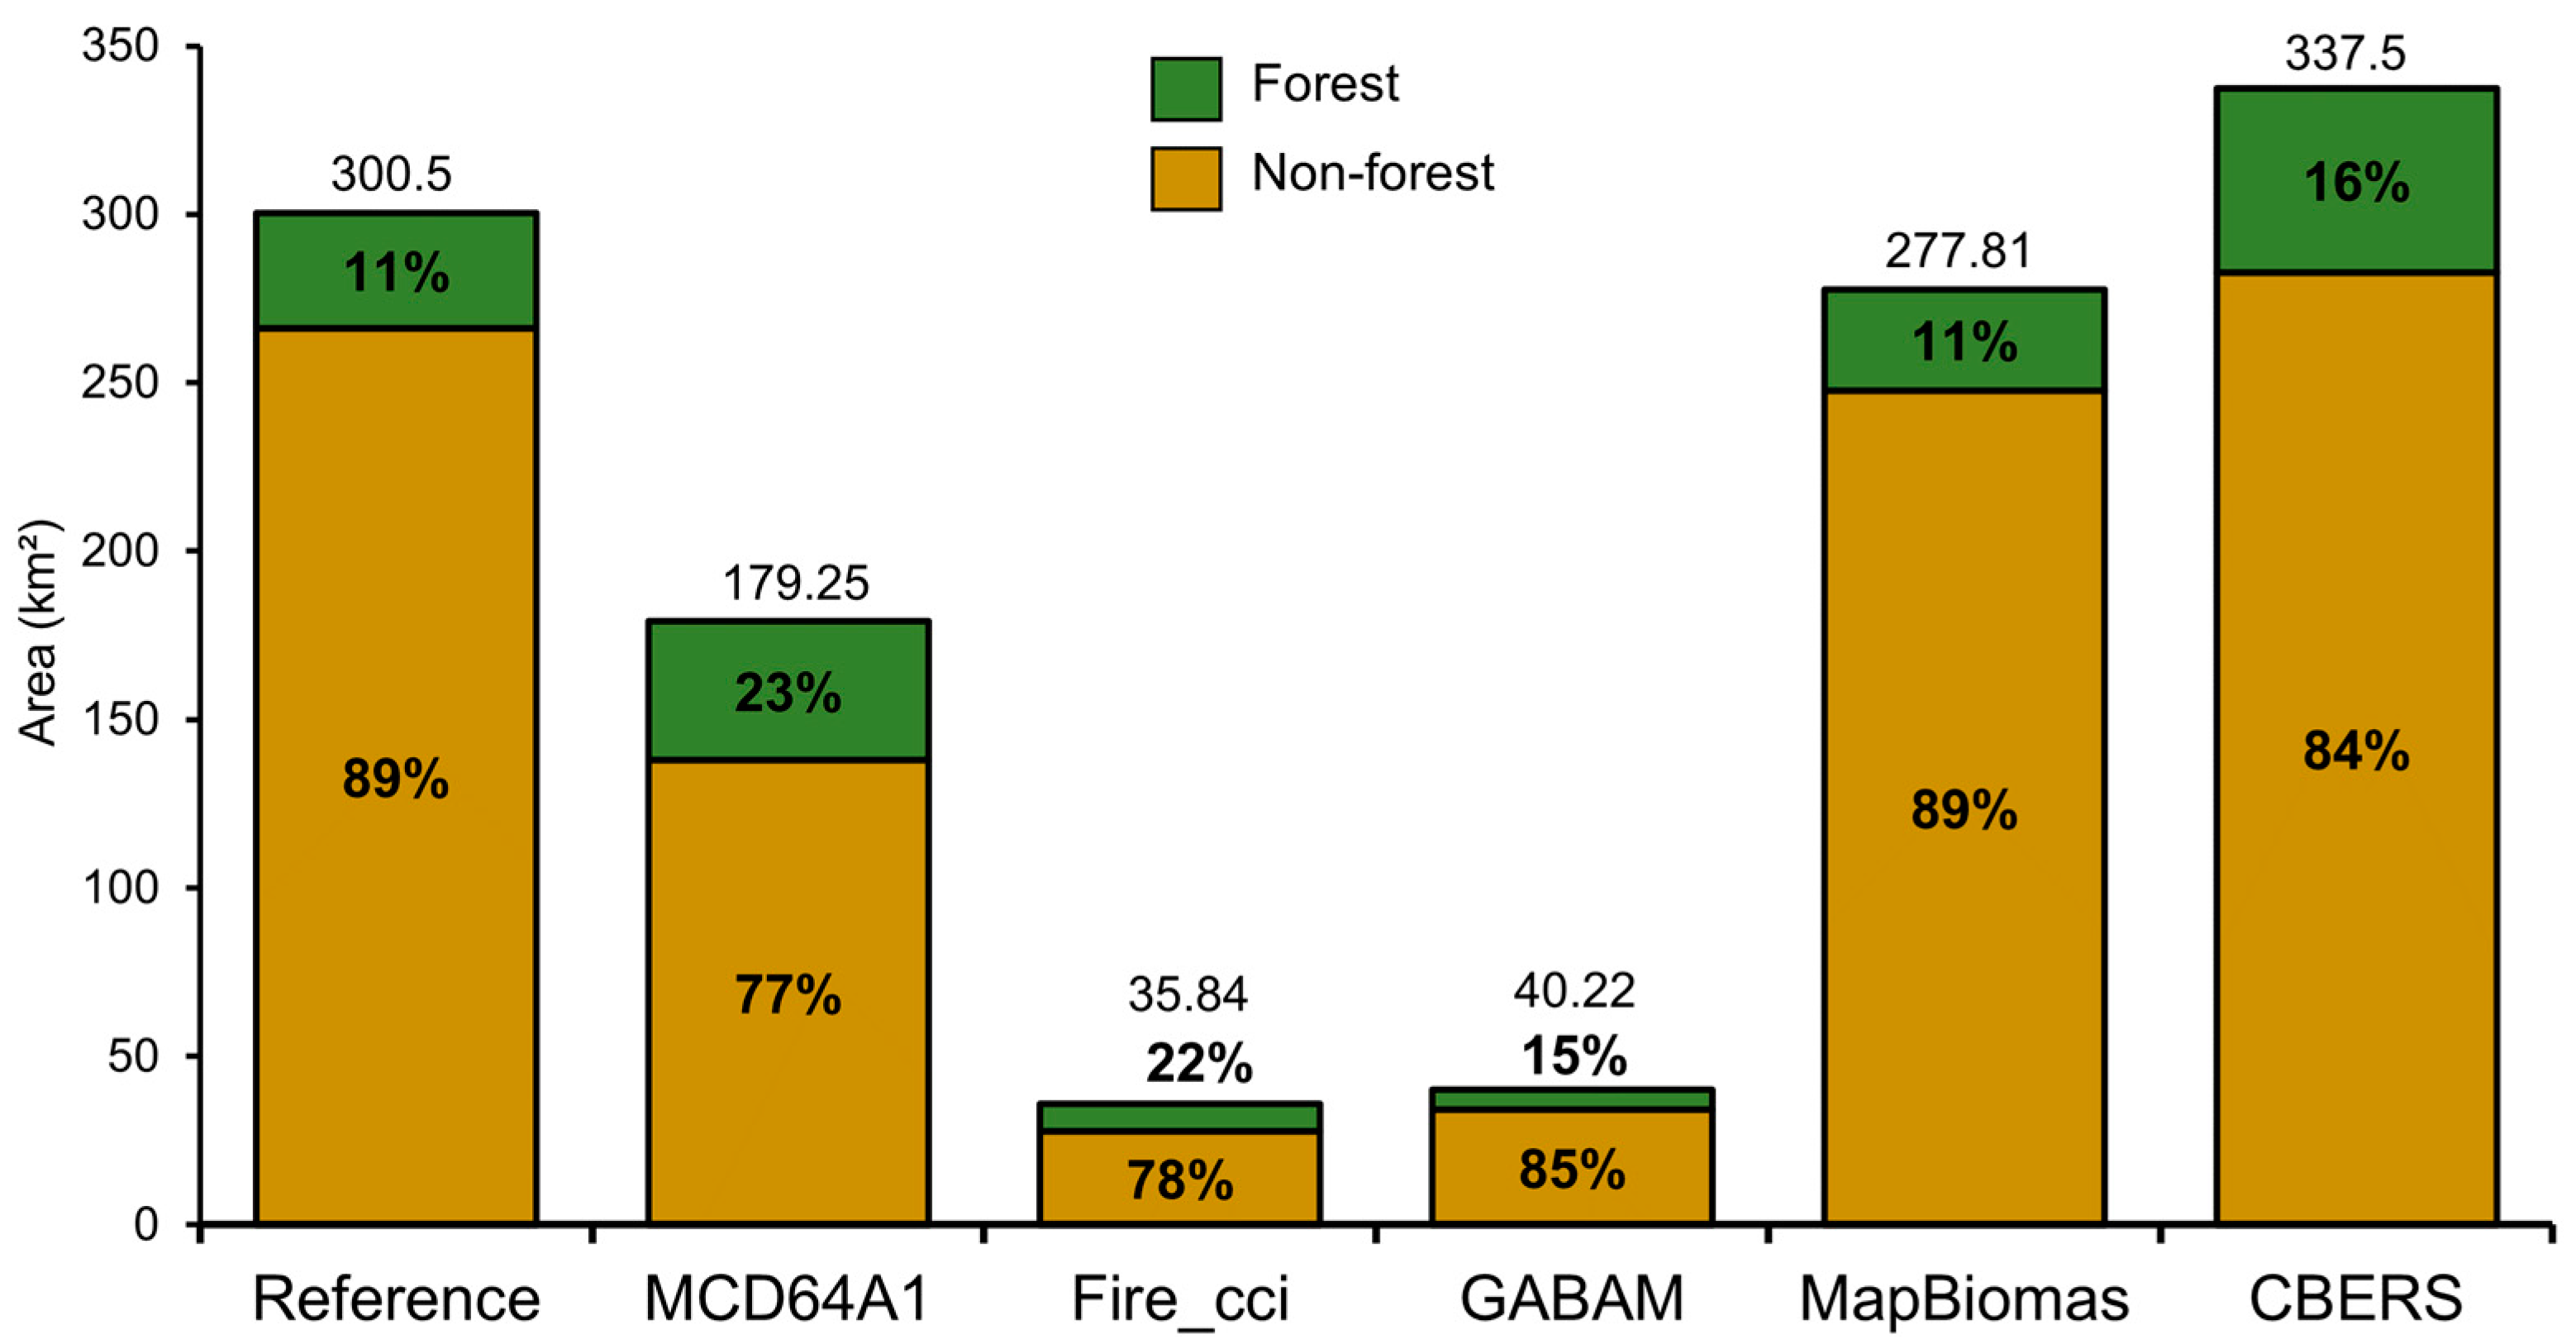
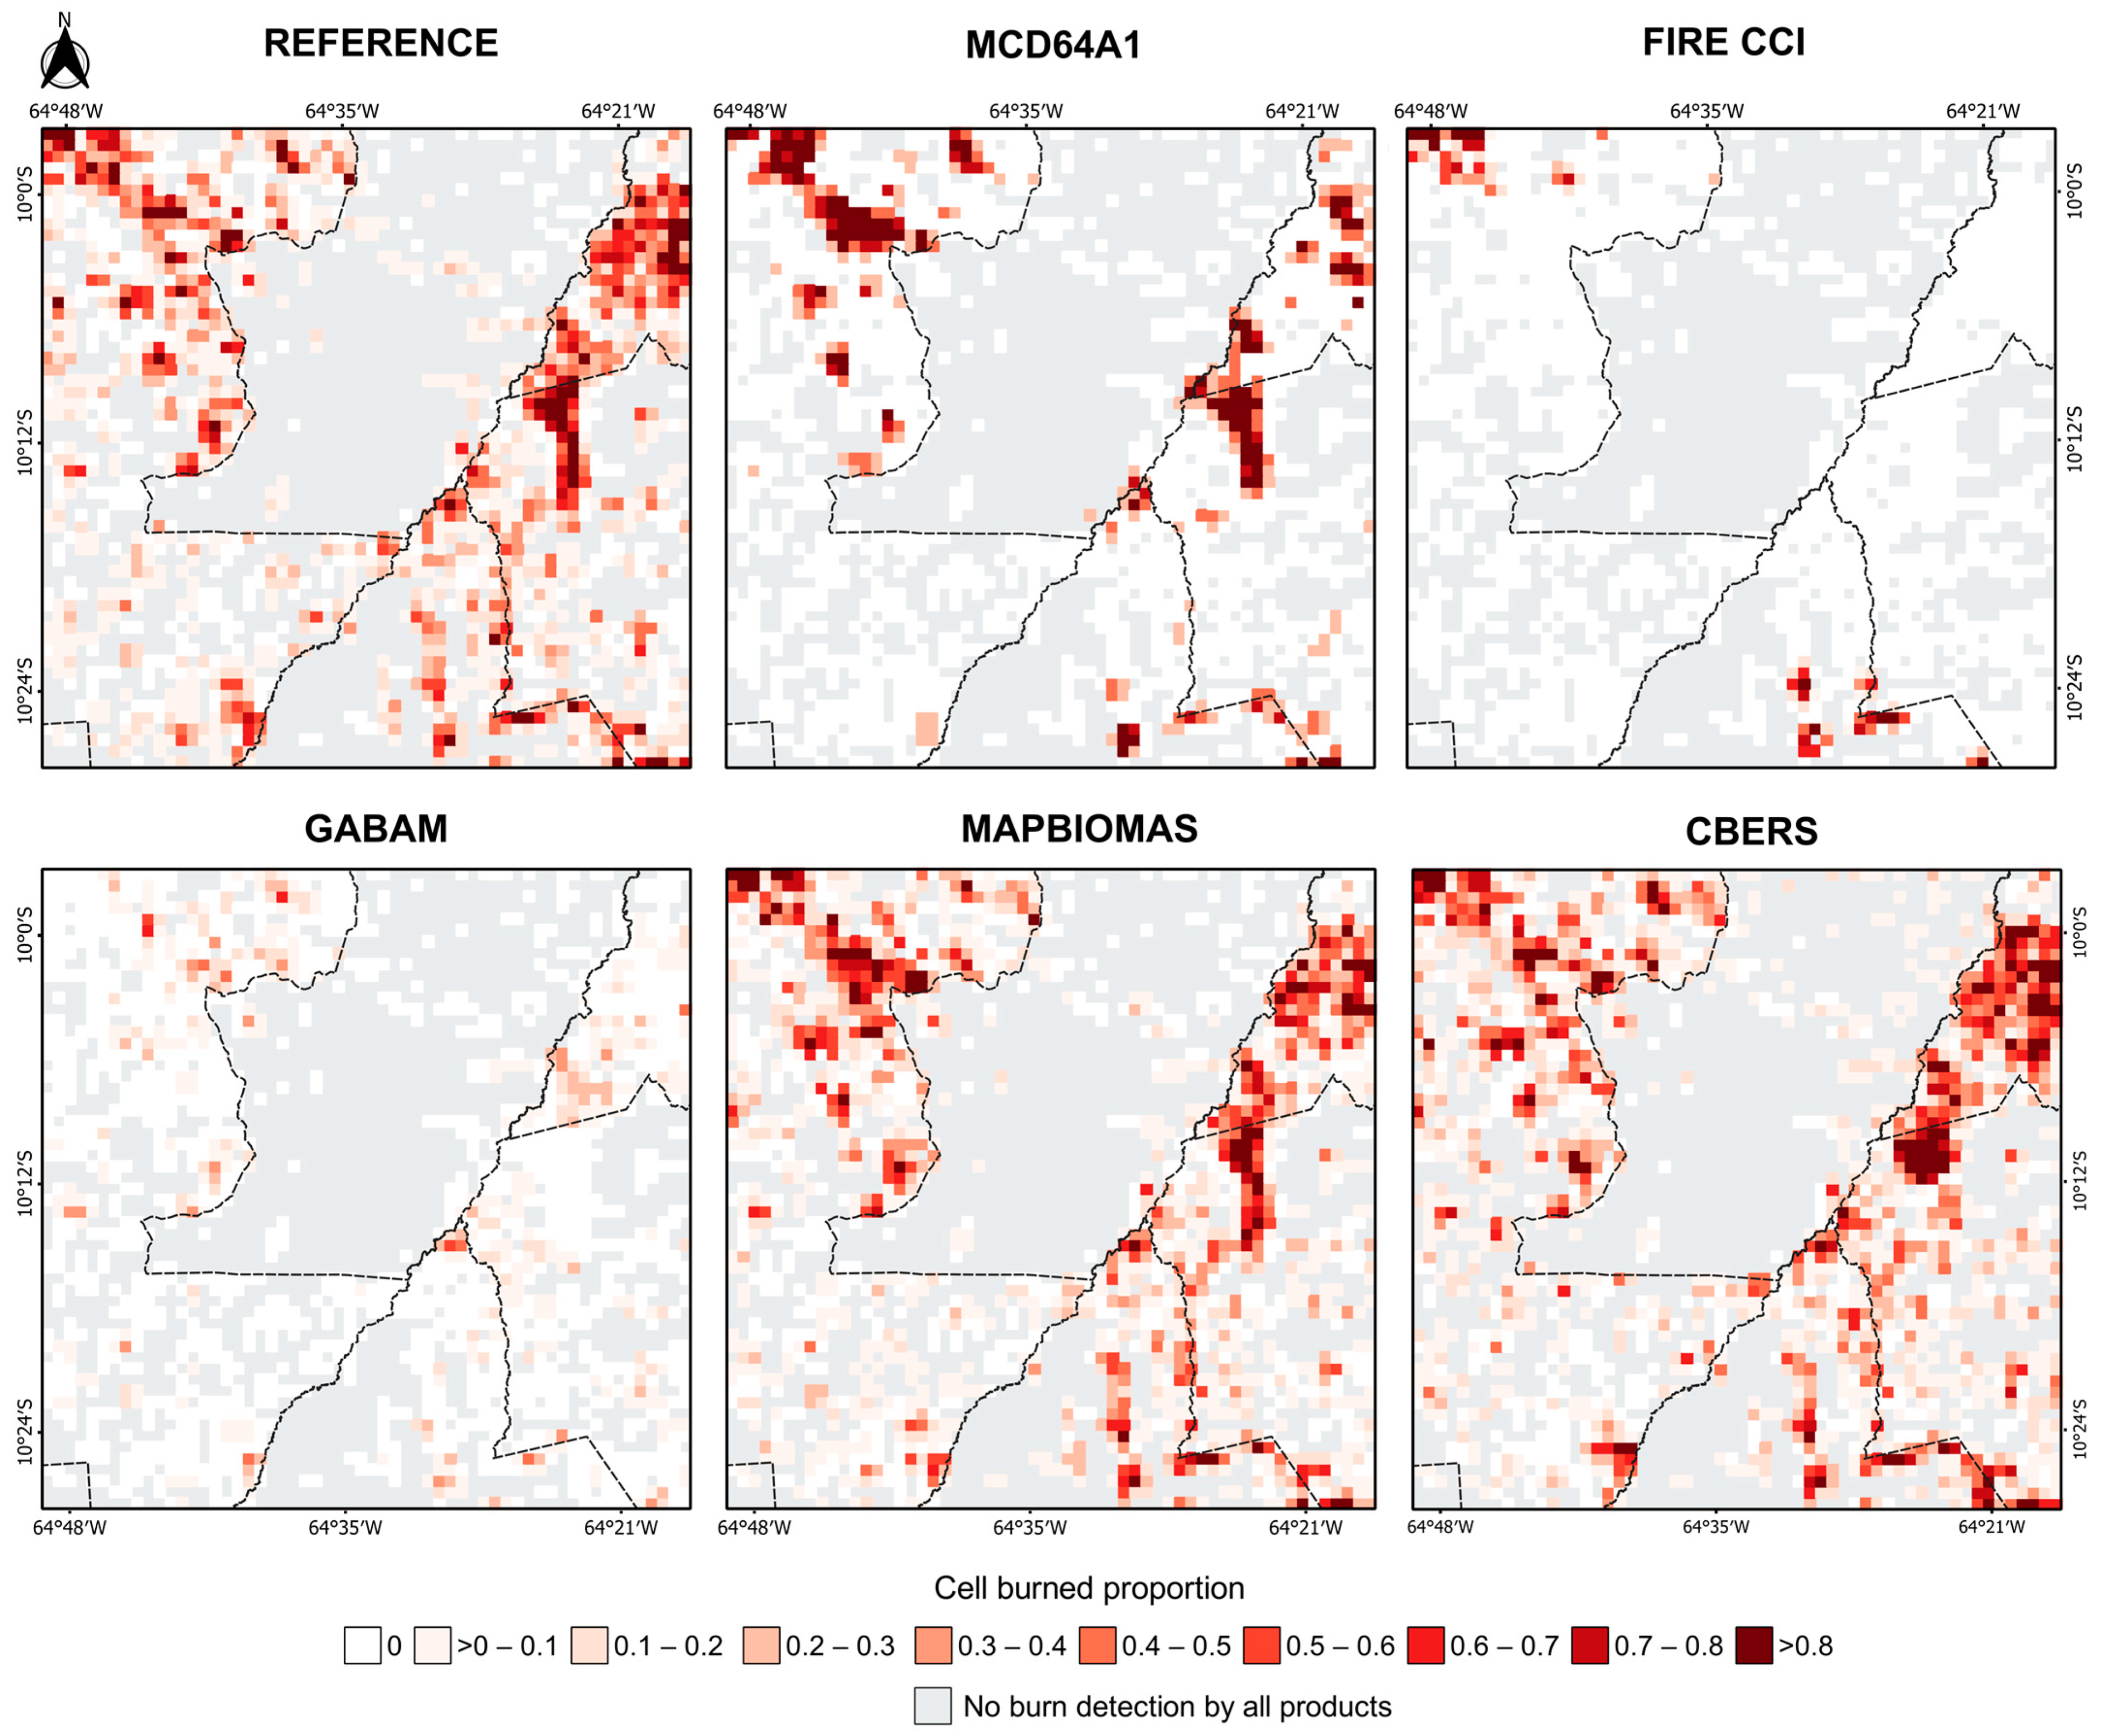
3.1. Spatial Distribution of the Total Burned Area and Estimates by Land Cover

All BA mappings differed in terms of the total area burned and, consequently, in the estimates of forest/non-forest burned (Figure 4). The reference map showed 300.5 km2 of BA in 2020, representing ~9% of the study area, with 266.21 km2 (89%) of non-forest and 34.29 km2 (11%) of forest burned. The forests of the Guajará Mirim State Park were the most affected by fires in 2020. Additionally, the non-forest areas located on rural properties in the immediate surroundings and within the Jaci-Paraná Extractive Reserve had the highest incidence of fires in the period.
The estimates of the total BA provided by the operational products were underestimated in relation to the reference map. This was also observed when analyzing BA per land cover. While the regional MapBiomas Fogo product showed only 7.5% less BA than the reference in 2020 (7% in non-forest cover and 12% in forest), the Fire_cci product showed 88% less BA (89.6% in non-forest and 76.6% in forest), followed by the GABAM product (86.5% less burned area, 87.2% and 82.5% in non-forest and forest cover). Additionally, the MCD64A1 product detected 40% less burned area in the region; although it mapped 48.2% less burned area in non-forest, it detected a 22% increase in forest areas.
Our novel BA mapping approach, based on CBERS data cubes and the LSMM, detected more BA than the reference map and all BA products. The method was able to detect 282.73 km2 of burned area in non-forests and 54.77 km2 over forests, an overestimation of 12% when compared with the reference, 6% and 58% in non-forests and forests, respectively. Compared to the operational BA products, CBERS produced a mapping more similar to MapBiomas Fogo, although it showed an 18% greater extent of BA. In contrast, the greatest differences were found with the Fire_cci and GABAM products, with CBERS mapping up to 10 times more extent of BA.
Visually, the burned area maps derived from CBERS and MapBiomas Fogo showed a spatial pattern more similar to the reference map. Each of them were able to detect a greater number of small burn scars, both over forest and non-forest, and obtained the largest spatial extent mapped, differing from the other maps provided by the global BA products MCD64A1, GABAM and Fire_cci. Furthermore, despite the small difference in the total burned area, between GABAM and Fire_cci, they exhibited great spatial disparities. While GABAM mapped small scars distributed throughout the study area, the Fire_cci product detected large blocks of burned areas, but in a more restricted way. Finally, the MCD64A1 detected only the largest burn polygons and observed the formation of regular borders around these scars (Figure 5).

3.2. Statistical Evaluation and Agreement Analysis

The results of the regular grids analysis with cells of 1 km, 5 km and 10 km enabled us to observe the effects of scale on the statistical parameters of the regression, showing an increased trend of bias, as larger grids of cells are adopted in the regional evaluation of the burned area maps. As the size of the grid cells increased, there was a propensity for the parameters of the regression models to improve for all BA mappings in the 5 km (R = 0.96 and R2 = 0.92) and 10 km (R = 0.98 and R2 = 0.96) grids when compared to the 1 km grid (R = 0.85 and R2 = 0.71). In addition, the empirical analysis allowed us to infer that as the size of the grid cell increases, the information on the burned area is smoothed out, due to the loss of representation of the pattern of small polygons of burned scars and their location in the spatial unit of the cell. As a result, burned area maps tend to be more spatially similar.
Reinforcing the differences found in the total estimates of burned area and in the visual inspection, the analysis by grid cells allowed for it to infer both statistical disparities and spatial similarity. The global BA products GABAM, MCD64A1 and Fire_cci did not detect most of the grid cells in which burned areas were detected by the reference (875, 956 and 1188 burned cells were omitted, respectively) (Figure 6). However, the BA products showed particularities in terms of the size of the scars detected and their spatial distribution. The GABAM product showed small burn polygons distributed throughout the region, which was reflected in the high number of cells with a low burn ratio (between >0 and 0.1). On the other hand, MCD64A1 and Fire_cci identifies larger and more spatially concentrated burn scars, which resulted in a higher number of cells with an elevated burn ratio (>0.5).
The reference map, BA MapBiomas Fogo product and the CBERS-derived map showed no significant differences. All three provided the most spatially extensive maps containing small burn scars, resulting in a high number of cells with a low proportion of burns (between >0 and 0.1). In the reference, approximately 70% of the grid cells had values of less than 0.3 km2, indicating that the burned area patterns in the study area in 2020 mostly corresponded to small scars. While the MapBiomas Fogo and CBERS-derived mapping resembled the reference in terms of spatial distribution and the proportion of burned cells, MapBiomas Fogo detected 75 fewer cells, and CBERS 79 more cells of burned area. Most of the commission areas found in the CBERS mapping were located over forest cover, mainly related to water bodies, exposed rock formations and cloud cover.
Table 2 shows regression analysis for the different pairs of mapped areas. The BA products and the CBERS-derived mapping were compared with the reference map and then compared with each other by cell grid. All the relationships were statistically significant at a 95% confidence level (p < 0.05). The most significant correlations ranged from 0.63 to 0.87 and the least significant from 0.10 to 0.58.
The comparison between the reference map and the other burned area mappings showed that MapBiomas Fogo had the best results, followed by the CBERS-derived method. The coefficients of determination were the closest to 1 (R2 = 0.76 and R2 = 0.72) and the models showed the smallest errors (RMSE = 0.12 and 0.13), indicating the best quality of fit, and consequently the tendency of these mappings to identify approximate values of burned area in the cells. The absolute MB indicates better spatial agreement when its values are lower. Meanwhile, MB % indicates the direction of the error trend, where negative values suggest an overestimation tendency and positive values indicate underestimation. In this case, the values were also the lowest for MapBiomas Fogo and CBERS, with MapBiomas Fogo tending to underestimate the area burned by 7.54% and CBERS overestimating it by 12.30%. On the other hand, the regression results were unsatisfactory for the models with the Fire_cci (R2 = 0.09) and GABAM (R2 = 0.17) BA products, with positive MB above >85%.
The regression analysis results comparing the CBERS burned area map with burned area products revealed the best correlation with the MapBiomas Fogo product (R = 0.80), despite the coefficient of determination being at an intermediate level (R2 = 0.63). The worst results were found for the Fire_cci product (R2 = 0.09). The MB was negative for all the analyses because, as mentioned before, the CBERS-derived method tends to map more burned areas than the BA products. The intercomparison among the BA product models revealed that, despite the GABAM x Fire_cci pair having a low error rate, its coefficient of determination was also notably low. This suggests that the regression analysis provides limited insight into the behavior of these mappings. Additionally, while both products depict similar burned area quantities, they exhibit different distribution patterns between the grid cells.
The similarity analysis made it possible to identify the most spatially cohesive regions between the burned area maps (Figure 7). Considering the reference burned area map, the similarity indices were relatively high for the MapBiomas Fogo product (0.73) and the CBERS-derived method (0.70), but in general were low for MCD64A1, GABAM and Fire_cci, ranging from 0.20 to 0.40 (Table 3). The first pattern can be explained by the extensive burned area mapped by MapBiomas Fogo and CBERS, which is similar to that observed in the reference map. On the other hand, the global products were more conservative, with a reduced mapped area. This indicates greater divergence in relation to the burned area pattern found in the region.
The MapBiomas Fogo product showed few places of disagreement with the reference map, and these disagreements are distributed throughout the region in both forest and non-forest covers, where the product captured less burned area. The biggest discrepancies between the reference and CBERS occur in the north of the study area, where the proposed method mapped more burned area over forests, especially in the Karipuna Indigenous Land.
When analyzing the global BA products in comparison to each other, it was observed that the similarity indices ranged from relatively intermediate to high. These products displayed a reduced extent of mapped burned areas throughout the region and were concentrated in specific locations. Some of these locations coincided with detection sites, while others were found in non-detection sites. This spatial overlap suggests a higher likelihood of similarity among these products.

4. Discussion

Fire is one of the main sources of disturbance in the Amazon [9], resulting in numerous detrimental environmental and socioeconomic impacts [1]. Any attempt to characterize, understand and mitigate its effects presupposes the correct identification and quantification of the areas affected by fire [103,110]. Estimates of the extent of BA provided by operational BA products show substantial differences, which vary regionally [63,102,111]. The characteristics of the sensors and the methods for detecting burn scars incorporate limitations into each product [68,69], leading to BA being underestimated or overestimated [65]. In this study, we were able to evaluate the relative performance of four operational BA products (MCD64A1, Fire_cci, GABAM and MapBiomas Fogo) in 2020, in an emerging frontier of degradation by fire events in the southwestern Amazon. Here, we also focused on exploring the potential of integrating multidimensional data cubes based on Brazilian remote sensing systems (WFI sensors, from the CBERS-4 and CBERS-4A satellites), combined with a well-known information enhancement technique (the shade fraction images derived from LSMM) [65] to map BA and provide more accurate estimates in difficult-to-monitor regions of the Amazon. Our results showed significant divergences in the total estimates of BA and by cover type (forest and non-forest), between the four BA products and the proposed method with CBERS with reference data based on remote sensors with better spatial resolution (Sentinel-2/MSI and Planet).
Eighty nine percent of the BA identified in our study area by the reference mapping occurred in non-forest areas, predominantly occupied by pasture and agriculture classes, where fires have historically been employed in land management [12]. Critically, areas of natural vegetation were also affected by fire in 2020, with 11% of the total BA occurring in forest areas, mostly located within protected areas. This result reinforces that, although these territories are considered effective barriers to protect forests [112], the pressures exerted not only by deforestation [113,114] but also by fire activity are growing [115,116].
When comparing the reference data with the BA products, the mappings showed different results for all of the parameters evaluated. The MapBiomas Fogo product had the best performance, obtaining the highest correlation in the 1 × 1 km grid (R = 0.87), and the lowest error of omission for the BA total (7.5%), as well as by land cover stratification. The product also presented the broadest spatial mapping, detecting smaller polygons of fires and better delineating the burned pixels. To some extent, these results can be explained by Landsat’s better spatial resolution in the optical spectrum (30 m), giving it advantages in the BA mapping process over MODIS-based products (250–500 m). BA maps produced with higher spatial resolution data tend to have fewer omission errors [107]. This occurs because the higher spatial resolution allows for a greater probability of detecting small scars, and a better definition of their boundaries, avoiding a greater mixture of burned and unburned patches in the same pixel [50,70,117]. Although the GABAM global product uses the same input as the MapBiomas Fogo product, it showed completely different results, mapping 85% less burned area. In this case, another important point to consider, which may explain this difference, is the different methods used to generate the products. On the one hand, MapBiomas Fogo uses NBR annual quality mosaics and local training samples as input data for a deep learning algorithm (Deep Neural Network—Multi-Layer Perceptron) to detect BA [71]. On the other hand, GABAM uses the combination of various spectral indices (NDVI, NBR, NBR2, MIRBI, SAVI, NDMI, BAI) and training samples from around the globe as input to a machine learning model (Random Forest), combined with a region growing technique for modeling BA [70]. Meanwhile, similar patterns in the total BA estimates between the GABAM and MapBiomas Fogo products were identified in the southern region of the Amazonas state [102], prompting the authors to propose that the extent BA detected by these products might be linked to spectral confusions with bamboo vegetation. However, in our specific region, this does not appear to be the case, suggesting that the observed differences may still be associated with challenges in calibrating global algorithms to the characteristics of regional vegetation. Therefore, the development of regional BA products is promising and should be further developed.
Even though global products are important for fire modeling based on global analysis of the burned area [66,69], providing continuous information on the dynamics and changes in the space–time patterns of fire and its consequences [47,118,119], our results demonstrated the conservative nature of these products for studies related to our regional scale. Between the BA products, Fire_cci and GABAM were the ones that differed the most from the other datasets, presenting the highest errors of omission (>80%) both in forest and non-forest areas when compared to the reference data. Although these global products were similar in terms of total BA estimates, they are spatially distinct. While GABAM detected smaller burn scars distributed throughout the area, Fire_cci obtained more restricted mapping and predominantly large scars. The same conservative GABAM pattern was observed in other Brazilian biomes, such as the Pantanal, where the product underestimated around 68% of BA in relation to a Sentinel-2-based dataset [64]. The Fire_cci product, in its turn, has shown an underestimated BA in various regions of the globe [59,120], detecting up to 98% less BA than other products in regions of the Brazilian Amazon [63]. Despite the improvements incorporated in the most recent version of Fire_cci (v. 5.1), its validation process indicated a global omission error of 0.6710 and a commission error of 0.5440 [95], which reflects the conservative nature of this dataset, and consequently the tendency to underestimate BA in relation to other global products [94]. In general, although the MCD64A1 product mapped more BA than the other global products (GABAM and Fire_cci), it underestimated the total BA by 40% compared to the reference. However, MCD64A1 showed a commission error (22%) in forest areas. The increase in detection over this type of cover may be associated with the fact that edges form around the MODIS pixel (500 m), leading to more BA being recorded in deforested areas nearby forests [102]. In addition, the relatively better performance of MCD64A1 compared to the other global products is mainly due to the improvement in the product’s mapping algorithm, which integrates changes in surface reflectance with active fire observations [92,121].
The size of the scars is also a determining factor in the detection accuracy of MODIS-based products [120]. In our study area, scars were small and irregular, the majority (70%) up to 0.3 km2 in size. Coarser spatial resolution products have difficulty in adequately detecting scars smaller than 100 ha [62,120], which leads to BA being considerably underestimated [92]. Several validation studies of global products show underestimates of approximately 25% of MODIS data in comparison to Landsat data [107,122,123]. In this context, the small and irregular BA scars may have led to the high omission errors of the MODIS-based products because the spatial resolution of the pixels is too coarse to detect such small fires. Furthermore, several inconsistencies reported in the BA maps of global products are associated with the difficulty of calibrating the mapping algorithms to deal with the high levels of spectral heterogeneity of BA, in response to regional seasonality, land use and land cover types, fire regimes, burn intensities, and climatic agents, which modulate the local characteristics of BA [57,62]. The limitations of global algorithms in BA estimates point to the development of regional algorithms that consider local characteristics (e.g., vegetation, soil and climate) and regional validation of the results [65,110], such as MapBiomas Fogo and our CBERS-based mapping. Regional BA mappings derived from better spatial resolution sensors could also be used in the calibration process of global BA products [64,117] to incorporate performance improvements on a regional scale, since the long temporal range of MODIS and Landsat are extremely important for spatiotemporal fire modeling.
Regarding the proposed method for generating BA maps, our results performed well in all the parameters evaluated in relation to the reference, and were superior to the global products (GABAM, MCD64A1 and Fire_cci). Our approach showed the second best correlation (R = 0.85) of the dataset analyzed, and spatially similar patterns to the reference and the MapBiomas Fogo product. The product showed high sensitivity in detecting small burn scars, and the average spatial resolution of the WFI (64 m) may explain the better mapping when compared to MODIS-based global products (250–500 m). The temporal resolution conferred by the two satellites CBERS-4 and CBERS-4A together (3 to 5 days) increases the acquisition of smoke- and cloud-free WFI images compared to Landsat images (16 days). This is an important factor for fire-related studies in tropical areas. In this region, the signs of fires can disappear quickly after the fire event, due to climatic characteristics and the rapid regrowth of vegetation [124]. The high frequency of images therefore makes it possible to reduce errors of omission in BA maps [65]. Multidimensional data cubes (CBERS-4/WFI and CBERS-4A/WFI) also provide advantages by reducing the dimensionality of the volume of WFI images to be processed and analyzed, based on the best pixel storage approach, while also ensuring that much of the cloud cover is eliminated [73,125]. The shade fraction images derived from LSMM proved to be particularly effective in highlighting the BA in the region, facilitating the algorithm’s classification process. However, although our approach performed well, it tended to overestimate BA by 12% in the region. These data may be associated with incorrect classification by the ISOSEG algorithm, due to spectral confusions in the shade fraction images, especially within protected areas, over forest cover. These confusions are related to the similarity of the spectral response of BA with the spectral responses of shadows (clouds and terrain relief), water bodies and some rock formations [65] identified in our study area. In addition, some images from the WFI data cube presented composition problems due to the cloud mask used by the project [73], where the mask failed in the image the algorithm classified as burnt. This problem was recently reported by the developers and will be resolved shortly [125].
The scale of analysis can also influence the performance of BA products [61,63] and our proposed method. The difference in scale of analysis (e.g., state or country) alters the relationship between variables evaluated in grid systems [11]. Statistically significant relationships in BA data at a regional level may not show the same pattern at a local or global level. The definition of the grid size is also a factor to be considered in studies evaluating BA mappings. With a brief analysis, we showed that larger grid cells (5 × 5 km and 10 × 10 km) show improvements in the statistical parameters of the regression, demonstrating a tendency towards bias in the regional evaluation of BA mapping. Larger grid cells tend to soften the information on the BA, due to the loss of representation of the small polygon pattern of the burn scars and their location in the spatial unit of the cell. As a result, BA maps tend to be more spatially similar.
Accurately assessing the extent of BA is key to understanding the effects of fires on Amazonian ecosystems [126], on society [127] and on the global carbon cycle [63,128], as well as ensuring good communication in national reports, and for decision-makers, more efficient actions to manage and prevent these events. Despite the significant contribution of global products, we have shown that, regionally, the use of these products can be critical in underestimating the total area burned and, consequently, fire-related impacts. Regional BA products can improve the availability of data on the areas affected by fires in the region, as observed with MapBiomas Fogo. However, it is important that the final user assesses the advantages and disadvantages of choosing a BA product depending on the objectives and scale of analysis of their study. The difficulty of reconciling the spatial and temporal characteristics of orbital sensors, and the method for detecting burn scars, incorporates limitations to the final performance of each product and implies challenges for generating a new BA product.
Our mapping approach using data cubes from Brazilian orbital sensors and fraction images shows high potential for generating more accurate regional BA maps for the Amazon. In the absence of an official national product for monitoring the extent of areas affected by fire, the proposed method could be an alternative approach to providing spatial information on BA every 3–5 days. This information can be useful for supporting decisions by public policymakers and environmental agencies that promote monitoring and control in the Amazon, establishing more efficient fire prevention, control and management actions in the region, ensuring greater success in actions to curb the illegal use of fire, which would help Brazil meet its commitments to reduce carbon emissions from forest degradation. At the same time, reliable mapping of BAs allows the country to better estimate and report its carbon emissions from fire in national reports. Furthermore, aiming at improving the accuracy of current BA products, the BA classifications derived from our method could be used as a regional reference for calibrating global BA detection algorithms, since they benefit from long time series such as those derived from MODIS and Landsat images. For future research, we also highlight that there is room for further improving this method; other data can also be incorporated, such as the inclusion of WFI images from the Amazonia-1 satellite (available from 2021), aiming to increase the frequency of image acquisition to one or two days. The use of auxiliary information, such as water body and cloud masks, can also avoid the confusion of BA by ISOSEG, and consequently improve the shade fraction classification process in our approach. Finally, it would be beneficial to implement the algorithm in a cloud processing environment for monitoring larger areas and analyzing time series.

5. Conclusions

The use of BA products derived from orbital remote sensing to investigate the effects of fire and subsidize public policies in the Amazon requires reliable estimates of the uncertainties associated with these products. Therefore, in this study, we regionally evaluate the performance of four widely used operational BA products, three global (MCD64A1, Fire_cci, GABAM) and one regional (MapBiomas Fogo), and proposed a new BA mapping approach exploiting the potential of Brazilian sensors’ data cubes (CBERS-4/WFI and CBERS-4A/WFI) combined with the linear spectral mixing model to extract more accurate BA information in a region of the southwestern Brazilian Amazon. We compared the operational BA products and our results to a reference mapping based on better spatial resolution images (Sentinel-2 and Planet) and showed that there were significant differences in total BA estimates and by land use and land cover type. The proposed BA mapping approach integrating data cubes and fraction images presented advantages in reducing the volume of data to be analyzed and in highlighting BA, facilitating the classification process and consequently resulting in more reliable BA estimates. Global BA products tended to considerably underestimate BA in the region.
The general characteristics of the sensors and the methods for detecting burn scars incorporate limitations in each product, leading to underestimates or overestimates of BA. It is essential that the user evaluates the advantages and disadvantages of the products for their analysis scale. The adoption of global BA products in regional studies can be critical in underestimating the total area burned and, consequently, the impacts related to fire and actions to prevent and manage these events. This brings up the need to develop approaches aimed at improving the accuracy of current global products. In this respect, regional BA products may be more suitable for regional studies. Our BA mapping approach showed high potential for generating more accurate regional BA maps in the Amazon, presenting advantages over global BA products. In the absence of an official national product to monitor the extent of areas affected by fires in the Amazon, the proposed method could be an alternative approach to providing spatial information on BA. Improvements can still be incorporated into our method, and therefore be a starting point to the development of a national and official BA product based on Brazilian sensors.

Author Contributions

Conceptualization, P.D.F., G.M. and L.O.A.; methodology, P.D.F., L.O.A., J.d.S.A. and A.C.M.P.; data analysis, P.D.F.; writing—original draft preparation, P.D.F.; writing—review and editing, P.D.F., G.M., J.d.S.A., D.J.D., T.P.d.M., Y.E.S., A.C.M.P., G.d.O. and L.O.A.; supervision, L.O.A. and G.M. All authors have read and agreed to the published version of the manuscript.

Funding

L.O.A acknowledges the São Paulo Research Foundation—FAPESP (grants 2020/15230-5 [SHELL-FAPESP] and 2020/08916-8); the National Council for Scientific and Technological Development—CNPq, productivity scholarship (grant 314473/2020-3). G.M. also thanks FAPESP for funding (grants 2019/25701-8 and 2023/03206-0). D.J.D. acknowledges FAPESP (grants 2021/04019-4 and 2020/08916-8), Amazonas State Research Support Foundation—FAPEAM (grant 0102016301000289/2021-33) and Dimension Sciences—Amazon Task Force 2023. T.P.M. also thanks the CNPq (grant 140432/2023-0) and the Brazilian Federal Agency for Support and Evaluation of Graduate Education—CAPES for funding (grant 01340.002833/2021-50).

Institutional Review Board Statement

Not applicable.

Informed Consent Statement

Not applicable.

Data Availability Statement

All data and codes used in the current study are available upon request from the corresponding author.

Acknowledgments

We are grateful to the National Institute for Space Research (INPE) and the Tropical Ecosystems and Environmental Sciences lab (TREES) for their support in carrying out this research.

Conflicts of Interest

The authors declare no conflicts of interest.

References

  1. Pivello, V.R.; Vieira, I.; Christianini, A.V.; Ribeiro, D.B.; da Silva Menezes, L.; Berlinck, C.N.; Melo, F.P.L.; Marengo, J.A.; Tornquist, C.G.; Tomas, W.M.; et al. Understanding Brazil’s catastrophic fires: Causes, consequences and policy needed to prevent future tragedies. Perspect. Ecol. Conserv. 2021, 19, 233–255. [Google Scholar] [CrossRef]
  2. Berlinck, C.N.; Batista, E.K.L. Good fire, bad fire: It depends on who burns. Flora 2020, 268, 151610. [Google Scholar] [CrossRef]
  3. Bush, M.B.; Silman, M.R.; McMichael, C.; Saatchi, S. Fire, climate change and biodiversity in Amazonia: A Late-Holocene perspective. Philos. Trans. R. Soc. B 2008, 363, 1795–1802. [Google Scholar] [CrossRef]
  4. Silveira, M.V.F.; Silva-Junior, C.H.L.; Anderson, L.O.; Aragão, L.E.O.C. Amazon fires in the 21st century: The year of 2020 in evidence. Glob. Ecol. Biogeogr. 2022, 31, 2026–2040. [Google Scholar] [CrossRef]
  5. Silva Junior, C.A.d.; Lima, M.; Teodoro, P.E.; Oliveira-Júnior, J.F.d.; Rossi, F.S.; Funatsu, B.M.; Butturi, W.; Lourençoni, T.; Kraeski, A.; Pelissari, T.D.; et al. Fires Drive Long-Term Environmental Degradation in the Amazon Basin. Remote Sens. 2022, 14, 338. [Google Scholar] [CrossRef]
  6. Carvalho, N.S.; Anderson, L.O.; Nunes, C.A.; Pessôa, A.C.M.; Silva Junior, C.H.L.; Reis, J.B.C.; Shimabukuro, Y.E.; Berenguer, E.; Barlow, J.; Aragão, L.E.O.C. Spatio-temporal variation in dry season determines the Amazonian fire calendar. Environ. Res. Lett. 2021, 16, 125009. [Google Scholar] [CrossRef]
  7. Xu, X.; Jia, G.; Zhang, X.; Riley, W.J.; Xue, Y. Climate regime shift and forest loss amplify fire in Amazonian forests. Glob. Chang. Biol. 2020, 26, 5874–5885. [Google Scholar] [CrossRef]
  8. Matricardi, E.A.T.; Skole, D.L.; Costa, O.B.; Pedlowski, M.A.; Samek, J.H.; Miguel, E.P. Long-term forest degradation surpasses deforestation in the Brazilian Amazon. Science 2020, 369, 1378–1382. [Google Scholar] [CrossRef] [PubMed]
  9. Lapola, D.M.; Pinho, P.; Barlow, J.; Aragão, L.E.O.C.; Berenguer, E.; Carmenta, R.; Liddy, H.M.; Seixas, H.; Silva, C.V.J.; Silva-Junior, C.H.L.; et al. The drivers and impacts of Amazon forest degradation. Science 2023, 379, eabp8622. [Google Scholar] [CrossRef]
  10. Juárez-Orozco, S.M.; Siebe, C.; Fernández y Fernández, D. Causes and Effects of Forest Fires in Tropical Rainforests: A Bibliometric Approach. Trop. Conserv. Sci. 2017, 10, 1940082917737207. [Google Scholar] [CrossRef]
  11. Mataveli, G.A.V.; de Oliveira, G.; Seixas, H.T.; Pereira, G.; Stark, S.C.; Gatti, L.V.; Basso, L.S.; Tejada, G.; Cassol, H.L.G.; Anderson, L.O.; et al. Relationship between Biomass Burning Emissions and Deforestation in Amazonia over the Last Two Decades. Forests 2021, 12, 1217. [Google Scholar] [CrossRef]
  12. Barlow, J.; Berenguer, E.; Carmenta, R.; França, F. Clarifying Amazonia’s burning crisis. Glob. Chang. Biol. 2020, 26, 319–321. [Google Scholar] [CrossRef]
  13. Morton, D.C.; Defries, R.S.; Randerson, J.T.; Giglio, L.; Schroeder, W.; Van Der Werf, G.R. Agricultural intensification increases deforestation fire activity in Amazonia. Biology 2008, 14, 2262–2275. [Google Scholar] [CrossRef]
  14. Pivello, V.R. The Use of Fire in the Cerrado and Amazonian Rainforests of Brazil: Past and Present. Fire Ecol. 2011, 7, 24–39. [Google Scholar] [CrossRef]
  15. Davidson, E.A.; de Araújo, A.C.; Artaxo, P.; Balch, J.K.; Brown, I.F.; Bustamante, M.M.C.; Coe, M.T.; DeFries, R.S.; Keller, M.; Longo, M.; et al. The Amazon basin in transition. Nature 2012, 481, 321–328. [Google Scholar] [CrossRef]
  16. Nepstad, D.C.; Moreira, A.G.; Alencar, A.A. Flames in the Rain Forest: Origins, Impacts and Alternatives to Amazonian Fires; The Pilot Program to Conserve the Brazilian Rain Forest: Brasília, Brazil, 1999. [Google Scholar]
  17. Pontes-Lopes, A.; Silva, C.V.J.; Barlow, J.; Rincón, L.M.; Campanharo, W.A.; Nunes, C.A.; de Almeida, C.T.; Silva Júnior, C.H.L.; Cassol, H.L.G.; Dalagnol, R.; et al. Drought-driven wildfire impacts on structure and dynamics in a wet Central Amazonian forest. Proc. R. Soc. B. 2021, 288, 20210094. [Google Scholar] [CrossRef]
  18. Oliveras, I.; Román-Cuesta, R.M.; Urquiaga-Flores, E.; Quintano Loayza, J.A.; Kala, J.; Huamán, V.; Lizárraga, N.; Sans, G.; Quispe, K.; Lopez, E.; et al. Fire effects and ecological recovery pathways of tropical montane cloud forests along a time chronosequence. Glob. Chang. Biol. 2018, 24, 758–772. [Google Scholar] [CrossRef] [PubMed]
  19. Pontes-Lopes, A.; Dalagnol, R.; Dutra, A.C.; de Jesus Silva, C.V.; de Alencastro Graça, P.M.; de Oliveira e Cruz de Aragão, L.E. Quantifying Post-Fire Changes in the Aboveground Biomass of an Amazonian Forest Based on Field and Remote Sensing Data. Remote Sens. 2022, 14, 1545. [Google Scholar] [CrossRef]
  20. Smith, M.N.; Stark, S.C.; Taylor, T.C.; Schietti, J.; de Almeida, D.R.A.; Aragón, S.; Torralvo, K.; Lima, A.P.; de Oliveira, G.; de Assis, R.L.; et al. Diverse anthropogenic disturbances shift Amazon forests along a structural spectrum. Front. Ecol. Environ. 2023, 21, 24–32. [Google Scholar] [CrossRef]
  21. Leal, O.d.A.; Jiménez-Morillo, N.T.; González-Pérez, J.A.; Knicker, H.; de Souza Costa, F.; Jiménez-Morillo, P.N.; de Carvalho Júnior, J.A.; dos Santos, J.C.; Pinheiro Dick, D. Soil Organic Matter Molecular Composition Shifts Driven by Forest Regrowth or Pasture after Slash-and-Burn of Amazon Forest. Int. J. Environ. Res. Public Health 2023, 20, 3485. [Google Scholar] [CrossRef] [PubMed]
  22. Ward, D.S.; Kloster, S.; Mahowald, N.M.; Rogers, B.M.; Randerson, J.T.; Hess, P.G. The changing radiative forcing of fires: Global model estimates for past, present and future. Atmos. Chem. Phys. 2012, 12, 10857–10886. [Google Scholar] [CrossRef]
  23. Longo, M.; Saatchi, S.; Keller, M.; Bowman, K.; Ferraz, A.; Moorcroft, P.R.; Morton, D.C.; Bonal, D.; Brando, P.; Burban, B.; et al. Impacts of Degradation on Water, Energy, and Carbon Cycling of the Amazon Tropical Forests. J. Geophys. Res. 2020, 125, e2020JG005677. [Google Scholar] [CrossRef]
  24. de Andrade, R.B.; Balch, J.K.; Carreira, J.Y.O.; Brando, P.M.; Freitas, A.V.L. The impacts of recurrent fires on diversity of fruit-feeding butterflies in a south-eastern Amazon forest. J. Trop. Ecol. 2017, 33, 22–32. [Google Scholar] [CrossRef]
  25. Paolucci, L.N.; Schoereder, J.H.; Brando, P.M.; Andersen, A.N. Fire-induced forest transition to derived savannas: Cascading effects on ant communities. Biol. Conserv. 2017, 214, 295–302. [Google Scholar] [CrossRef]
  26. Feng, X.; Merow, C.; Liu, Z.; Park, D.S.; Roehrdanz, P.R.; Maitner, B.; Newman, E.A.; Boyle, B.L.; Lien, A.; Burger, J.R.; et al. How deregulation, drought and increasing fire impact Amazonian biodiversity. Nature 2021, 597, 516–521. [Google Scholar] [CrossRef]
  27. Rossi, L.C.; Berenguer, E.; Lees, A.C.; Barlow, J.; Ferreira, J.; França, F.M.; Tavares, P.; Pizo, M.A. Predation on artificial caterpillars following understorey fires in human-modified Amazonian forests. Biotropica 2022, 54, 754–763. [Google Scholar] [CrossRef]
  28. Campanharo, W.; Lopes, A.; Anderson, L.; Da Silva, T.; Aragão, L. Translating Fire Impacts in Southwestern Amazonia into Economic Costs. Remote Sens. 2019, 11, 764. [Google Scholar] [CrossRef]
  29. Aragão, L.E.O.C.; Anderson, L.O.; Fonseca, M.G.; Rosan, T.M.; Vedovato, L.B.; Wagner, F.H.; Silva, C.V.J.; Silva Junior, C.H.L.; Arai, E.; Aguiar, A.P.; et al. 21st Century drought-related fires counteract the decline of Amazon deforestation carbon emissions. Nat. Commun. 2018, 9, 536. [Google Scholar] [CrossRef] [PubMed]
  30. Gatti, L.V.; Basso, L.S.; Miller, J.B.; Gloor, M.; Gatti Domingues, L.; Cassol, H.L.G.; Tejada, G.; Aragão, L.E.O.C.; Nobre, C.; Peters, W.; et al. Amazonia as a carbon source linked to deforestation and climate change. Nature 2021, 595, 388–393. [Google Scholar] [CrossRef]
  31. Nawaz, M.O.; Henze, D.K. Premature Deaths in Brazil Associated with Long-Term Exposure to PM2.5 From Amazon Fires Between 2016 and 2019. GeoHealth 2020, 4, e2020GH000268. [Google Scholar] [CrossRef]
  32. Campanharo, W.A.; Morello, T.; Christofoletti, M.A.M.; Anderson, L.O. Hospitalization Due to Fire-Induced Pollution in the Brazilian Legal Amazon from 2005 to 2018. Remote Sens. 2022, 14, 69. [Google Scholar] [CrossRef]
  33. Cochrane, M.A.; Laurance, W.F. Synergisms among fire, land use, and climate change in the Amazon. Ambio 2008, 37, 522–527. [Google Scholar] [CrossRef] [PubMed]
  34. Morton, D.C.; Le Page, Y.; DeFries, R.; Collatz, G.J.; Hurtt, G.C. Understorey fire frequency and the fate of burned forests in southern Amazonia. Philos. Trans. R. Soc. B 2013, 368, 20120163. [Google Scholar] [CrossRef] [PubMed]
  35. De Faria, B.L.; Brando, P.M.; Macedo, M.N.; Panday, P.K.; Soares-Filho, B.S.; Coe, M.T. Current and future patterns of fire-induced forest degradation in Amazonia. Environ. Res. Lett. 2017, 12, 095005. [Google Scholar] [CrossRef]
  36. Brando, P.M.; Paolucci, L.; Ummenhofer, C.C.; Ordway, E.M.; Hartmann, H.; Cattau, M.E.; Rattis, L.; Medjibe, V.; Coe, M.T.; Balch, J. Droughts, Wildfires, and Forest Carbon Cycling: A Pantropical Synthesis. Annu. Rev. Earth Planet. Sci. 2019, 47, 555–581. [Google Scholar] [CrossRef]
  37. da Silva Júnior, L.A.S.; Delgado, R.C.; Pereira, M.G.; Teodoro, P.E.; da Silva Junior, C.A. Fire dynamics in extreme climatic events in western amazon. Environ. Dev. 2019, 32, 100450. [Google Scholar] [CrossRef]
  38. Brando, P.; Macedo, M.; Silvério, D.; Rattis, L.; Paolucci, L.; Alencar, A.; Coe, M.; Amorim, C. Amazon wildfires: Scenes from a foreseeable disaster. Flora 2020, 268, 151609. [Google Scholar] [CrossRef]
  39. Silveira, M.V.F.; Petri, C.A.; Broggio, I.S.; Chagas, G.O.; Macul, M.S.; Leite, C.C.S.S.; Ferrari, E.M.M.; Amim, C.G.V.; Freitas, A.L.R.; Motta, A.Z.V.; et al. Drivers of Fire Anomalies in the Brazilian Amazon: Lessons Learned from the 2019 Fire Crisis. Land 2020, 9, 516. [Google Scholar] [CrossRef]
  40. Oliveira, U.; Soares-Filho, B.; Bustamante, M.; Gomes, L.; Ometto, J.P.; Rajão, R. Determinants of Fire Impact in the Brazilian Biomes. Front. For. Glob. Chang. 2022, 5, 735017. [Google Scholar] [CrossRef]
  41. Silvério, D.V.; Oliveira, R.S.; Flores, B.M.; Brando, P.M.; Almada, H.K.; Furtado, M.T.; Moreira, F.G.; Heckenberger, M.; Ono, K.Y.; Macedo, M.N. Intensification of fire regimes and forest loss in the Território Indígena do Xingu. Environ. Res. Lett. 2022, 17, 045012. [Google Scholar] [CrossRef]
  42. Mataveli, G.; de Oliveira, G.; Silva-Junior, C.H.L.; Stark, S.C.; Carvalho, N.; Anderson, L.O.; Gatti, L.V.; Aragão, L.E.O.C. Record-breaking fires in the Brazilian Amazon associated with uncontrolled deforestation. Nat. Ecol. Evol. 2022, 6, 1792–1793. [Google Scholar] [CrossRef]
  43. Silva Junior, C.; Aragão, L.; Fonseca, M.; Almeida, C.; Vedovato, L.; Anderson, L. Deforestation-Induced Fragmentation Increases Forest Fire Occurrence in Central Brazilian Amazonia. Forests 2018, 9, 305. [Google Scholar] [CrossRef]
  44. Silva-Junior, C.H.L.; Buna, A.T.M.; Bezerra, D.S.; Costa, O.S.; Santos, A.L.; Basson, L.O.D.; Santos, A.L.S.; Alvarado, S.T.; Almeida, C.T.; Freire, A.T.G.; et al. Forest Fragmentation and Fires in the Eastern Brazilian Amazon–Maranhão State, Brazil. Fire 2022, 5, 77. [Google Scholar] [CrossRef]
  45. Rosan, T.M.; Sitch, S.; Mercado, L.M.; Heinrich, V.; Friedlingstein, P.; Aragão, L.E.O.C. Fragmentation-Driven Divergent Trends in Burned Area in Amazonia and Cerrado. Front. For. Glob. Chang. 2022, 5, 801408. [Google Scholar] [CrossRef]
  46. Aragão, L.E.O.C.; Malhi, Y.; Roman-Cuesta, R.M.; Saatchi, S.; Anderson, L.O.; Shimabukuro, Y.E. Spatial patterns and fire response of recent Amazonian droughts. Geophys. Res. Lett. 2007, 34, 2006GL028946. [Google Scholar] [CrossRef]
  47. Silva Junior, C.H.L.; Anderson, L.O.; Silva, A.L.; Almeida, C.T.; Dalagnol, R.; Pletsch, M.A.J.S.; Penha, T.V.; Paloschi, R.A.; Aragão, L.E.O.C. Fire Responses to the 2010 and 2015/2016 Amazonian Droughts. Front. Earth Sci. 2019, 7, 97. [Google Scholar] [CrossRef]
  48. Brando, P.M.; Soares-Filho, B.; Rodrigues, L.; Assunção, A.; Morton, D.; Tuchschneider, D.; Fernandes, E.C.M.; Macedo, M.N.; Oliveira, U.; Coe, M.T. The gathering firestorm in southern Amazonia. Sci. Adv. 2020, 6, eaay1632. [Google Scholar] [CrossRef]
  49. Ortega, G.; Arias, P.A.; Villegas, J.C.; Marquet, P.A.; Nobre, P. Present-day and future climate over central and South America according to CMIP5/CMIP6 models. Int. J. Climatol. 2021, 41, 6713–6735. [Google Scholar] [CrossRef]
  50. Arruda, V.L.S.; Piontekowski, V.J.; Alencar, A.; Pereira, R.S.; Matricardi, E.A.T. An alternative approach for mapping burn scars using Landsat imagery, Google Earth Engine, and Deep Learning in the Brazilian Savanna. Remote Sens. Appl. Soc. Environ. 2021, 22, 100472. [Google Scholar] [CrossRef]
  51. Daldegan, G.A.; Roberts, D.A.; Ribeiro, F.d.F. Spectral mixture analysis in Google Earth Engine to model and delineate fire scars over a large extent and a long time-series in a rainforest-savanna transition zone. Remote Sens. Environ. 2019, 232, 111340. [Google Scholar] [CrossRef]
  52. Wu, Z.; Middleton, B.; Hetzler, R.; Vogel, J.; Dye, D. Vegetation Burn Severity Mapping Using Landsat-8 and WorldView-2. Photogramm. Eng. Remote Sens. 2015, 81, 143–154. [Google Scholar] [CrossRef]
  53. Alcaras, E.; Costantino, D.; Guastaferro, F.; Parente, C.; Pepe, M. Normalized Burn Ratio Plus (NBR+): A New Index for Sentinel-2 Imagery. Remote Sens. 2022, 14, 1727. [Google Scholar] [CrossRef]
  54. Martins, V.S.; Novo, E.M.L.M.; Lyapustin, A.; Aragão, L.E.O.C.; Freitas, S.R.; Barbosa, C.C.F. Seasonal and interannual assessment of cloud cover and atmospheric constituents across the Amazon (2000–2015): Insights for remote sensing and climate analysis. ISPRS J. Photogramm. Remote Sens. 2018, 145, 309–327. [Google Scholar] [CrossRef]
  55. Melchiorre, A.; Boschetti, L. Global Analysis of Burned Area Persistence Time with MODIS Data. Remote Sens. 2018, 10, 750. [Google Scholar] [CrossRef]
  56. Alencar, A.; Asner, G.P.; Knapp, D.; Zarin, D. Temporal variability of forest fires in eastern Amazonia. Ecol. Appl. 2011, 21, 2397–2412. [Google Scholar] [CrossRef]
  57. Chuvieco, E.; Mouillot, F.; van der Werf, G.R.; San Miguel, J.; Tanase, M.; Koutsias, N.; García, M.; Yebra, M.; Padilla, M.; Gitas, I.; et al. Historical background and current developments for mapping burned area from satellite Earth observation. Remote Sens. Environ. 2019, 225, 45–64. [Google Scholar] [CrossRef]
  58. Mouillot, F.; Schultz, M.G.; Yue, C.; Cadule, P.; Tansey, K.; Ciais, P.; Chuvieco, E. Ten years of global burned area products from spaceborne remote sensing—A review: Analysis of user needs and recommendations for future developments. Int. J. Appl. Earth Obs. Geoinf. 2014, 26, 64–79. [Google Scholar] [CrossRef]
  59. Padilla, M.; Stehman, S.V.; Ramo, R.; Corti, D.; Hantson, S.; Oliva, P.; Alonso-Canas, I.; Bradley, A.V.; Tansey, K.; Mota, B.; et al. Comparing the accuracies of remote sensing global burned area products using stratified random sampling and estimation. Remote Sens. Environ. 2015, 160, 114–121. [Google Scholar] [CrossRef]
  60. Fornacca, D.; Ren, G.; Xiao, W. Performance of Three MODIS Fire Products (MCD45A1, MCD64A1, MCD14ML), and ESA Fire_CCI in a Mountainous Area of Northwest Yunnan, China, Characterized by Frequent Small Fires. Remote Sens. 2017, 9, 1131. [Google Scholar] [CrossRef]
  61. Humber, M.L.; Boschetti, L.; Giglio, L.; Justice, C.O. Spatial and temporal intercomparison of four global burned area products. Int. J. Digit. Earth 2019, 12, 460–484. [Google Scholar] [CrossRef]
  62. Rodrigues, J.A.; Libonati, R.; Pereira, A.A.; Nogueira, J.M.P.; Santos, F.L.M.; Peres, L.F.; Santa Rosa, A.; Schroeder, W.; Pereira, J.M.C.; Giglio, L.; et al. How well do global burned area products represent fire patterns in the Brazilian Savannas biome? An accuracy assessment of the MCD64 collections. Int. J. Appl. Earth Obs. Geoinf. 2019, 78, 318–331. [Google Scholar] [CrossRef]
  63. Pessôa, A.C.M.; Anderson, L.O.; Carvalho, N.S.; Campanharo, W.A.; Junior, C.H.L.S.; Rosan, T.M.; Reis, J.B.C.; Pereira, F.R.S.; Assis, M.; Jacon, A.D.; et al. Intercomparison of Burned Area Products and Its Implication for Carbon Emission Estimations in the Amazon. Remote Sens. 2020, 12, 3864. [Google Scholar] [CrossRef]
  64. Shimabukuro, Y.E.; de Oliveira, G.; Pereira, G.; Arai, E.; Cardozo, F.; Dutra, A.C.; Mataveli, G. Assessment of Burned Areas during the Pantanal Fire Crisis in 2020 Using Sentinel-2 Images. Fire 2023, 6, 277. [Google Scholar] [CrossRef]
  65. Shimabukuro, Y.E.; Dutra, A.C.; Arai, E.; Duarte, V.; Cassol, H.L.; Pereira, G.; Cardozo, F.D. Mapping Burned Areas of Mato Grosso State Brazilian Amazon Using Multisensor Datasets. Remote Sens. 2020, 12, 3827. [Google Scholar] [CrossRef]
  66. Randerson, J.T.; Chen, Y.; van der Werf, G.R.; Rogers, B.M.; Morton, D.C. Global burned area and biomass burning emissions from small fires. J. Geophys. Res. 2012, 117, G04012. [Google Scholar] [CrossRef]
  67. Shiraishi, T.; Hirata, R. Estimation of carbon dioxide emissions from the megafires of Australia in 2019–2020. Sci. Rep. 2021, 11, 8267. [Google Scholar] [CrossRef]
  68. Giglio, L.; Schroeder, W.; Justice, C.O. The collection 6 MODIS active fire detection algorithm and fire products. Remote Sens. Environ. 2016, 178, 31–41. [Google Scholar] [CrossRef] [PubMed]
  69. Andela, N.; Morton, D.C.; Giglio, L.; Chen, Y.; van der Werf, G.R.; Kasibhatla, P.S.; DeFries, R.S.; Collatz, G.J.; Hantson, S.; Kloster, S.; et al. A human-driven decline in global burned area. Science 2017, 356, 1356–1362. [Google Scholar] [CrossRef]
  70. Long, T.; Zhang, Z.; He, G.; Jiao, W.; Tang, C.; Wu, B.; Zhang, X.; Wang, G.; Yin, R. 30 m Resolution Global Annual Burned Area Mapping Based on Landsat Images and Google Earth Engine. Remote Sens. 2019, 11, 489. [Google Scholar] [CrossRef]
  71. Alencar, A.A.C.; Arruda, V.L.S.; Silva, W.V.; Conciani, D.E.; Costa, D.P.; Crusco, N.; Duverger, S.G.; Ferreira, N.C.; Franca-Rocha, W.; Hasenack, H.; et al. Long-Term Landsat-Based Monthly Burned Area Dataset for the Brazilian Biomes Using Deep Learning. Remote Sens. 2022, 14, 2510. [Google Scholar] [CrossRef]
  72. Hawbaker, T.J.; Vanderhoof, M.K.; Beal, Y.-J.; Takacs, J.D.; Schmidt, G.L.; Falgout, J.T.; Williams, B.; Fairaux, N.M.; Caldwell, M.K.; Picotte, J.J.; et al. Mapping burned areas using dense time-series of Landsat data. Remote Sens. Environ. 2017, 198, 504–522. [Google Scholar] [CrossRef]
  73. Ferreira, K.R.; Queiroz, G.R.; Vinhas, L.; Marujo, R.F.B.; Simoes, R.E.O.; Picoli, M.C.A.; Camara, G.; Cartaxo, R.; Gomes, V.C.F.; Santos, L.A.; et al. Earth Observation Data Cubes for Brazil: Requirements, Methodology and Products. Remote Sens. 2020, 12, 4033. [Google Scholar] [CrossRef]
  74. Picoli, M.C.A.; Simoes, R.; Chaves, M.; Santos, L.A.; Sanchez, A.; Soares, A.; Sanches, I.D.; Ferreira, K.R.; Queiroz, G.R. CBERS data cube: A powerful technology for apping and monitoring Brazilian biomes. ISPRS Ann. Photogramm. Remote Sens. Spat. Inf. Sci. 2020, 3, 533–539. [Google Scholar] [CrossRef]
  75. Anderson, L.O.; Aragão, L.E.O.E.C.D.; Lima, A.D.; Shimabukuro, Y.E. Detecção de cicatrizes de áreas queimadas baseada no modelo linear de mistura espectral e imagens índice de vegetação utilizando dados multitemporais do sensor MODIS/TERRA no estado do Mato Grosso, Amazônia brasileira. Acta Amaz. 2005, 35, 445–456. [Google Scholar] [CrossRef]
  76. Lima, A.; Silva, T.S.F.; Aragão, L.E.O.E.C.D.; Feitas, R.M.D.; Adami, M.; Formaggio, A.R.; Shimabukuro, Y.E. Land use and land cover changes determine the spatial relationship between fire and deforestation in the Brazilian Amazon. Appl. Geogr. 2012, 34, 239–246. [Google Scholar] [CrossRef]
  77. Cardozo, F.D.; Pereira, G.; Shimabukuro, Y.E.; Moraes, E.C. Analysis and Assessment of the Spatial and Temporal Distribution of Burned Areas in the Amazon Forest. Remote Sens. 2014, 6, 8002–8025. [Google Scholar] [CrossRef]
  78. Anderson, L.O.; Aragão, L.E.O.C.; Gloor, M.; Arai, E.; Adami, M.; Saatchi, S.S.; Malhi, Y.; Shimabukuro, Y.E.; Barlow, J.; Berenguer, E.; et al. Disentangling the contribution of multiple land covers to fire-mediated carbon emissions in Amazonia during the 2010 drought. Glob. Biogeochem. Cycles 2015, 29, 1739–1753. [Google Scholar] [CrossRef] [PubMed]
  79. Shimabukuro, Y.E.; Arai, E.; Anderson, L.O.; Aragão, L.E.O.e.C.d.; Duarte, V. Mapping Degraded Forest Areas Caused by Fires during The Year 2010 in Mato Grosso State, Brazilian Legal Amazon Using Landsat-5 Tm Fraction Images. Rev. Bras. Cartogr. 2017, 69, 23–32. [Google Scholar] [CrossRef]
  80. Chaves, M.E.D.; Soares, A.R.; Mataveli, G.A.V.; Sánchez, A.H.; Sanches, I.D. A Semi-Automated Workflow for LULC Mapping via Sentinel-2 Data Cubes and Spectral Indices. Automation 2023, 4, 94–109. [Google Scholar] [CrossRef]
  81. Chaves, M.E.D.; Soares, A.R.; Sanches, I.D.; Fronza, J.G. CBERS data cubes for land use and land cover mapping in the Brazilian Cerrado agricultural belt. Int. J. Remote Sens. 2021, 42, 8398–8432. [Google Scholar] [CrossRef]
  82. Adorno, B.V.; Körting, T.S.; Amaral, S. Contribution of time-series data cubes to classify urban vegetation types by remote sensing. Urban For. Urban Green. 2023, 79, 127817. [Google Scholar] [CrossRef]
  83. Chaves, M.E.D.; Sanches, I.D. Improving crop mapping in Brazil’s Cerrado from a data cubes-derived Sentinel-2 temporal analysis. Remote Sens. Appl. Soc. Environ. 2023, 32, 101014. [Google Scholar] [CrossRef]
  84. INPE—Instituto Nacional de Pesquisas Espaciais. Coordenação Geral de Observação da Terra. Programa de Monitoramento da Amazônia e Demais Biomas. Desmatamento—Amazônia Legal. Available online: http://terrabrasilis.dpi.inpe.br/downloads/ (accessed on 27 December 2023).
  85. Lopes, J.M.A.; Santos, A.M.; Nunes, F.G. Análise do desmatamento nas áreas de influência da BR-421 e as pressões sobre áreas especiais no oeste de Rondônia. Soc. Territ. 2019, 31, 282–304. [Google Scholar] [CrossRef]
  86. Santos, A.M.d.; Silva, C.F.A.d.; Almeida Junior, P.M.d.; Rudke, A.P.; Melo, S.N.d. Deforestation drivers in the Brazilian Amazon: Assessing new spatial predictors. J. Environ. Manag. 2021, 294, 113020. [Google Scholar] [CrossRef]
  87. Silva, C.F.A.; Alvarado, S.T.; Santos, A.M.; Andrade, M.O.; Melo, S.N. Highway Network and Fire Occurrence in Amazonian Indigenous Lands. Sustainability 2022, 14, 9167. [Google Scholar] [CrossRef]
  88. da Silva, C.F.A.; de Andrade, M.O.; dos Santos, A.M.; de Melo, S.N. Road network and deforestation of indigenous lands in the Brazilian Amazon. Transp. Res. Part D Transp. Environ. 2023, 119, 103735. [Google Scholar] [CrossRef]
  89. IBGE—Instituto Brasileiro de Geografia e Estatísticas. Manual Técnico da Vegetação Brasileira: Sistema Fitogeográfico, Inventário das Formações Florestais e Campestres, Técnicas e Manejo de Coleções Botânicas, Procedimentos Para Mapeamentos; IBGE: Rio de Janeiro, Brazil, 2012. [Google Scholar]
  90. Alvares, C.A.; Stape, J.L.; Sentelhas, P.C.; Gonçalves, J.d.M.; Sparovek, G. Köppen’s climate classification map for Brazil. Meteorol. Z. 2013, 22, 711–728. [Google Scholar] [CrossRef] [PubMed]
  91. INPE—Instituto Nacional de Pesquisas Espaciais. Coordenação Geral de Observação da Terra. Programa Queimadas—BD QUEIMADAS. Available online: http://terrabrasilis.dpi.inpe.br/queimadas/bdqueimadas/ (accessed on 27 December 2023).
  92. Giglio, L.; Boschetti, L.; Roy, D.P.; Humber, M.L.; Justice, C.O. The Collection 6 MODIS burned area mapping algorithm and product. Remote Sens. Environ. 2018, 217, 72–85. [Google Scholar] [CrossRef]
  93. Andela, N.; Morton, D.C.; Giglio, L.; Paugam, R.; Chen, Y.; Hantson, S.; van der Werf, G.R.; Randerson, J.T. The Global Fire Atlas of individual fire size, duration, speed and direction. Earth Syst. Sci. Data 2019, 11, 529–552. [Google Scholar] [CrossRef]
  94. Chuvieco, E.; Lizundia-Loiola, J.; Pettinari, M.L.; Ramo, R.; Padilla, M.; Tansey, K.; Mouillot, F.; Laurent, P.; Storm, T.; Heil, A.; et al. Generation and analysis of a new global burned area product based on MODIS 250m reflectance bands and thermal anomalies. Earth Syst. Sci. Data 2018, 10, 2015–2031. [Google Scholar] [CrossRef]
  95. Lizundia-Loiola, J.; Otón, G.; Ramo, R.; Chuvieco, E. A spatio-temporal active-fire clustering approach for global burned area mapping at 250 m from MODIS data. Remote Sens. Environ. 2020, 236, 111493. [Google Scholar] [CrossRef]
  96. MapBiomas Project. MapBiomas-Accuracy Assessment of Collection 6.0 Cover & Use Maps. Available online: http://mapbiomas.org/en/accuracy-statistics?cama_set_language=en (accessed on 27 December 2023).
  97. INPE—Instituto Nacional de Pesquisas Espaciais. CBERS Program. Available online: http://www.cbers.inpe.br/sobre/index.php# (accessed on 27 December 2023).
  98. Brazil Data Cube Project. Data Cube Explorer. Available online: https://brazildatacube.dpi.inpe.br/portal/explore (accessed on 27 December 2023).
  99. Shimabukuro, Y.E.; Smith, J.A. The least-squares mixing models to generate fraction images derived from remote sensing multispectral data. IEEE Trans. Geosci. Remote Sens. 1991, 29, 16–20. [Google Scholar] [CrossRef]
  100. Bins, L.S.; Fonseca, L.M.G.; Erthal, G.J.; Mitsuo, F.A. Satellite imagery segmentation: A region growing approach. In Proceedings of the VIII Simpósio Brasileiro de Sensoriamento Remoto, Salvador, BA, Brazil, 14–19 April 1996; pp. 677–680. [Google Scholar]
  101. INPE—Instituto Nacional de Pesquisas Espaciais. TerraView Project. Available online: http://www.dpi.inpe.br/terralib5/wiki/doku.php?id=start (accessed on 27 December 2023).
  102. Dutra, D.J.; Fearnside, P.M.; Yanai, A.M.; Graça, P.M.L.d.A.; Dalagnol, R.; Pessôa, A.C.M.; Cabral, B.F.; Burton, C.; Jones, C.; Betts, R.; et al. Burned area mapping in Different Data Products for the Southwest of the Brazilian Amazon. Rev. Bras. Cartogr. 2023, 75, 1–16. [Google Scholar] [CrossRef]
  103. Anderson, L.O.; Cheek, D.; Aragao, L.E.O.C.; Andere, L.; Duarte, B.; Salazar, N.; Lima, A.; Duarte, V.; Arai, E. Development of a Point-based Method for Map Validation and Confidence Interval Estimation: A Case Study of Burned Areas in Amazonia. J. Remote Sens. GIS 2017, 6, 193. [Google Scholar] [CrossRef]
  104. Giglio, L.; van der Werf, G.R.; Randerson, J.T.; Collatz, G.J.; Kasibhatla, P. Global estimation of burned area using MODIS active fire observations. Atmos. Chem. Phys. 2006, 6, 957–974. [Google Scholar] [CrossRef]
  105. Souza, C.M.; Shimbo, J.Z.; Rosa, M.R.; Parente, L.L.; Alencar, A.A.; Rudorff, B.F.T.; Hasenack, H.; Matsumoto, M.; Ferreira, L.G.; Souza-Filho, P.W.M.; et al. Reconstructing Three Decades of Land Use and Land Cover Changes in Brazilian Biomes with Landsat Archive and Earth Engine. Remote Sens. 2020, 12, 2735. [Google Scholar] [CrossRef]
  106. Assis, T.O.; Escada, M.I.; Amaral, S. Effects of Deforestation over the Cerrado Landscape: A Study in the Bahia Frontier. Land 2021, 10, 352. [Google Scholar] [CrossRef]
  107. Roy, D.P.; Boschetti, L. Southern Africa Validation of the MODIS, L3JRC, and GlobCarbon Burned-Area Products. IEEE Trans. Geosci. Remote Sens. 2009, 47, 1032–1044. [Google Scholar] [CrossRef]
  108. Visser, H.; de Nijs, T. The Map Comparison Kit. Environ. Model. Softw. 2006, 21, 346–358. [Google Scholar] [CrossRef]
  109. RIKS BV—Research Institute for Knowledge Systems. Map Comparison Kit 3: User Manual; Research Institute for Knowledge Systems: Maastricht, The Netherlands, 2010. [Google Scholar]
  110. Libonati, R.; Pereira, A.A.; Santos, F.L.M.; Rodrigues, J.A.; Rosa, A.S.; Melchiori, A.E.; Morelli, F.; Setzer, A.W. Sensoriamento remoto de áreas queimadas no Brasil: Progressos, incertezas, desafios, e perspectivas futuras. In Queimadas e Incêndios Florestais: Mediante Monitoramento Orbital; Setzer, A.W., Ferreira, N.J., Eds.; Oficina de Textos: São Paulo, Brazil, 2021; pp. 53–80. [Google Scholar]
  111. Padilla, M.; Stehman, S.V.; Litago, J.; Chuvieco, E. Assessing the Temporal Stability of the Accuracy of a Time Series of Burned Area Products. Remote Sens. 2014, 6, 2050–2068. [Google Scholar] [CrossRef]
  112. Herrera, D.; Pfaff, A.; Robalino, J. Impacts of protected areas vary with the level of government: Comparing avoided deforestation across agencies in the Brazilian Amazon. Proc. Natl. Acad. Sci. USA 2019, 116, 14916–14925. [Google Scholar] [CrossRef] [PubMed]
  113. Silva-Junior, C.H.L.; Silva, F.B.; Arisi, B.M.; Mataveli, G.; Pessôa, A.C.M.; Carvalho, N.S.; Reis, J.B.C.; Silva Júnior, A.R.; Motta, N.A.C.S.; E Silva, P.V.M.; et al. Brazilian Amazon indigenous territories under deforestation pressure. Sci. Rep. 2023, 13, 5851. [Google Scholar] [CrossRef] [PubMed]
  114. dos Santos, A.M.; da Silva, C.F.A.; de Melo, S.N.; de Almeida Junior, P.M.; Bueno, L.F. Influence of deforestation inside and outside indigenous lands in the Brazilian Amazon Biome. Reg. Environ. Chang. 2022, 22, 77. [Google Scholar] [CrossRef]
  115. Pessôa, A.C.M.; Morello R.S., T.F.; Silva-Junior, C.H.L.; Doblas, J.; Carvalho, N.S.; Aragão, L.E.O.C.; Anderson, L.O. Protected areas are effective on curbing fires in the Amazon. Ecol. Econ. 2023, 214, 107983. [Google Scholar] [CrossRef]
  116. Santos, A.M.d.; Silva, C.F.A.d.; Rudke, A.P.; Oliveira Soares, D.d. Dynamics of active fire data and their relationship with fires in the areas of regularized indigenous lands in the Southern Amazon. Remote Sens. Appl. Soc. Environ. 2021, 23, 100570. [Google Scholar] [CrossRef]
  117. Chen, Y.; Hall, J.; van Wees, D.; Andela, N.; Hantson, S.; Giglio, L.; van der Werf, G.R.; Morton, D.C.; Randerson, J.T. Multi-decadal trends and variability in burned area from the fifth version of the Global Fire Emissions Database (GFED5). Earth Syst. Sci. Data 2023, 15, 5227–5259. [Google Scholar] [CrossRef]
  118. Chen, Y.; Morton, D.C.; Jin, Y.; Collatz, G.J.; Kasibhatla, P.S.; van der Werf, G.R.; DeFries, R.S.; Randerson, J.T. Long-term trends and interannual variability of forest, savanna and agricultural fires in South America. Carbon Manag. 2013, 4, 617–638. [Google Scholar] [CrossRef]
  119. Roberts, G.; Wooster, M.J.; Lagoudakis, E. Annual and diurnal african biomass burning temporal dynamics. Biogeosciences 2009, 6, 849–866. [Google Scholar] [CrossRef]
  120. Katagis, T.; Gitas, I.Z. Assessing the Accuracy of MODIS MCD64A1 C6 and FireCCI51 Burned Area Products in Mediterranean Ecosystems. Remote Sens. 2022, 14, 602. [Google Scholar] [CrossRef]
  121. Brennan, J.; Gómez-Dans, J.L.; Disney, M.; Lewis, P. Theoretical uncertainties for global satellite-derived burned area estimates. Biogeosciences 2019, 16, 3147–3164. [Google Scholar] [CrossRef]
  122. Morton, D.C.; DeFries, R.S.; Nagol, J.; Souza, C.M.; Kasischke, E.S.; Hurtt, G.C.; Dubayah, R. Mapping canopy damage from understory fires in Amazon forests using annual time series of Landsat and MODIS data. Remote Sens. Environ. 2011, 115, 1706–1720. [Google Scholar] [CrossRef]
  123. Shimabukuro, Y.E.; Miettinen, J.; Beuchle, R.; Grecchi, R.C.; Simonetti, D.; Achard, F. Estimating Burned Area in Mato Grosso, Brazil, Using an Object-Based Classification Method on a Systematic Sample of Medium Resolution Satellite Images. IEEE J. Sel. Top. Appl. Earth Obs. Remote Sens. 2015, 8, 4502–4508. [Google Scholar] [CrossRef]
  124. Alonso-Canas, I.; Chuvieco, E. Global burned area mapping from ENVISAT-MERIS and MODIS active fire data. Remote Sens. Environ. 2015, 163, 140–152. [Google Scholar] [CrossRef]
  125. Arcanjo, J.S.; Marujo, R.d.F.B.; Souza, R.C.M.d.; Costa, R.W.; Queiroz, G.R.d.; Ferreira, K.R. A multi-source wfi datacube of CBERS-4 and CBERS-4A images: Improving visual interpretation. In Proceedings of the XX Brazilian Symposium on Remote Sensing, Florianópolis, Brazil, 2–5 April 2023; pp. 3348–3350. [Google Scholar]
  126. Morton, D.C.; Coffield, S.; Chen, Y.; Arevalo, P.A.; Uribe, M.d.R.; Brando, P.M.; Randerson, J.T.; Alencar, A. Enhanced Amazon Fire Detection and Tracking to Mitigate Ecosystem and Climate Impacts from Forest Degradation. In Proceedings of the AGU23, San Francisco, CA, USA, 11–15 December 2023. B13G-1983. [Google Scholar]
  127. Bonilla, E.X.; Mickley, L.J.; Raheja, G.; Eastham, S.D.; Buonocore, J.J.; Alencar, A.; Verchot, L.; Westervelt, D.M.; Castro, M.C. Health impacts of smoke exposure in South America: Increased risk for populations in the Amazonian Indigenous territories. Environ. Res. Health 2023, 1, 021007. [Google Scholar] [CrossRef]
  128. Hislop, S.; Jones, S.; Soto-Berelov, M.; Skidmore, A.; Haywood, A.; Nguyen, T.H. Using Landsat Spectral Indices in Time-Series to Assess Wildfire Disturbance and Recovery. Remote Sens. 2018, 10, 460. [Google Scholar] [CrossRef]
Figure 1. Study area located in the state of Rondônia, in the Southwest Amazon region, depicting the land use land cover (LULC) classes in 2020 according to MapBiomas data.
Fire 07 00067 g001
Figure 2. General methodological flowchart representing the stages of this research.
Fire 07 00067 g002
Figure 3. Reference burned area map represented in different grid cell sizes: (a) 1 × 1 km cells; (b) 5 × 5 km cells; and (c) 10 × 10 km cells.
Fire 07 00067 g003
Figure 4. Total burned area mapped by reference, MCD64A1, Fire_cci, GABAM, MapBiomas Fogo and CBERS over forested areas and non-forested areas, considering the whole study area.
Fire 07 00067 g004
Figure 5. Spatial distribution of the burned area mapped in the study area during the year 2020 by the map of reference, four operational burned area products, and the method based on CBERS data cubes and the LSMM.
Fire 07 00067 g005
Figure 6. Burned area spatial distribution in a 1 km × 1 km regular grid. Each grid cell contains the burned proportion indicated by the color gradient.
Fire 07 00067 g006
Figure 7. Similarity maps of the best and worst comparison pairs of burned area products. The similarity index was calculated taking into account only cells that have burned area detected by at least one product. The similarity index ranges from 0 (lowest similarity) highlighted in dark red to 1 (highest similarity) highlighted in blue.
Fire 07 00067 g007
Table 1. Description of the global BA products evaluated in this study.
ProductSensorSpatial ResolutionScaleTimeReference
MCD64A1 c6.0MODIS500 mGlobal2000–2022[92]
Fire_cci v.5.1MODIS250 mGlobal2001–2020[95]
GABAMLandsat30 mGlobal2000–2021[70]
MapBiomas Fogo c1.0Landsat30 mBrazil1985–2021[71]
Table 2. Evaluation metrics for the regression models for the different pairs of burned area maps, considering the percentage of burned area in 1 km grid cells.
ModelRR2RMSEMBMB (% of Observed)
Reference × MCD64A10.580.330.1970.07340.34
Reference × Fire_cci0.310.090.2290.15988.07
Reference × GABAM0.410.170.2200.15686.61
Reference × MapBiomas0.870.760.1180.0147.54
Reference × CBERS0.850.720.128−0.022−12.30
CBERS × MCD64A10.520.270.2150.09546.88
CBERS × Fire_cci0.300.090.2410.18189.38
CBERS × GABAM0.410.170.2290.17888.08
CBERS × MapBiomas0.800.630.1520.03617.67
MapBiomas × MCD64A10.630.390.1880.06035.48
MapBiomas × Fire_cci0.340.120.2270.14587.10
MapBiomas × GABAM0.460.210.2140.14285.52
MCD64A1 × GABAM0.250.060.2530.08377.56
MCD64A1 × Fire_cci0.280.080.2510.08680.01
GABAM × Fire_cci0.100.010.0680.00310.89
Table 3. Overall similarity for the different pairs of burned area maps. The similarity index ranges from 0 (totally different) to 1 (totally identical), and it was calculated using the fuzzy numerical algorithm for map comparison.
Product CombinationsOverall Similarity
Reference × MapBiomas0.70
Reference × MCD64A10.41
Reference × GABAM0.33
Reference × Fire_cci0.27
Reference × CBERS0.68
CBERS × MCD64A1 0.42
CBERS × Fire_cci0.23
CBERS × GABAM0.28
CBERS X MapBiomas0.63
MapBiomas × MCD64A10.40
MapBiomas × Fire_cci0.31
MapBiomas × GABAM0.36
MCD64A1 × GABAM0.67
MCD64A1 × Fire_cci0.68
GABAM × Fire_cci0.73
Fire 07 00067 i001
Disclaimer/Publisher’s Note: The statements, opinions and data contained in all publications are solely those of the individual author(s) and contributor(s) and not of MDPI and/or the editor(s). MDPI and/or the editor(s) disclaim responsibility for any injury to people or property resulting from any ideas, methods, instructions or products referred to in the content.

