
Impact of Seasonal Heating on PM10 and PM2.5 Concentrations in Sučany, Slovakia: A Temporal and Spatial Analysis


1
Department of Highway and Environmental Engineering, Faculty of Civil Engineering, University of Zilina, Univerzitná 8215/1, 010 26 Žilina, Slovakia
2
Department of Power Engineering, Faculty of Mechanical Engineering, University of Zilina, Univerzitná 8215/1, 010 26 Žilina, Slovakia
*
Author to whom correspondence should be addressed.
Fire 2024, 7(4), 150; https://doi.org/10.3390/fire7040150
Submission received: 12 March 2024
/
Revised: 9 April 2024
/
Accepted: 16 April 2024
/
Published: 21 April 2024
(This article belongs to the Special Issue Solid Fuels – Analysis, Burning and Emissions)
Abstract
:Complying with strict PM10 and PM2.5 limit values poses challenges in many European regions, influenced by diverse factors such as natural, regional, and local anthropogenic sources. Urban air pollution, exacerbated by road transport, local industry, and dust resuspension, contrasts with rural areas affected by solid fuel-based local heating and increasing wood burning. This study focuses on village of Sučany, located in Slovakia, analysing PM concentrations during non-heating and heating seasons. The method of analysis relies on the use of the MP101M air quality analyser that utilises beta radiation absorption method. One set of measurements was conducted at five distinct locations during the heating season (18/01/2019 to 28/02/2019) and non-heating season (14/08/2018 to 1/10/2018). Significant differences emerged during the non-heating season with corresponding PM10 averages of 23.0 µg/m3 and PM2.5 at 19.3 µg/m3. In contrast, the PM10 averaged 53.9 µg/m3 and 52.8 µg/m3 during the heating season. The heating season shows PM2.5 contributing up to 98% of total PM10. The distribution of PM10 and PM2.5 pollution and the location of the potential source obtained using polar plots differed during the heating and non-heating seasons. This research underscores the impact of local heating on air quality in a typical Slovak village. The key recommendation for targeted interventions is supporting up-to-date air quality data, education, and financial incentives for citizens in order to implement cleaner and modern heating solutions.
1. Introduction
The size of PM concentrations in the air are influenced by numerous factors such as natural and regional anthropogenic sources or long-range transport. The toxicity of particles generally increases with their decreasing dimensions [1,2,3]. The chemical composition, such as organic and elemental carbon, mineral dust, marine aerosol, secondary particles (especially sulphates, nitrates, and heavy metals), also varies [4,5,6]. Currently, the largest source of PM pollution in cities is generally road transport, local industries, resuspension of particles from streets, and local heating in municipalities.
In winter, the air quality is often detrimentally worse, especially in rural areas due to the need for household heating. These emissions often accumulate, leading to the build-up of smog. Particulate matter consists of a mixture of solid and liquid particles and enters our cardiovascular system and can cause serious health problems [7]. Particulate matter is divided into categories based on the maximum diameter of particles:
- PM10 are particulate matter smaller than 10 μm in diameter.
- PM2.5 are fine particulate matter smaller than 2.5 μm in diameter.
- PM1 are categorised as very fine particles that are smaller than 1 μm in diameter.
- PM0.1 are ultrafine particles below 0.1 μm in diameter.
A study [8] analysed a total of 419 locations at various urban districts spanning 51 countries in the world. A statistical analysis gave evidence that 25% of PM2.5 production is associated with transport, 15% are from industrial processes, 20% from domestic fuel combustion, 22% from undetermined human sources, and 18% from natural dust and salt. A CE Delft study [9] found that outdoor pollution from heating in Europe resulted in health costs of EUR 29 billion in 2018, with over EUR 27 billion attributed to fossil fuel and biomass combustion indoors, leading to an average cost of EUR 130 annually for a European household. The study advocates stringent pollutant limits and phasing out health-damaging products such as old gas stoves or open fireplaces.
In 1995, a study was conducted in 25 locations spanning Central and Eastern European countries such as Slovak Republic or Bulgaria [10]. The results revealed a two- to threefold range in particulate matter concentrations between study areas. PM10 levels rose significantly during heating seasons, driven by PM2.5 increases. The results suggest that high particulate pollution levels, particularly in Poland and Bulgaria, are likely influenced by local heating. Lastly, a study in the Czech Republic [11] showed higher PM10, PM2.5, and black smoke concentrations in villages compared to its surroundings. The comparison with larger towns emphasised the significant contribution of traditional heating to local air pollution.
From January 2020 to 2023, air quality measurements were carried out in the city of Legionowo (Poland) with a study area of approximately 15 km2. The measurements were executed by 14 wireless devices provided by the polish company Airly (Krakow, Poland). The devices were equipped with the PMS5003 and DHT22 sensors to measure PM concentration, relative humidity, and air temperature. The data was validated and corrected using a 14-day measurement with laboratory-approved FIDAS 200. It was widely seen that PM2.5 had a significantly stronger correlation than the PM10. While PM1 had a mean absolute error of 2.5 μg/m3, that of PM10 was 16.28 μg/m3. A linear analysis of factors showed that PM has a negative dependence with wind speed and temperature up to 18 degrees, after which it begins to rise. Relative humidity always showed a positive correlation of PM concentrations [12].
The implementation of modern heating equipment has a significant impact during the heating season. For instance, policymakers within a residential area of North China were able to decrease the AQI (Air Quality Index) from 85.3 to 24.1 within a span of only three years [13]. Another survey evaluated residential heating as the primary source of air pollution, with Dolná Lhota (PM10 = 44.13 μg/m3) and Kravaře (PM10 = 43.98 μg/m3) overtaking the highly industrial Vratimov (PM10 = 34.38 μg/m3) during the heating season [14]. Lastly, the heating season can reach an air quality index as high as 118.4, while that during off-heating seasons drop to 74.3. Average PM2.5 drops by 58%, from 75.3 μg/m3 to 47.7 μg/m3 [15]. These studies support the fact that it is impertinent to investigate the factors that influence emission production during the heating season and its distribution.
Pollutants show lower concentrations during warmer periods, especially during summer, and significantly higher concentrations have been observed in the winter heating season. This was associated due to seasonal changes in energy consumption (biomass combustion) and atmospheric stability. Subsequently, in February, the highest PM10 concentration was 132 μg/m3, which is four times higher than the highest recorded monthly average [16]. Not only that, but it also varies with respect to the day of the week. For instance, on weekend evenings, peak concentrations showed an increase of up to 929% (data determined from 2-min averages) [17].
According to the Slovakian Statistical Institute, wood, coal, pellets, and briquettes are used by 190,000 households. The Slovak Meteorological Institute (SHMÚ) mapped heating in Slovak households, which is responsible for 13% of emissions. These emissions are currently not regulated by legislation [18]. Unfortunately, in a common effort to save on fuel costs, households exploit improper fuel sources, neglect apt storage, or even turn to household waste as a fuel source. Research at the University of Žilina [19] evaluated storage processes of solid fuel samples, ranging from suitable (7.58% humidity) to unsuitable fuel (46.95% humidity). The results showed that all heat output, combustion efficiency, and concentration of gaseous and solid emissions in the flue gases increased (Figure 1). The average thermal efficiency of the small heat source decreased from 80% to 23% and PM production increased from 12.7 mg/m3 to 60.9 mg/m3. This shows how impertinent it is to educate the general public about the best practices of fuel storage and use.
The age and type of heating device have a tremendous effect on pollutant production, associated with almost hundredfold decrease in emissions. In [20], an old open fire stove was compared to a state-of-the-art boiler with gasification technology (during heating season). Pollutant per fuel production ratio showed drastic decrease from 11.6–17 g/kg for the older equipment to only 0.29–0.554 g/kg, a decrease of 95–98%. Another study [21] demonstrated that burning beech wood in an old open boiler leads to emission factors of 562 to 2150 mg/kg, whereas using a modern plant with automatic regulation and loading led to 69.1–118 mg/kg. In the Czech Republic [22], the highest concentrations of PM (81.6–89.4 g/kg) were found in emissions from old boilers (burn-through boilers burning brown and hard coal), while automatic boilers showed the lowest value of only 0.199 g/kg. For an automatic wood pellet boiler, the measured production of PM was only 173 mg/kg compared to a log-wood boiler up to 1043 mg/kg at the same heat output [23]. Taking the large fuel cost savings into account, the return to investment of implementing modern boilers could be in the range of 3–8 years.
The type of fuel also plays a key role in emission production. A Slovak study measured the emission factor for solid fuels (wood) at 270 mg/kWh and for natural gas at 31.7 mg/kWh for PM [24]. A 20 kW wood pellet boiler achieves an efficiency of around 80%, with particle concentrations ranging from 38 to 360 mgNm−3. Particles below 1 μm ranged from 104 to 106 particles/cm3 [22]. Small-scale combustion of low-density oil was shown to have the lowest PM1 emissions of 0.1 mg/MJ. Burning wood, especially in medium-sized boilers with electrostatic precipitators, showed reduced PM1 emissions (0.6 mg/MJ) [25].
There is strong evidence for the effects of short-term exposure to PM10 on respiratory health. In terms of mortality (mainly due to long-term exposure), PM2.5 is a stronger risk factor than the coarse portion of PM10. It is estimated that every day mortality increases by 0.2–0.6% per 10 μg/m3 increase of PM10 [26,27]. A long period of exposure to PM2.5 is associated with an increase in the long-term risk of cardiopulmonary disease with mortality of 6–13% per 10 μg/m3 PM2.5 increase [28,29,30]. Groups with pre-existing lung or heart disease are particularly prone. For example, exposure to PM affects lung development in children, including reversible lung function deficits, as well as chronically reduced lung growth rate and long-term lung function deficits [31,32,33].
The literature does not present any evidence of a safe threshold below which no adverse health effects occurs. Exposure is ubiquitous and involuntary. PM concentrations caused by the combustion of both mobile and stationary sources are more consistent than any other miscellaneous source [34]. Black carbon particulates are a product of incomplete combustion and have attracted the attention of the air quality community due to strong adverse health and climate effects. Table 1 shows the most common air pollutants, the respective short- or long-term exposure periods, and their effects on human health. To note, long-term exposure to high concentrations of PM can cause deterioration of lung function, bronchitis, lung cancer, or heart failure [35].
The trajectory of particulates is naturally liable to external forces within the atmosphere. Factors such as wind speed/direction, pressure gradients, and precipitation play a role in the dispersion of pollutants. During a measurement of seven locations within a residential area, PM concentrations correlated negatively with the relative humidity of air [36]. In 2013, a study was carried out in the Nagasaki prefecture (Japan) using 14 air quality monitoring stations [8]. Most months, PM2.5 has a strong positive correlation with temperature due to high temperature promoting photochemical reactions. To add to this, wind speeds below 3 m/s showed a positive correlation with PM2.5 concentrations, whereas greater than 3 m/s showed a negative correlation. This was explained as small wind speeds caused the distribution of pollutants only over a certain geographical range. Large wind speeds, however, were able to transport large amounts of pollutants over into the residential area.
The objective of this study is to understand and evaluate the influence of local heating on PM and the influence of weather (temperature/wind direction) on the distribution in residential areas. The hypothesis is that the PM concentrations will significantly increase during the heating season, and that the emissions will have both a positive and negative correlation with wind speed depending on the range (speeds below 3 m/s and above).
2. Materials and Methods
2.1. Measurement Location
Sučany is the largest village in the Turiec region. It lies 7 km northeast of the town of Martin, at an altitude of 393 m above sea level. The village of Sučany has 4711 inhabitants with a population density of 142 inhabitants per km2. There are 1217 family houses and 48 apartment buildings in the village.
The territory of Turiec extends in the northwestern part of Slovakia in the Turčianska basin (formed by the river Turiec), which is significantly closed off by the mountains of Malá and Veľká Fatra, Kremnické vrchy, and the Žiar mountain range. The climate of the Turiec region is influenced by air flows from tropical regions that enter from the Mediterranean, especially in the summer months, and arctic air flows from the northeast during winter. The predominant wind direction is the north, followed by south in second.
Based on SHMÚ data, 74% of days in a year show average wind speeds below 2 m/s. This tends to inhibit emission dispersion conditions and support frequent inverse states of the atmosphere. The exposure limits for PM pollution are repeatedly exceeded, especially in winter and spring. The Turiec region is associated with an increased use of solid fuel for domestic heating, which is the most significant source of PM10 and PM2.5 pollution in this area.
As for the measurement setup, five distinct locations were selected to be monitored, denoted as MS1–MS5 (as shown in Figure 2). Each location was monitored for approximately 6 days during both the non-heating season (in 2018) and the heating season (in 2019). The locations are described as follows (also summarised in Table 2):
- MS1 is located in the centre of the village near the central square. In the vicinity are parking spaces, local roads, civic amenities (shops, administration), and family houses.
- MS2 is located near the Class I road I/18 with a considerable 24-h traffic volume of 11,359 vehicles/24 h (weekly average).
- MS3 was chosen in the northern part of the village at the water channel of the river Váh. A large portion consists of family houses. To the south stands a light industrial production facility.
- MS4 is located southernmost of Sučany next to apartment buildings, while on the south side is an open space with agricultural production. To the north is the industrial production of building materials.
- MS5 is located in a part of the village with family houses.
2.2. Metodology of Measurements
Air quality measurements were carried out in two stages. The first stage took place in the period when the impact of local heating was not foreseen, from 14/08/2018 to 01/10/2018. The second stage took place in the heating season, that is, from 18/01/2019 to 28/02/2019. The measurements were carried out by a mobile monitoring station equipped with MP101M analysers (ENVEA, Poissy, France). MP101M devices are designed to measure the concentration of PM10 and PM2.5 particulate matter in outdoor air using the beta-ray absorption method. The full-scale measurement range of the device is 0–500 mg/m3. The device is a professional laboratory-approved continuous air quality monitoring device; therefore, the accuracy is considered sufficient for the scope of the study in comparison with other articles. The measurements were carried out in accordance with the standard ISO 10473:2000 [37].
The amount of dust deposited on a filter (e.g., manufactured from fiberglass) is determined by the attenuation of radioactive radiation of the carbon 14 (measured using a Geiger–Müller reader). Carbon 14 is a low-intensity source with a half-life of approximately 5730 years. Using the gravimetric method, the dust contaminated air is pumped into the sampling system. The growing layer of dust particles causes the aforementioned attenuation of beta radiation intensity. The validation process was completed with the gravimetric method as reference. The comparative measurements demonstrated very strong linear correlations obtained by regression analysis: PM10 r = 0.973, R2 = 0.9464 and PM2.5 r = 0.966, R2 = 0.9329.
2.3. Data Analysis
Data analysis was carried out using the R program (R 4.3.2) using openair package with different analytical tools (windRose, pollutionRose, polarPlot, timeVariation, pollroseMap, windroseMap) and openairmaps package.
The polarPlot function plots a bivariate polar plot of concentrations. Concentrations are shown to vary by wind speed and wind direction. Polar plots are shown as a continuous surface, and surfaces are calculated through modelling using smoothing techniques. These plots have proved to be useful for quickly gaining a graphical impression of potential sources’ influences at a location [38].
Bivariate polar plots are constructed in the following way. First, wind speed, wind direction, and concentration data are partitioned into wind speed/direction bins and the mean concentration calculated for each bin. Testing on a wide range of data suggests that wind direction intervals at 5–10° and 40 wind speed intervals capture sufficient detail of the concentration distribution. The wind direction data typically available are generally rounded to 10° and for typical surface measurements. Binning the data in this way is not strictly necessary but acts as an effective data reduction technique without affecting the fidelity of the plot itself [39]. The wind components, μ and υ, are calculated in Equation with as the mean hourly wind speed and θ as the mean wind direction in degrees with 90° as being from the east in Equation (1).
The calculations above provide the μ, υ, and concentration (C) surface. While it would be possible to work with this surface data directly, a better approach is to apply a model to the surface to describe the concentration as a function of the wind components μ and υ to extract real source features rather than noise. A flexible framework for fitting a surface is to use a Generalized Additive Model (GAM). GAMs are a useful modelling framework with respect to air pollution prediction because typically the relationships between variables are non-linear and variable interactions are important, both of which issues can be addressed in a GAM framework. GAMs can be expressed as shown in Equation (2):
where Ci is the i-th pollutant concentration, β0 is the overall mean of the response, sj(xij) is the smooth function of i-th value of covariate j, n is the total number of covariates, and ei is the i-th residual. Note that Ci is square root transformed as the transformation generally produces better model diagnostics, e.g., normally distributed residuals.
The model chosen for the estimate of the concentration surface is given by Equation (3). In this model, the square root-transformed concentration is a smooth function of the bivariate wind components μ and υ. Note that the smooth function used is isotropic because μ and υ are on the same scale. The isotropic smooth avoids the potential difficulty of smoothing two variables on different scales e.g., wind speed and direction, which introduces further complexities.
The time variation function produces four plots: day of the week variation, mean hour of the day variation, a combined hour of the day/day of the week plot, and a monthly plot. We mainly used a monthly plot in order to determine the annual course of concentrations of PM and its constituent elements. The plots also show the 95% confidence interval of the mean. These uncertainty limits can be helpful when trying to determine whether one candidate source is different from another. The uncertainty intervals were calculated through bootstrap re-sampling, which provides better estimates than the application of assumptions based on normality—especially when there are few data available. The function can consider one or more input variables. It should also be noted that variables other than pollutant concentrations can be considered, e.g., meteorological data. In addition, there is the option of ‘normalising’ concentrations (or other quantities). Normalising is very useful for comparing the patterns of different pollutants, which often cover very different ranges in concentration. Normalising is achieved by dividing the concentration of a pollutant by its mean value. The time variation function is probably one of the most useful functions for the analysis of air pollution [39].
pollutionRose is a variant of windRose that is useful for considering pollutant concentrations by wind direction, or more specifically the percentage time the concentration is in a particular range. This type of approach can be very informative for air pollutant species. It simply replaces the wind speed data series in the supplied data set with another variable using the argument pollutant before passing that on to windRose. It also modifies breaks to estimate a sensible set of break points for that pollutant and uses a slightly different set of default options (key to right, wedge style plot) but otherwise handles arguments just like the parent windRose function [39].
3. Results
The time series of PM10 and PM2.5 concentrations and meteorological parameters temperature, humidity, pressure, wind speed, and wind direction included 1-h averages of these variables were evaluated. The following Table 3 presents measured data in all five locations for both the heating and non-heating season.
The average concentrations of PM10 and PM2.5 indicate a deterioration during the heating season by 134% for PM10 and 174% for PM2.5 as presented in Table 3 opposite to non-heating season.
3.1. Measurements during the Non-Heating Season
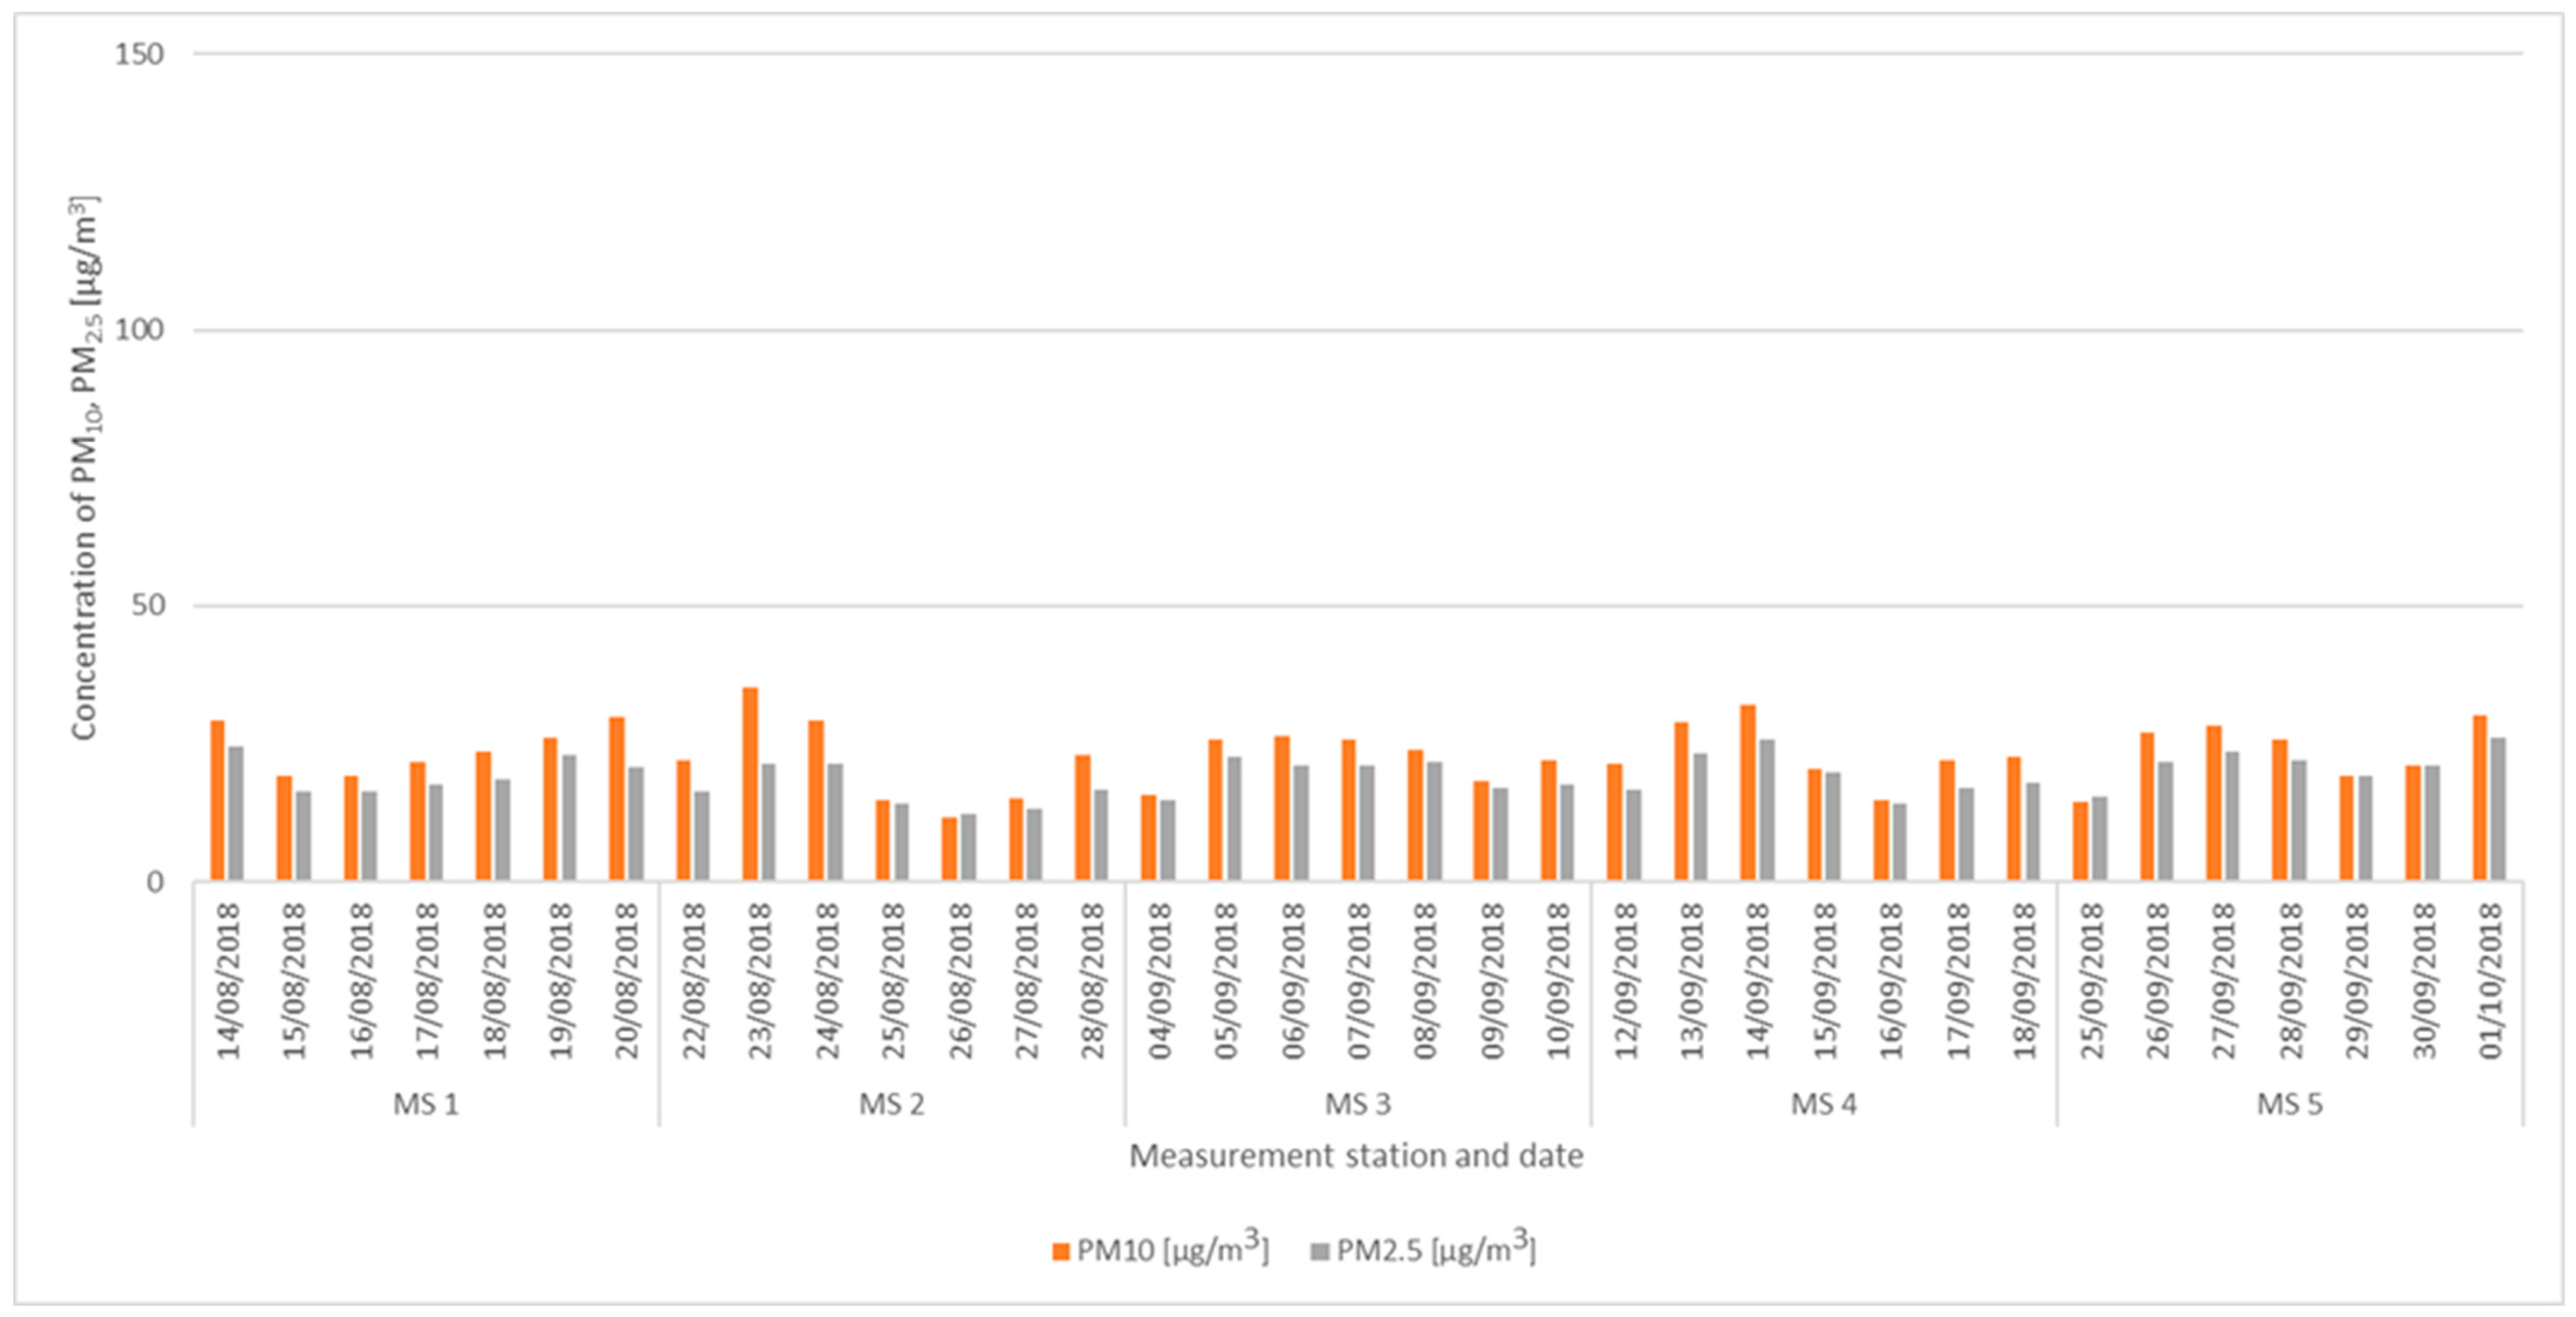
Based on 24-h averaged data, maximum concentrations of PM10 were reached at 35.11 μg/m3 for MS2 on 23/08/2018 and for PM2.5 a level of 26.2 μg/m3 on MS5 on 01/10/2018. This can be seen in Figure 3 and Table 3. In terms of the total average for 2018, the most loaded measuring station with PM10 was MS1 at a value of 24.11 μg/m3, and MS5 for PM2.5 at a value of 21.29 μg/m3 (Table 3). Figure 3 depicts daily averages of PM and Figure 4 meteorological data.
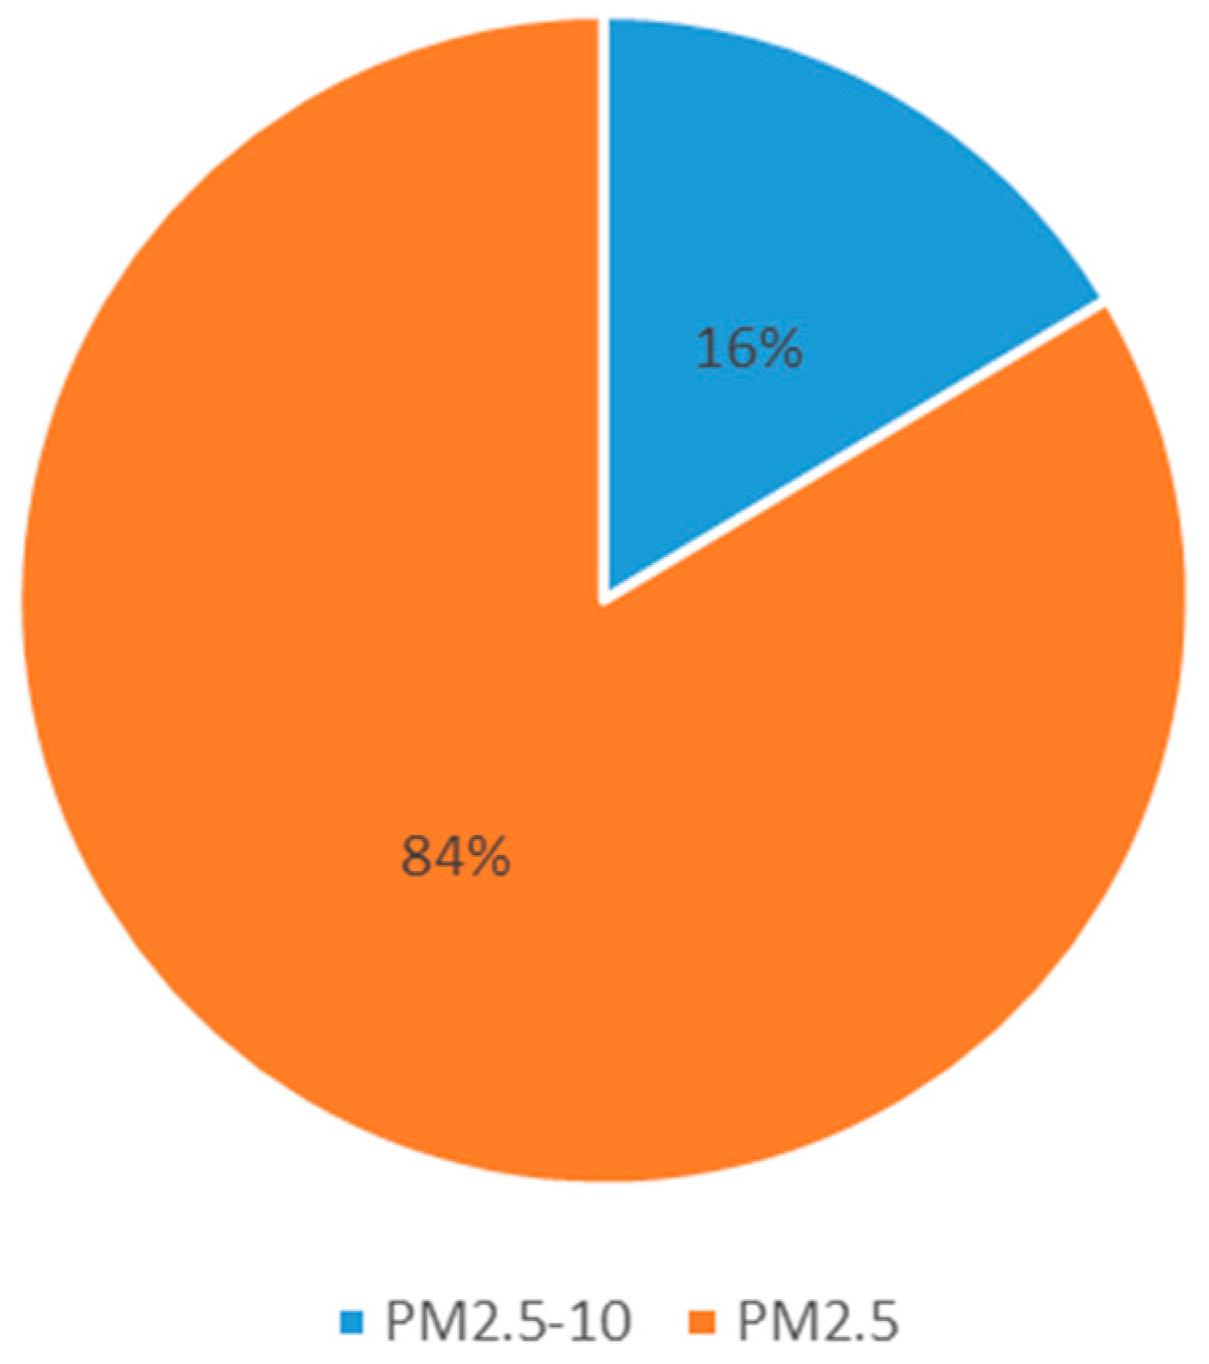
The basic measured fractions of PM10 and PM2.5 allow for the division of the total measured fraction of PM10 into the so-called coarse fraction of PM2.5–10 and the fine fraction of PM2.5. The distribution of particulate matter is very useful from the point of view of evaluating particulate concentrations, while the coarse fraction of PM2.5–10 and the fine fraction of PM2.5 have their potential sources, which are predetermined by their basic physical property—the size of the particulate matter. In general, PM2.5–10 can come mainly from the resuspension of road dust, from agricultural activities, industrial production, etc. PM2.5 can include sources such as local heating fuel combustion, transport fuel combustion, and the abrasion of car parts with high-temperature processes.
During the non-heating season in 2018 (in summer) when atmospheric dispersion conditions were generally more favourable, air temperatures were higher and there was no such significant source of particulate matter as local heating, the coarse PM2.5–10 fraction was more abundant in the total PM10 fraction. The representation of the coarse fraction of PM2.5–10 of the heating season in the village of Sučany was on average 16% in the total PM10 fraction for the whole measurement and all measuring stations. The fine fraction of PM2.5 accounted for 84% of the total PM10 fraction (Figure 5).
The thoracic fraction of road dust (PM10) was first measured in Portugal in both the exterior and interior of car parks. The particulate pollution (DL10) measurements were 18.5 ± 9.8 mg/m2 for outdoor parking and 1.8–23.7 mg/m2 for covered car parking, corresponding to emission factors of 476 and 75–589 mg of vehicle−1 km−1 respectively. Organic gaseous compounds accounted for a total of 9–30% of PM10 concentrations for indoor parking areas. The total mass fraction of oxide particles was 27.1% (outdoor parking) and 23.6–34.3% (indoor parking) [8].
3.2. Measurements during the Heating Season
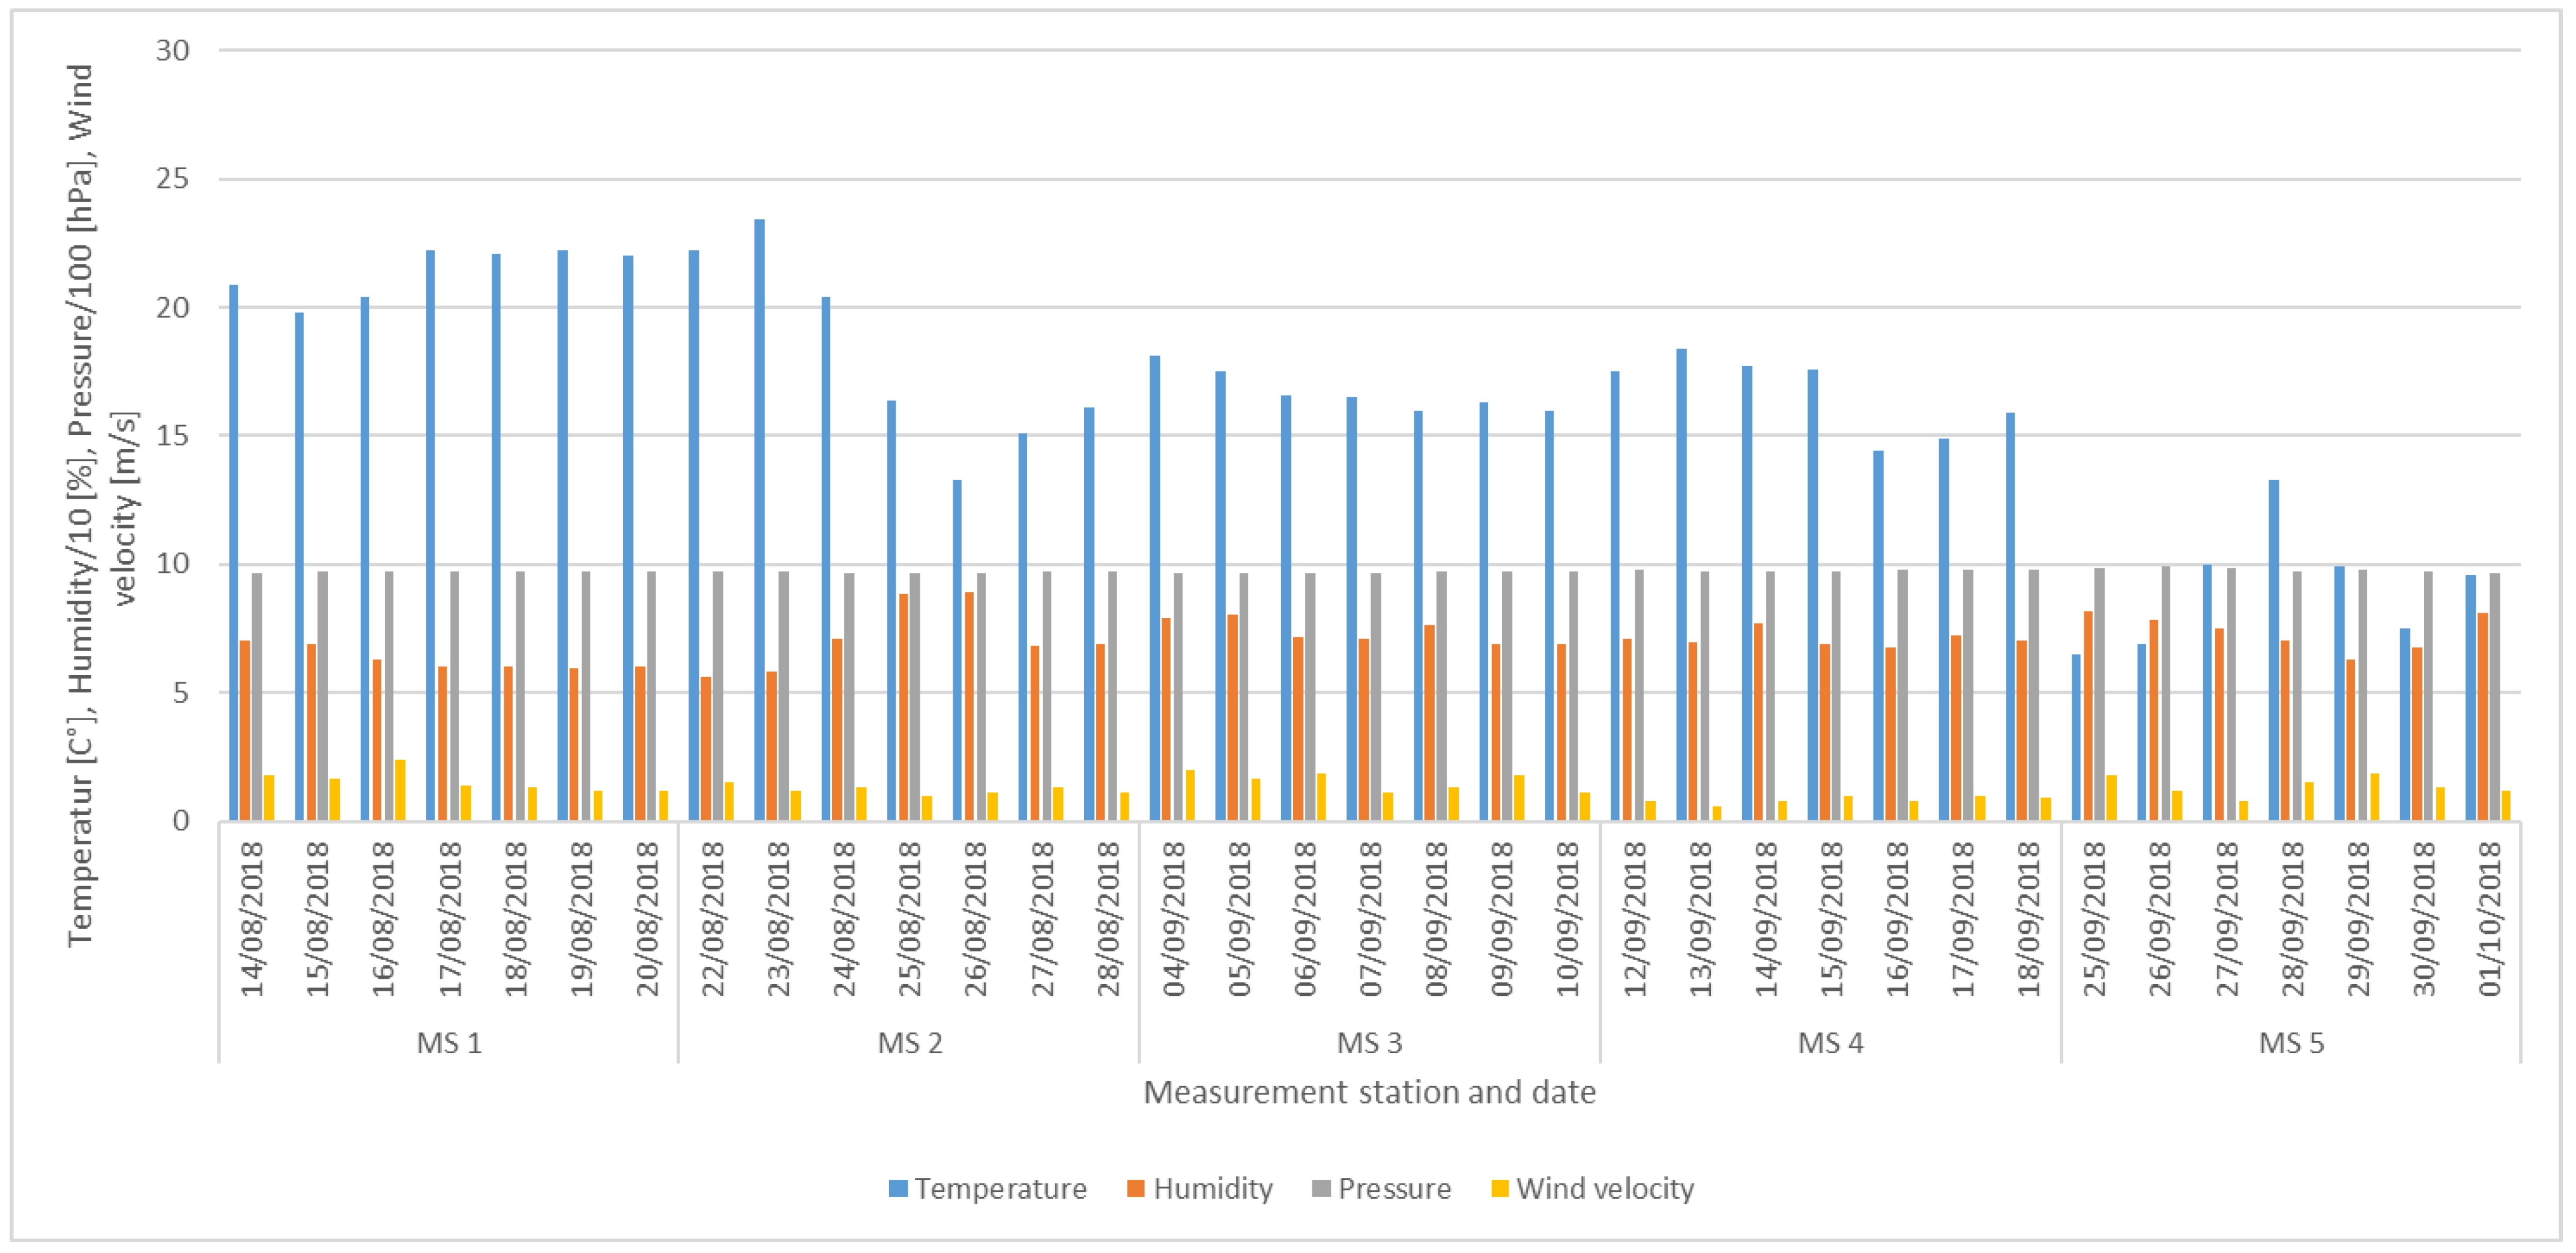
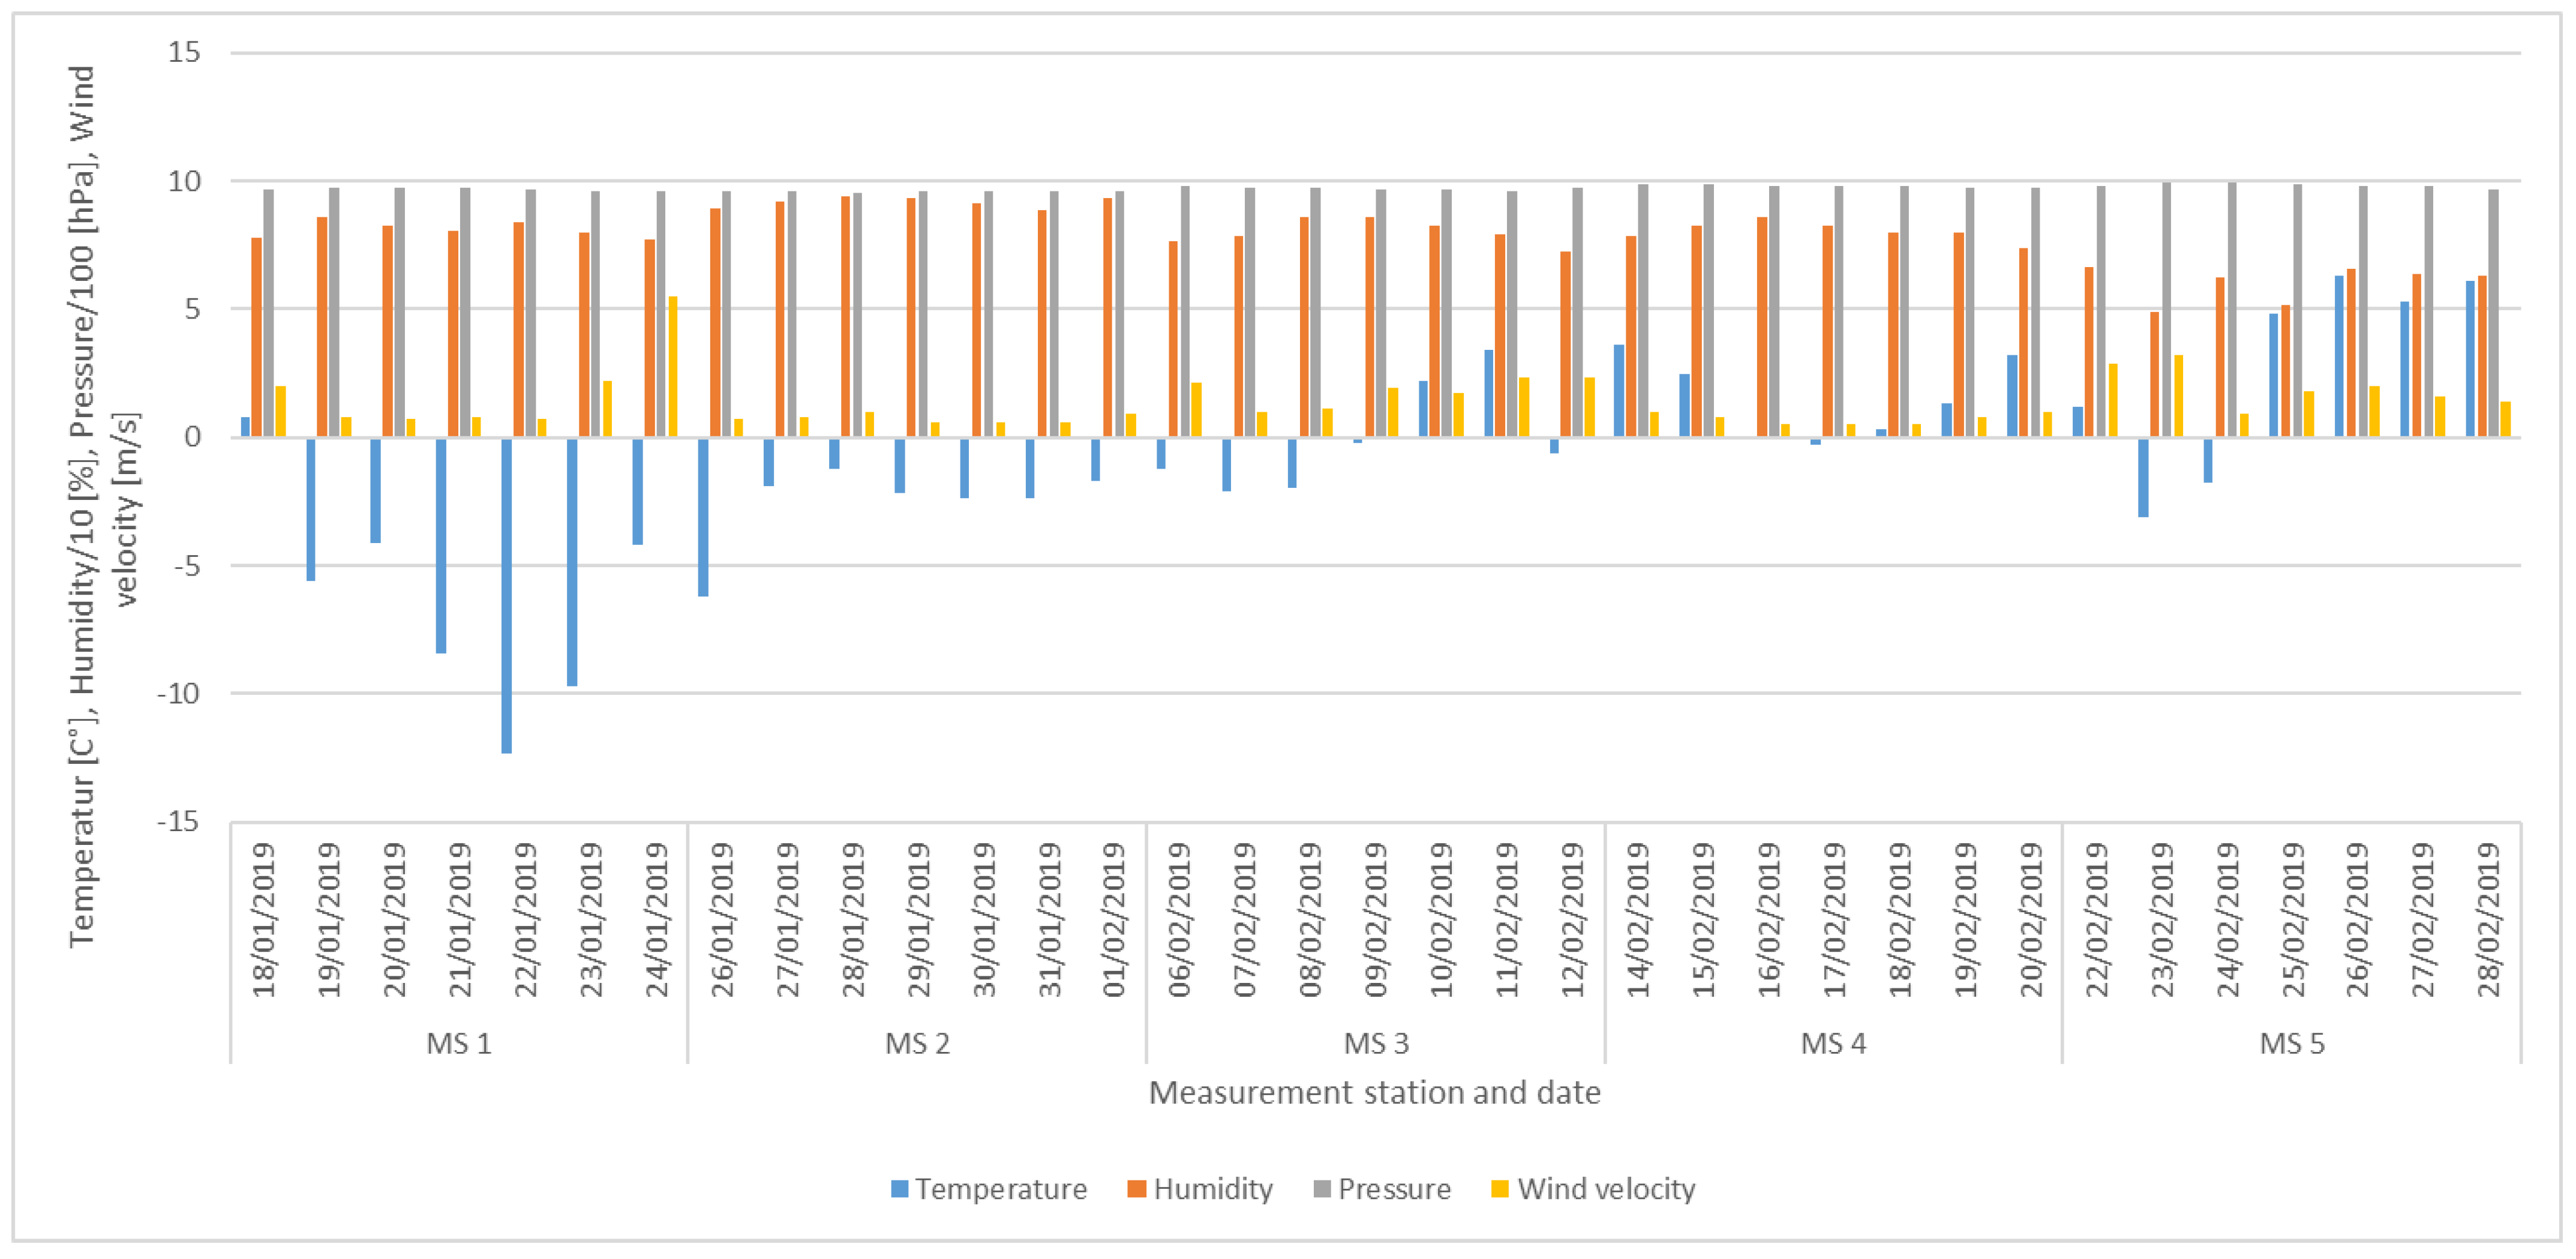
During the heating season of 2019, maximum levels of PM10 were recorded at 146.45 μg/m3 for MS1 on 22/01/2019 and for PM2.5 141.1 μg/m3 also for MS1 on 22/01/2019 (24-h averages). The average data for the entire measuring period leads to a maximum of PM10 at 88.08 μg/m3 and PM2.5 at 86.37 μg/m3, both occurring at MS1 (Figure 6). Figure 7 showes 24-h averages of meteofological data where we can see low teperatures at MS1 (below −10 °C).
Distribution of PM in the winter season during the heating season is presented in Figure 8. The representation of the coarse fraction of PM2.5–10 during the heating season was on average 2% in the total PM10 fraction for all data. The fine fraction PM2.5 accounted for 98%.
During the heating season, a seasonal source of air pollution—local heating—is added to the year-round sources of air pollution (transport, industry). The combination of pollution sources and atmospheric conditions often results in a high concentration of PM2.5 in the winter period, when they can reach a high proportion of PM10. The secondary formation of PM from gaseous pollutants under suitable conditions also contributes to this [40]. In the given case, the measurements were carried out in the immediate vicinity of family houses, where local heating significantly affected PM2.5 concentrations. Similar results regarding higher concentrations during the heating season have been obtained in various studies [6,10,41,42,43,44,45].
Burning coal in households releases fine particulate matter (PM2.5), which significantly affects the atmosphere. The study [46] compared three types of coal; crude bituminous coal (RBC), crude anthracite coal (RAC), and honeycomb briquettes were burned. The share of total carbon components in PM2.5 emitted from combustion was highest for RBC (57.0–65.2%), followed by comb briquettes HB (9.6–22.2%) and crude anthracite coal (11.0–17.6%). The mass concentration of PM2.5 from crude coal combustion exceeded that of comb briquettes, and the chemical composition of PM2.5 varied depending on the type of coal used. The mass concentration of PM2.5 particles resulting from crude coal combustion was higher than that of honeycomb briquettes.
Air quality that exceeded recommended limits was recorded mainly during the 2019 heating season. Out of a total of 35 measuring days (24-h concentrations), the limit value of 50 μg/m3 for PM10 was exceeded 13 times and the limit value of 25 μg/m3 for PM2.5 30 times (Figure 6). Compared to other countries [10] from the year 2000, the values are significantly lower. Specifically, the PM2.5 during the heating season was measured at 0.798 of PM10 emissions, in comparison with values ranging from 0.625 (Slovak Republic) to 0.667 (Poland). The comparison between all countries in the study is presented in Figure 9. One potential reason is the overall decrease of emission production over the course of two decades.
3.3. Correlation of PM Measurements with Ambient Temperature
Observing the local heating factors, it can be concluded that during the heating season in 2019, the air quality was worse than during the non-heating season in 2018. Very low air temperatures were recorded, which significantly affected the current state of air pollution (secondary formation of particulate matter, the presence of more sources of air pollution). The most significant deterioration in air quality was manifested at monitoring stations MS1 and MS2 during the heating season, when the lowest air temperatures were also recorded (Figure 10 and Figure 11).
A significant dependence of PM10 concentrations on air temperature can also be observed (Figure 10 and Figure 11). The relatively high dependence is due to the high proportion of the fine fraction of PM2.5 in the PM10 fraction due to the presence of low temperatures during the measurement period. The fine fraction of PM2.5 accounted for 98% of the total PM10 fraction.
At very low temperatures, concentrations of the fine PM2.5 fraction were high. The formation of fine particles is not only related to primary sources; secondary formation of fine particles is related to two modes (areas) of aerosol distribution. These are the areas of transition nuclei and nanoparticle aggregation. It is at low temperatures that various chemical substances (nitrates, sulfates, or ammonium salts) can condense into a fine aerosol <0.1 μm. Particles <1 μm can also be formed by coagulation of smaller parts. Moreover, at very low temperatures, dispersion conditions are worse, restricting circulation. This fact also affects PM concentrations.
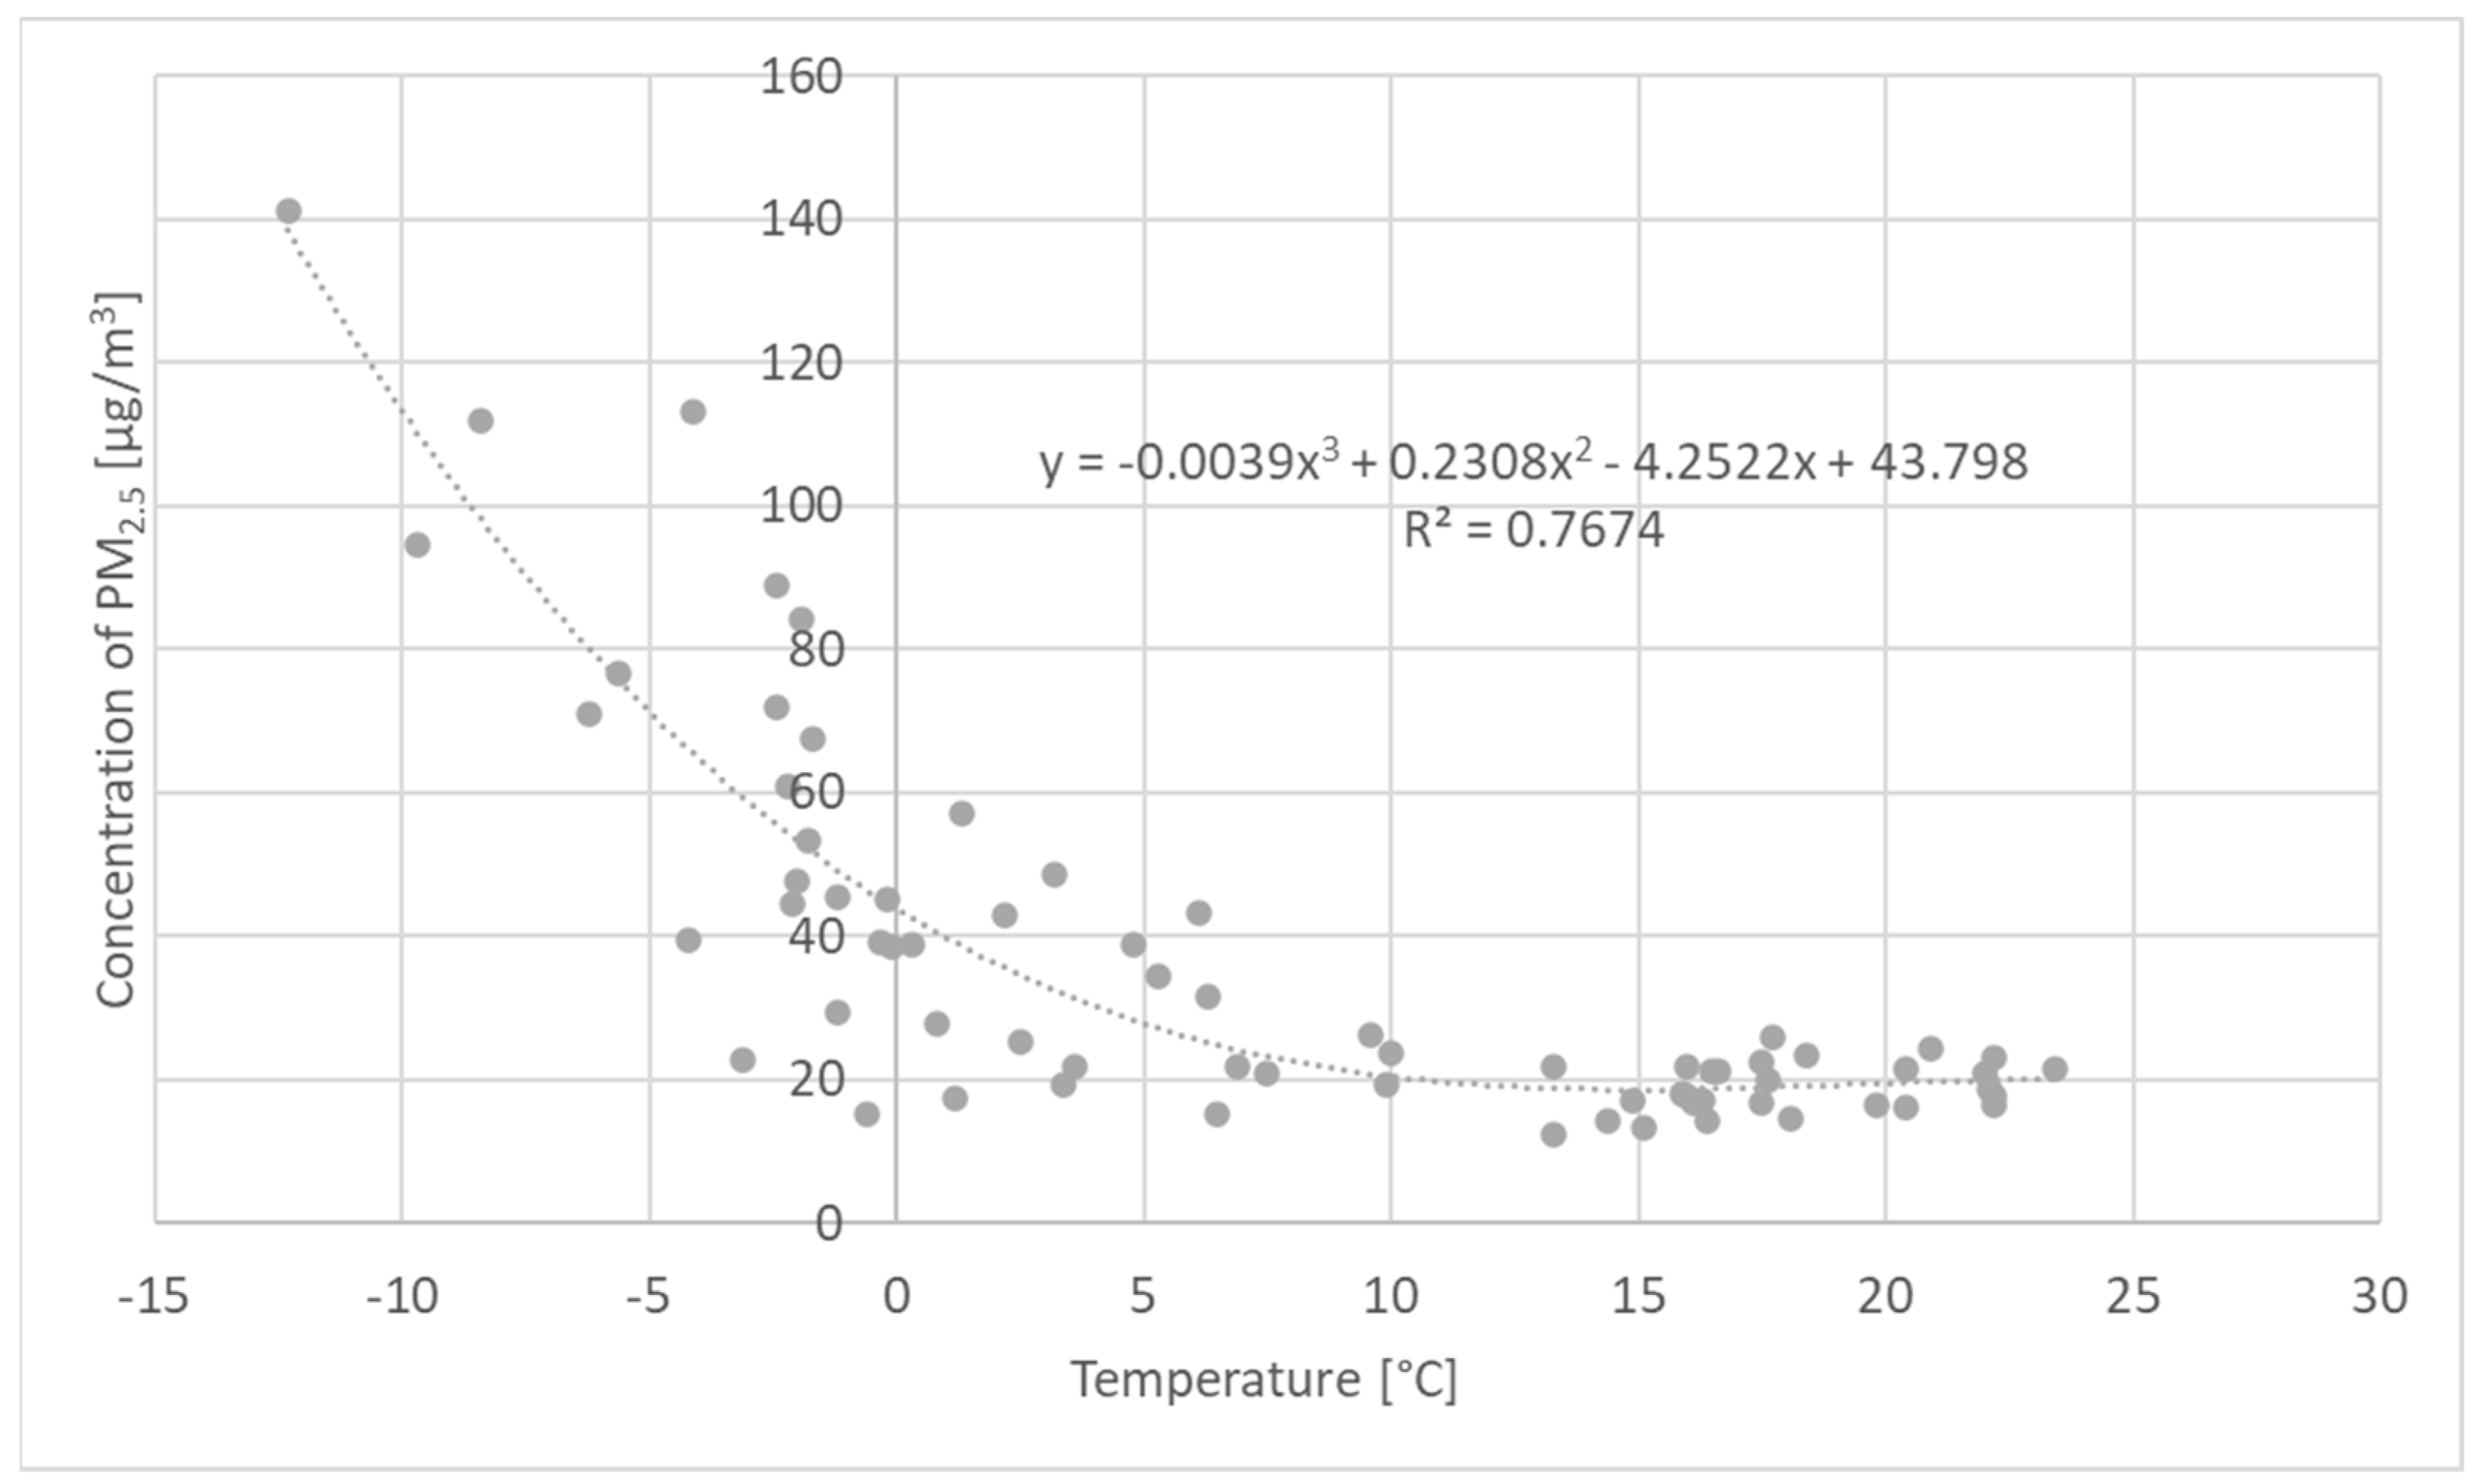
The dependence of PM10 and PM2.5 concentrations on temperature was determined as a third-degree polynomial (Figure 10 and Figure 11). The polynomial function characterises 73.6% of the original data scattering at PM10 (Figure 10) and at PM2.5 76.7% of the original data scattering (Figure 11). This may be considered as statistically significant.
3.4. Pollution Rose of PM Concentrations
Various sources of air pollution contribute to the formation of pollutants present in ambient air. These sources produce pollutants and these subsequently undergo various processes in the atmosphere (transport, transformation, deposition) related to meteorological parameters (temperature, wind speed, pressure, humidity, precipitation), which can greatly influence their state, i.e., their concentrations. Wind speed, as a significant factor influencing in particular the transport and dispersion of pollutants, together with a defined direction, can contribute to the understanding of the behaviour and origin of pollutants.
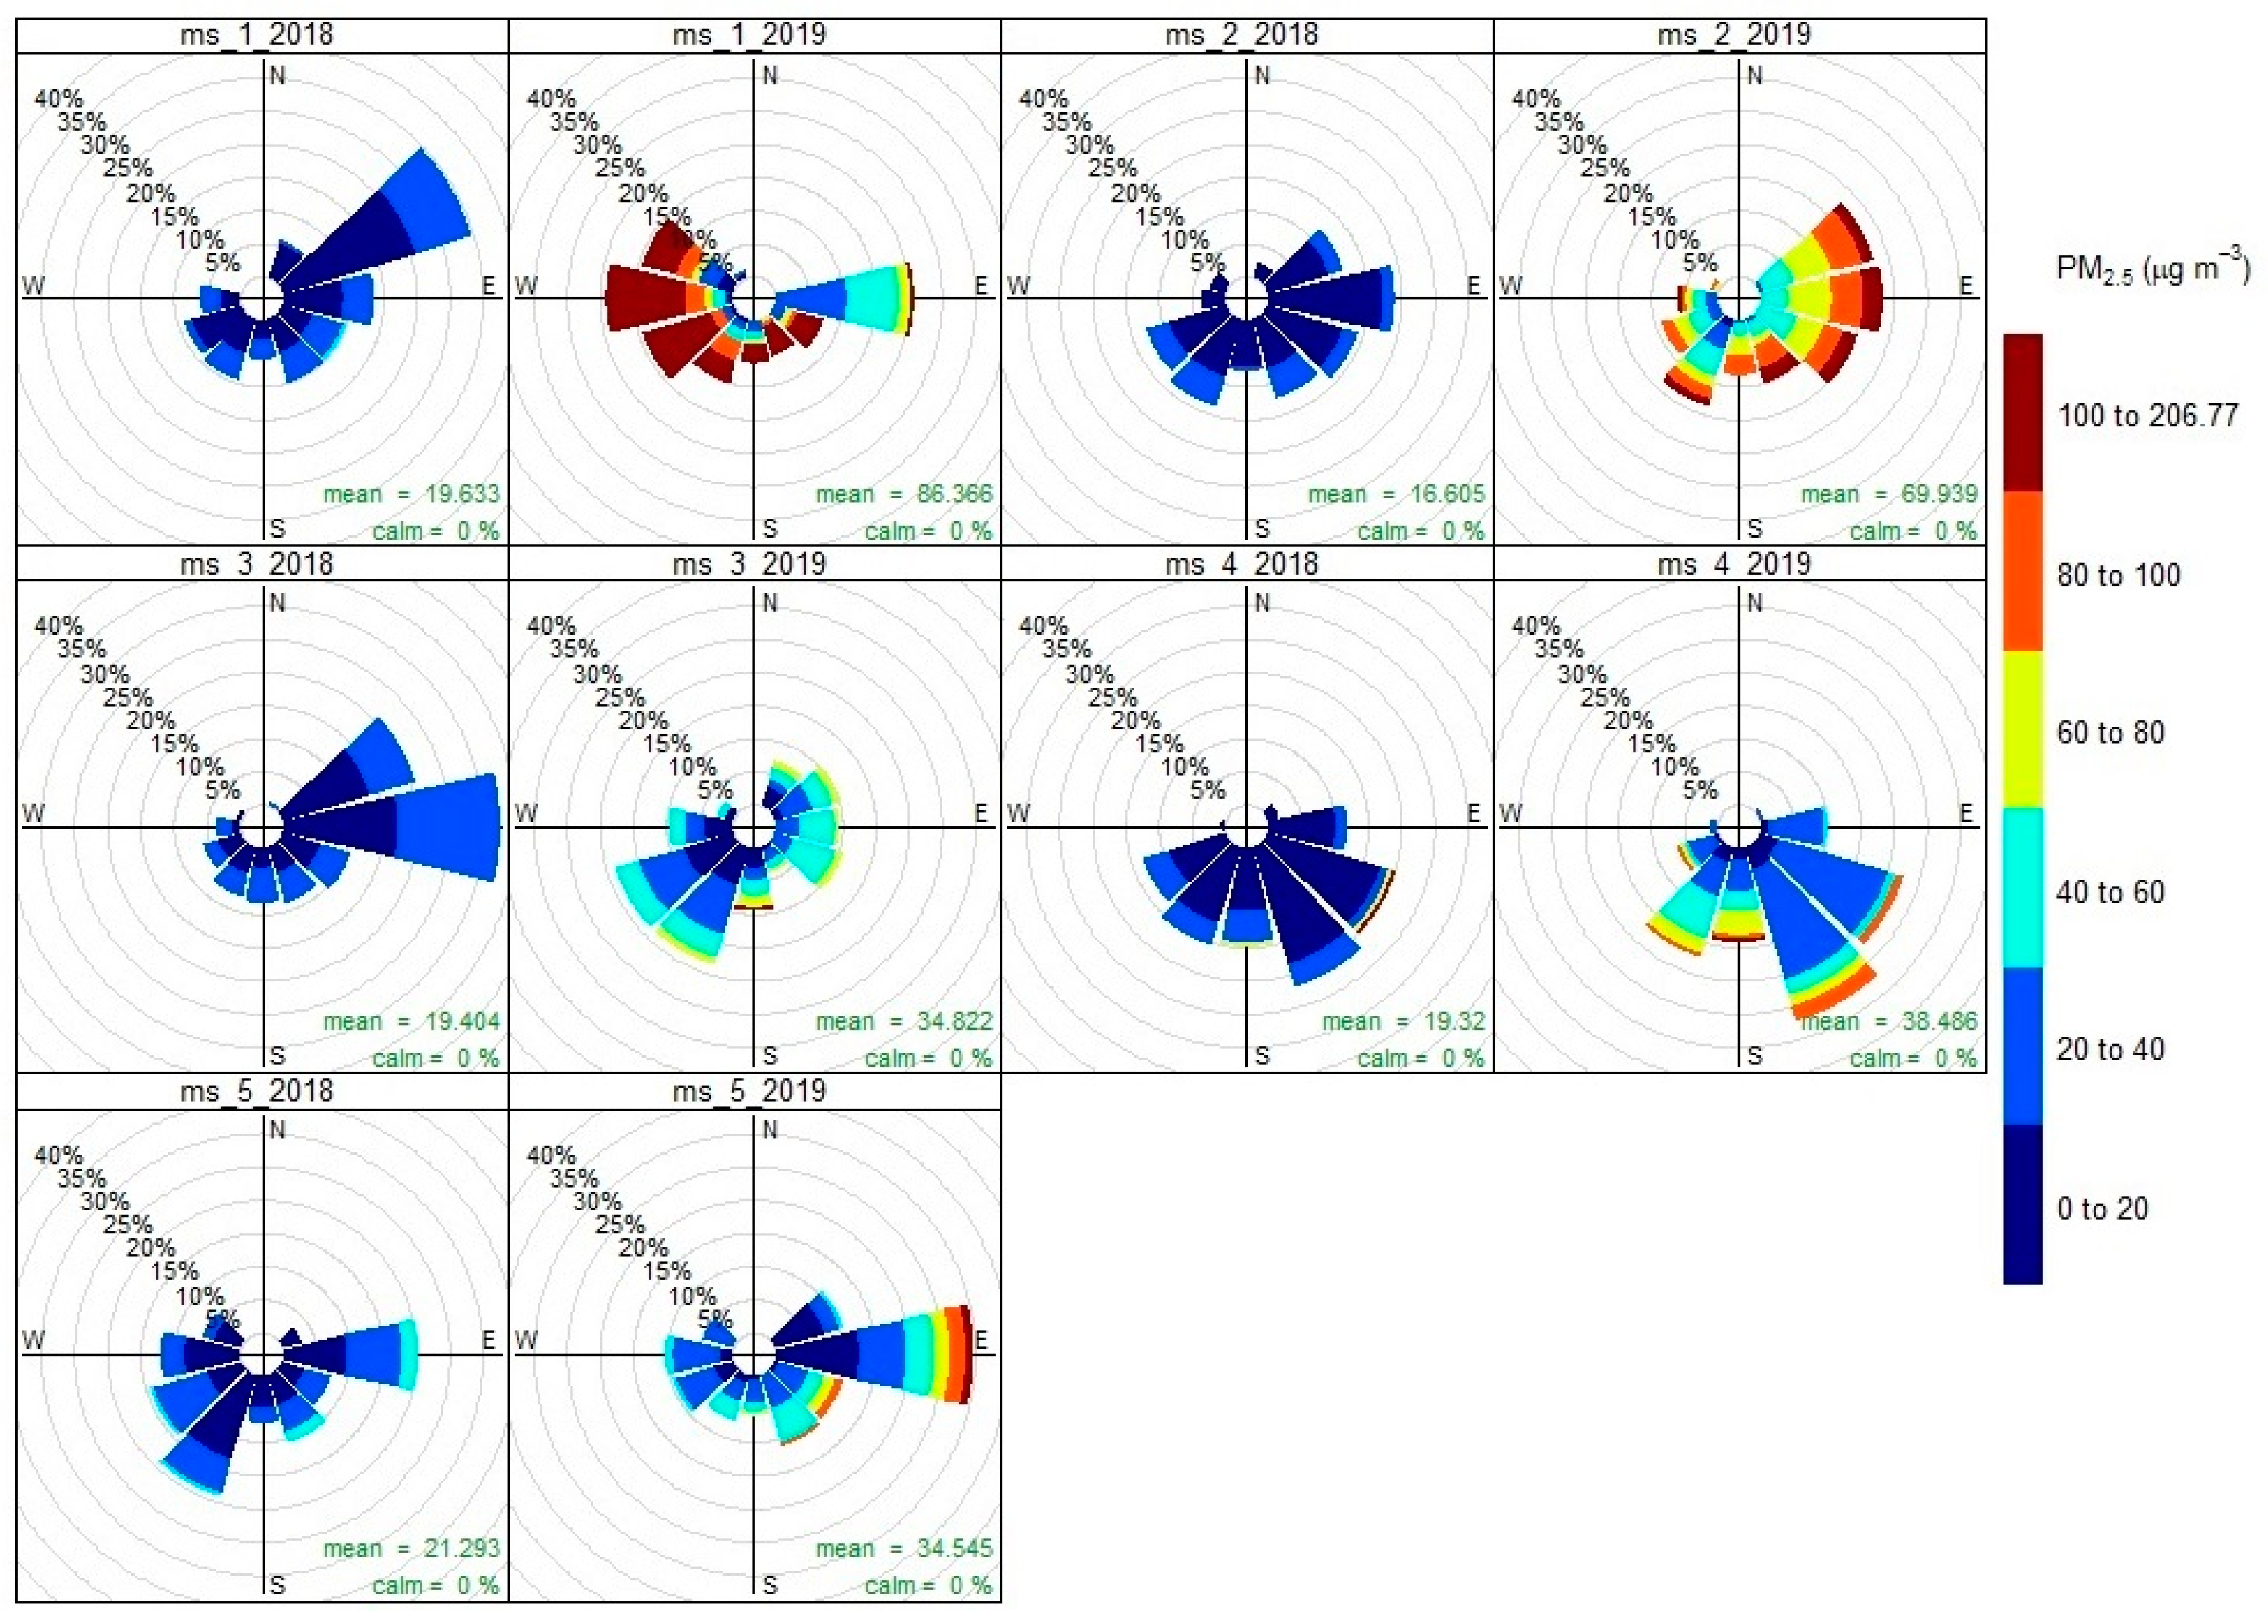
WindRose is a kind of polar chart that is useful for considering pollutant concentrations by wind direction, or more specifically the percentage of time in a particular range. The openairmaps package has been used to modified and used to create interactive HTML air quality maps. These are useful to understand the geospatial context of openair-type analysis. Figure 12 and Figure 13 depict the pollution roses of the PM10 and PM2.5 pollutants. Higher concentrations were recorded during the 2019 heating season at MS1 from the west, southwest and MS2 from the east, northeast. A significant difference in the colour scale can be observed in the off-season and during the heating season. It can be assumed that other sources of particulate matter pollution (local heating) have been added to the year-round source of pollution (road transport, light industry) during the winter period.
The non-heating season is characterised by concentrations of PM10 < 50 μg/m3—98.5% and PM2.5 < 25 μg/m3—88.0% (determined from hourly PM concentrations). PM10 concentrations > 35 μg/m3 are more prevalent during the working week, mainly from a south-westerly direction. PM10 concentrations are lower over the weekend at 19.5 μg/m3 on average (PM10 concentrations > 20 μg/m3—40.4%) versus a working week of 24.5 μg/m3 on average (PM10 concentrations > 20 μg/m3, PM10 60.8%) (http://rpubs.com/Dusan2024/1139468). PM2.5 concentrations are also lower over the weekend at 18.2 μg/m3 on average (PM2.5 concentrations > 20 μg/m3—28.8%) versus a working week of 19.7 μg/m3 on average (PM2.5 concentrations > 20 μg/m3—35.2%) (http://rpubs.com/Dusan2024/1139471). In the case of measuring station MS4, the prevailing wind direction is from the south, southeast, where local light industry is located. From this direction, it is also possible to observe higher concentrations of particulate matter in the period outside and during the heating season in 2018 and 2019.
The period during the heating season shows significantly higher concentrations of PM10 > 50 μg/m3—42.0% and PM2.5 > 25 μg/m3—79.2% (determined from hourly PM concentrations). PM10 concentrations are higher over the weekend at 58.67 μg/m3 on average (PM10 concentrations > 20 μg/m3—93.7%) versus a working week of 52.0 μg/m3 on average (PM10 concentrations > 20 μg/m3—80.5%) (http://rpubs.com/Dusan2024/1139470). PM2.5 concentrations are also higher over the weekend at 58.2 μg/m3 on average (PM2.5 concentrations > 20 μg/m3—92.9%) versus a working week of 50.7 μg/m3 on average (PM2.5 concentrations > 20 μg/m3—82.5%) (http://rpubs.com/Dusan2024/1139472).
It is imperative that local policymakers are able to monitor reliable data of air quality in real time and issue or push realistic standards and regulations that will protect both the citizens’ health and the prosperity of the modern heating industry. Significant differences in heating vs. non-heating seasons show that it is important to drive new technology forward via financial incentives, European funding, and support that local city management may positively exploit. To summarise, below are a few actionable steps that are possible to take:
- Promote Clean Heating: Incentivise adoption of electric heating, heat pumps, and biomass boilers to replace fossil fuel systems, reducing particulate matter emissions.
- Enforce Air Quality Regulations: Impose strict regulations on industrial emissions, requiring pollution controls and adherence to emission limits to reduce PM pollution.
- Raise Public Awareness: Educate residents and students on health impacts of PM pollution and promote actions like using clean heating fuels and reducing unnecessary heating during heating season.
3.5. Time Visualisation of PM Concentrations between Work Days and Weekends
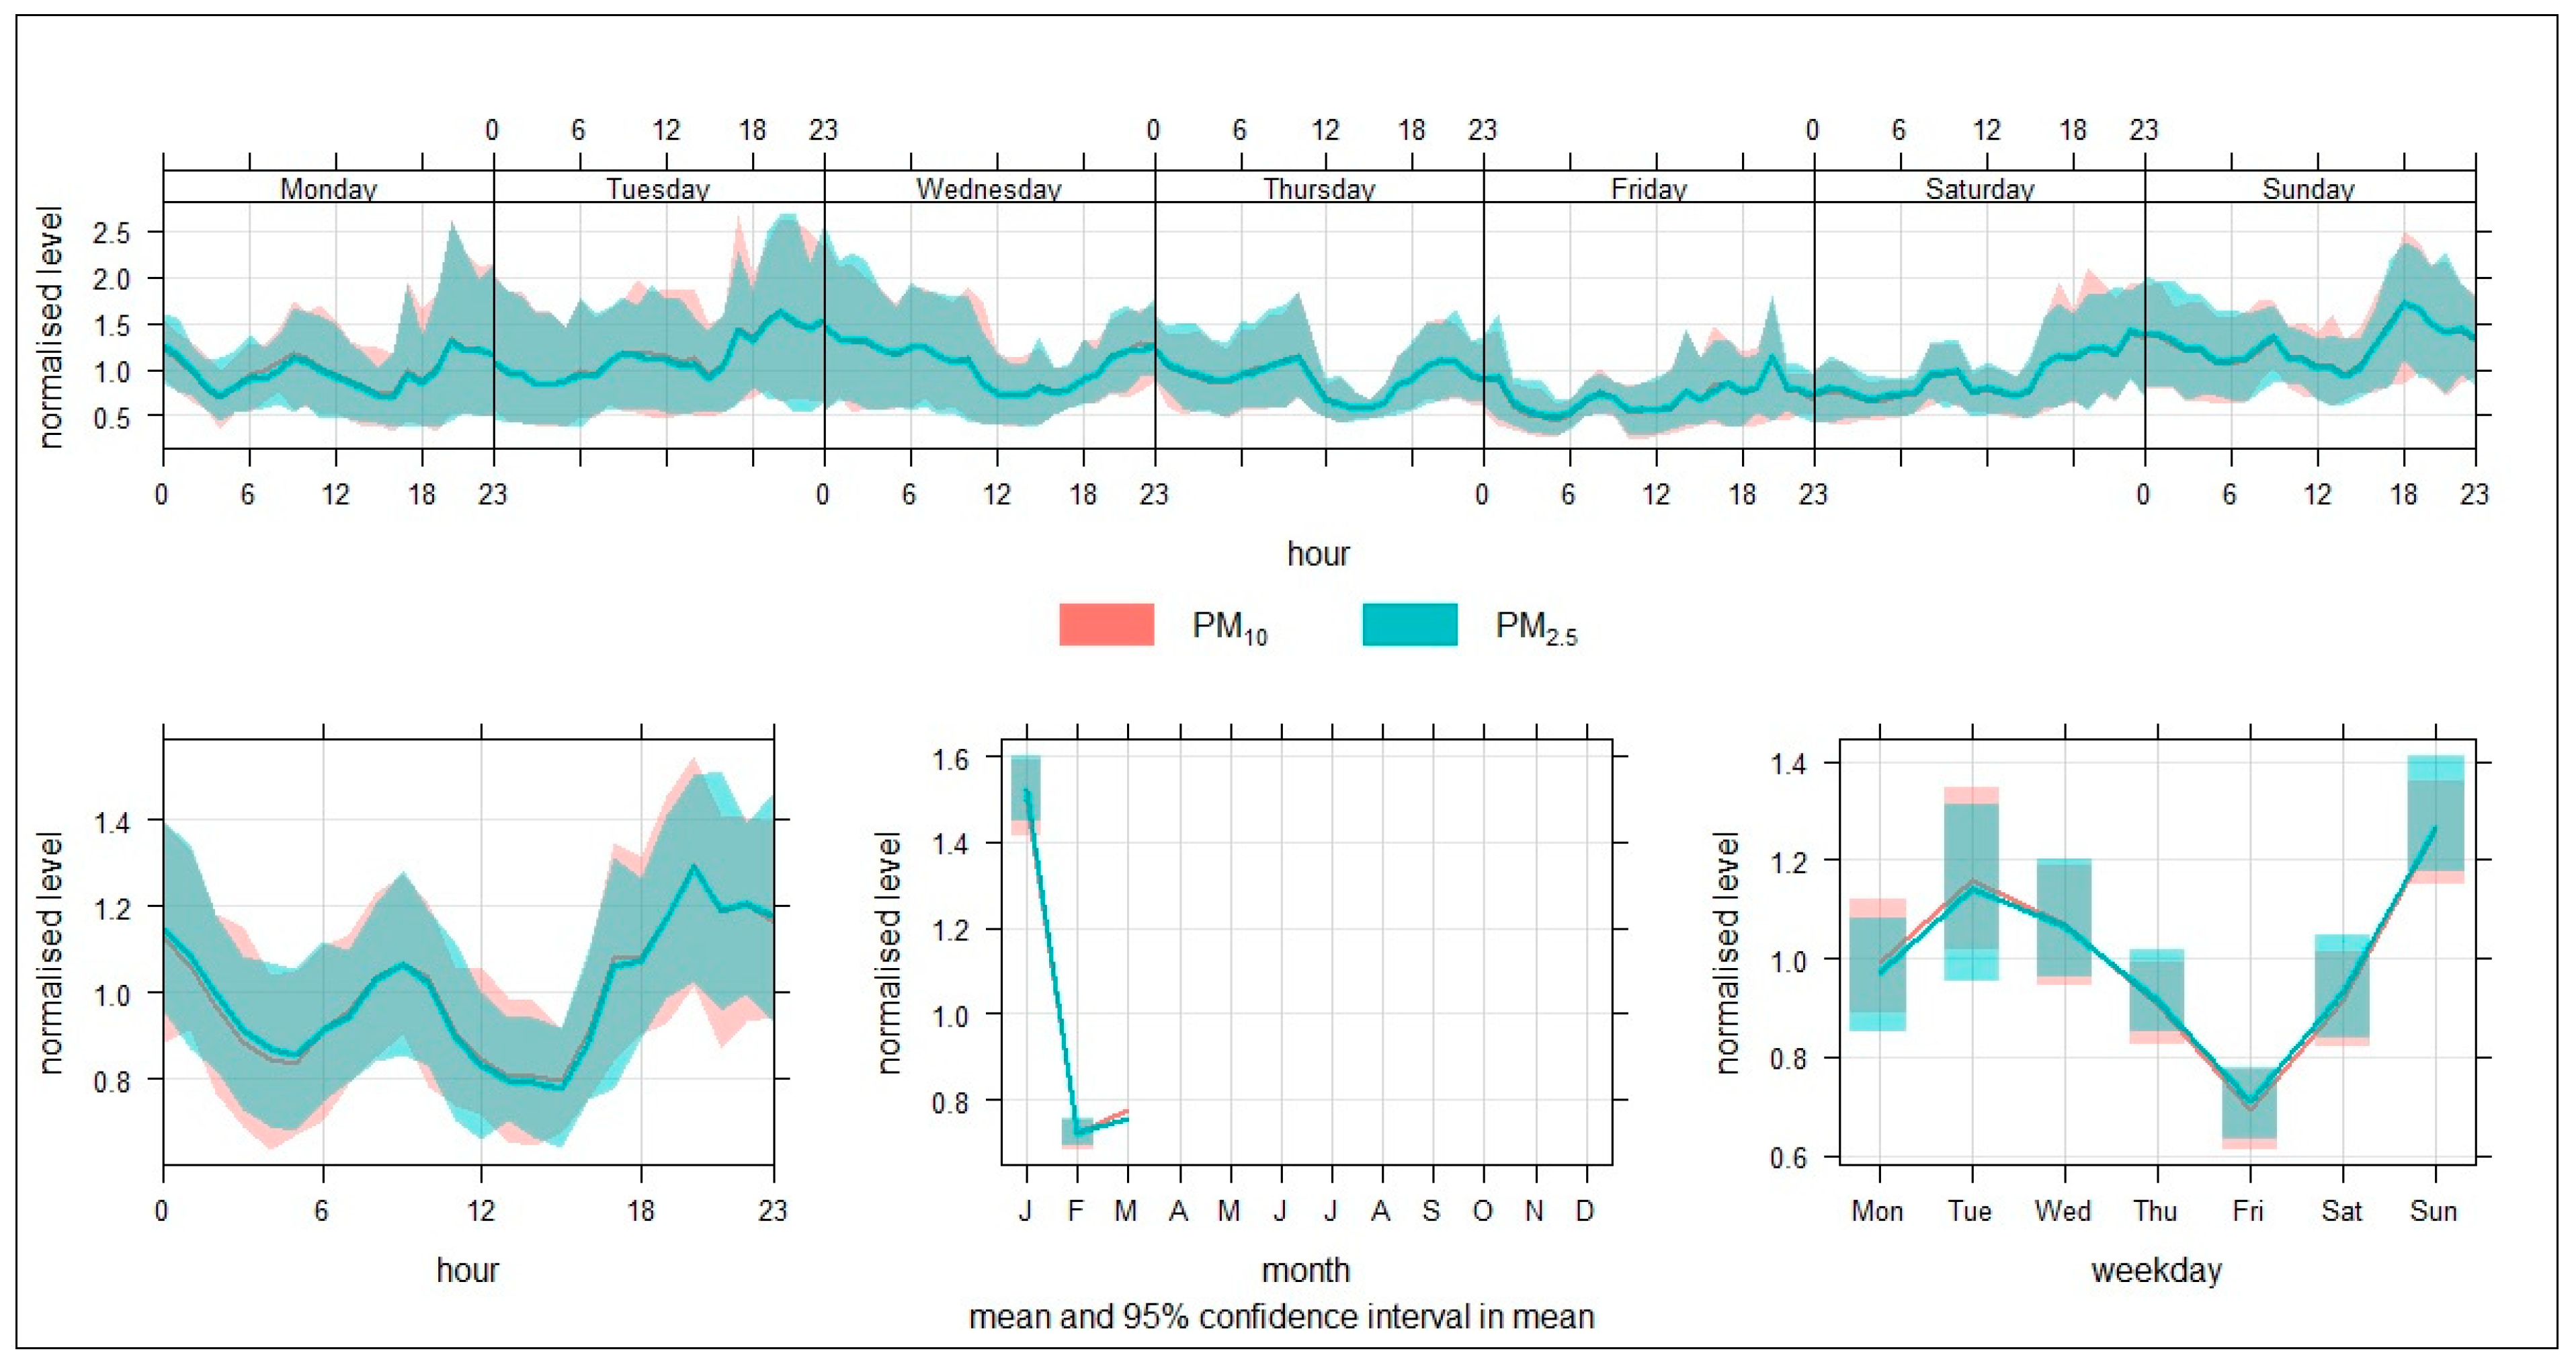
In order to understand how residential activity influences PM concentrations, a time visualisation was made of both parameters. Both periods are associated with particular activities, such as work around the house, construction activities, more intensive local heating. PM10 and PM2.5 concentrations were evaluated as 1-h data and a working week and one day concentration progression was generated (data are normalised). The days with the highest concentrations of particulate matter were during non-heating season (2018) on Thursday and Friday. In terms of the daytime course of particulate matter concentrations, PM10 and PM2.5 concentrations were higher in the morning (6:00–8:00) and then in the evening (15:00–18:00). Figure 14 and Figure 15 depict the time variation of normalised PM10 and PM2.5 concentration values outside the heating season in 2018 and 2019 in the village of Sučany.
On the other hand, the day with the highest concentrations of PM10 and PM2.5 during the 2019 heating season was Sunday, a weekend day. In terms of the daytime course of particulate concentrations, concentrations of PM10 and PM2.5 were higher in the evening (20:00). From this course, it can be assumed that particulate matter originates from activities that take place more intensively on weekends than on weekdays, i.e., local heating. The dispersion of particulate concentrations during the 2019 heating season during the week is greater than in the off-season—so the presence of a source of pollution whose emissions enter the atmosphere at weekends or in the evening is likely (Figure 15).
3.6. Impact of Traffic Volume
Traffic volume was also measured in the vicinity of measuring sites. The data are presented in Figure 16 on the first-class road I/18 passing directly through the municipality. In this figure, the maximum traffic volume is during the working week in the morning during 8:00 and in the afternoon during 15:00. From this, it can be assumed that particulate matter originated from road transport and partly from industrial plants. The dispersion of particulate concentrations during the week during the non-heating season is not very significant (Figure 14), i.e., potential particulate matter sources contribute equally to particulate air pollution and there are no significant jumps in particulate concentrations.
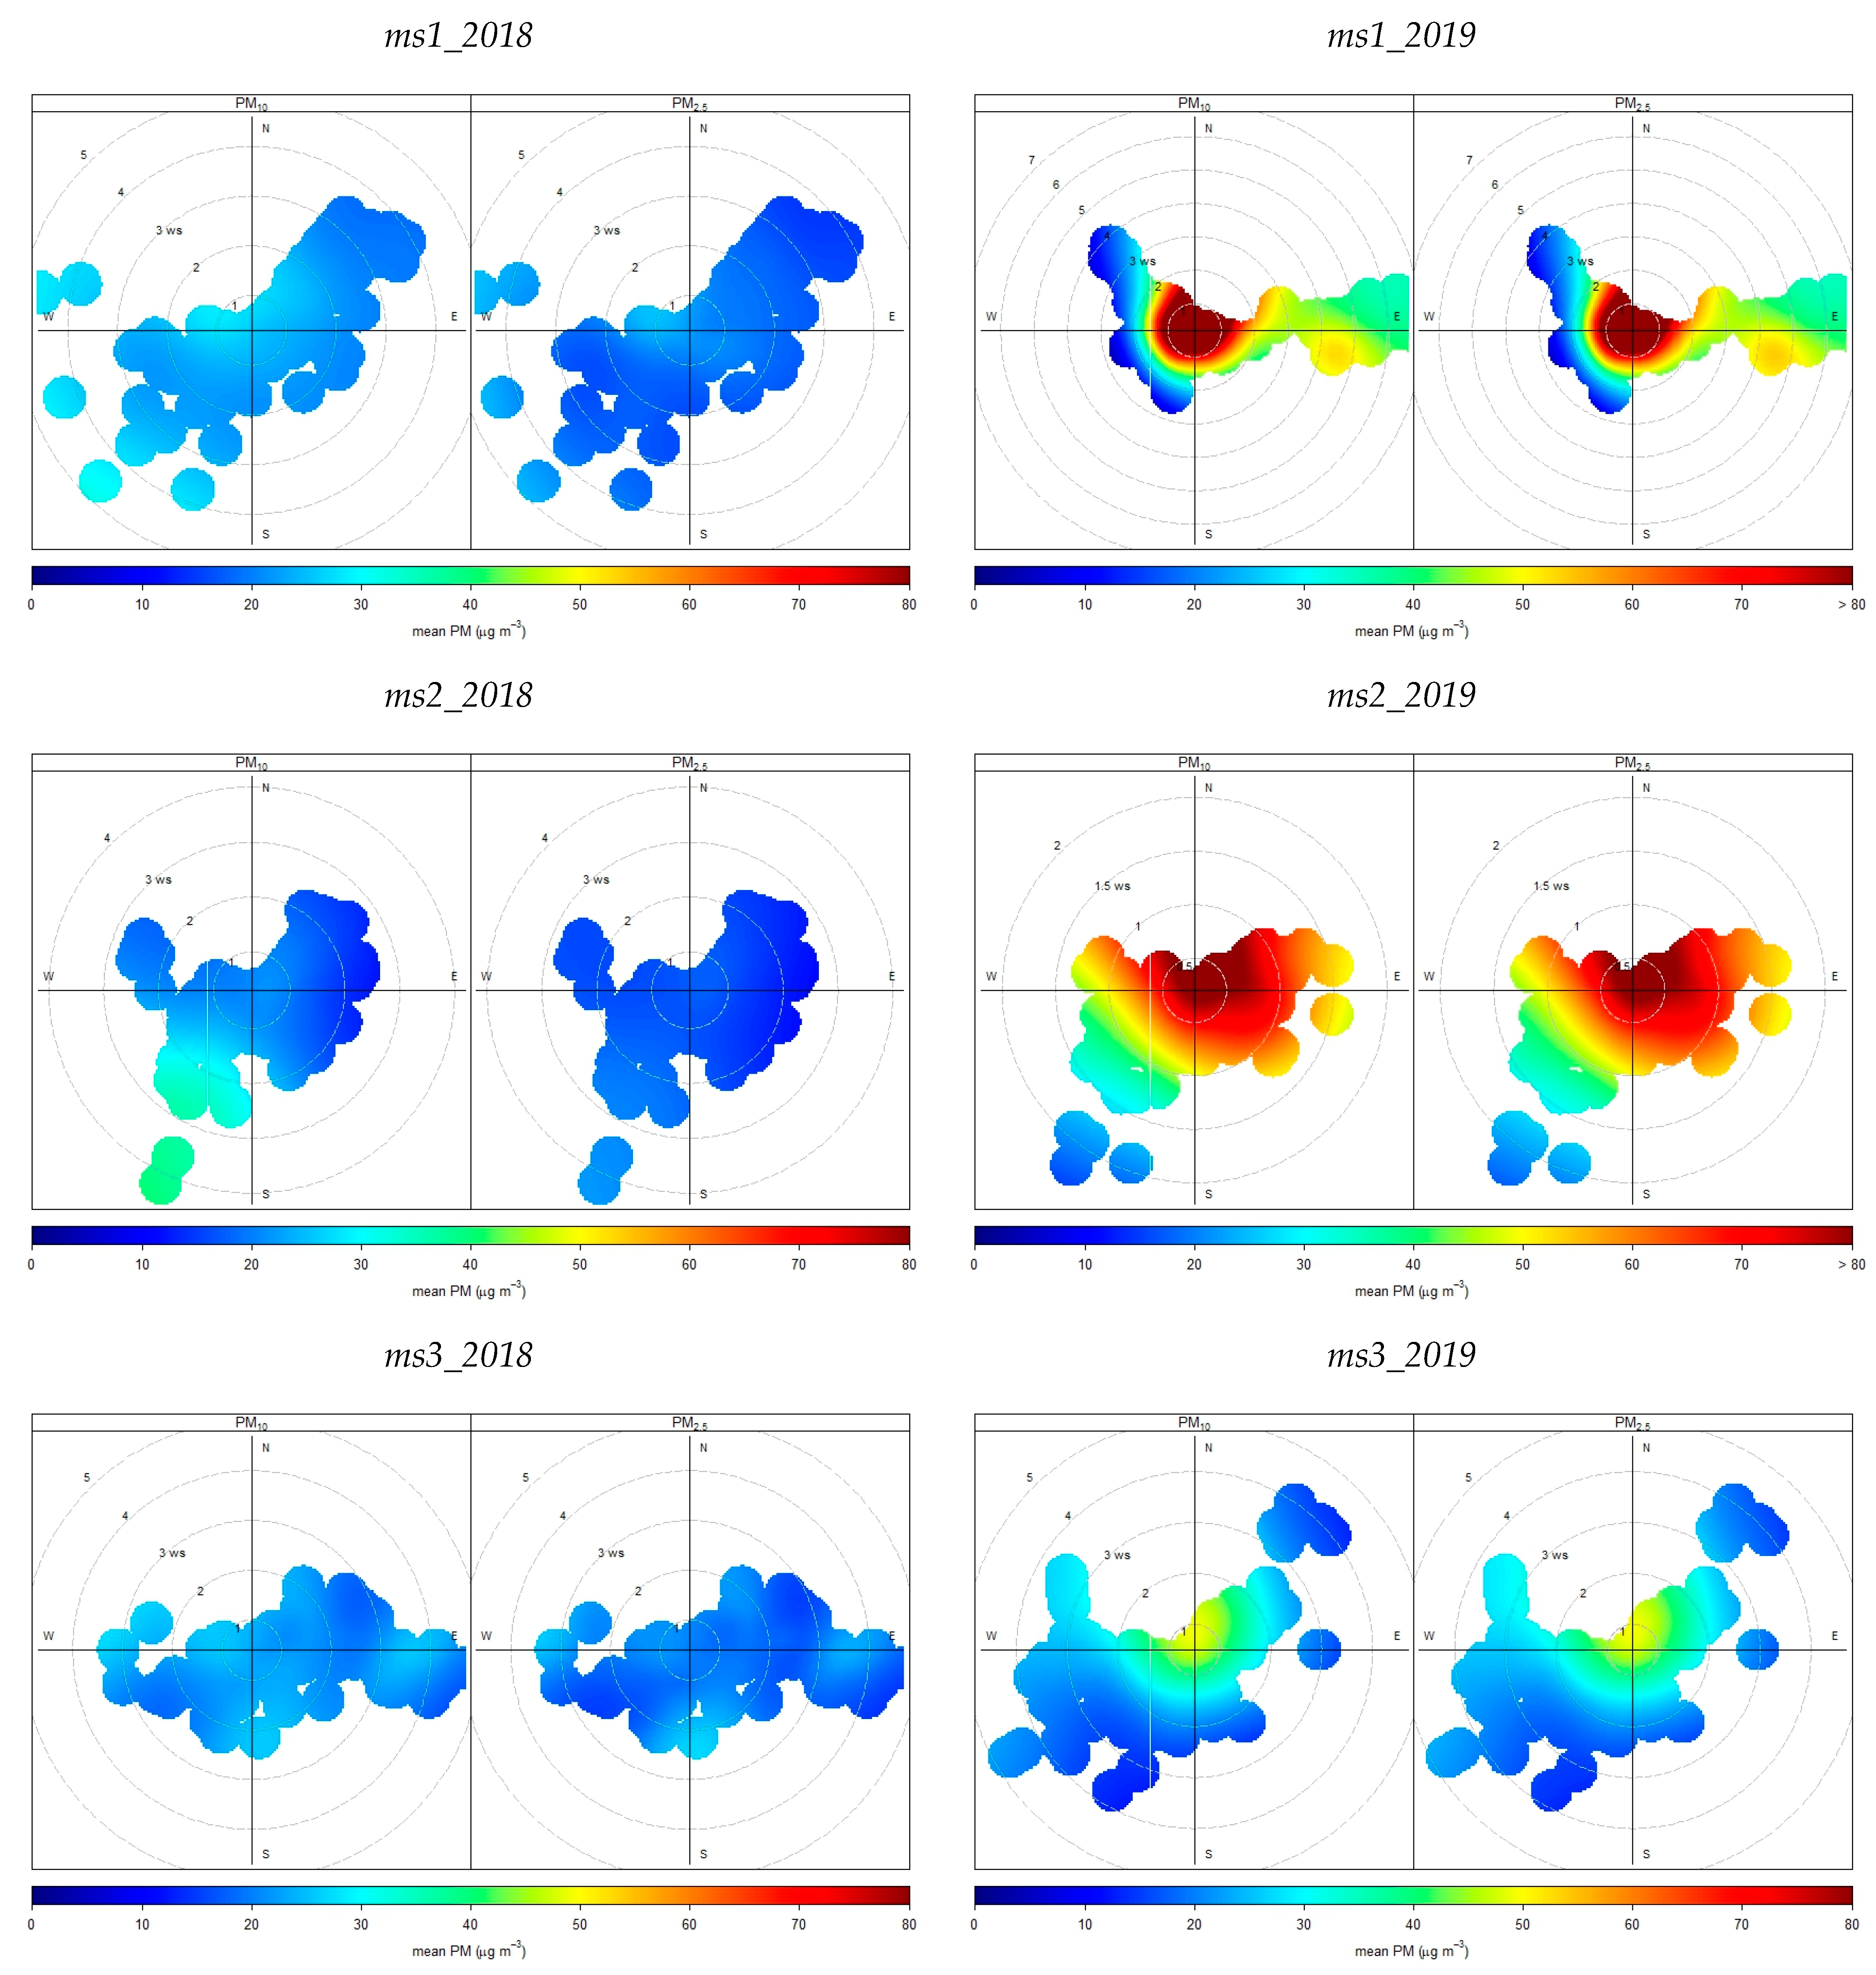
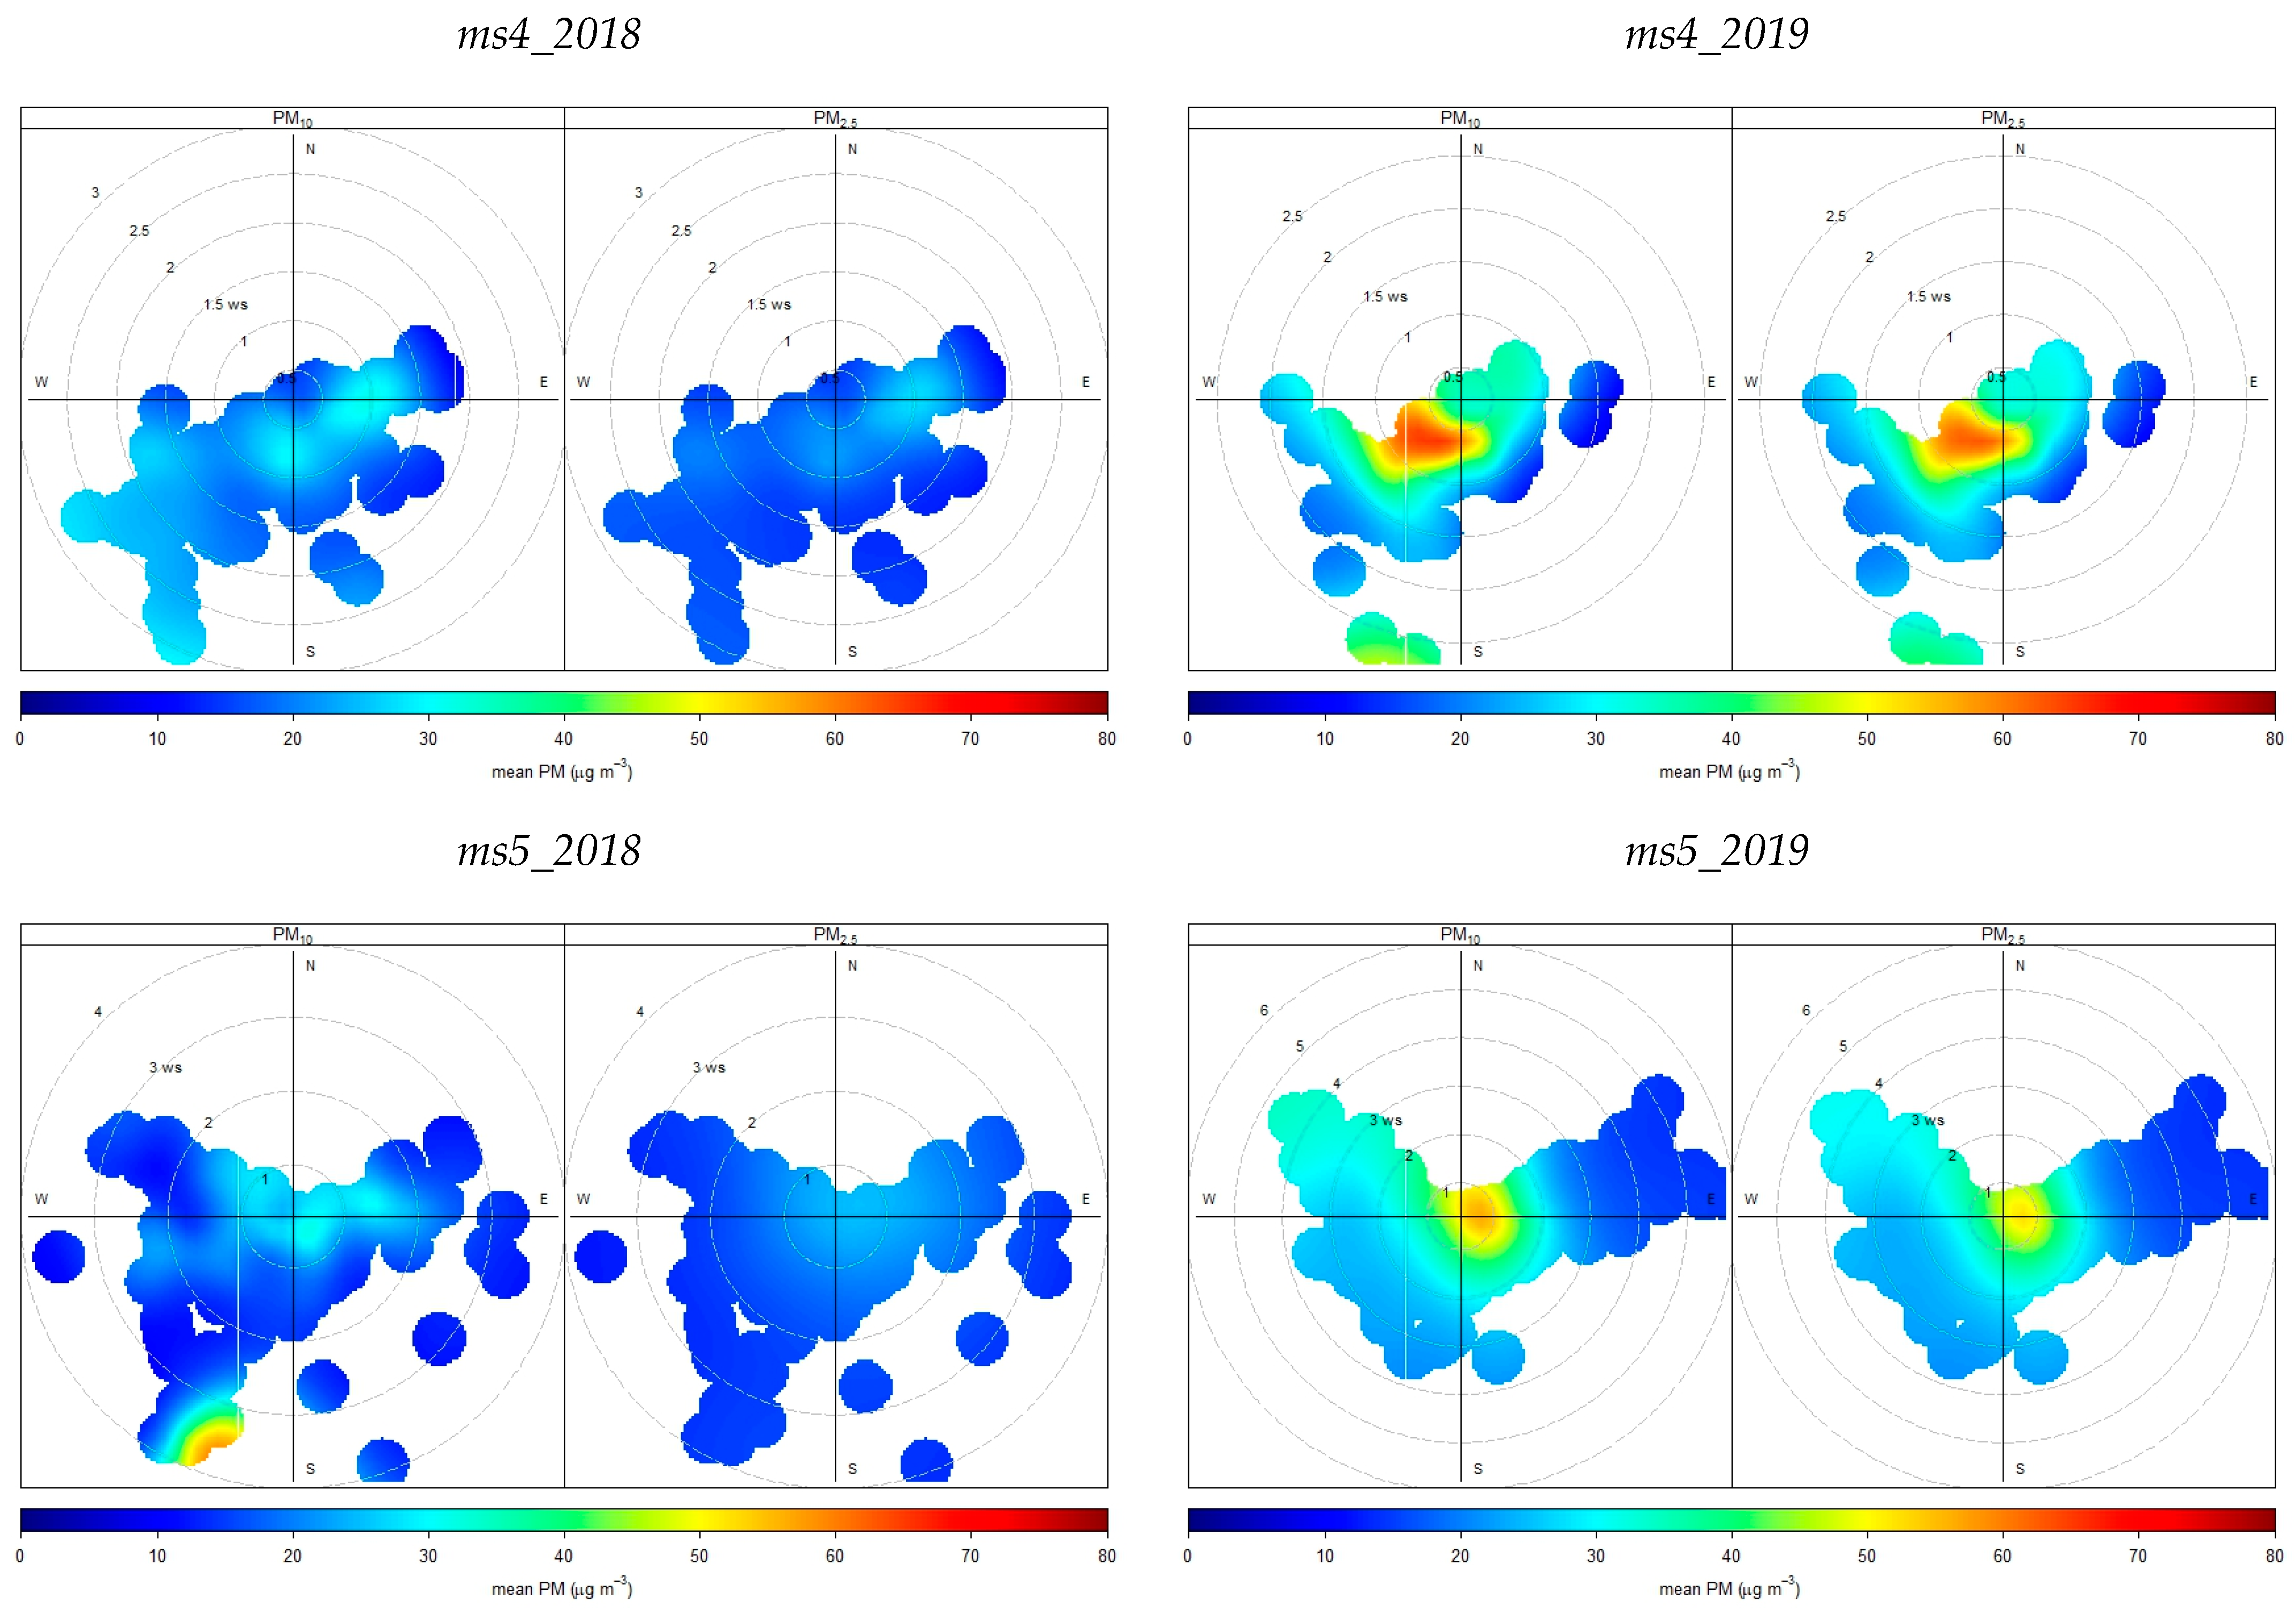
3.7. Polar Graphs of Particulate Pollution
Polar graphs are used to indicate the distribution of potential sources of PM and are present in Figure 17 for all measurement stations in the 2018 and 2019 seasons. As can be seen, concentrations are higher during the 2019 heating season and are more centralised around the measuring site than during the non-heating season 2018. High concentrations of particulate matter during the 2019 heating season are likely to be due to sources close to measuring stations and these concentrations are associated with lower wind speeds of up to 1.5 m/s. Higher PM10 concentrations during non-heating season are associated with higher wind speeds of 3–5 m/s; they are more differentiated in the space around the measuring station. The distribution of PM10 and PM2.5 concentrations around the measuring stations during the non-heating season (Figure 17: ms1_2018–ms5_2018) is slightly differentiated, which also results from the distribution of PM itself during this period (84% PM2.5 and 16% PM2.5–10 of the total PM10 fraction). During the heating season, PM2.5 makes up an even more significant part of PM10 (98%), which is also reflected in a very similar distribution of PM in the space around measuring stations (Figure 17: ms1_2019–ms5_2019).
During the non-heating season, we can observe predominantly higher concentrations of PM from the southwest direction. These concentrations are related to higher wind speeds, indicating the origin of PM from sources farther away from the measurement site. In the direction to the southwest, there are industrial parks and agricultural production in arable land. Better dispersion conditions (higher wind speed) were recorded during this period, and PM transport from this area was assumed to be predominant.
On the other hand, during the heating season, we observe high concentrations of PM in the vicinity of the measuring point. These concentrations are related to lower wind speeds. Lower wind speeds prevail during this period and define worsened dispersion conditions. It is more difficult to determine the predominant direction of high concentrations from polar plots made from concentrations measured during the heating season. In the case of MS1 and MS4, it could be estimated that this direction is northwest, and in the case of MS2, MS3, and MS5, it is more northeast. Since these concentrations are concentrated in the vicinity of the measuring site, i.e., dispersion conditions are not suitable, we assume their origin in the nearby development of family houses, which use the burning of wood and coal in fireplace. In the case of MS2, there is also road traffic in the northwest, north, and northeast directions, while this source also contributes to high PM concentrations through exhaust emissions of PM, non-exhaust emissions of PM, and secondary formation of PM from gaseous pollutants.
These estimates result from the very differences between these polar graphs and explain the origin of PM with respect to the distribution of the given environment and real conditions.
4. Conclusions
The level of air quality currently resonates very much in society. Extreme air pollution affects the environment and the inhabitants of settlement bodies more and more, especially in the winter months when, by combining sources of air pollution and secondary factors, the limit values of harmful substances designed to protect human and animal health are exceeded [47]. It is therefore appropriate to know more about this problem, i.e., what pollutants are critical, how high are the concentrations of pollutants, to what extent they can be harmful to humans, and what sources of air pollution are potential causes of harmful substances [48]. Then, based on a closer understanding of the status and origin of air pollution, we can determine measures to improve air quality.
Air quality measurements were carried out in the village of Sučany during the non-heating season in 2018 and during the heating season in 2019. Air quality measurements focused on PM10 and PM2.5 pollutants. During the measurements, meteorological parameters such as informative parameters temperature, humidity, pressure, wind speed, and wind direction were also monitored. Measurements were carried out at five measuring stations. The monitored pollutants and meteorological parameters were evaluated as 1-h data or 24-h average values or the average of values at the measuring station over the entire measuring period.
A total of 35 measuring days were realized during the non-heating season and 35 measuring days during the heating season. Exceedances of limit values were mainly recorded during the 2019 heating season for the pollutants PM10 and PM2.5. Out of a total of 35 measuring days (24-h concentrations of PM pollutants were evaluated), the limit value of 50 μg/m3 for PM10 was exceeded 13 times and the limit value of 25 μg/m3 for PM2.5 30 times during the heating season in 2019. The critical pollutants in terms of exceeding the limit values were therefore the particulate matter of the PM10 and PM2.5 fractions. The highest concentrations of particulate matter were recorded at the MS1 in the period 18/1–24/1/2019, where the maximum average 24-h PM10 concentrations of 146.45 μg/m3 and PM2.5 141.10 μg/m3 were measured.
The innovative aspects of the research were the long-term measurement of six locations in a village that has a unique geological location for both the non-heating and heating seasons. The value of the findings shows that there is a strong correlation between the heating season, the distribution of PM, and the wind directions. Possible directions for future research could include the measurement of multiple neighbouring cities over a longer range of time in order to evaluate the phenomenon of PM distribution over larger spaces. Additionally, it would be useful to evaluate the effectiveness of any mitigation action of reducing PM values during heating seasons.
Analysing the distribution of potential particulate matter sources showed foci of higher particulate concentrations associated with higher wind speeds and more scattered in space from measurements during the non-heating season—more distant sources of particulate matter. On the other hand, analysing the distribution of potential particulate sources during the 2019 heating season pointed to more concentrated foci of high particulate concentrations around measuring stations—more central sources of particulate matter. From the point of view of determining the potential origin of PM10 and PM2.5 pollutants, it can generally be stated that during the non-heating season, sources such as road transport, agriculture, and light industry predominate, and during the heating season local heating is added to these sources, which is more dominant.
Examining emissions from local heating of single-family houses is currently considered to be the least regulated emissions in our regions in accordance with the results of other works [49,50,51]. In order to counter the heating season, it is important for local/global policymakers to provide sufficient opportunities for citizens to adopt new heating technologies, educate the public and schools in its importance and financial benefits, and implement more preventive maintenance strategies in the district. The study carried out shows that this is why focusing on local heating as a source of air pollution is of great importance in current research. Even though local heating does not contribute as much to total emissions in a global sense as, for example, the metallurgical industry, transport, or production plants, it is essential to monitor every single source of pollution with equal attention. The same can be said for compliance with limit values for concentrations of pollutants (especially PM) produced into the atmosphere by local heating sources, as these can also influence the European objectives for carbon neutrality and air quality improvement [52]. The conducted study provided a picture of significant changes in the concentration of PM during the non-heating season and the heating season in the village of Sučany in the Slovak Republic, where local heating (burning wood, coal) in family houses is still and again dominating. Research in this area is essential to bring a picture of the not very desirable return of traditional heating with solid fuels. Evidence of the poor state of air quality caused by this method of heating can be a tool to convince residents and local governments to abandon these traditional methods of heating and introduce new ones that are friendly to the environment and health. In the future, the authors want to focus research on different inhabited areas of cities and point out the differences in the way households are heated. The aim will be to reveal the chemical fingerprint of the collected PM in parts of cities with different heating methods and to link them with the possible impact on human health. As a community of authors of the article, we believe that the current study will move forward in the following parts of the research and thus contribute to the overall reduction of emissions in the future.
Author Contributions
D.J.: conceptualization, investigation, writing—original draft, data curation; D.D.: data curation, conceptualization, validation; M.N.: formal analysis, conceptualization, resources; M.H.: writing—review and editing, funding acquisition, methodology. All authors have read and agreed to the published version of the manuscript.
Funding
This paper was supported by a VEGA 1/0337/22 grant entitled “Analysis of the influence of the pavement surface texture on skid friction, road safety, and the potential of road dust resuspension” and APVV-21-0452 “Impact of using small electrostatic precipitators to reduce particulate pollutants in domestic fuel combustion”.
Institutional Review Board Statement
Not applicable.
Informed Consent Statement
Not applicable.
Data Availability Statement
Data are available from a publicly accessible repository, to which the links are also included in the manuscript of the article.
Conflicts of Interest
The authors declare no conflicts of interest.
References
- Moreno-Ríos, A.L.; Tejeda-Benítez, L.P.; Bustillo-Lecompte, C.F. Sources, characteristics, toxicity, and control of ultrafine particles: An overview. Geosci. Front. 2022, 13, 101147. [Google Scholar] [CrossRef]
- Makkonen, U.; Vestenius, M.; Huy, L.N.; Anh, N.T.N.; Linh, P.T.V.; Thuy, P.T.; Phuong, H.T.M.; Nguyen, H.; Thuy, L.T.; Aurela, M.; et al. Chemical composition and potential sources of PM2.5 in Hanoi. Atmos. Environ. 2023, 299, 119650. [Google Scholar] [CrossRef]
- Bieliatynskyi, A.; Yang, S.; Pershakov, V.; Akmaldinova, O.; Krayushkina, K. Pollution of the roadside environment with dust from road surface repairs. Civ. Environ. Eng. 2022, 18, 715–725. [Google Scholar] [CrossRef]
- Bouh, H.A.; Bounakhla, M.; Benyaich, F.; Noack, Y.; Tahri, M.; Foudeil, S. Seasonal variation of mass concentration and chemical composition of PM2.5 and PM10, source identification and human health risk assessment in Meknes City in Morocco. Aerosol Sci. Eng. 2022, 7, 151–168. [Google Scholar] [CrossRef]
- Jandacka, D.; Durcanska, D.; Cibula, R. Concentration and inorganic elemental analysis of particulate matter in a road tunnel environment (žilina, Slovakia): Contribution of non-exhaust sources. Front. Environ. Sci. 2022, 10, 952577. [Google Scholar] [CrossRef]
- Jandacka, D.; Durcanska, D. Seasonal variation, chemical composition, and PMF-derived sources identification of traffic-related PM1, PM2.5, and PM2.5–10 in the air quality management region of žilina, Slovakia. Int. J. Environ. Res. Public Health 2021, 18, 10191. [Google Scholar] [CrossRef] [PubMed]
- EEA. Čo Sú Tuhé Častice a Aké Majú Účinky Na Zdravie Ľudí? Available online: https://www.eea.europa.eu/sk/help/casto-kladene-otazky/co-su-tuhe-castice-a (accessed on 7 March 2024).
- Casotti Rienda, I.; Alves, C.A.; Nunes, T.; Soares, M.; Amato, F.; Sánchez de la Campa, A.; Kováts, N.; Hubai, K.; Teke, G. PM10 resuspension of road dust in different types of parking lots: Emissions, chemical characterisation and ecotoxicity. Atmosphere 2023, 14, 305. [Google Scholar] [CrossRef]
- The Impact of Residential Heating and Cooking on Air Quality in Europe, the Impact of Residential Heating and Cooking on Air Quality in Europe, March 2022. Available online: http://epha.org/wp-content/uploads/2022/03/epha-position-paper-clean-heating.pdf (accessed on 9 March 2024).
- Houthuijs, D.; Breugelmans, O.; Hoek, G.; Vaskövi, E.; Miháliková, E.; Pastuszka, J.S.; Jirik, V.; Sachelarescu, S.; Lolova, D.; Meliefste, K.; et al. PM10 and PM2.5 concentrations in Central and Eastern Europe: Results from the Cesar study. Atmos. Environ. 2001, 35, 2757–2771. [Google Scholar] [CrossRef]
- Braniš, M.; Domasová, M.; Řezáčová, P. Particulate Air Pollution in a small settlement: The effect of local heating. Appl. Geochem. 2007, 22, 1255–1264. [Google Scholar] [CrossRef]
- Hassani, A.; Bykuć, S.; Schneider, P.; Zawadzki, P.; Chaja, P.; Castell, N. Low-cost sensors and machine learning aid in identifying environmental factors affecting particulate matter emitted by household heating. Atmos. Environ. 2023, 314, 120108. [Google Scholar] [CrossRef]
- Wang, J.; Wang, S.; Xu, X.; Li, X.; He, P.; Qiao, Y.; Chen, Y. The diminishing effects of winter heating on air quality in northern China. J. Environ. Manag. 2023, 325, 116536. [Google Scholar] [CrossRef] [PubMed]
- Koval, S.; Vytisk, J.; Ruzickova, J.; Raclavska, H.; Skrobankova, H.; Hellebrandova, L. The impact of solid fuel residential boilers exchange on Particulate Matter Air Pollution. Appl. Sci. 2021, 11, 5400. [Google Scholar] [CrossRef]
- Li, H.; You, S.; Zhang, H.; Zheng, W.; Zou, L. Analysis of the impacts of heating emissions on the environment and human health in North China. J. Clean. Prod. 2019, 207, 728–742. [Google Scholar] [CrossRef]
- Bodor, Z.; Bodor, K.; Keresztesi, Á.; Szép, R. Major air pollutants seasonal variation analysis and long-range transport of PM10 in an urban environment with specific climate condition in Transylvania (Romania). Environ. Sci. Pollut. Res. 2020, 27, 38181–38199. [Google Scholar] [CrossRef] [PubMed]
- Krecl, P.; Targino, A.C.; Lara, C.; Oukawa, G.Y.; Soares, J.; Mollinedo, E.M. Detecting local and regional air pollution from biomass burning at a suburban site. Atmos. Environ. 2023, 297, 119591. [Google Scholar] [CrossRef]
- Potočár, R. Drevo, Uhlie, Pelety a Brikety Používa 190-Tisíc Domácností. Shmú Zmapoval Vykurovanie. Available online: https://www.energie-portal.sk/Dokument/vykurovanie-domacnosti-paliva-drevo-uhlie-pelety-brikety-emisie-109934.aspx (accessed on 7 March 2024).
- Holubčík, M.; Jandačka, J. Produkcia Emisii. Available online: https://vytapeni.tzb-info.cz/vytapime-pevnymi-palivy/17230-produkcia-emisii-pri-spalovani-dreva-v-zavislosti-na-jeho-vlhkosti (accessed on 7 March 2024).
- Křůmal, K.; Mikuška, P.; Horák, J.; Hopan, F.; Kuboňová, L. Influence of boiler output and type on gaseous and particulate emissions from the combustion of coal for residential heating. Chemosphere 2021, 278, 130402. [Google Scholar] [CrossRef] [PubMed]
- Křůmal, K.; Mikuška, P.; Horák, J.; Jaroch, M.; Hopan, F.; Kuboňová, L. Gaseous and particulate emissions from the combustion of hard and soft wood for household heating: Influence of boiler type and heat output. Atmos. Pollut. Res. 2023, 14, 101801. [Google Scholar] [CrossRef]
- Alves, C.; Evtyugina, M.; Vicente, E.; Vicente, A.; Rienda, I.C.; de la Campa, A.S.; Tomé, M.; Duarte, I. PM2.5 chemical composition and health risks by inhalation near a chemical complex. J. Environ. Sci. 2023, 124, 860–874. [Google Scholar] [CrossRef]
- Poláčik, J.; Sitek, T.; Pospíšil, J.; Šnajdárek, L.; Lisý, M. Emission of fine particles from residential combustion of wood: Comparison of automatic boiler, Manual Log Feed Stove and Thermo-gravimetric analysis. J. Clean. Prod. 2021, 279, 1. [Google Scholar] [CrossRef]
- Tzbportal. Porovnanie Produkcie Znečisťujúcich Látok a SKLENÍKOVÉHO Plynu v Rodinnom Dome O Plyne. Available online: https://oplyne.info/porovnanie-produkcie-znecistujucich-latok-a-sklenikoveho-plynu-v-rodinnom-dome/ (accessed on 7 March 2024).
- Kaivosoja, T.; Jalava, P.I.; Lamberg, H.; Virén, A.; Tapanainen, M.; Torvela, T.; Tapper, U.; Sippula, O.; Tissari, J.; Hillamo, R.; et al. Comparison of emissions and toxicological properties of fine particles from wood and oil boilers in small (20–25 kW) and medium (5–10 MW) scale. Atmos. Environ. 2013, 77, 193–201. [Google Scholar] [CrossRef]
- Samoli, E.; Peng, R.; Ramsay, T.; Pipikou, M.; Touloumi, G.; Dominici, F.; Burnett, R.; Cohen, A.; Krewski, D.; Samet, J.; et al. Acute effects of ambient particulate matter on mortality in Europe and North America: Results from the APHENA study. Environ. Health Perspect. 2008, 116, 1480–1486. [Google Scholar] [CrossRef] [PubMed]
- WHO. Health Effects of Particulate Matter, 2013. Available online: https://unece.org/DAM/env/documents/2013/air/Health-effects-of-particulate-matter-final-Eng.pdf (accessed on 14 March 2024).
- Beelen, R.; Hoek, G.; van den Brandt, P.A.; Goldbohm, R.A.; Fischer, P.; Schouten, L.J.; Jerrett, M.; Hughes, E.; Armstrong, B.; Brunekreef, B. Long-term effects of traffic-related air pollution on mortality in a Dutch cohort (NLCS-Air Study). Environ. Health Perspect. 2008, 116, 196–202. [Google Scholar] [CrossRef] [PubMed]
- Krewski, D.; Jerrett, M.; Burnett, R.T. Extended Follow-Up and Spatial Analysis of the American Cancer Society Linking Particulate Air Pollution and Mortality; Research Report; Health Effects Institute: Boston, MA, USA, 2009; Volume 140. [Google Scholar]
- Pope, C.A., III. Lung cancer, cardiopulmonary mortality, and long-term exposure to Fine Particulate Air Pollution. JAMA 2002, 287, 1132. [Google Scholar] [CrossRef] [PubMed]
- WWF. Environmental Assessment Report for the Lokichar Oil Fields in Turkana County and Lamu Marine Crude Oil Terminal. Available online: https://wwfke.awsassets.panda.org/downloads/environmental_baseline_assessment_in_lokichar_and_lamu_marine_terminal.pdf (accessed on 7 March 2024).
- Schraufnagel, D.E. The health effects of ultrafine particles. Exp. Mol. Med. 2020, 52, 311–317. [Google Scholar] [CrossRef] [PubMed]
- Ohlwein, S.; Kappeler, R.; Kutlar Joss, M.; Künzli, N.; Hoffmann, B. Health effects of ultrafine particles: A systematic literature review update of epidemiological evidence. Int. J. Public Health 2019, 64, 547–559. [Google Scholar] [CrossRef] [PubMed]
- WHO. Air Quality Guidelines Global Update. Available online: https://www.who.int/publications/i/item/WHO-SDE-PHE-OEH-06.02 (accessed on 7 March 2024).
- Zhu, M.; Han, J.; Wang, F.; Shao, W.; Xiong, R.; Zhang, Q.; Pan, H.; Yang, Y.; Samal, S.K.; Zhang, F.; et al. Electrospun nanofibers membranes for effective air filtration. Macromol. Mater. Eng. 2016, 302, 1600353. [Google Scholar] [CrossRef]
- Odat, S.; Abu-Allaban, M.; AL-Trawneh, B. Study on the impact of weather on air quality at Aqaba. Nat. Environ. Pollut. Technol. 2018, 17, 359–366. [Google Scholar]
- ISO 10473:2000; Ambient Air. Measurement of the Mass of Particulate Matter on a Filtrer Madium. Beta-Ray Absorption Method. International Organization for Standardization, ISO Central Secretariat: Geneva, Switzerland, 2000.
- Carslaw, D.C.; Beevers, S.D.; Ropkins, K.; Bell, M.C. Detecting and quantifying aircraft and other on-airport contributions to ambient nitrogen oxides in the vicinity of a large international airport. Atmos. Environ. 2006, 40, 5424–5434. [Google Scholar] [CrossRef]
- Carslaw, D.C.; Ropkins, K. openair—An R package for air quality data analysis. Environ. Model. Softw. 2012, 27–28, 52–61. [Google Scholar] [CrossRef]
- Platt, S.M.; El Haddad, I.; Pieber, S.M.; Zardini, A.A.; Suarez-Bertoa, R.; Clairotte, M.; Daellenbach, K.R.; Huang, R.-J.; Slowik, J.G.; Hellebust, S.; et al. Gasoline cars produce more carbonaceous particulate matter than modern filter-equipped diesel cars. Sci. Rep. 2017, 7, 4926. [Google Scholar] [CrossRef]
- Tiwari, S.; Bisht, D.S.; Srivastava, A.K.; Pipal, A.S.; Taneja, A.; Srivastava, M.K.; Attri, S.D. Variability in atmospheric particulates and meteorological effects on their mass concentrations over Delhi, India. Atmos. Res. 2014, 145–146, 45–56. [Google Scholar] [CrossRef]
- Pio, C.A.; Cardoso, J.G.; Cerqueira, M.A.; Calvo, A.; Nunes, T.V.; Alves, C.A.; Custódio, D.; Almeida, S.M.; Almeida-Silva, M. Seasonal variability of aerosol concentration and size distribution in cape verde using a continuous aerosol optical spectrometer. Front. Environ. Sci. 2014, 2, 15. [Google Scholar] [CrossRef]
- Chan, L.Y.; Kwok, W.S. Roadside suspended particulates at heavily trafficked urban sites of Hong Kong—Seasonal variation and dependence on meteorological conditions. Atmos. Environ. 2001, 35, 3177–3182. [Google Scholar] [CrossRef]
- Batterman, S.; Ganguly, R.; Harbin, P. High resolution spatial and temporal mapping of traffic-related air pollutants. Int. J. Environ. Res. Public Health 2015, 12, 3646–3666. [Google Scholar] [CrossRef] [PubMed]
- Bamola, S.; Goswami, G.; Dewan, S.; Goyal, I.; Agarwal, M.; Dhir, A.; Lakhani, A. Characterising temporal variability of PM2.5/PM10 ratio and its correlation with meteorological variables at a sub-urban site in the Taj City. Urban Clim. 2024, 53, 101763. [Google Scholar] [CrossRef]
- Wu, Z.; Hu, T.; Hu, W.; Shao, L.; Sun, Y.; Xue, F.; Niu, H. Evolution in physicochemical properties of fine particles emitted from residential coal combustion based on Chamber Experiment. Gondwana Res. 2022, 110, 252–263. [Google Scholar] [CrossRef]
- SHMÚ. Limitné Hodnoty Pre Hodnotenie Kvality Ovzdušia. Available online: https://www.shmu.sk/sk/?page=2657 (accessed on 7 March 2024).
- EurLEX. Smernica—2009/125—en—EUR-lex. Available online: https://eur-lex.europa.eu/legal-content/SK/ALL/?uri=CELEX%3A32009L0125 (accessed on 7 March 2024).
- Holubčík, M.; Čajová Kantová, N.; Jandačka, J.; Čaja, A. The Performance and Emission Parameters Based on the Redistribution of the Amount of Combustion Air of the Wood Stove. Processes 2022, 10, 1570. [Google Scholar] [CrossRef]
- Gregorovičová, E.; Pospíšil, J.; Sitek, T. The Bulk Density and Cohesion of Submicron Particles Emitted by a Residential Boiler When Burning Solid Fuels. Fire 2023, 6, 445. [Google Scholar] [CrossRef]
- Latosińska J, Gawdzik J, Honus S, Orman ŁJ and Radek N Waste for building material production as a method of reducing environmental load and energy recovery. Front. Energy Res. 2023, 11, 1279337. [CrossRef]
- European Commision. Climate Strategies & Targets. Available online: https://climate.ec.europa.eu/eu-action/climate-strategies-targets_en (accessed on 7 March 2024).
Figure 1.
Effect of humidity and proper fuel storage on equipment performance and efficiency [19].
Figure 1.
Effect of humidity and proper fuel storage on equipment performance and efficiency [19].

Figure 2.
Location of measuring stations in the village of Sučany on the map (map source: Google maps).
Figure 2.
Location of measuring stations in the village of Sučany on the map (map source: Google maps).

Figure 3.
Average concentrations of PM10 and PM2.5 detected in the village of Sučany at measuring stations MS1–MS5 during the non-heating season.
Figure 3.
Average concentrations of PM10 and PM2.5 detected in the village of Sučany at measuring stations MS1–MS5 during the non-heating season.

Figure 4.
Average data of meteorological parameters detected in the village of Sučany at measuring stations MS1–MS5 during the non-heating season.
Figure 4.
Average data of meteorological parameters detected in the village of Sučany at measuring stations MS1–MS5 during the non-heating season.

Figure 5.
Total distribution of PM detected in the village of Sučany during the non-heating season.

Figure 6.
Average concentrations of PM10 and PM2.5 detected in the village of Sučany at measuring stations MS1–MS5 during the heating season.
Figure 6.
Average concentrations of PM10 and PM2.5 detected in the village of Sučany at measuring stations MS1–MS5 during the heating season.

Figure 7.
Average data of meteorological parameters detected in the village of Sučany at measuring stations MS1–MS5 during the heating season.
Figure 7.
Average data of meteorological parameters detected in the village of Sučany at measuring stations MS1–MS5 during the heating season.

Figure 8.
Total distribution of PM detected in the village of Sučany during the heating season.

Figure 9.
Difference of mean PM concentrations of central and eastern European countries with respect to study data.
Figure 9.
Difference of mean PM concentrations of central and eastern European countries with respect to study data.

Figure 10.
Dependence of PM10 on air temperature measured in the municipality of Sučany in 2018 and 2019.
Figure 10.
Dependence of PM10 on air temperature measured in the municipality of Sučany in 2018 and 2019.

Figure 11.
Dependence of PM2.5 on air temperature measured in the municipality of Sučany in 2018 and 2019.
Figure 11.
Dependence of PM2.5 on air temperature measured in the municipality of Sučany in 2018 and 2019.

Figure 12.
Pollution Rose of PM10 pollutants at various measuring stations during the heating and non-heating season in 2018 and 2019 in the village of Sučany.
Figure 12.
Pollution Rose of PM10 pollutants at various measuring stations during the heating and non-heating season in 2018 and 2019 in the village of Sučany.

Figure 13.
Pollution Rose of PM2.5 pollutants at various measuring stations during the heating and non-heating season in 2018 and 2019 in the municipality of Sučany.
Figure 13.
Pollution Rose of PM2.5 pollutants at various measuring stations during the heating and non-heating season in 2018 and 2019 in the municipality of Sučany.

Figure 14.
Time variation of normalised PM10 and PM2.5 concentration values during the non-heating season in 2018 in Sučany.
Figure 14.
Time variation of normalised PM10 and PM2.5 concentration values during the non-heating season in 2018 in Sučany.

Figure 15.
Time variation of normalised PM10 and PM2.5 values during the 2019 heating season in the village of Sučany.
Figure 15.
Time variation of normalised PM10 and PM2.5 values during the 2019 heating season in the village of Sučany.

Figure 16.
Traffic volume on the first-class road I/18 during air pollution measurements in the municipality of Sučany in 2019.
Figure 16.
Traffic volume on the first-class road I/18 during air pollution measurements in the municipality of Sučany in 2019.

Figure 17.
Polar graphs for PM10 and PM2.5 pollutants at different measuring stations outside and during the heating season in 2018 and 2019 in the municipality of Sučany.
Figure 17.
Polar graphs for PM10 and PM2.5 pollutants at different measuring stations outside and during the heating season in 2018 and 2019 in the municipality of Sučany.


Table 1.
Review of the health impact of increased concentrations of pollutants.
| Pollutant | Exposure Time | Health Impact |
|---|---|---|
| PM | Long-term | Bronchitis, cardiovascular diseases |
| SO2 | Short-term | High blood pressure, impaired lung function |
| NO2 | Long-term | High blood pressure |
| VOC | Short-term | Skin irritation, respiratory tract, death (>100 ppm) |
Table 2.
Information on the monitoring period and measurement locations.
| Location | Location of Monitoring Station | Monitoring Period |
|---|---|---|
| MS1 | SNP Square (49°05′57.7″ N, 18°59′30.8″ E) | 14/08–20/08/2018 |
| MS2 | Hlavná street (49°05′51.1″ N, 18°59′08.7″) | 22/08–28/08/2018 |
| MS3 | Vážska street (49°06′33.3″ N, 19°00′02.0″ E) | 04/09–10/09/2018 |
| MS4 | Pod Breziny street (49°05′45.9″ N 19°00′14.7″ E) | 12/09–18/09/2018 |
| MS5 | Sládkovičova street (49°06′08.5″ N 18°58′57.7″ E) | 22/09–28/09/2018 |
Table 3.
Average concentrations of pollutants and meteorological data values during air quality measurements outside and during the heating season in 2019 in the municipality of Sučany.
Table 3.
Average concentrations of pollutants and meteorological data values during air quality measurements outside and during the heating season in 2019 in the municipality of Sučany.
| Measuring Period | Measurement Station | Parameters | ||||||
|---|---|---|---|---|---|---|---|---|
| PM10 [μg/m3] | PM2.5 [µg/m3] | Temp. [°C] | Humidity [%] | Pressure [hPa] | Wind Speed [m/s] | Wind Direction [°] | ||
| 2018 | MS 1 | 24.11 | 19.63 | 21.4 | 63.2 | 972.0 | 1.6 | 127 |
| MS 2 | 21.60 | 16.60 | 18.1 | 71.4 | 970.3 | 1.2 | 151 | |
| MS 3 | 22.52 | 19.40 | 16.7 | 73.9 | 969.6 | 1.6 | 127 | |
| MS 4 | 23.19 | 19.32 | 16.6 | 71.1 | 975.1 | 0.8 | 161 | |
| MS 5 | 23.77 | 21.29 | 9.1 | 74.0 | 979.7 | 1.4 | 183 | |
| Average over the measuring period | 23.04 | 19.25 | 16.4 | 70.7 | 973.3 | 1.3 | 150 | |
| 2019 | MS 1 | 88.08 | 86.37 | −6.2 | 81.1 | 967.5 | 1.8 | 203 |
| MS 2 | 70.33 | 69.94 | −2.6 | 91.5 | 958.4 | 0.7 | 147 | |
| MS 3 | 34.22 | 34.82 | −0.1 | 80.2 | 969.9 | 1.8 | 170 | |
| MS 4 | 39.56 | 38.49 | 1.5 | 80.5 | 979.8 | 0.7 | 159 | |
| MS 5 | 37.18 | 34.55 | 2.7 | 60.3 | 982.5 | 2.0 | 154 | |
| Average over the measuring period | 53.87 | 52.83 | −0.9 | 78.7 | 971.6 | 1.4 | 167 | |
Disclaimer/Publisher’s Note: The statements, opinions and data contained in all publications are solely those of the individual author(s) and contributor(s) and not of MDPI and/or the editor(s). MDPI and/or the editor(s) disclaim responsibility for any injury to people or property resulting from any ideas, methods, instructions or products referred to in the content. |
© 2024 by the authors. Licensee MDPI, Basel, Switzerland. This article is an open access article distributed under the terms and conditions of the Creative Commons Attribution (CC BY) license (https://creativecommons.org/licenses/by/4.0/).
Share and Cite
MDPI and ACS Style
Jandacka, D.; Durcanska, D.; Nicolanska, M.; Holubcik, M. Impact of Seasonal Heating on PM10 and PM2.5 Concentrations in Sučany, Slovakia: A Temporal and Spatial Analysis. Fire 2024, 7, 150. https://doi.org/10.3390/fire7040150
AMA Style
Jandacka D, Durcanska D, Nicolanska M, Holubcik M. Impact of Seasonal Heating on PM10 and PM2.5 Concentrations in Sučany, Slovakia: A Temporal and Spatial Analysis. Fire. 2024; 7(4):150. https://doi.org/10.3390/fire7040150
Chicago/Turabian StyleJandacka, Dusan, Daniela Durcanska, Miriam Nicolanska, and Michal Holubcik. 2024. "Impact of Seasonal Heating on PM10 and PM2.5 Concentrations in Sučany, Slovakia: A Temporal and Spatial Analysis" Fire 7, no. 4: 150. https://doi.org/10.3390/fire7040150